


 , Li Jiang 1,†, Jiacheng Chen 2, Sicong Xu 1, Ping Zhang 1, Yili Yi 1, Yangzhi Xie 1,*
 , Yongjun Chen 1,*
1 Department of Neurology, The Affiliated Nanhua Hospital, Hengyang Medical School, University of South China, 421001 Hengyang, Hunan, China
2 Department of Intensive Care Unit, The Affiliated Nanhua Hospital, Hengyang Medical School, University of South China, 421001 Hengyang, Hunan, China
†These authors contributed equally.
Abstract
The metabolites derived from judicious dietary choices play a crucial role in the management and treatment of depression. Hydroxy-carboxylic acid receptor 2 (HCAR2) functions as a receptor for various diet-derived metabolites. Although a growing body of evidence indicates these metabolites exert beneficial effects on depression, the precise mechanisms underlying these benefits require further investigation.
We established a mouse model of corticosterone (Cor)-induced depression to evaluate the therapeutic potential of HCAR2 activation on depression. A series of behavioral experiments were conducted to investigate whether HCAR2 activation could alleviate depressive-like behaviors in mice. The neuroprotective effects of HCAR2 in the hippocampus were examined using Nissl and hematoxylin-eosin (HE) staining. The levels of monoamine neurotransmitters in mouse serum were quantified, as well as the cell viability and lactate dehydrogenase (LDH) activity of hippocampal neurons co-cultured with primary microglia. Microglia-associated neuroinflammation was evaluated by quantifying pro-inflammatory cytokines using ELISA, and by assessing the polarization state of M1 microglia, including the mRNA expression levels of M1 markers and double fluorescence staining for inducible nitric oxide synthase/ionized calcium-binding adapter molecule 1 (iNOS/Iba1). The expression level of proteins in the protein kinase B-inhibitor of nuclear factor kappa-B kinase subunits alpha and beta-nuclear factor kappa-light-chain-enhancer of activated B cells (AKT-IKKαβ-NFκB) pathway in primary microglia was analyzed using western blot. Transcriptomic changes in microglia induced by HCAR2 activation were examined through RNA sequencing. Mice were fed PLX5622 chow to deplete microglia in vivo.
Activation of HCAR2 by its agonist MK-6892 in a Cor-induced model of depression significantly alleviated depressive-like behaviors, attenuated hippocampal neuronal injury, increased serum monoamine levels, reduced microglia-associated neuroinflammation, and inhibited the expression of proteins in the AKT-IKKαβ-NFκB pathway in primary microglia. Additionally, HCAR2 activation markedly enhanced hippocampal neuronal viability and decreased LDH activity in this co-culture system. Importantly, these protective effects were abolished in HCAR2 knockout mice. RNA sequencing revealed that HCAR2 activation induced changes in multiple signaling pathways. Moreover, the depletion of microglia also eliminated the protective effects of MK-6892.
Activation of HCAR2 can reduce depressive-like behaviors, neuronal injury, and neuroinflammation. Our findings suggest these neuroprotective effects are, at least in part, mediated through modulation of microglial activity by HCAR2.
Keywords
- depression
- HCAR2
- microglia
- neuroinflammation
Major depressive disorder (MDD) is a psychiatric condition characterized by pervasive and persistent feelings of sadness, anhedonia, and diminished interest in activities that were previously pleasurable [1]. The etiology of MDD remains largely unclear. Furthermore, depression represents a highly heterogeneous diagnostic category. Despite the well-documented efficacy of antidepressants, approximately 20% to 30% of patients with clinical depression show either no response, or suboptimal outcomes after receiving standard antidepressant treatment [2]. Therefore, the development of alternative therapeutic approaches for the treatment of depression is a major imperative. Numerous studies have demonstrated that metabolites generated from prudent dietary selections can exert beneficial effects on individuals suffering from depression [3, 4]. For instance, it has been shown that fish rich in omega-3 fatty acids, dairy products and shiitake mushrooms containing high tryptophan and tyrosine levels, and animal liver and egg yolks with abundant vitamins D and B can serve as effective adjuncts in the clinical treatment of depression. Hydroxy-carboxylic acid receptor 2 (HCAR2) is a G-protein-coupled receptor that can be activated by beta-hydroxybutyric acid, butyrate, and niacin [5]. These metabolites have demonstrated a substantial capacity to attenuate the progression of depression [6, 7, 8], suggesting that HCAR2 may serve as a promising therapeutic target for the treatment of this condition. However, the precise mechanism through which HCAR2 exerts its antidepressant effects remains to be elucidated.
Microglia function as the primary immune cells in the central nervous system (CNS). They are responsible for surveilling the local environment and executing diverse roles, including phagocytosis of cellular debris, promotion of neurogenesis, synaptic pruning, and secretion of cytokines and chemokines [9]. Previous autopsy study has shown that expression levels of inflammatory factors in the brains of patients with depression were significantly elevated compared to the control group [10]. Additionally, a marked increase in the mRNA expression level of Toll-like receptor 3 (TLR3), Toll-like receptor 4 (TLR4), and Toll-like receptor 7 (TLR7) was observed specifically within the prefrontal cortex (PFC) [11]. This finding suggests that patients with MDD have elevated microglial density and activation. Inhibition of microglial inflammatory signaling has been demonstrated to improve treatment outcomes in MDD. Minocycline is an anti-inflammatory antibiotic that effectively suppresses inflammatory activation in microglia and exhibits antidepressant properties in MDD patients and in a rodent model of depression [12, 13]. The overactivation of microglia is intricately linked to neuronal impairment in the pathology of MDD. Consequently, the modulation of microglial inflammation represents a promising therapeutic strategy for managing depression.
The aim of this study was therefore to investigate the role of HCAR2 in a rodent model of depression. We hypothesize that the therapeutic potential of HCAR2 may be associated with its ability to modulate microglial activity.
All animal experiments were conducted in strict compliance with the guidelines for laboratory animal care and utilization established by the National Institutes of Health. Wild-type (WT) and HCAR2 knockout (KO) C57BL/6 mice (6–8 weeks old, strain NO. T006705) were purchased from Gempharmatech (Nanjing, Jiangsu, China) and housed under standard laboratory conditions. They were given ad libitum access to water and food and maintained on a 12-h light/12-h dark cycle. Mice were intraperitoneally administered with a daily dose of corticosterone (Cor, 20 mg/kg, 50-22-6, Aladdin, Shanghai, China) for a continuous three-week period to establish a rodent model of depression. To evaluate the therapeutic effects of HCAR2 activation in this model, mice were then randomly assigned to one of four groups for a two-week treatment period: a control group (administered saline), a Cor group, an HCAR2 agonist (MK-6892, HY-10680, MedChemExpress, Monmouth Junction, NJ, USA) group, and a combined Cor+MK-6892 group (Fig. 1A). To investigate whether the antidepressant and neuroprotective effects of HCAR2 activation were mediated through its action on microglia, mice were administered PLX5622 chow (PLX, HY-114153, Monmouth Junction, NJ, USA) throughout the experimental period to deplete microglia in vivo. AIN-76A chow (Shanghai Yubo Bio-technology Co., Ltd.02960097-CF, Shanghai, China) served as the vehicle (Veh) control in this study. Mice were randomly assigned to one of three groups: Cor+MK-6892, Cor+Veh+MK-6892, or Cor+PLX+MK-6892 (Fig. 1B). Behavioral tests were conducted within one week following the completion of drug treatment. The mice were then anesthetized with a mixture of xylazine (7361-61-7; Merck, Rahway, NJ, USA; 10 mg/kg, i.p.) and ketamine (H20023609; Jiuxu Pharmaceutical Co., Ltd., Jinhua, Zhejiang, China; 90 mg/kg, i.p.), after which samples were collected for subsequent analyses. In particular, a volume of 2 µL of MK-6892 (100 mg/kg) or saline was administered via intracerebroventricular infusion. Mice were euthanized using gradual CO2 inhalation. CO2 was introduced into a transparent chamber at a flow rate displacing 20% of the chamber volume per minute until the final CO2 concentration exceeded 70%. After confirming respiratory arrest, this concentration was maintained for an additional 5 minutes to ensure death.
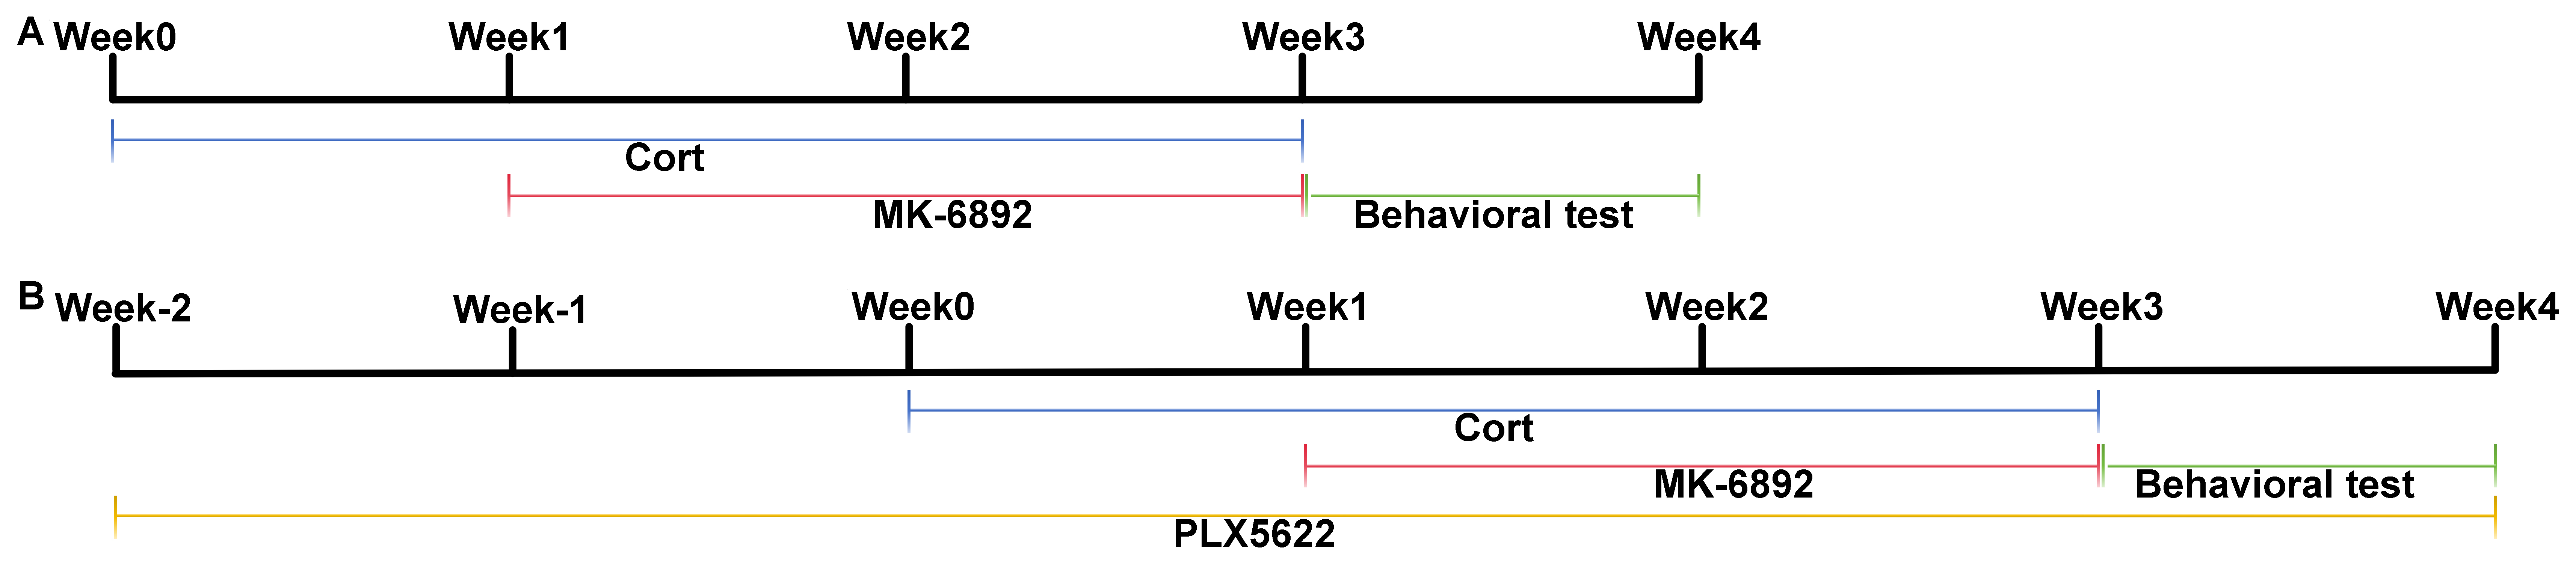 Fig. 1.
Experimental timeline utilized in this study. (A) Timeline for assessing the therapeutic effects of HCAR2 activation in a murine model of depression. (B) Timeline for assessing the therapeutic effects of HCAR2 activation following microglia depletion in a murine model of depression. HCAR2, hydroxy-carboxylic acid receptor 2.
The mice underwent a battery of behavioral tests designed specifically to
evaluate depression-like behaviors. For the tail suspension test, the tail was
gently secured to the tail hanger, ensuring the animal’s head was positioned
downward, with a distance of approximately 30 cm maintained from the bottom of
the hanger. Following the adaptation period, the duration of immobility was
measured during a 4-minute interval. For the forced swimming test, the water
temperature in the test chamber was adjusted to a range of 23–25 °C prior to
commencing the experiment. Mice were acclimatized to swimming one day before the
experiment. At 24 h after the acclimatization period, the length of time of
immobility was recorded over a period of 5-minute duration. For the sucrose
preference test, mice were first acclimatized to sucrose water over a 24-h
adaptation period. Specifically, each rat was provided with two bottles: one
containing 1% sucrose solution (wt/vol) and the other containing purified water.
The bottles were randomly positioned on either the right or left side of each
cage. To control for position bias, the position of each bottle was switched
after 12 h. The sucrose preference test was conducted after this adaptation
period. Following baseline measurements, the mice underwent a 24-h period of food
and water deprivation. Thereafter, they were promptly subjected to a 12-h sugar
preference test. For the open field test, mice were placed in a square arena
measuring 1
The sample was fixed in a solution of 95% ethanol and ice-cold acetone for 20 minutes, and subsequently rinsed twice with phosphate-buffered saline (PBS) to remove residual fixative. The samples were then stained with hematoxylin solution for 2–3 minutes to visualize the nuclei, followed by thorough rinsing with deionized water to ensure complete removal of excess stain. Next, the samples were immersed in eosin solution for 1 minute to stain the cytoplasm, followed by rinsing with deionized water. After air drying, the coverslips were mounted using neutral mounting medium. Observations and photographic documentation were performed 24 h later using an inverted laser confocal microscope (FV1200MPE-share, Olympus, Tokyo, Japan).
Fresh tissues were fixed in 10% neutral buffered formalin for 48 h, followed by routine dehydration and embedding procedures. The tissues were sectioned into 6–8 µm thick slices, dewaxed, and rinsed multiple times with distilled water. Sections were then immersed in toluidine blue solution and incubated in a thermostat (FP89-HL, Julabo, Seelbach, Germany) maintained at 50–60 °C for 25–50 minutes to ensure optimal staining. After rinsing with distilled water, sections underwent a stepwise dehydration process using ethanol. Xylene was subsequently used for clarification, and the specimens mounted using a neutral mounting medium.
ELISA was used to quantify the serum concentrations of 5-hydroxytryptamine
(5-HT, EEL006, Invitrogen, Carlsbad, CA, USA) and noradrenaline (NA, EEL010,
Invitrogen, Carlsbad, CA, USA) as recommended by the manufacturer of the
commercially available kits. ELISA was also used to measure the concentrations of
interleukin-1
Primary microglial cells were isolated using a discontinuous Percoll density
gradient centrifugation method as described previously [14]. Briefly, the skull
was carefully removed to extract brain tissue, which was then mechanically
dissociated. To this homogenate was added 10 mL of sterile 1
The CCK8 assay was utilized to evaluate cell viability. Primary hippocampal neurons were seeded into a 96-well plate. After an appropriate attachment period, 10 µL of CCK-8 solution (C0037, Beyotime, Shanghai, China) was added to each well, followed by incubation for 4 h at 37 °C in a humidified 5% CO2 atmosphere. The absorbance at 450 nm was subsequently measured using a microplate reader (ELx800, BioTek, Santa Clara, CA, USA).
After routine dewaxing, antigen retrieval, and inactivation, the tissue sections were prepared at a thickness of 5 µm. The sections were incubated in a solution containing 0.2% Triton X-100 at room temperature for 20 minutes, followed by three 5-minute washes with phosphate-buffered saline with Tween-20 (PBST). Next, the samples were completely covered with a 5% bovine serum albumin (BSA) solution and incubated at room temperature for 30–60 minutes to block non-specific binding sites. After adding the appropriate primary antibody (ionized calcium-binding adapter molecule 1, Iba1, 1:100, ab283319, Abcam, Cambridge, UK), the sections were incubated overnight at 4 °C, then rinsed several times with PBS and incubated with horseradish peroxidase (HRP)-conjugated anti-mouse IgG secondary antibodies. Subsequently, an appropriate volume of tyramide signal amplification (TSA) dye was added and the sections incubated at room temperature in the dark for 10 minutes. Unbound antibodies were eluted using antibody elution buffer, followed by re-blocking with 5% BSA. An optimal concentration of primary antibodies (inducible nitric oxide synthase, iNOS, 1:100, ab210823, Abcam, Cambridge, UK; HCAR2, 1:100, AHR-012, Alomone labs, Jerusalem, Israel) was then added and incubated overnight at 4 °C. The sections were subsequently incubated with HRP-conjugated anti-rabbit IgG secondary antibodies and the TSA dye reapplied, ensuring the fluorescent color differed from that used in the initial staining. Finally, the sections were mounted using an anti-fade mounting medium, examined under a fluorescence microscope, and the images recorded.
TRIzol reagent (15596018CN, Sigma-Aldrich, St. Louis, MO, USA) was used to
isolate total RNA, which was then reverse transcribed into cDNA using the
PrimeScript RT reagent kit (RR037A, Takara, Kusatsu, Japan). Real-time PCR was
performed on a 7300 Plus Real-Time PCR System (JM1966-018481, Thermo Fisher,
Waltham, MA, USA) with SYBR Premix Ex Taq I (RR037A, Takara, Kusatsu, Japan).
Each reaction mixture comprised 1 µL of cDNA template, 10 µL of PCR
master mix, 5 pmol of each primer, and nuclease-free water to a final volume of
20 µL. The thermocycling conditions consisted of an initial denaturation at
95 °C for 13 s, followed by 40 cycles of 94 °C for 10 s, and 60
°C for 20 s. Relative mRNA expression levels were normalized to Glyceraldehyde-3-phosphate dehydrogenase (GAPDH)
mRNA as the internal control. Data analysis was conducted using the comparative
threshold cycle (
| Target gene | Foward primer sequence | Reverse primer sequence |
| iNOS | GGTGAAGGGACTGAGCTGTT | ACGTTCGTTCTCTTGCA |
| TNF- |
CAGGCGGTGCCTATGTCTC | CCATTTGGGAACTTCTCATCCCTT |
| GAPDH | GCCAAGGCTGTGGGCAAGGT | TCTCCAGGCGGCACGCAGA |
Cells were lysed with radioimmunoprecipitation assay (RIPA) buffer containing phenylmethylsulfonyl fluoride
(PMSF). The extracted proteins were separated by 10% sodium dodecyl
sulfate–polyacrylamide gel electrophoresis (SDS-PAGE) and subsequently
transferred to polyvinylidene fluoride (PVDF) membranes via electroblotting. The
membranes were blocked for 1 h at room temperature and then incubated overnight
at 4 °C with primary antibodies against phosphorylated protein kinase B
(p-AKT, #4060, Cell Signaling Technology, Danvers, MA, USA), total protein
kinase B (total-AKT, #4691, Cell Signaling Technology, Danvers, MA, USA),
phosphorylated inhibitor of nuclear factor-kappa-B kinase subunits alpha and beta
(p-IKK
RNA sequencing was carried out through a commercially available service (BGI, the raw sequence data see the availability of data and materials). Briefly, total RNA was fragmented into short fragments and the mRNA enriched using oligo (dT) magnetic beads, followed by cDNA synthesis. Double stranded cDNA was purified and enriched by PCR amplification, after which the library products were sequenced using BGIseq-500. Gene Ontology (GO, http://geneontology.org/docs/download-ontology/) bioinformatics and Kyoto Encyclopedia of Genes and Genomes (KEGG, https://www.kegg.jp/kegg/pathway.html) pathway analyses were performed using the Dr. TOM approach, which is an in-house customized data mining system of the BGI. Altered expression of genes was expressed as log2FC, representing log-transformed fold-change (log2FC = log2[B/A]), where A and B represent the values for gene expression under different treatment conditions.
All data are presented as the mean
To assess whether HCAR2 activation can mitigate corticosterone-induced
depressive behaviors, we conducted the following tests across all experimental
groups: tail suspension test (TST; Fig. 2A), forced swimming test (FST; Fig. 2B),
sucrose preference test (SPT; Fig. 2C), and open field test (OFT; Fig. 2D). In
the WT group, MK-6892 treatment significantly reduced corticosterone-induced
depressive behaviors (TST: p
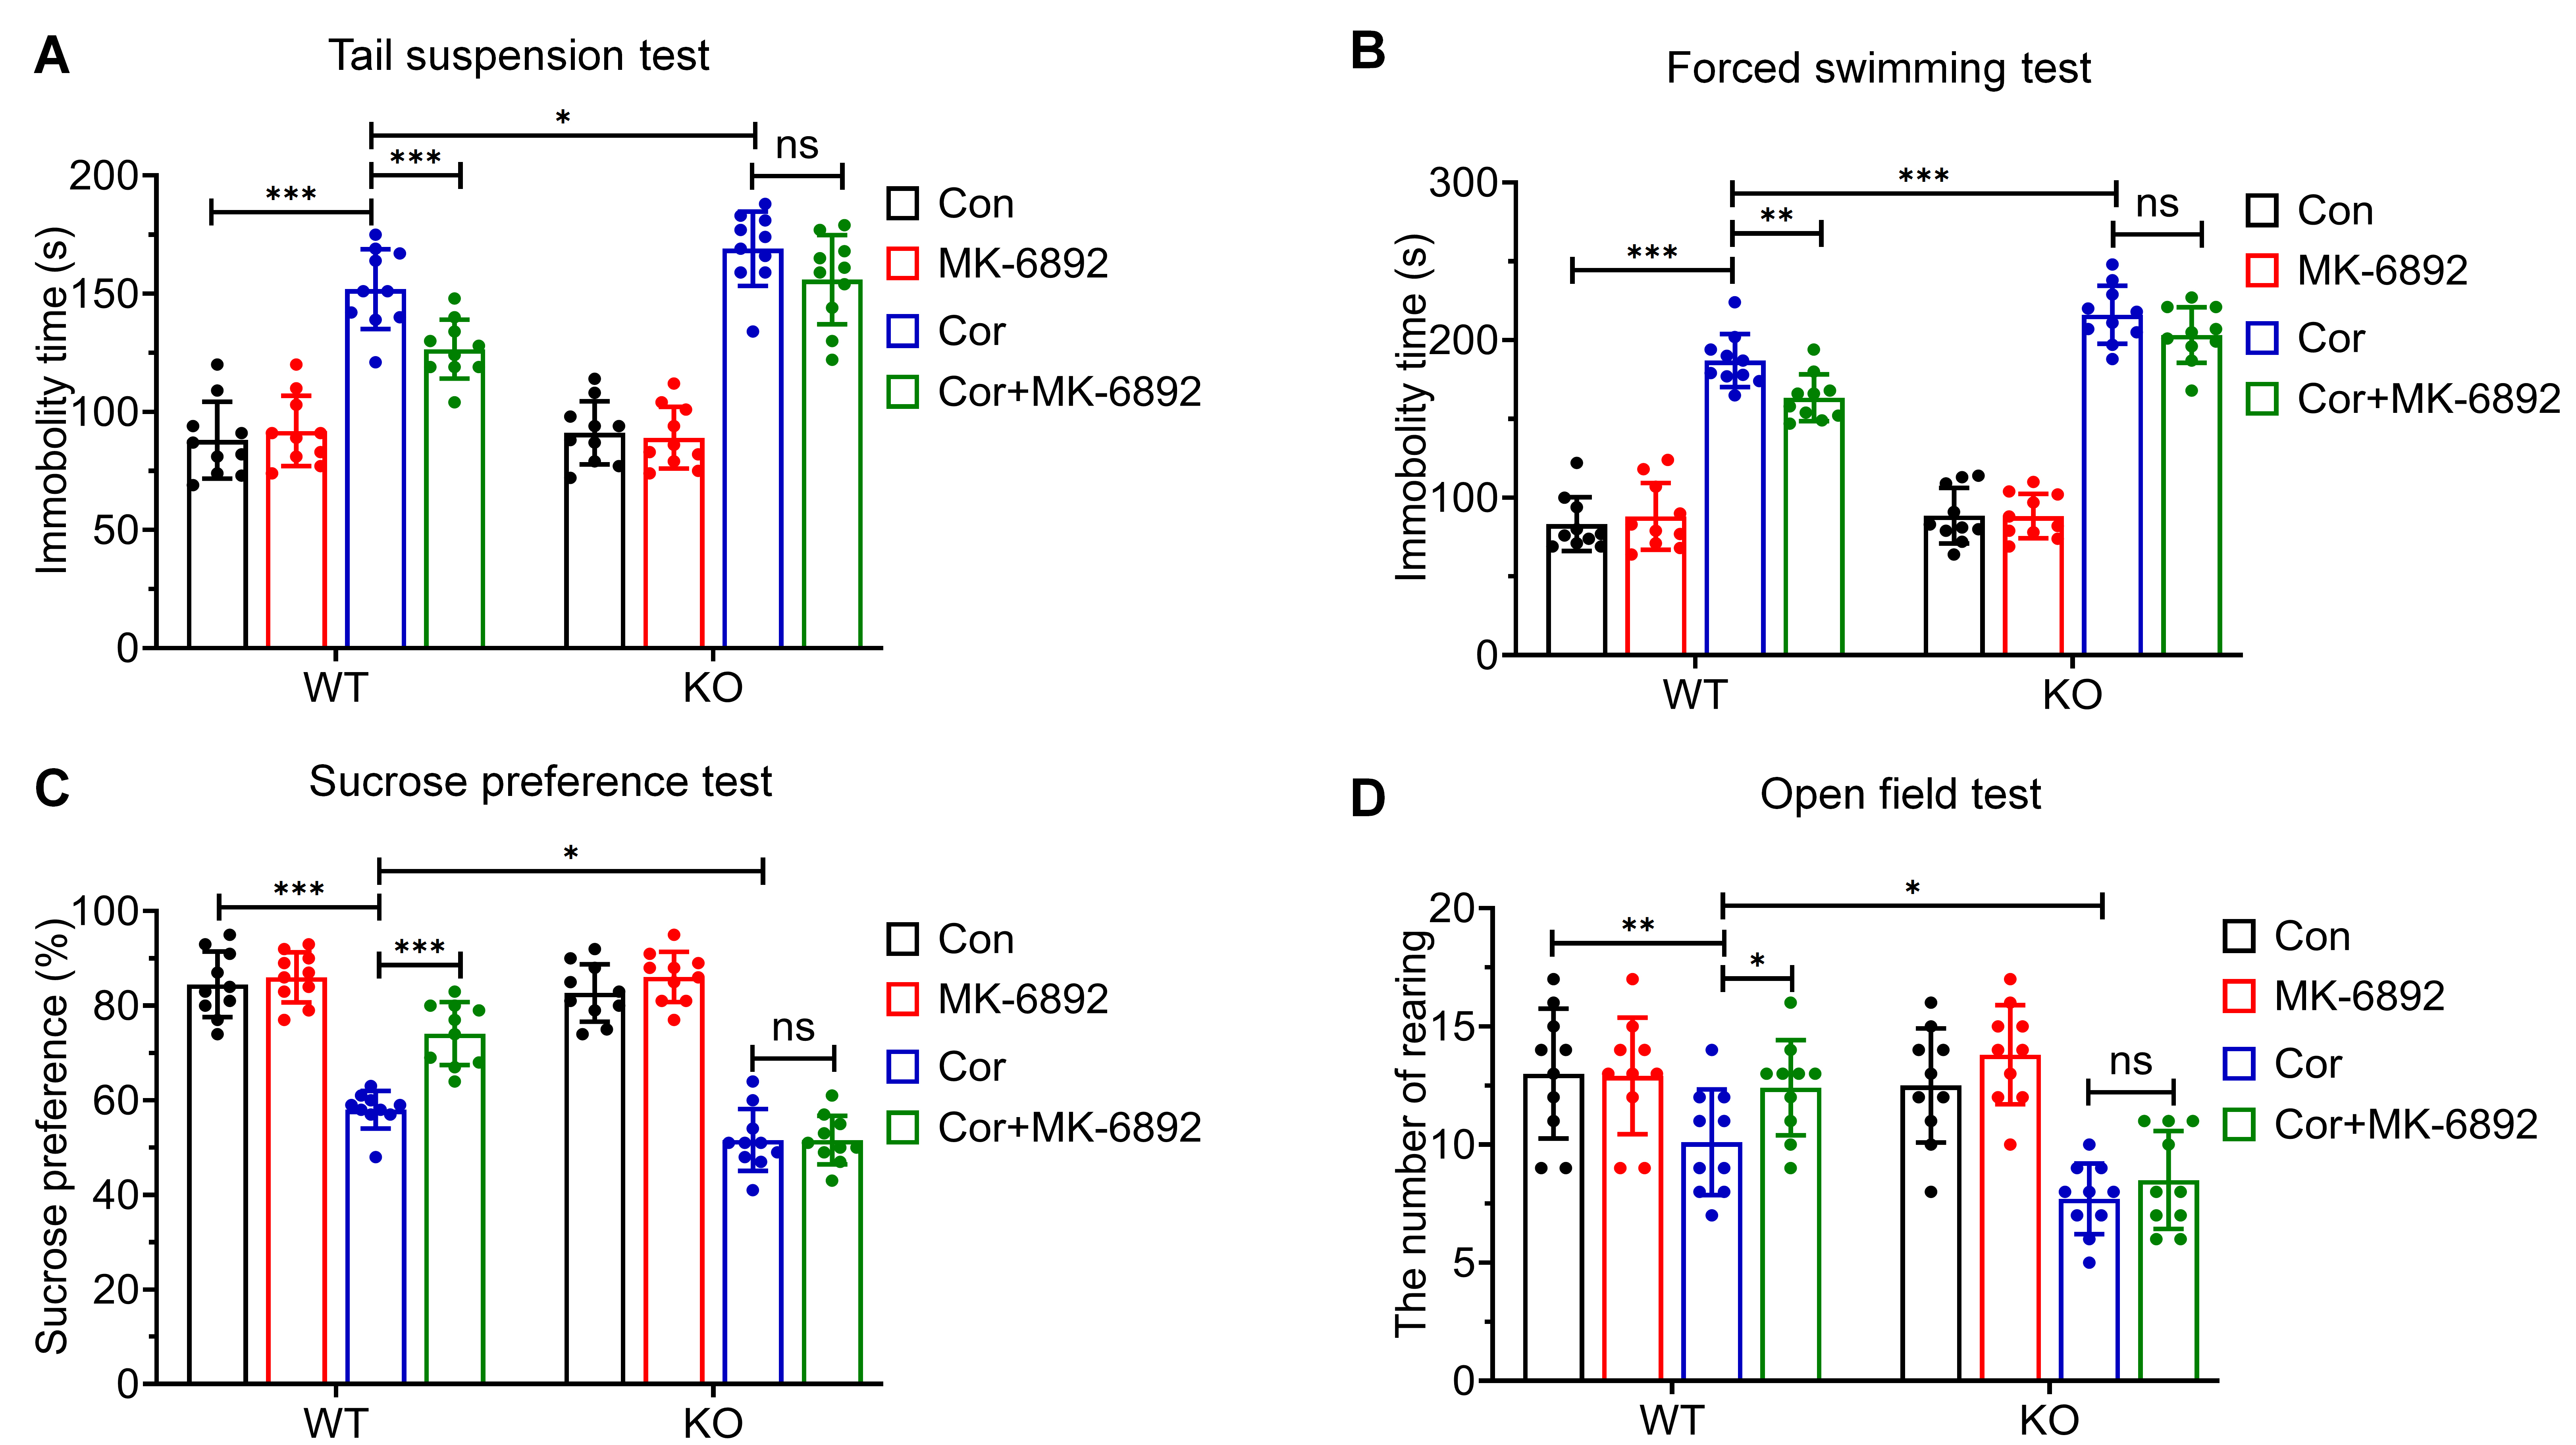 Fig. 2.
Effects of HCAR2 activation on corticosterone-induced depressive
behaviors. (A) Immobility time in the tail suspension test. (B) Immobility time
in the forced swimming test. (C) Sucrose preference test. (D) Frequency of
rearing behavior in the open field test. ***p
The protective effects of HCAR2 activation in this murine model of depression
were investigated by hematoxylin-eosin staining (Fig. 3A) and Nissl staining
(Fig. 3C) across all experimental groups. In the WT group, HCAR2 activation in
the depression model significantly enhanced the survival of hippocampal neurons,
as evidenced by the reduced number of cells exhibiting nuclear pyknosis
(p
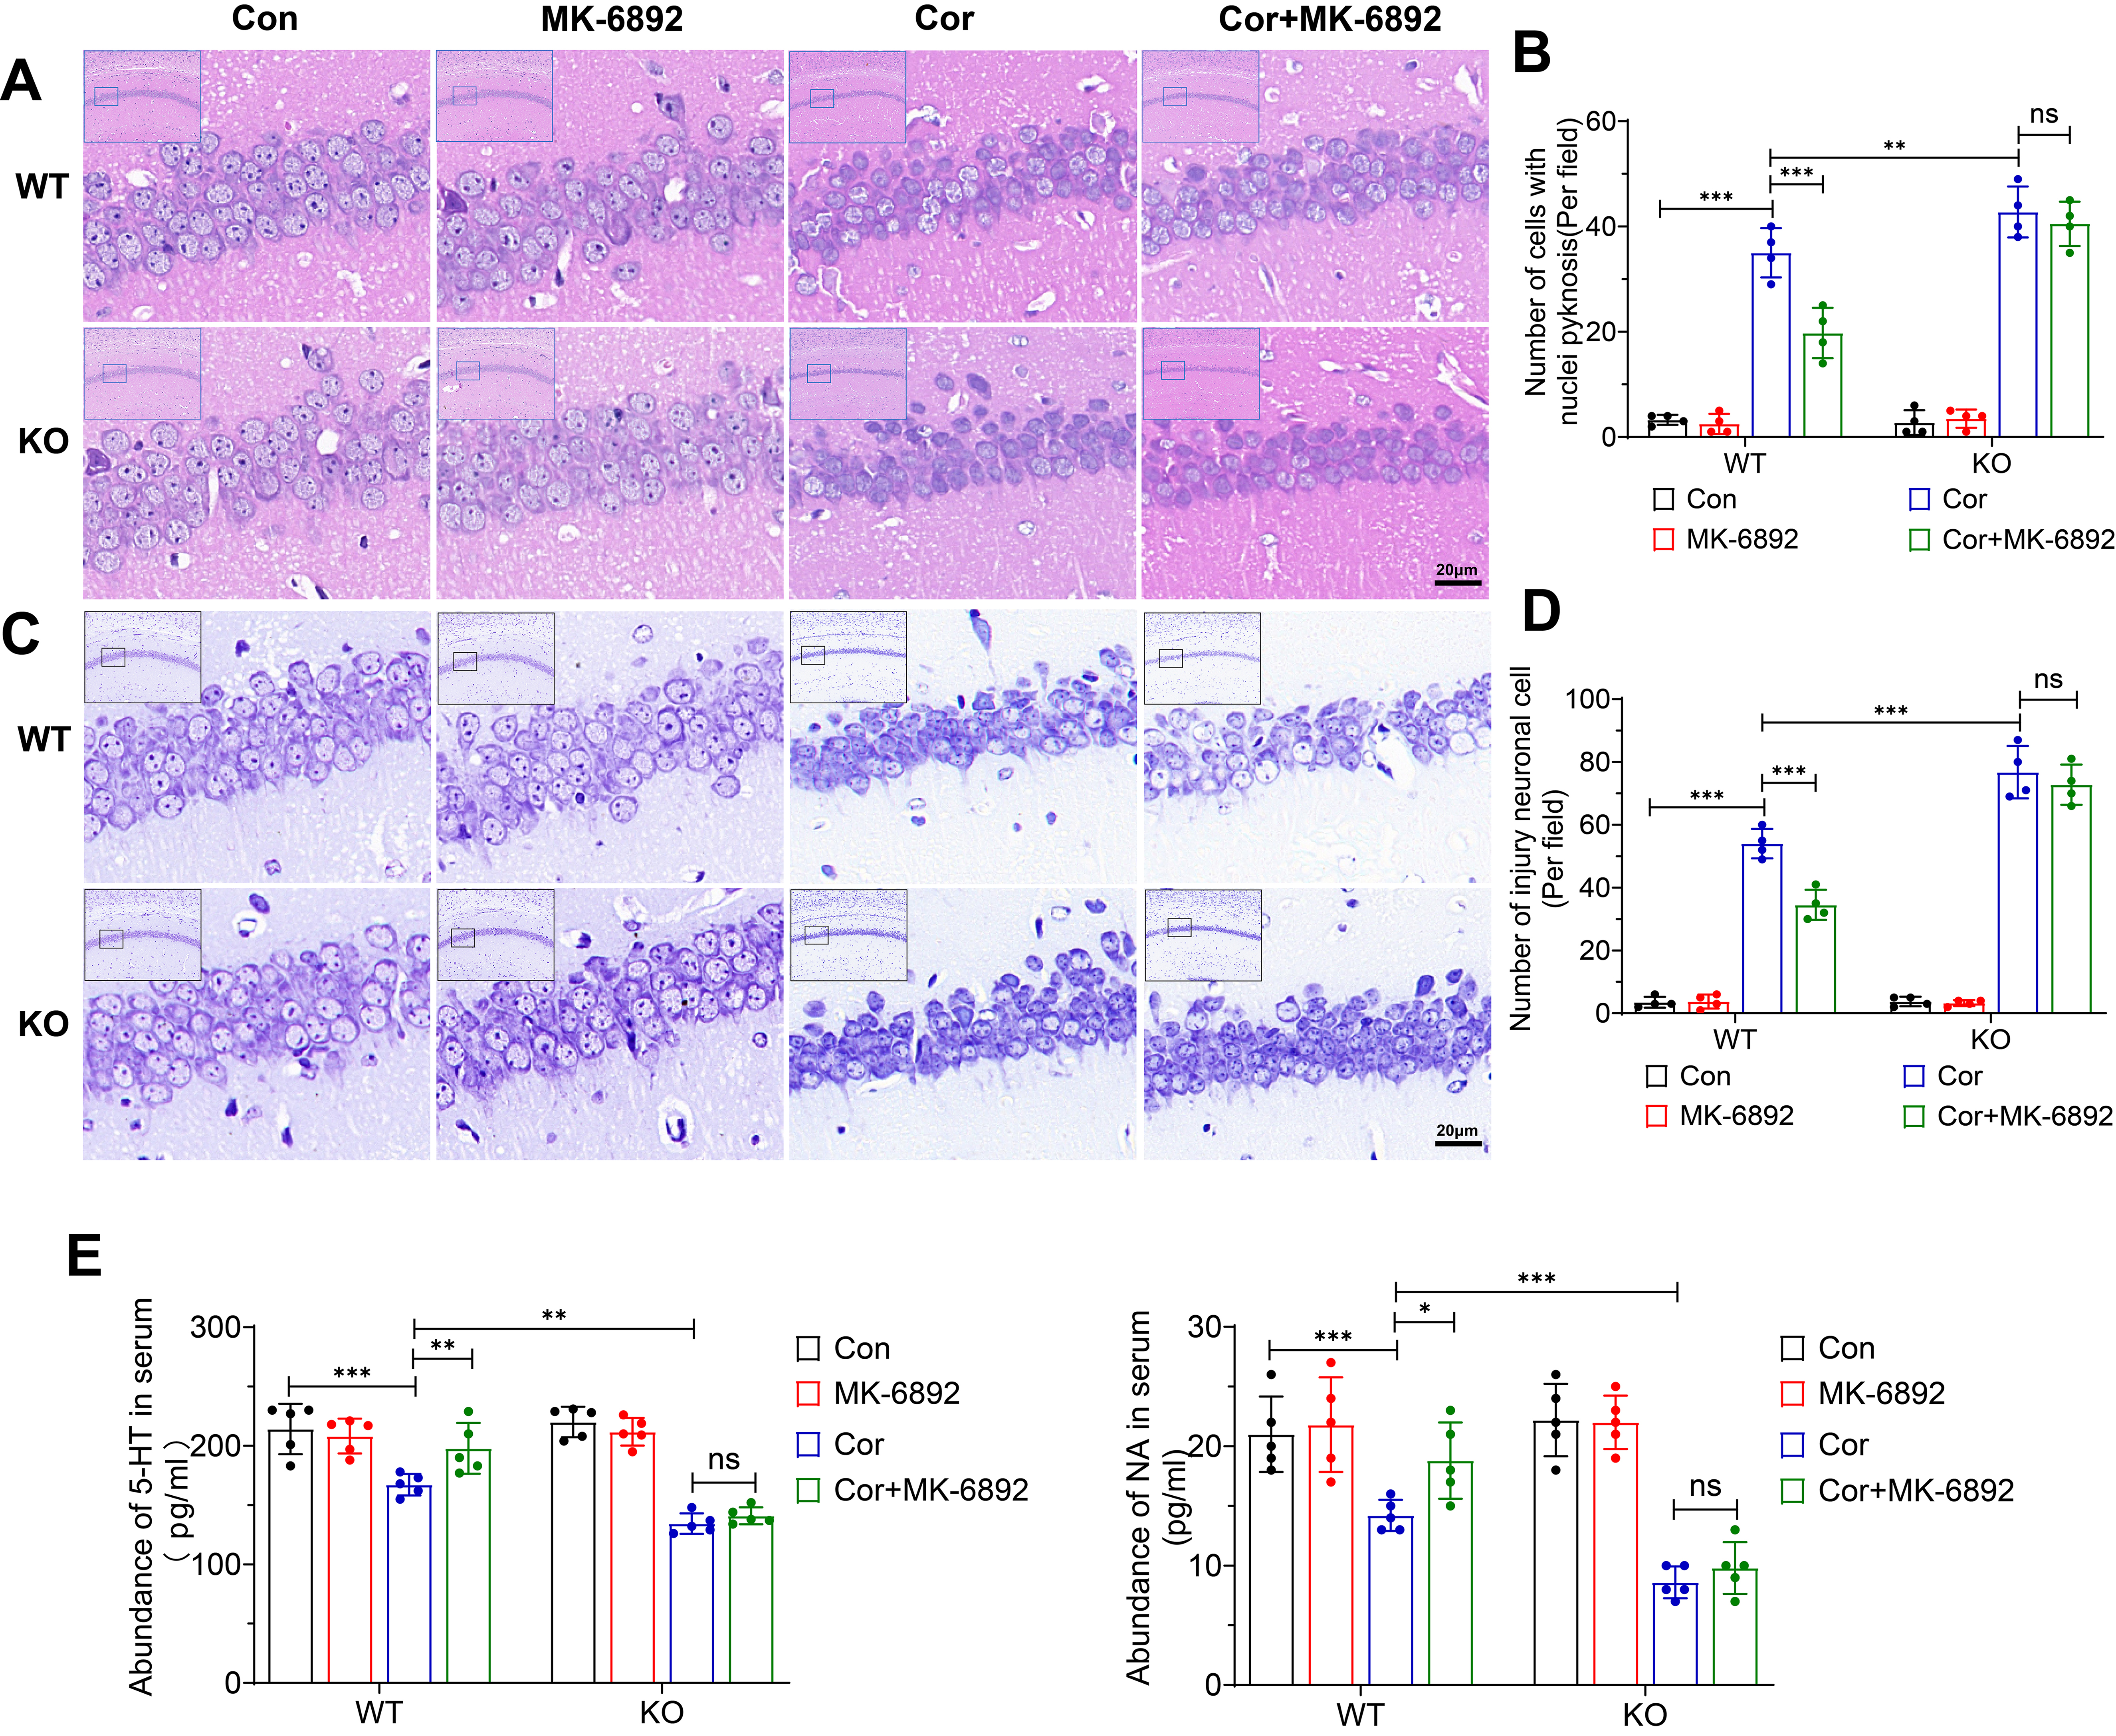 Fig. 3.
Effects of HCAR2 activation on corticosterone-induced
hippocampal neuronal injury. (A) Representative hematoxylin-eosin stained images
of the hippocampus from each experimental group. Scale bar = 20 µm. (B) Bar
graph depicting the number of cells exhibiting nuclear pyknosis. (C)
Representative Nissl-stained images of the hippocampus from each experimental
group. Scale bar = 20 µm. (D) Bar graph showing the number of injured neurons. (E) Serum levels of
monoamine neurotransmitter, as measured by ELISA. ***p
To confirm the expression of HCAR2 in microglial cells, immunofluorescence staining was conducted on the hippocampus (Fig. 4A) and on primary microglial cells (Fig. 4B). HCAR2 was found to co-localize with Iba1, a marker for microglia, indicating that HCAR2 is expressed in microglial cells.
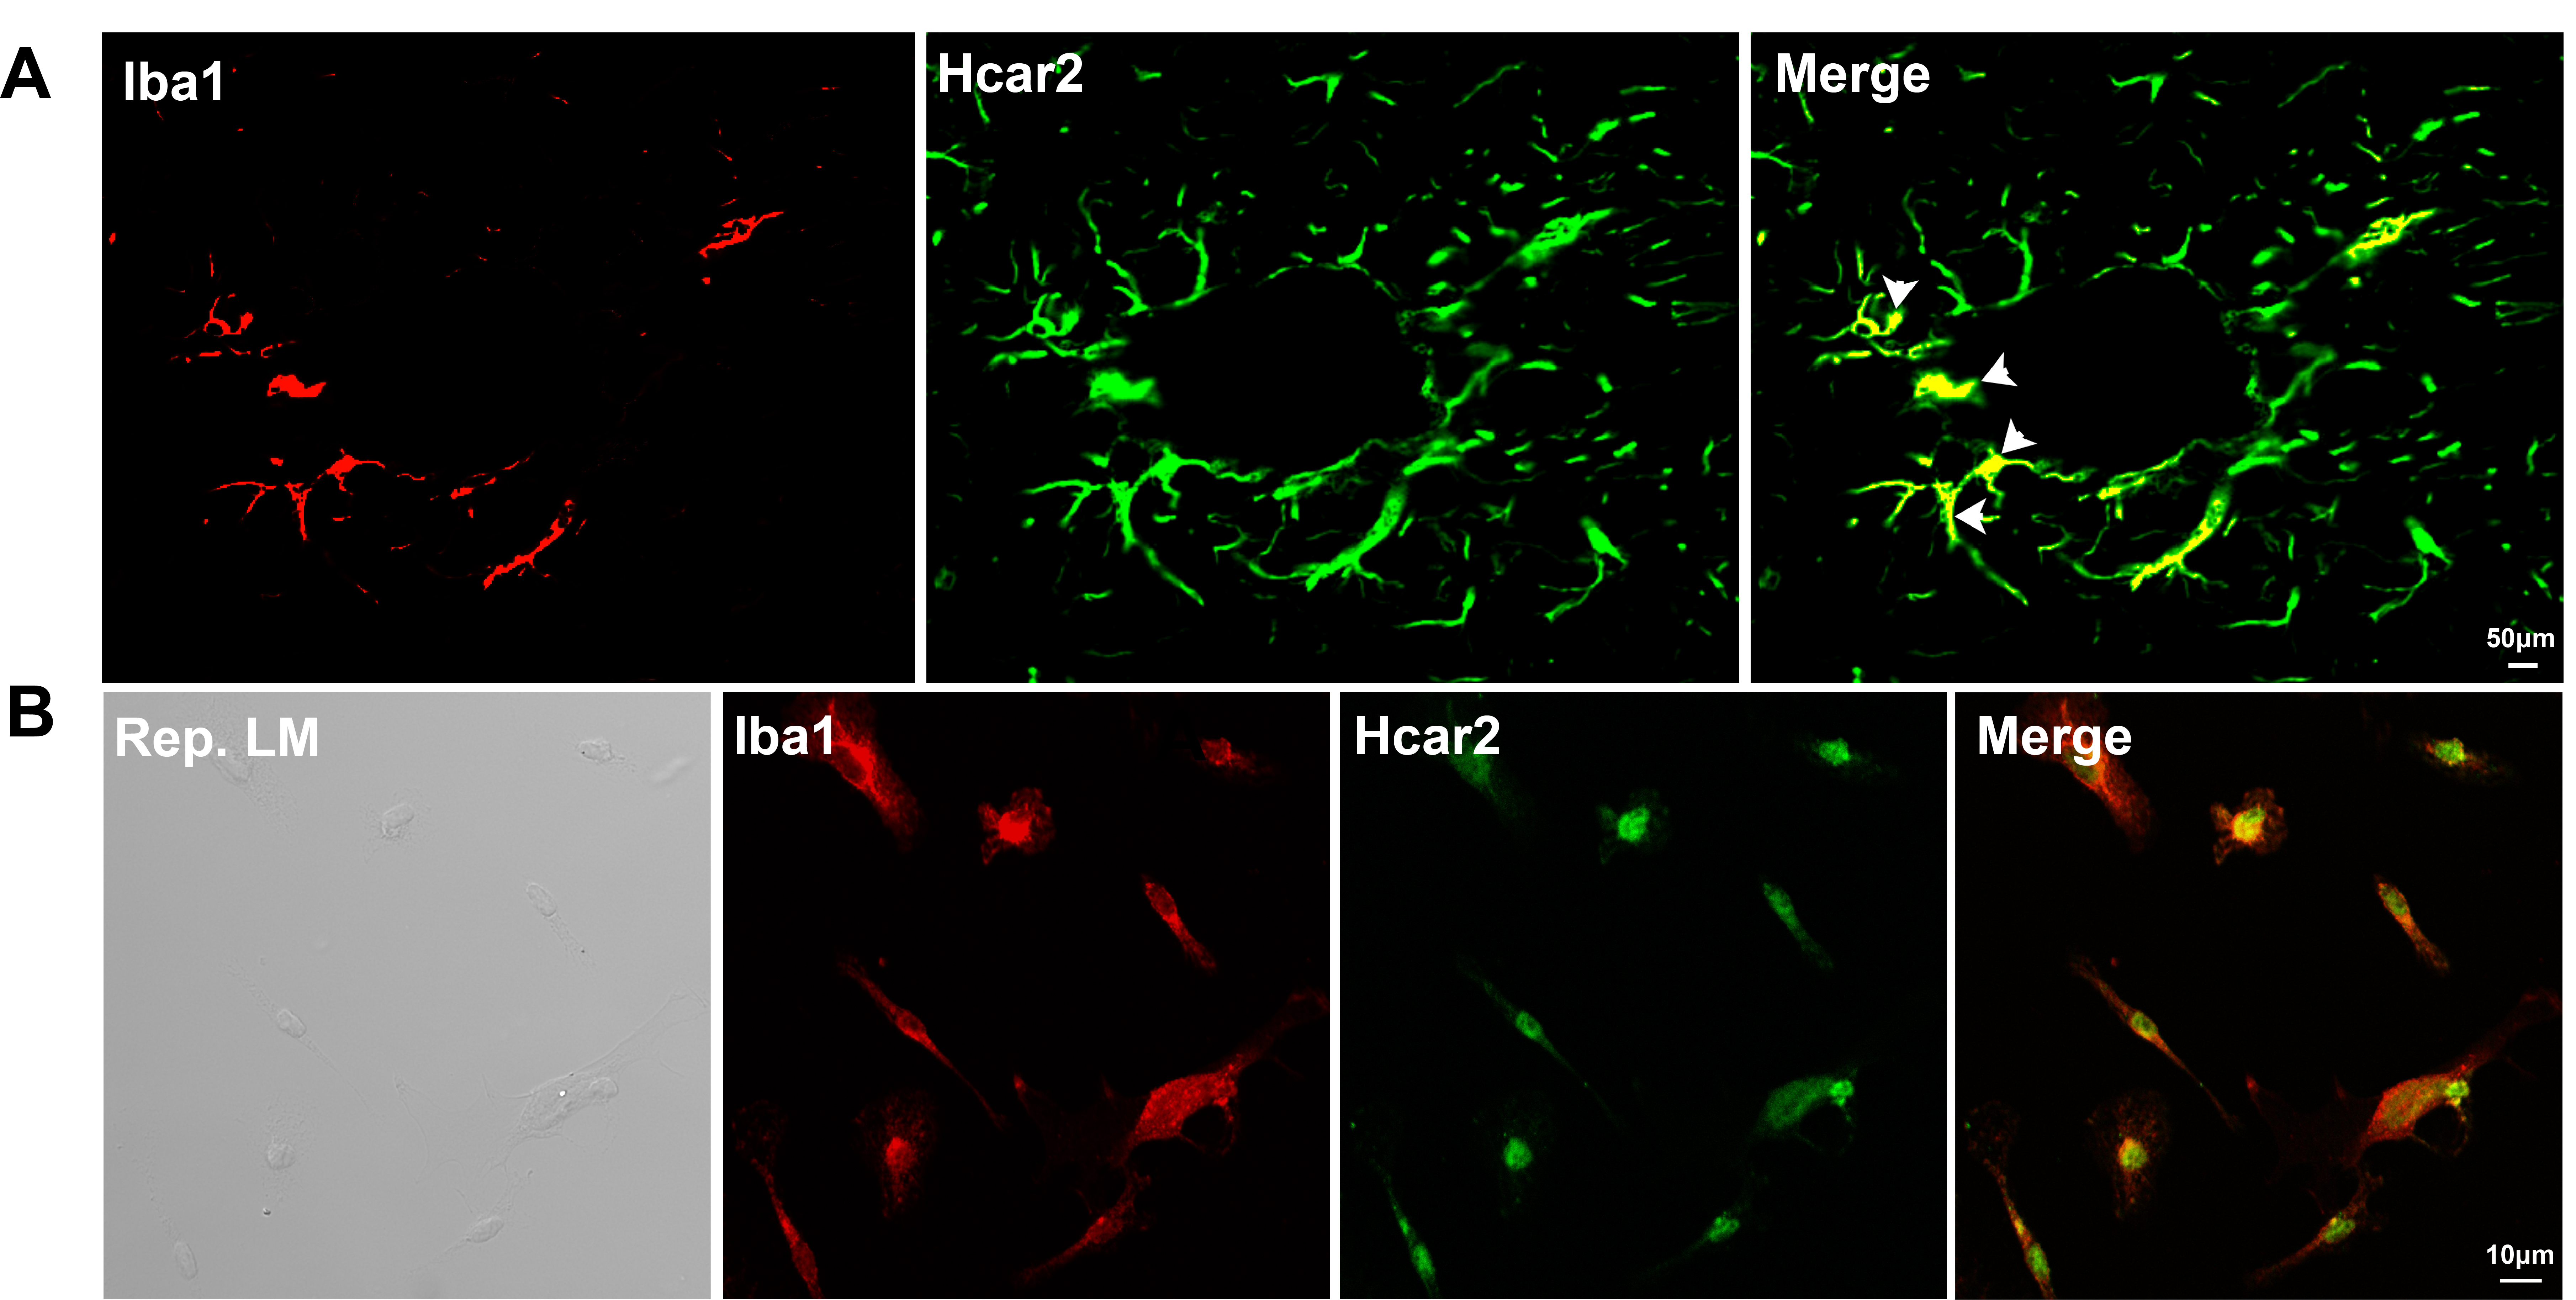 Fig. 4.
Co-localization of Iba1 and HCAR2 in vivo and in vitro. (A) Co-localization of Iba1 and HCAR2 in brain sections. Scale bar = 50 µm. The white arrow indicates the co-localization of Iba1 and HCAR2 within the hippocampal region. (B) Co-localization of Iba1 and HCAR2 in primary microglial cells. Scale bar = 10 µm. Iba1, ionized calcium-binding adapter molecule 1; LM, light microscopy.
We subsequently examined whether activation of HCAR2 in microglial cells could
induce neuroprotective effects on cells from the hippocampal neuron HT-22 cell
line in a co-culture model (Fig. 5A). Primary microglial cells were isolated from
the specified experimental groups, and a 0.4 µm pore-sized membrane
was used to segregate primary microglial cells from HT-22 cells. After co-culture
for 48 h, the cell viability and LDH activity were assessed in each experimental
group. HT-22 cells co-cultured with microglia isolated from WT mice and treated
with a combination of Cor and MK-6892 were found to exhibit significantly greater
cell viability (p = 0.005, Fig. 5B) and markedly lower LDH
activity (p
 Fig. 5.
HCAR2 activation alleviates hippocampal neuronal injury in a
co-culture system. (A) Schematic diagram of the co-culture model. This figure was created using Adobe Illustrator software. (B) Cell
viability in each experimental group. (C) LDH levels in each experimental group.
***p
The degree of M1 polarization in microglia was assessed by performing
immunofluorescent staining for Iba1/iNOS in the hippocampus (Fig. 6A), as well as
real-time qPCR analysis to evaluate the expression levels of iNOS and
TNF-
 Fig. 6.
Activation of HCAR2 inhibits microglial M1 polarization. (A)
Representative immunofluorescent staining for Iba1 and iNOS in the hippocampus. Scale bar = 100 µm. The white arrow indicates the co-localization of iNOS and Iba1 within the hippocampal region.
(B) Quantification of the number of Iba1/iNOS double-positive microglia. (C)
Relative mRNA levels of selected M1 phenotype markers in primary microglia.
***p
Modulation of the protein kinase B-inhibitor of nuclear factor kappa-B kinase
subunits alpha and beta-nuclear factor kappa-light-chain-enhancer of activated B
cells (AKT-IKK
 Fig. 7.
HCAR2 activation inhibits corticosterone-induced activation of
the AKT-IKK
Comprehensive profiling of HCAR2-mediated transcriptional regulation in the brain was performed by extracting total RNA from microglia isolated from both Cor-treated and Cor+MK-6892-treated WT mice. This was followed by high-throughput sequencing and bioinformatic analysis. Heat map analysis of differential gene expression identified 174 differentially expressed genes (DEGs) between the Cor and Cor+MK-6892 groups, comprising 64 upregulated genes and 110 downregulated genes (Fig. 8A). KEGG analysis (Fig. 8B) revealed that HCAR2 activation in microglia primarily regulated genes associated with metabolic pathways (tryptophan metabolism, purine metabolism, etc.) and cellular processes (cell adhesion molecule, neutrophil extracellular trap formation, etc.). Gene Ontology enrichment analysis (Fig. 8C) revealed that microglia from the Cor+MK-6892 group and the Cor group display notable differences in functional annotations, signaling pathways, and specific biological processes. These data indicate that activation of HCAR2 results in transcriptomic alterations in microglia isolated from corticosterone-treated mice.
 Fig. 8.
HCAR2 activation induces transcriptional changes in microglial cells. (A) Heatmap plot depicting differentially expressed genes between the depression model and the MK-6892-treated depression model. (B) KEGG enrichment analysis. (C) GO enrichment analysis. KEGG, Kyoto Encyclopedia of Genes and Genomes; GO, Gene Ontology bioinformatics.
We next investigated whether the anti-depressive and neuroprotective effects of
HCAR2 activation are mediated by microglia. Mice were fed continuously with the
CSF1R inhibitor PLX5622 for the entire experimental period to deplete microglia
in vivo. AIN-76A chow was used as the vehicle control. Hematoxylin-Eosin
staining (Fig. 9A) and Nissl staining (Fig. 9C) revealed that microglia depletion
abrogated the neuroprotective effects of MK-6892 in Cor-induced neuronal injury
(p
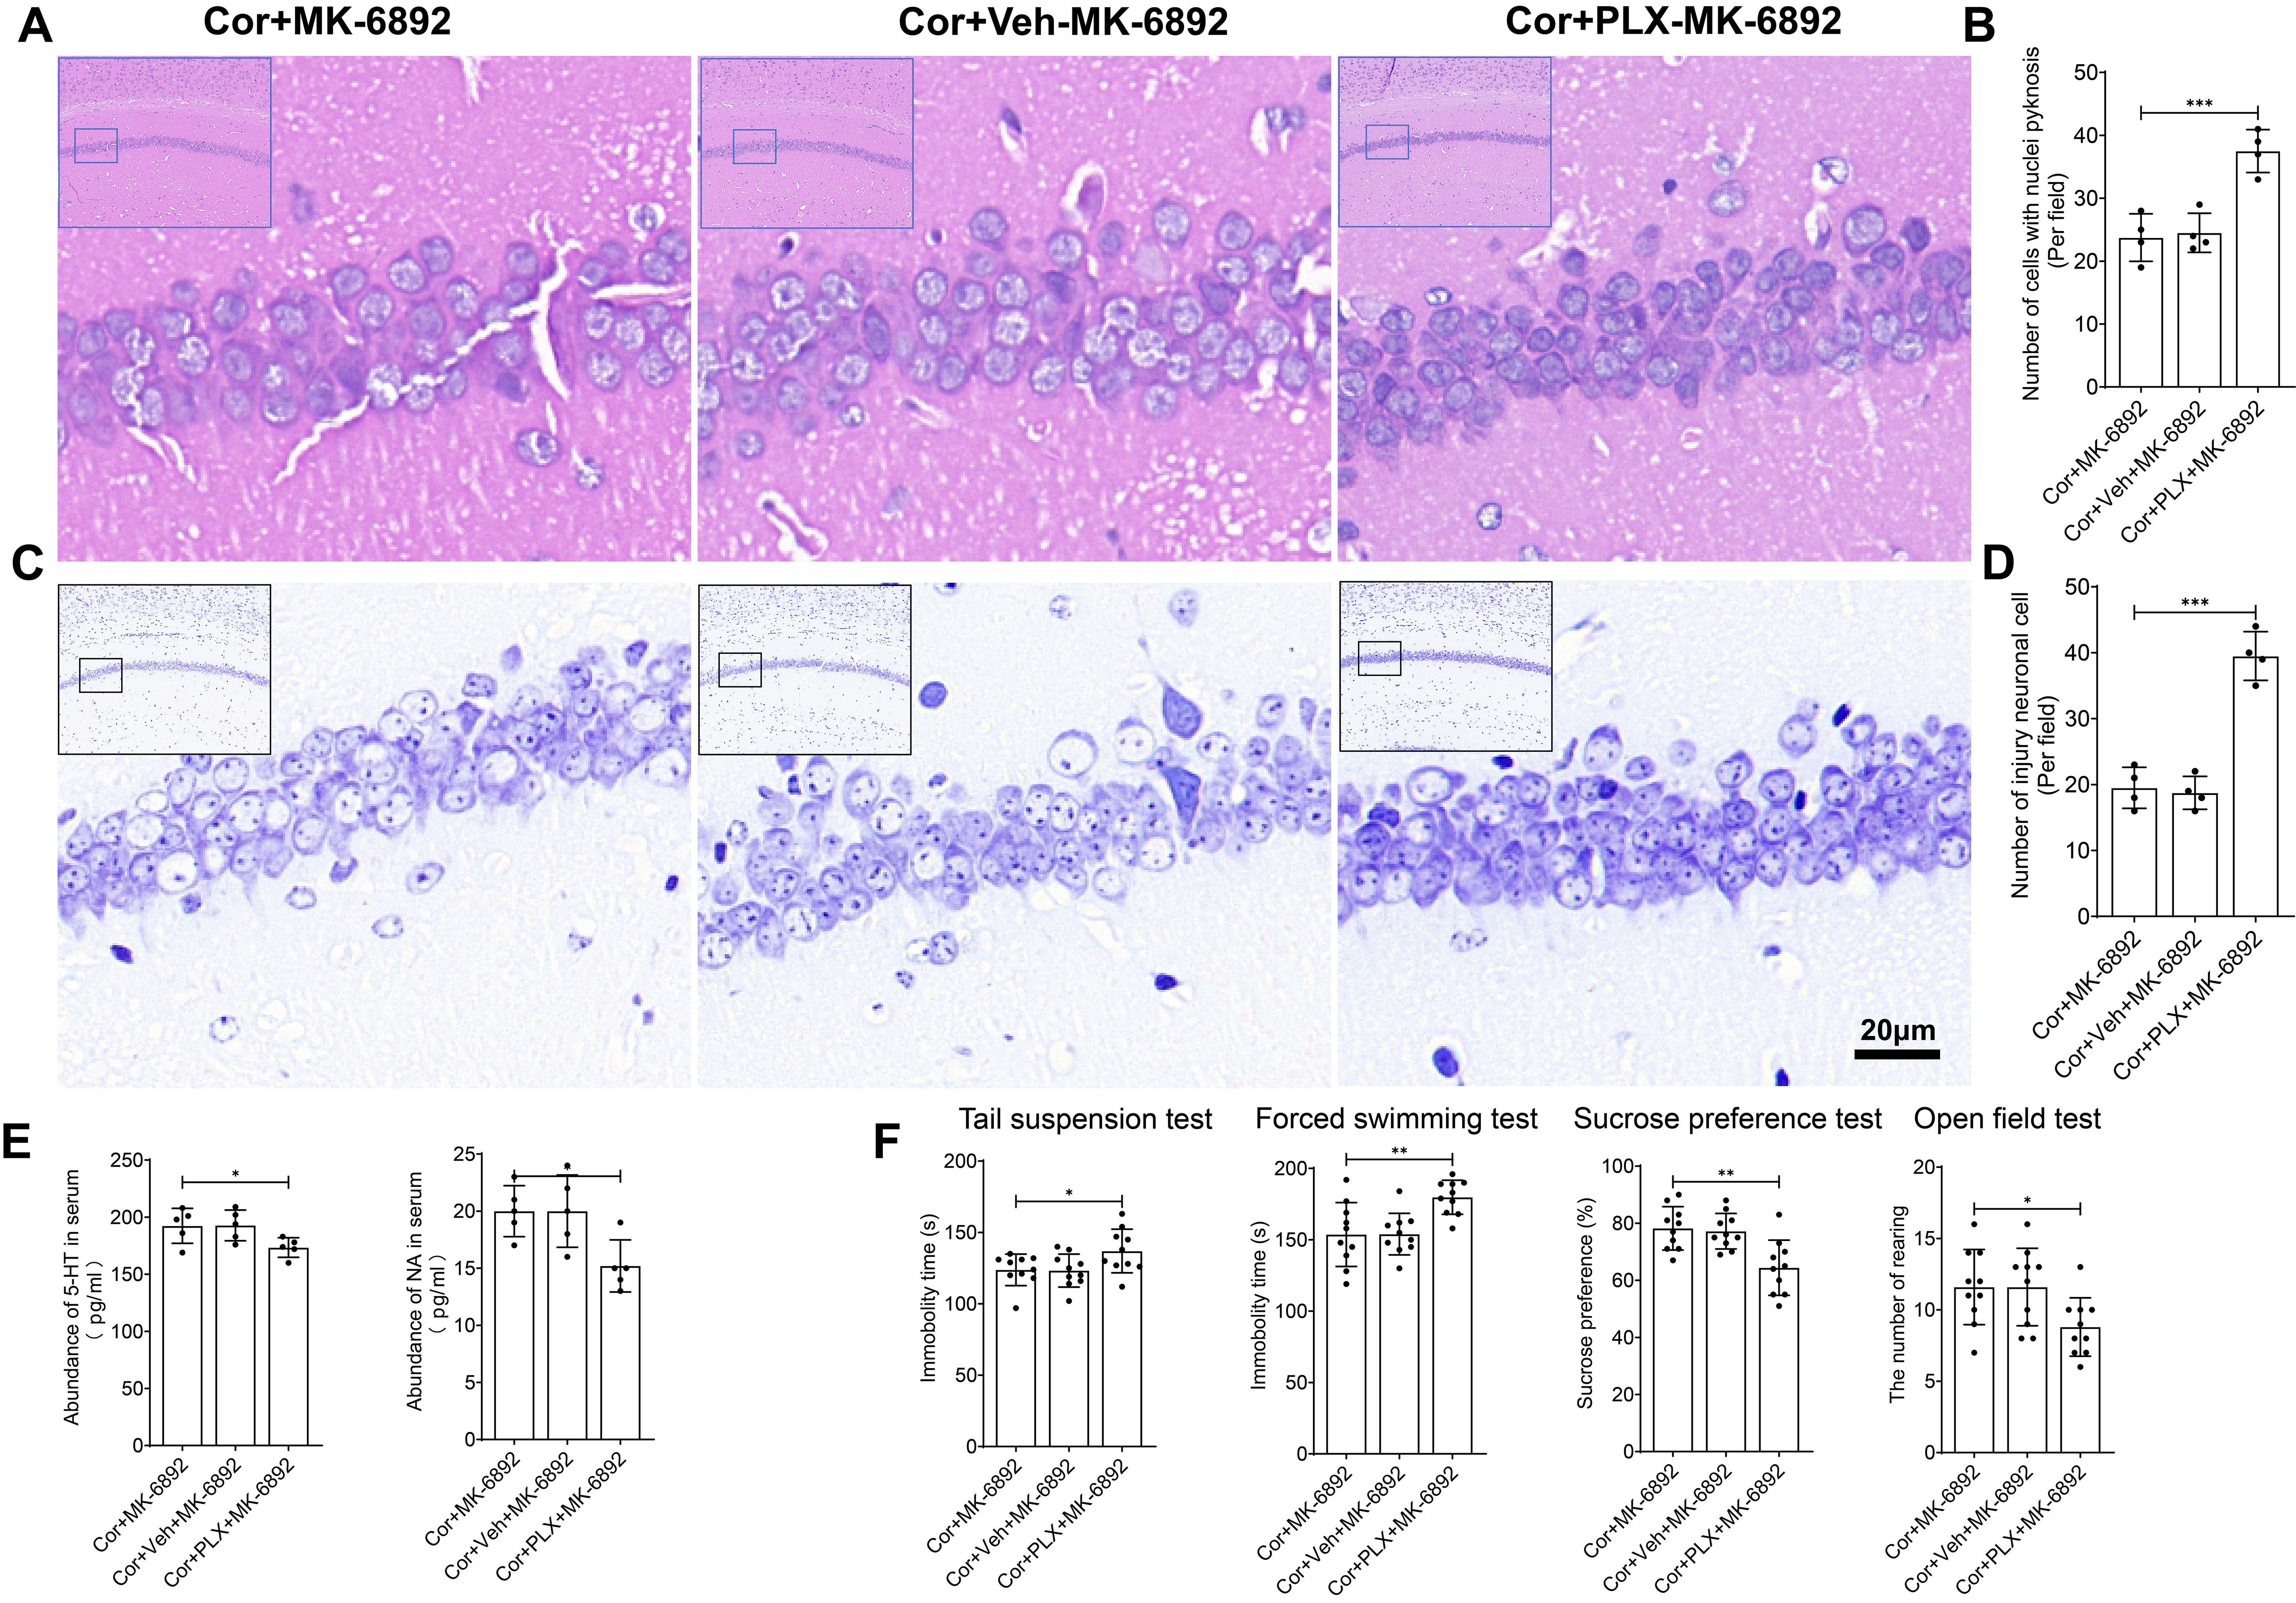 Fig. 9.
The antidepressant and neuroprotective effects of HCAR2 are
directly mediated through its action on microglia. (A) Representative
hematoxylin-eosin stained images of the hippocampus from each experimental group. Scale bar = 20 µm.
(B) Bar graph showing the number of cells with nuclear pyknosis. (C)
Representative Nissl-stained images of the hippocampus from each experimental
group. Scale bar = 20 µm. (D) Bar graph depicting the number of injured neurons. (E) Serum levels of
monoamine neurotransmitters, as measured by ELISA. (F) Depressive-like behavior
observed in each experimental group. ***p
This study examined the role of HCAR2 in a corticosterone-induced mouse model of
depression. Activation of HCAR2 significantly alleviated depressive-like
behaviors, attenuated neuronal damage, and improved the inflammatory
microenvironment. Further analysis revealed these protective effects were
specifically mediated by microglia, since they were abrogated by the depletion of
microglia. Moreover, HCAR2 activation led to transcriptomic changes in microglia.
Our results also suggest that the AKT-IKK
HCAR2, also known as GPR109A, is predominantly expressed in immune cells,
adipose tissue, and the CNS. Its endogenous ligands include
HCAR2 has been established as a critical mediator in metabolic diseases,
including diabetes [27] and obesity [28], highlighting its potential influence on
metabolic reprogramming. Our sequencing data revealed that activation of HCAR2
significantly alters metabolic pathways in a mouse model of depression,
particularly tryptophan, purine and glutamine metabolism. An imbalance in
tryptophan metabolism is a hallmark pathological feature of depression [29].
Tryptophan primarily undergoes metabolism via the kynurenine (KYN) pathway,
resulting in quinolinic acid (QUIN) or 5-HT [30]. During chronic inflammation,
the activity of indoleamine 2,3-dioxygenase (IDO) in microglia increases,
favoring the KYN pathway and exacerbating the neurotoxic effects of QUIN on
synaptic integrity [31]. Activation of HCAR2 may restore balance in tryptophan
metabolism by promoting 5-HT synthesis through inhibition of microglial
inflammatory responses and reduction of IDO expression. Furthermore, HCAR2
agonists may indirectly regulate tryptophan metabolism by modulating gut
microbiota metabolites, such as butyrate, thereby influencing the gut-brain axis.
Abnormal purine metabolism is intricately associated with neuroinflammation. The
extracellular accumulation of purine metabolites, such as ATP, can activate the
NLRP3 inflammasome by engaging the P2X7 receptor on microglia, leading to the
release of IL-1
In summary, this study demonstrates that HCAR2 is highly effective in alleviating depressive-like behaviors and neural damage in a corticosterone-induced mouse model of depression. Mechanistically, HCAR2 activation specifically targets microglia, modulates multiple metabolic pathways, and thereby mitigates the inflammatory microenvironment, thus promoting neuroprotection. Given its role in neurochemical regulation and mood modulation, HCAR2 may serve as a promising therapeutic target for the treatment of depression.
The raw sequence data reported in this paper have been deposited in the Genome Sequence Archive (Genomics, Proteomics & Bioinformatics 2021) in National Genomics Data Center (Nucleic Acids Res 2022), China National Center for Bioinformation/Beijing Institute of Genomics, Chinese Academy of Sciences (GSA: CRA026738) that are publicly accessible at https://ngdc.cncb.ac.cn/gsa. The other datasets used or analysed during the current study were available from the corresponding author on reasonable request.
ZP, LJ, JCC and YJC designed the research study. ZP, LJ, JCC, SCX and YZX performed the research. ZP, PZ and YZX conducted experiments. SCX, YLY, PZ and YJC analyzed the data. ZP wrote the manuscript. All authors contributed to editorial changes in the manuscript. All authors read and approved the final manuscript. All authors have participated sufficiently in the work and agreed to be accountable for all aspects of the work.
All animal procedures were performed follow in the 3R principles and approved by the Ethics Committee of Affiliated Nanhua Hospital, University of South China (2025-KY-007).
We extend our gratitude to Ejear’s Editing for providing English language editing services for this article.
This study was funded by the Clinical Medical Technology Innovation Guide Project of Hunan Province, China (grant number: 2021SK51901), the Project of Hunan Provincial Department of Education (grant number: 21B0412), the general project of the Health Commission of Hunan Province (grant number: 202203072781, 202203074169), the “4310” program of clinical medical research of the University of South China (grant number: 20224310NHYCG11), and the Natural Science foundation of Hunan Province (grant number: 2023JJ50158, 2025JJ90140).
The authors declare no conflict of interest.
References
Publisher’s Note: IMR Press stays neutral with regard to jurisdictional claims in published maps and institutional affiliations.