


 , Jun Yu 1,†, Junning Liu 1,2, Qing Zhou 1, Linfeng Yang 1, Qian Dai 1, Jianshui Li 1,3, Chuan Lan 1,3,*
 , Dawei Deng 1,3,*
1 Department of Clinical Medicine, North Sichuan Medical College, 637000 Nanchong, Sichuan, China
2 Department of Cardiovascular Surgery, Beijing Anzhen Nanchong Hospital of Capital Medical University & Nanchong Central Hospital, The Second Clinical Medical College of North Sichuan Medical College, 637000 Nanchong, Sichuan, China
3 Department of Hepatobiliary and Pancreatic Surgery, Affiliated Hospital of North Sichuan Medical College, 637000 Nanchong, Sichuan, China
†These authors contributed equally.
Abstract
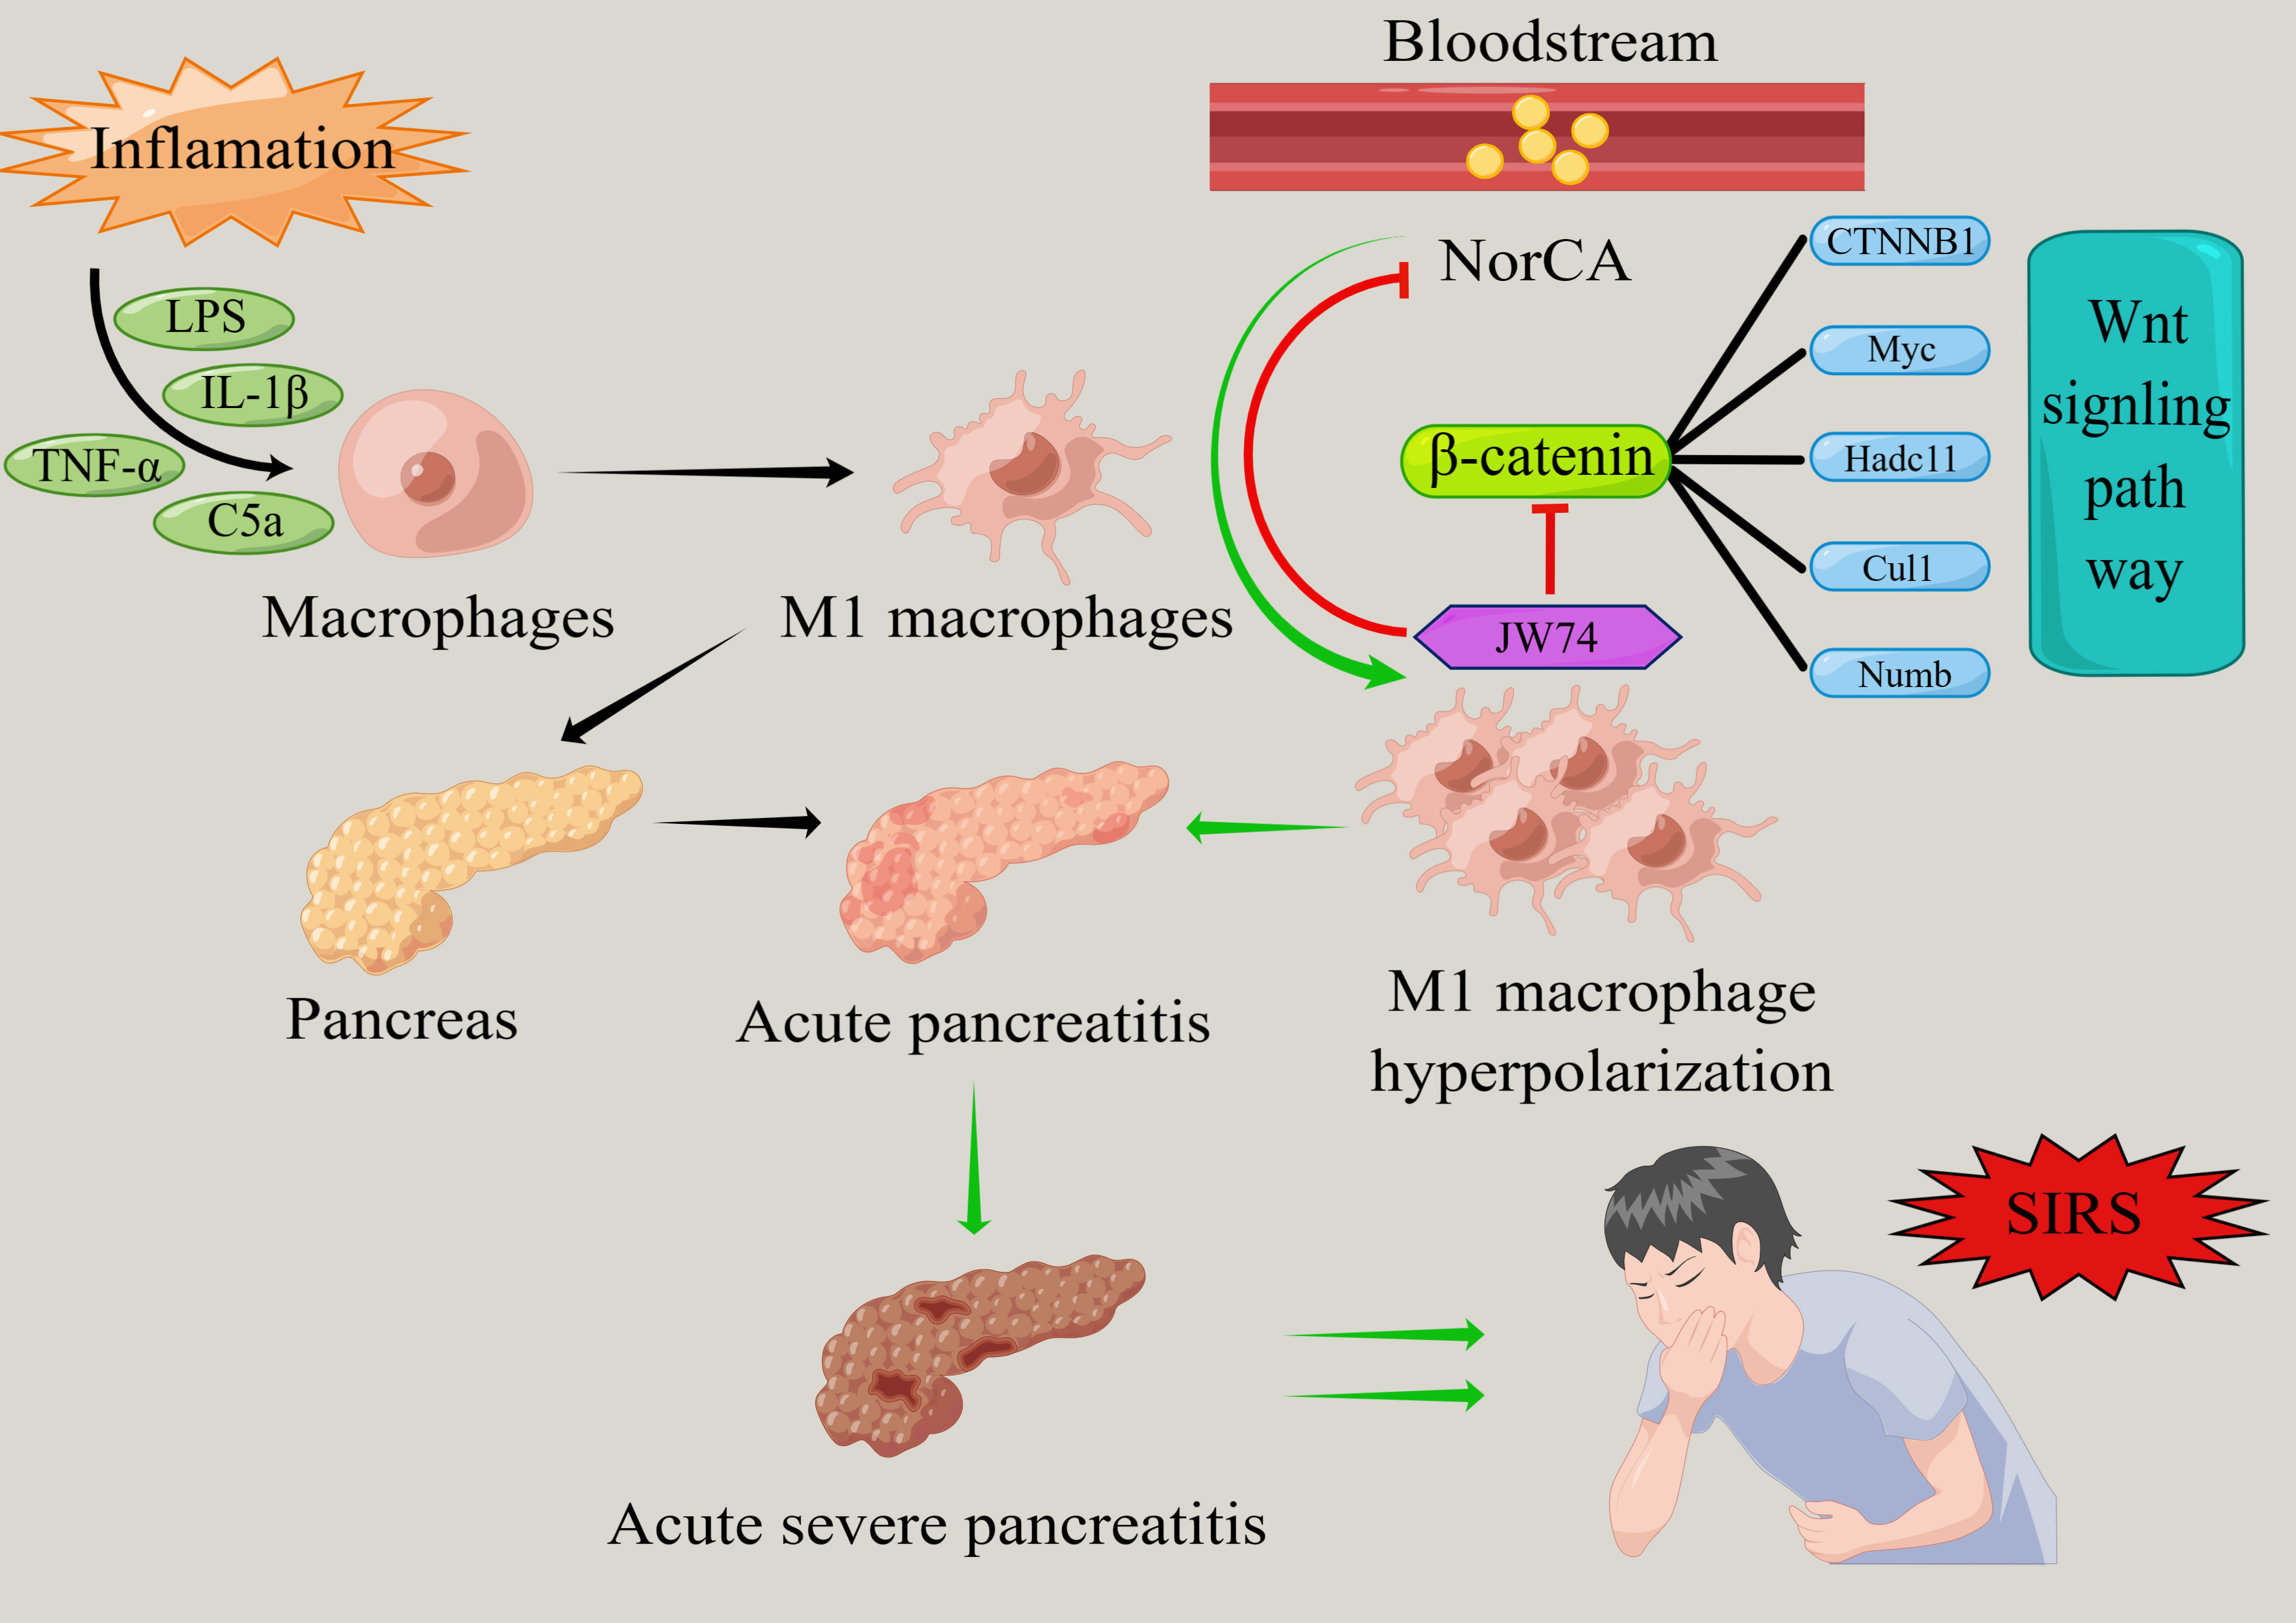
Acute pancreatitis (AP) is a common gastrointestinal emergency and critical condition worldwide. Given the absence of specific therapeutic targets, managing the progression of AP to severe phases and the accompanying systemic inflammatory response remains challenging. We detected an abnormally elevated expression of norcholic acid (NorCA) in the serum of patients with various types of AP and found that this bile acid is closely associated with the Wnt/β-catenin signaling pathway in the context of AP. This study was designed to investigate NorCA’s dual role as a novel diagnostic biomarker and molecular therapeutic target in AP, with particular emphasis on elucidating its mechanistic regulation of M1 macrophage polarization in RAW 264.7 murine macrophages during AP pathogenesis.
Serum samples from AP patients were collected and screened to identify the levels of NorCA and the extent of metabolic abnormalities using bile acid targeting detection. Transcriptome sequencing and bioinformatics analyses were conducted to investigate the role of the Wnt/β-catenin pathway. To evaluate NorCA’s regulatory effect on M1 macrophage polarization through the Wnt/β-catenin signaling pathway in AP development, we employed flow cytometry, western blotting, and qRT-PCR analyses.
NorCA demonstrated a significant elevation in the peripheral blood across different AP subtypes, showing promising diagnostic potential with high sensitivity and specificity. NorCA promotes the polarization of M1 macrophages by activating the Wnt/β-catenin pathway, leading to further inflammation. Treatment with JW74, a specific Wnt/β-catenin inhibitor, significantly reduced the degree of NorCA-induced M1 macrophage polarization.
NorCA demonstrates dual clinical utility as both a novel diagnostic biomarker for AP and a promising molecular target for therapeutic intervention in severe AP and its concomitant systemic inflammatory response syndrome (SIRS).
Keywords
- pancreatitis
- norcholic acid
- systemic inflammatory response syndrome
- Wnt/β-catenin
- macrophages
Acute pancreatitis (AP) is a common gastrointestinal emergency and critical condition worldwide that is characterized by rapid onset and progression [1]. The prevalence of AP has risen significantly in recent years. Intravenous fluid resuscitation (IVFR) is the primary early treatment for this disease, and aggressive volume resuscitation is a crucial aspect of therapy [2]. However, due to the absence of targeted therapies, approximately 20% of AP cases progress to severe acute pancreatitis (SAP). These patients frequently develop systemic inflammatory response syndrome (SIRS) and subsequent multiple organ dysfunction syndrome (MODS), carrying a significant mortality risk of 20–30% [3]. Consequently, the identification of novel therapeutic targets to mitigate inflammatory cascades in AP represents a critical unmet clinical need.
SIRS exhibits a well-established pathophysiological correlation with both the progression and critical outcomes of AP [4, 5, 6]. During the course of acute pancreatitis, peripheral blood macrophages undergo polarization and differentiate into pro-inflammatory M1 and M2 macrophages that exhibit anti-inflammatory and tissue repair functionality [7]. AP induces the activation and phenotypic polarization of pancreatic macrophages toward the pro-inflammatory M1 subtype, resulting in substantial release of inflammatory cytokines and mediators that ultimately trigger localized pancreatic inflammation [7]. Furthermore, macrophage polarization is closely related to AP-associated lung and kidney injuries [8, 9]. A previous study has shown that regulating the polarization state of macrophages can significantly improve the systemic inflammatory response in AP [10]. Thus, regulation of macrophage polarization may provide new interventions for the occurrence and development of AP.
It is well known that biliary pancreatitis accounts for 30–50% of the total incidence of AP, and bile acid metabolism disorders are a typical feature of AP that are closely related to a poor prognosis in patients [11]. Compelling evidence demonstrates that bile acids play a central role in AP pathogenesis by initiating intracellular Ca2+ overload, which precipitates mitochondrial membrane potential collapse and ultimately leads to programmed necrosis of acinar cells [12]. However, the relationship between abnormal bile acid metabolism and macrophage polarization in the systemic inflammatory response caused by AP is yet to be elucidated. Therefore, investigating the effect of bile acids on macrophage polarization in AP is of great significance for the intervention of severe AP and its associated systemic inflammatory responses.
In our study, we found that the levels of norcholic acid (NorCA), a nordeoxycholic acid, were significantly elevated in the peripheral blood of patients with AP. In this study, we hypothesized that an appropriate concentration of NorCA could further promote the release of inflammatory factors from M1 macrophages, thereby exacerbating the inflammatory progression of AP. Our findings provide a new perspective on the treatment of AP.
Fasting serum samples were collected from all 100 participants during morning
rounds following hospital admission. Based on the 2012 Atlanta classification
criteria, AP patients were stratified into three clinical
severity groups: (1) mild AP (MAP) characterized by absence of both organ failure
and local/systemic complications; (2) moderately severe AP (MSAP) defined by
transient organ failure (
Patients or their families/legal guardians informed consent was obtained for specimen collection, which was approved and supervised by the Ethics Committee of North Sichuan Medical College Affiliated Hospital (Approval Number: 2021ER133-1).
Serum samples (80 µL) were aliquoted into 96-well plates and mixed with
320 µL of methanol:acetonitrile (1:1, v/v) spiked with 50 ng/mL bile acid
isotope internal standards. Following 5-min vortexing, samples underwent
centrifugation (5300 rpm, 20 min, 4 °C), with 260 µL supernatant
aliquoted into 450 µL 96-well plates for drying. The resulting extracts
were reconstituted for targeted bile acid metabolomic analysis. Scanning and
quantification were performed using an Acquity UPLC (Waters, Milford, MA, USA)
and a Sciex 5500+ triple quadrupole mass spectrometer (Sciex, Framingham, MA,
USA) in tandem. The bile acid extract was injected at a volume of 2.5 µL
and separated on a C18-PFP (3 µm, 2.1
The murine macrophage cell line RAW264.7 was obtained from SUNNCELL (Wuhan,
China) and maintained in high-glucose DMEM (C3113-0500, VivaCell Biosciences,
Shanghai, China) supplemented with 5% (v/v) heat-inactivated fetal bovine serum
(FBS, Biological Industries, Kibbutz Beit Haemek, Israel) and 1% (v/v) penicillin-streptomycin solution (Biological Industries, Kibbutz Beit Haemek, Israel). Cell cultures were grown at
37 °C in a 5% CO2 humidified incubator. Cells at 70% confluence
were divided into four groups (n = 6/group): (1) Vehicle (DMSO 10 µL/mL, 12
h); (2) Lipopolysaccharide (LPS, Sigma-Aldrich, St. Louis, MO, USA) (1 µg/mL, 12 h); (3) LPS + NorCA (Sigma-Aldrich, St. Louis, MO, USA, 1 + 10
µg/mL, 12 h); (4) LPS/NorCA
RAW264.7 cell viability after NorCA treatment was quantified using a commercial CCK-8 kit (K1018, APExBIO Technology LLC, Houston, TX, USA) per the standard protocol. Briefly, RAW264.7 cells were seeded in 96-well plates at a density of 5000 cells/well and treated with six different concentrations of NorCA (0, 2.5, 5, 10, 15, and 20 µg/mL) in culture medium. After 24 h incubation, cells received CCK-8 reagent (10% in medium) for 4 h at 37 °C. Cell viability was quantified by measuring absorbance at 450 nm using a microplate reader (M1000 PRO, Tecan, Männedorf, Switzerland), and the maximum effective concentrations of the two bile acids on RAW264.7 cells were calculated. This experiment was repeated thrice.
RAW264.7 murine macrophages were cultured in DMEM (C3113-0500, VivaCell
Biosciences, Shanghai, China) supplemented with 10% heat-inactivated FBS and maintained at 37 °C in a humidified 5% CO₂
incubator. At
Total RNA from each group of cells was isolated using the TRIzol reagent (R401-01, Vazyme, Nanjing, China). RNA samples underwent reverse transcription with HiScript III RT SuperMix for qPCR (+gDNA wiper) (Vazyme), followed by quantitative PCR employing ChamQ Universal SYBR qPCR Master Mix (Vazyme) per manufacturer’s protocol. Quantitative PCR was carried out on a LightCycler 96 System (Roche Diagnostics, Basel, Switzerland) using gene-specific primers (sequences provided in Table 1).
| Targets | Forward | Reverse |
| CD11c | CTGGATAGCCTTTCTTCTGCTG | GCACACTGTGTCCGAACTCA |
| CD86 | TCAATGGGACTGCATATCTGCC | GCCAAAATACTACCAGCTCACT |
| GAPDH | CAGTGGCAAAGTGGAGATTGTTG | TCGCTCCTGGAAGATGGTGAT |
| ATGGAGCCGGACAGAAAAGC | TGGGAGGTGTCAACATCTTCTT |
Finally, the relative expression levels of target genes across experimental groups (DMSO control, LPS, LPS + NorCA, and LPS + NorCA + JW74) were quantified using the 2-ΔΔCt method with GAPDH normalization.
RAW264.7 cells were treated for 24 h with DMSO (10 µL/mL), LPS (1
µg/mL), LPS (1 µg/mL) + NorCA (10 µg/mL),
or LPS (1 µg/mL) + NorCA (10 µg/mL) + JW74 (10
µg/mL). After treatment, cells were lysed in 1 mL RIPA buffer
(R0010, Solarbio, Beijing, China) supplemented with 10 µL PMSF
(P0100, Solarbio, Beijing, China) for protein extraction. Cell lysate protein
quantification was performed using a commercial BCA assay kit (PC0020, Solarbio,
Beijing, China) following standard protocols. Subsequently, 25 µg of
protein from each lysate was separated via SDS-PAGE (10% gel) and transferred to
PVDF membranes at 240 mA for 1.5 hours for subsequent immunoblotting analysis.
Blocked PVDF membranes (protein-free buffer) underwent TBST washing before
overnight 4 °C incubation with
CD86/CD11c/
Transcriptome sequencing of the DMSO, LPS, and LPS + NorCA groups of RAW264.7 cells was performed by Shanghai LingEn Biotechnology Co., Ltd. (Shanghai, China) Total RNA was extracted from the three groups of RAW264.7 cells using the TRIzol method. We next measured the concentration and purity of the extracted total RNA using a NanoDrop 2000 spectrophotometer (Thermo Fisher Scientific, Waltham, MA, USA). Subsequent library preparation was performed following successful quality control assessment. The constructed cDNA libraries underwent paired-end sequencing on an Illumina NovaSeq 6000 system (Illumina, San Diego, CA, USA), generating 150 bp average read lengths. Subsequently, the expression differences between samples for each transcript were analyzed using edgeR (https://bioconductor.org/packages/release/bioc/html/edgeR.html) to identify differentially expressed genes (DEGs). The screening criteria for significant DEGs comprised a minimum 2-fold change (log2 scale) and 0.05 p-value cutoff.
Differential gene expression analysis between the LPS + NorCA-treated group and
control groups in LPS-stimulated RAW264.7 cells was conducted using the limma
package (R software; https://bioconductor.org/packages/limma/). DEGs were defined
as those meeting the threshold criteria of p
Statistical analyses were performed using GraphPad Prism 9.4 (GraphPad Software,
San Diego, CA, USA), with data expressed as mean
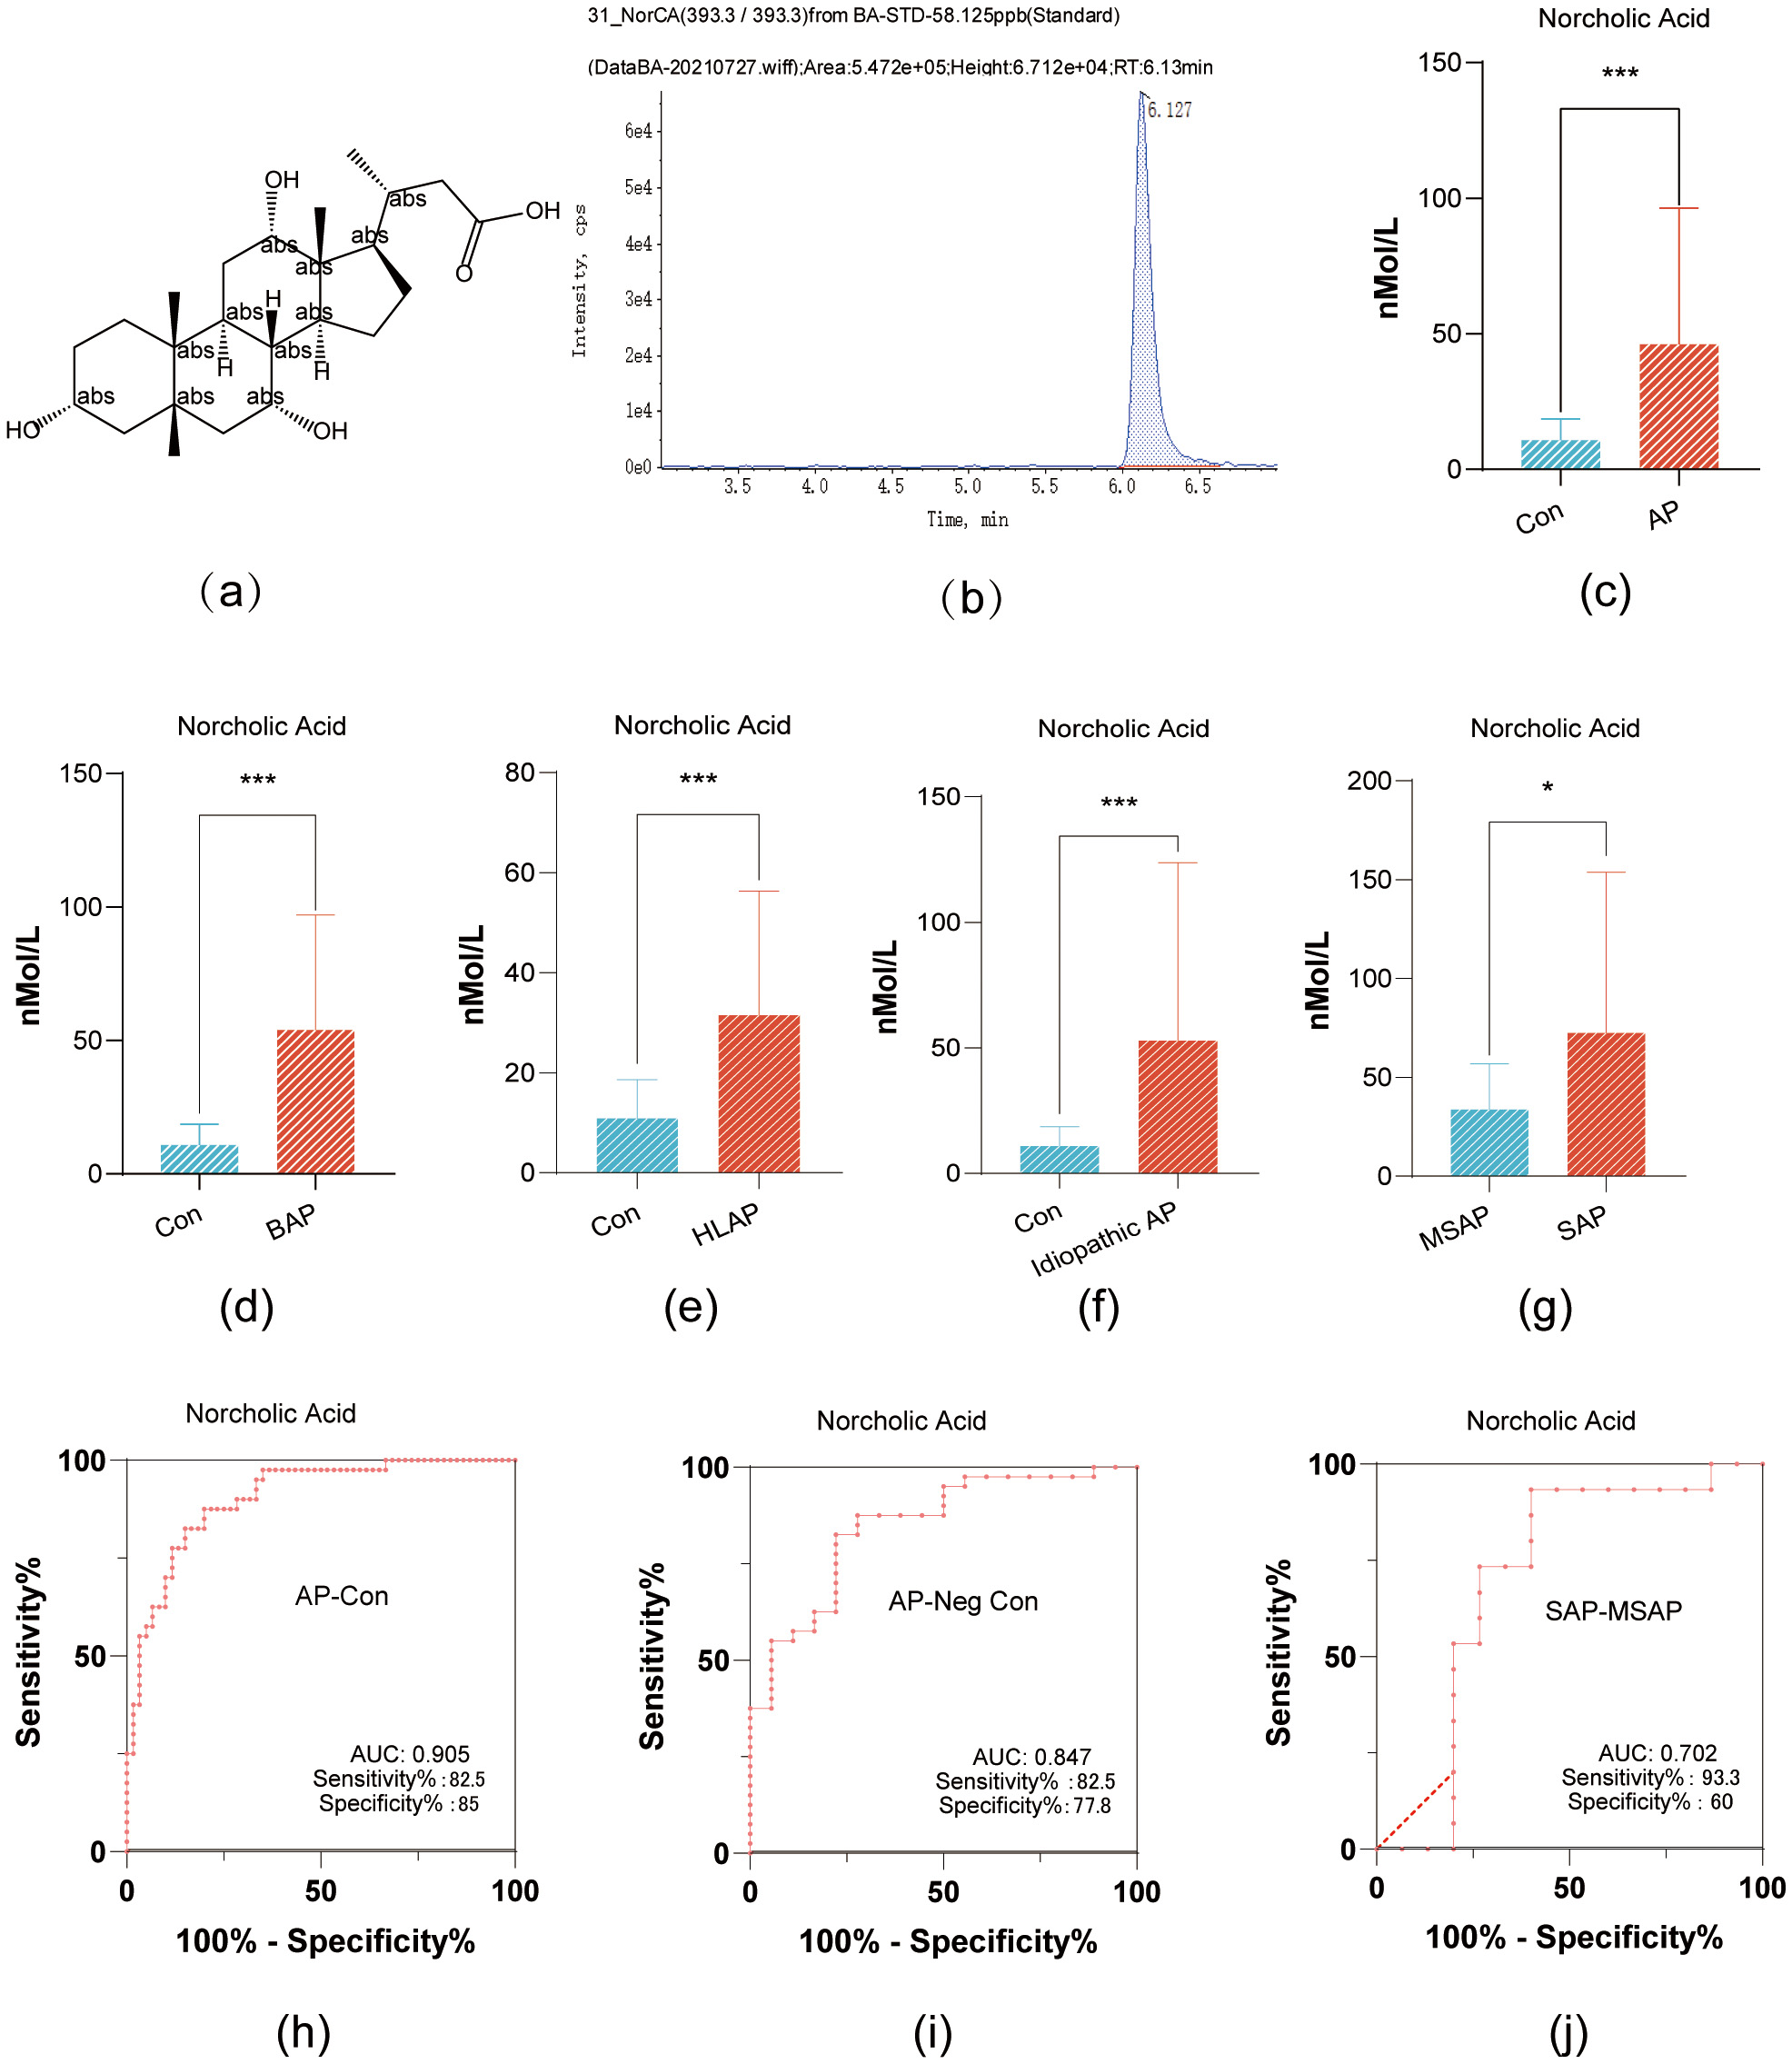
NorCA has a relative molecular weight of 394.5 g/mol, its molecular structure is
shown in Fig. 1a; and its structural formula is shown in Fig. 1a. In addition, the mass-to-charge ratio of the molecular ion during the
targeted detection was 393.3; this molecular ion exhibited the highest peak at a
retention time of 6.127 min (Fig. 1b). NorCA did not have any structural isomers
within the adjacent retention time, making it less prone to interference in peak
area calculations, and thus highly reliable for absolute concentration
quantification. NorCA demonstrated significant differential expression between
healthy controls and AP patients, as well as across AP subgroups (p
 Fig. 1.
NorCA Expression in Pancreatitis Variants and Its Diagnostic
Accuracy. (a) The chemical structure of NorCA. (b) The mass-to-charge ratio and
chromatographic separation time of molecular ions in NorCA. (c) Comparative serum
NorCA concentrations: AP patients vs healthy controls (bar graph). (d) BAP and
control serum NorCA quantification (bar graph). (e) Serum NorCA comparison: HLAP
vs healthy controls (bar graph). (f) Bar graph showing the difference in serum
NorCA levels between idiopathic pancreatitis and healthy controls. (g) Bar graph
showing the difference in serum NorCA levels between severe acute pancreatitis
(SAP) and moderately severe acute pancreatitis (MSAP) groups. (h) The area under
the ROC curve, sensitivity, and specificity of NorCA as a diagnostic biomarker
for AP. (i) The area under the ROC curve, sensitivity, and specificity of NorCA
for diagnosing AP patients with negative amylase. (j) The area under the ROC
curve, sensitivity, and specificity of NorCA for differentiating SAP and MSAP.
*p
To establish a cellular model of AP, we first induced RAW264.7 cells to differentiate from the M0 state to pro-inflammatory M1 macrophages by administering LPS (Supplementary Fig. 1a,b,d–f). Subsequently, we evaluated the cytotoxic effects of NorCA on the macrophages. We selected a concentration of 10 µg/mL of NorCA for this experiment because it had a minimal impact on cell viability (Supplementary Fig. 1c). At this concentration, flow cytometric analysis revealed markedly elevated CD86 and CD11c expression levels in NorCA-treated cells relative to LPS-only controls Fig. 2a–c). Quantitative RT-PCR analysis revealed significantly elevated mRNA expression of M1 macrophage markers CD86 and CD11c in the LPS + NorCA group compared to LPS-only controls (Fig. 2d,e). Protein imprinting analysis confirmed these results (Fig. 2f–h).
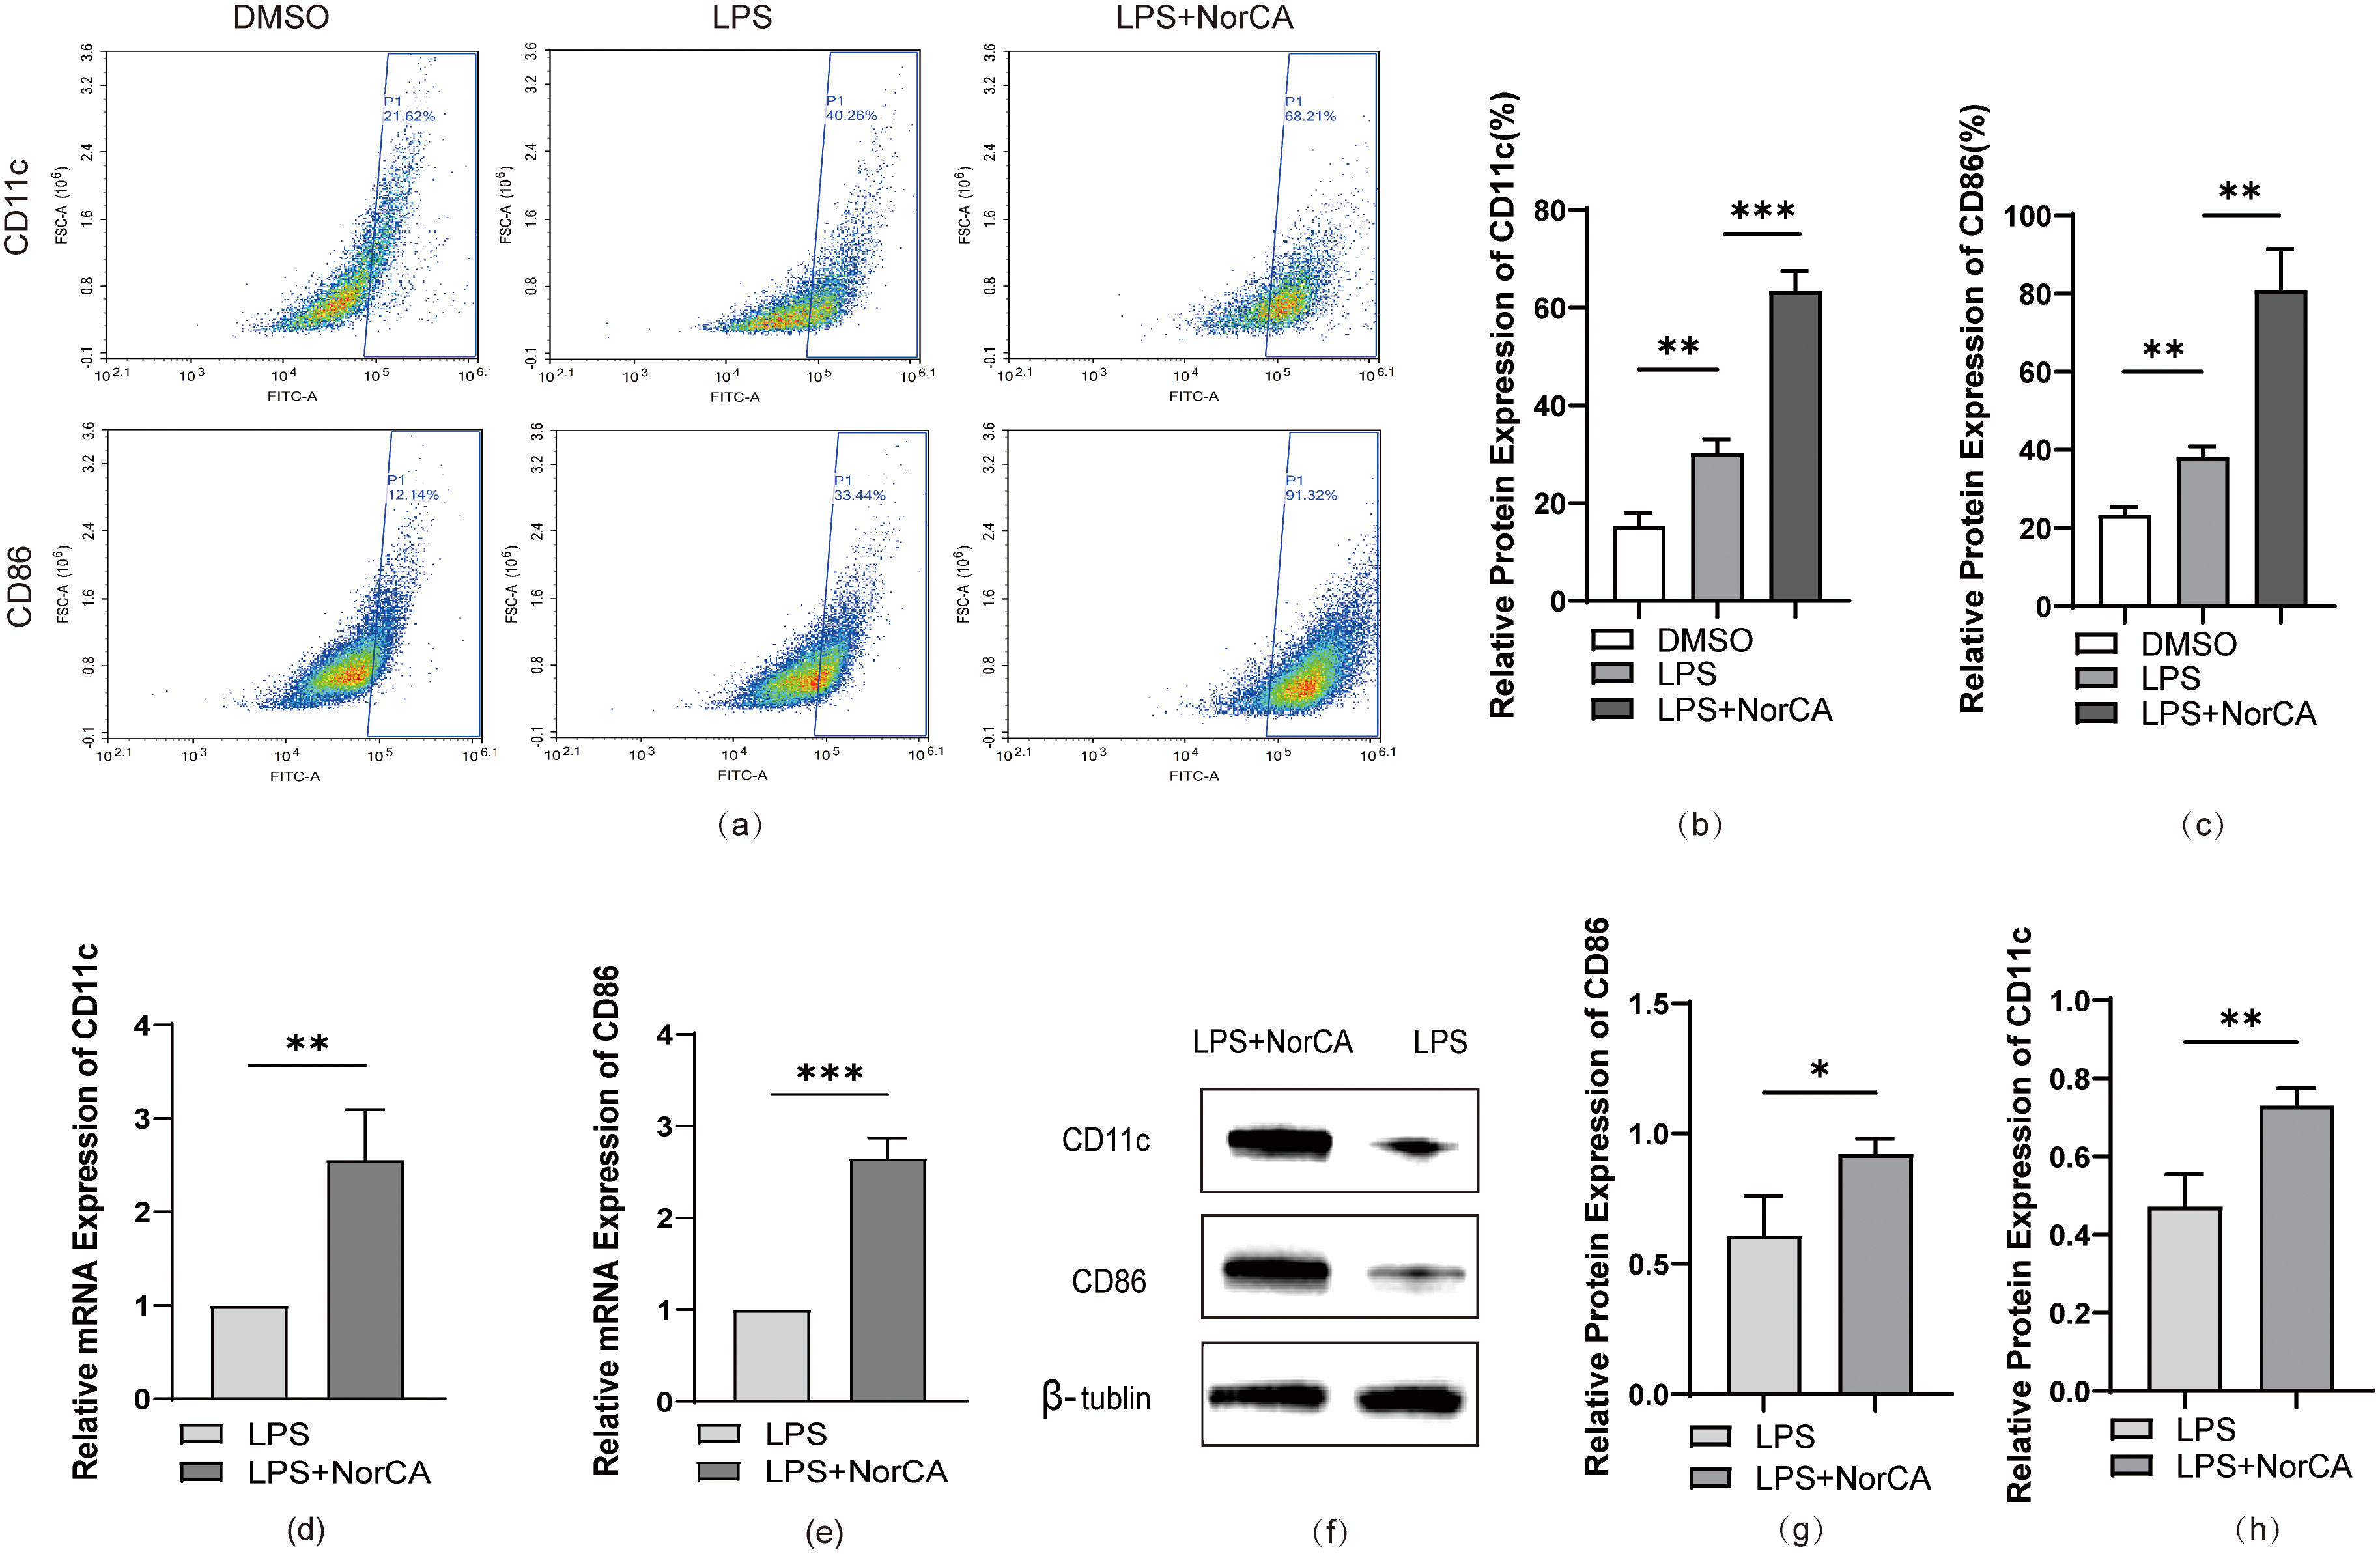 Fig. 2.
NorCA enhances LPS-induced M1 macrophage polarization. (a) Flow
cytometric analysis quantified CD86/CD11c expression in LPS and LPS + NorCA
groups. (b,c) Flow cytometry-derived CD86/CD11c expression in LPS vs LPS +
NorCA groups (bar graphs). (d,e) qRT-PCR analysis quantified CD86/CD11c
expression in LPS vs LPS + NorCA groups. (f–h) The expression levels of CD86 and
CD11c in the LPS group and LPS + NorCA group were detected by western blotting.
*p
Next, we analyzed the correlation between DEGs and the Wnt pathway based on
sequencing data from the LPS and LPS + NorCA groups. As shown in Fig. 3a, we first validated the differences in gene expression in the sequencing data
from RAW264.7 cells between the DMSO, LPS, and LPS + NorCA groups using PCA
(Principal Component Analysis). Next, we plotted a volcano plot (Fig. 3b) to
demonstrate the expression of DEGs between control and NorCA-treated groups. In
addition, we generated a heatmap (Fig. 3c) to visualize the extent of
the upregulation or downregulation of certain DEGs. Of these genes, CTNNB1, an
important gene encoding the Wnt pathway protein
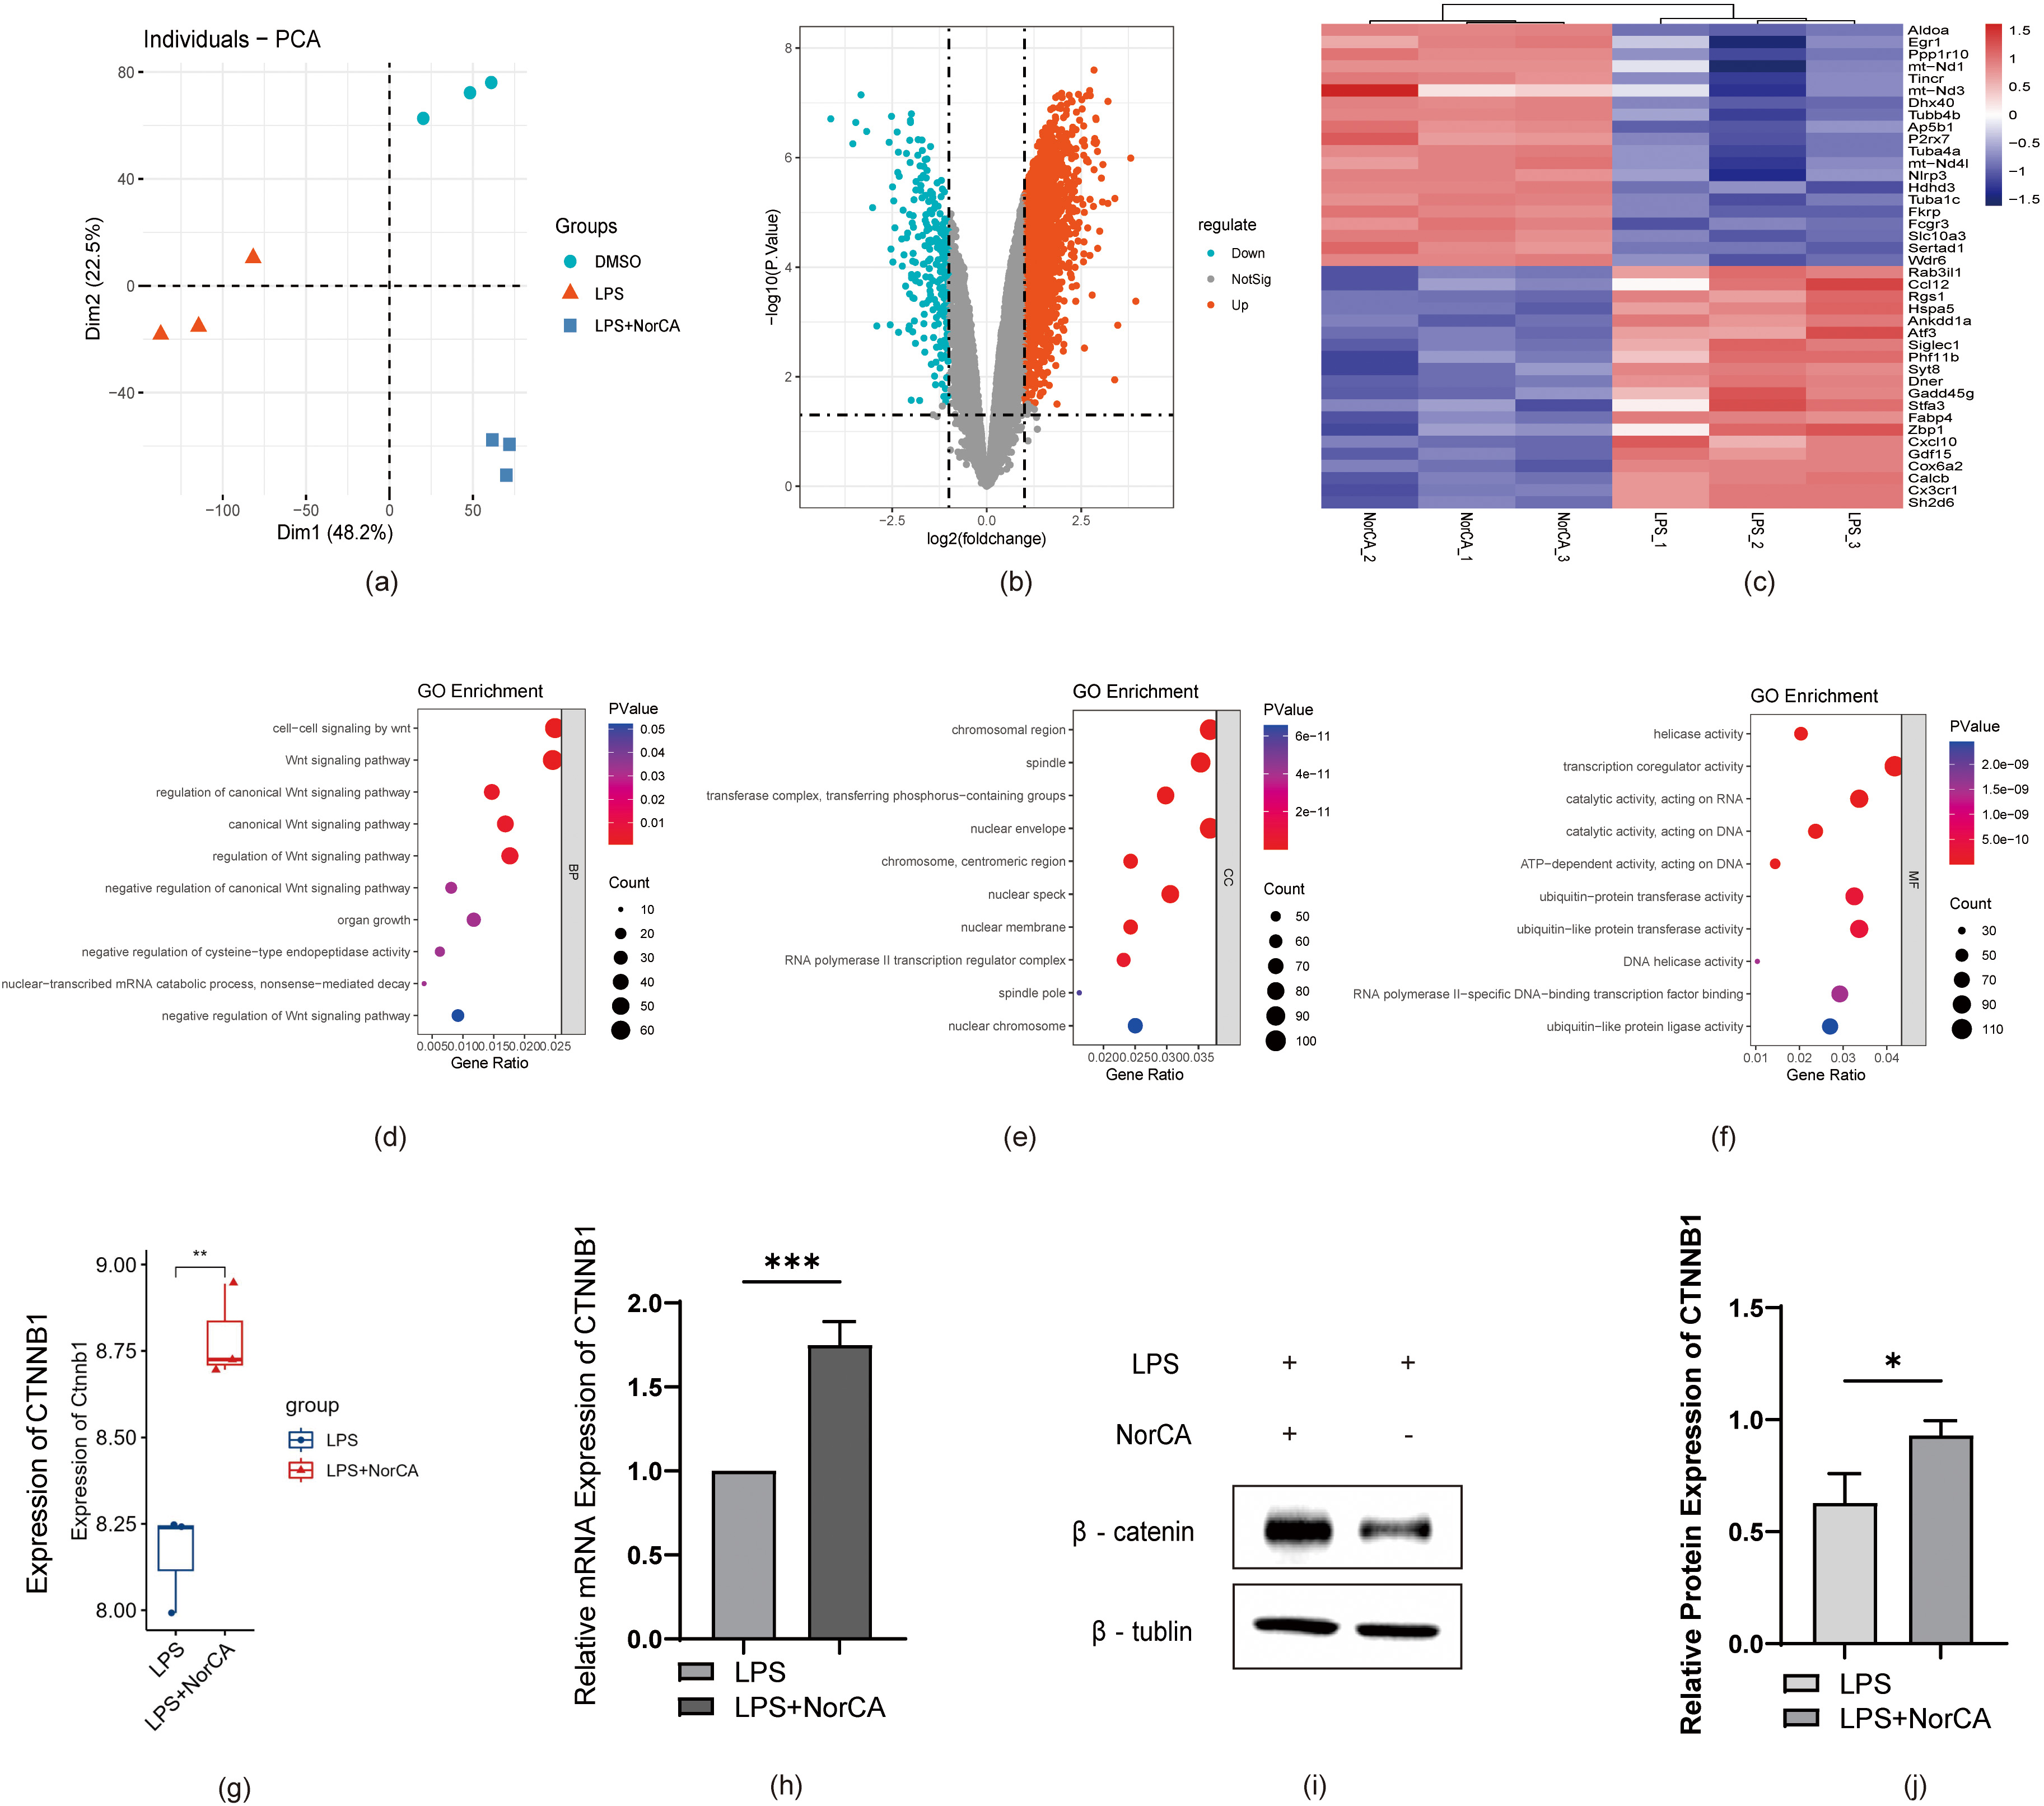 Fig. 3.
RNA-seq reveals Wnt-related gene alterations, with NorCA
activating Wnt/
Based on these findings, we conducted gene ontology (GO) term analysis of the
sequencing data, including biological processes (BPs) (Fig. 3d), cellular
components (CCs) (Fig. 3e), and molecular functions (MFs) (Fig. 3f). We
identified a significant enrichment of Wnt-related genes. These findings suggest
NorCA likely mediates pro-inflammatory responses in AP through canonical
Wnt/
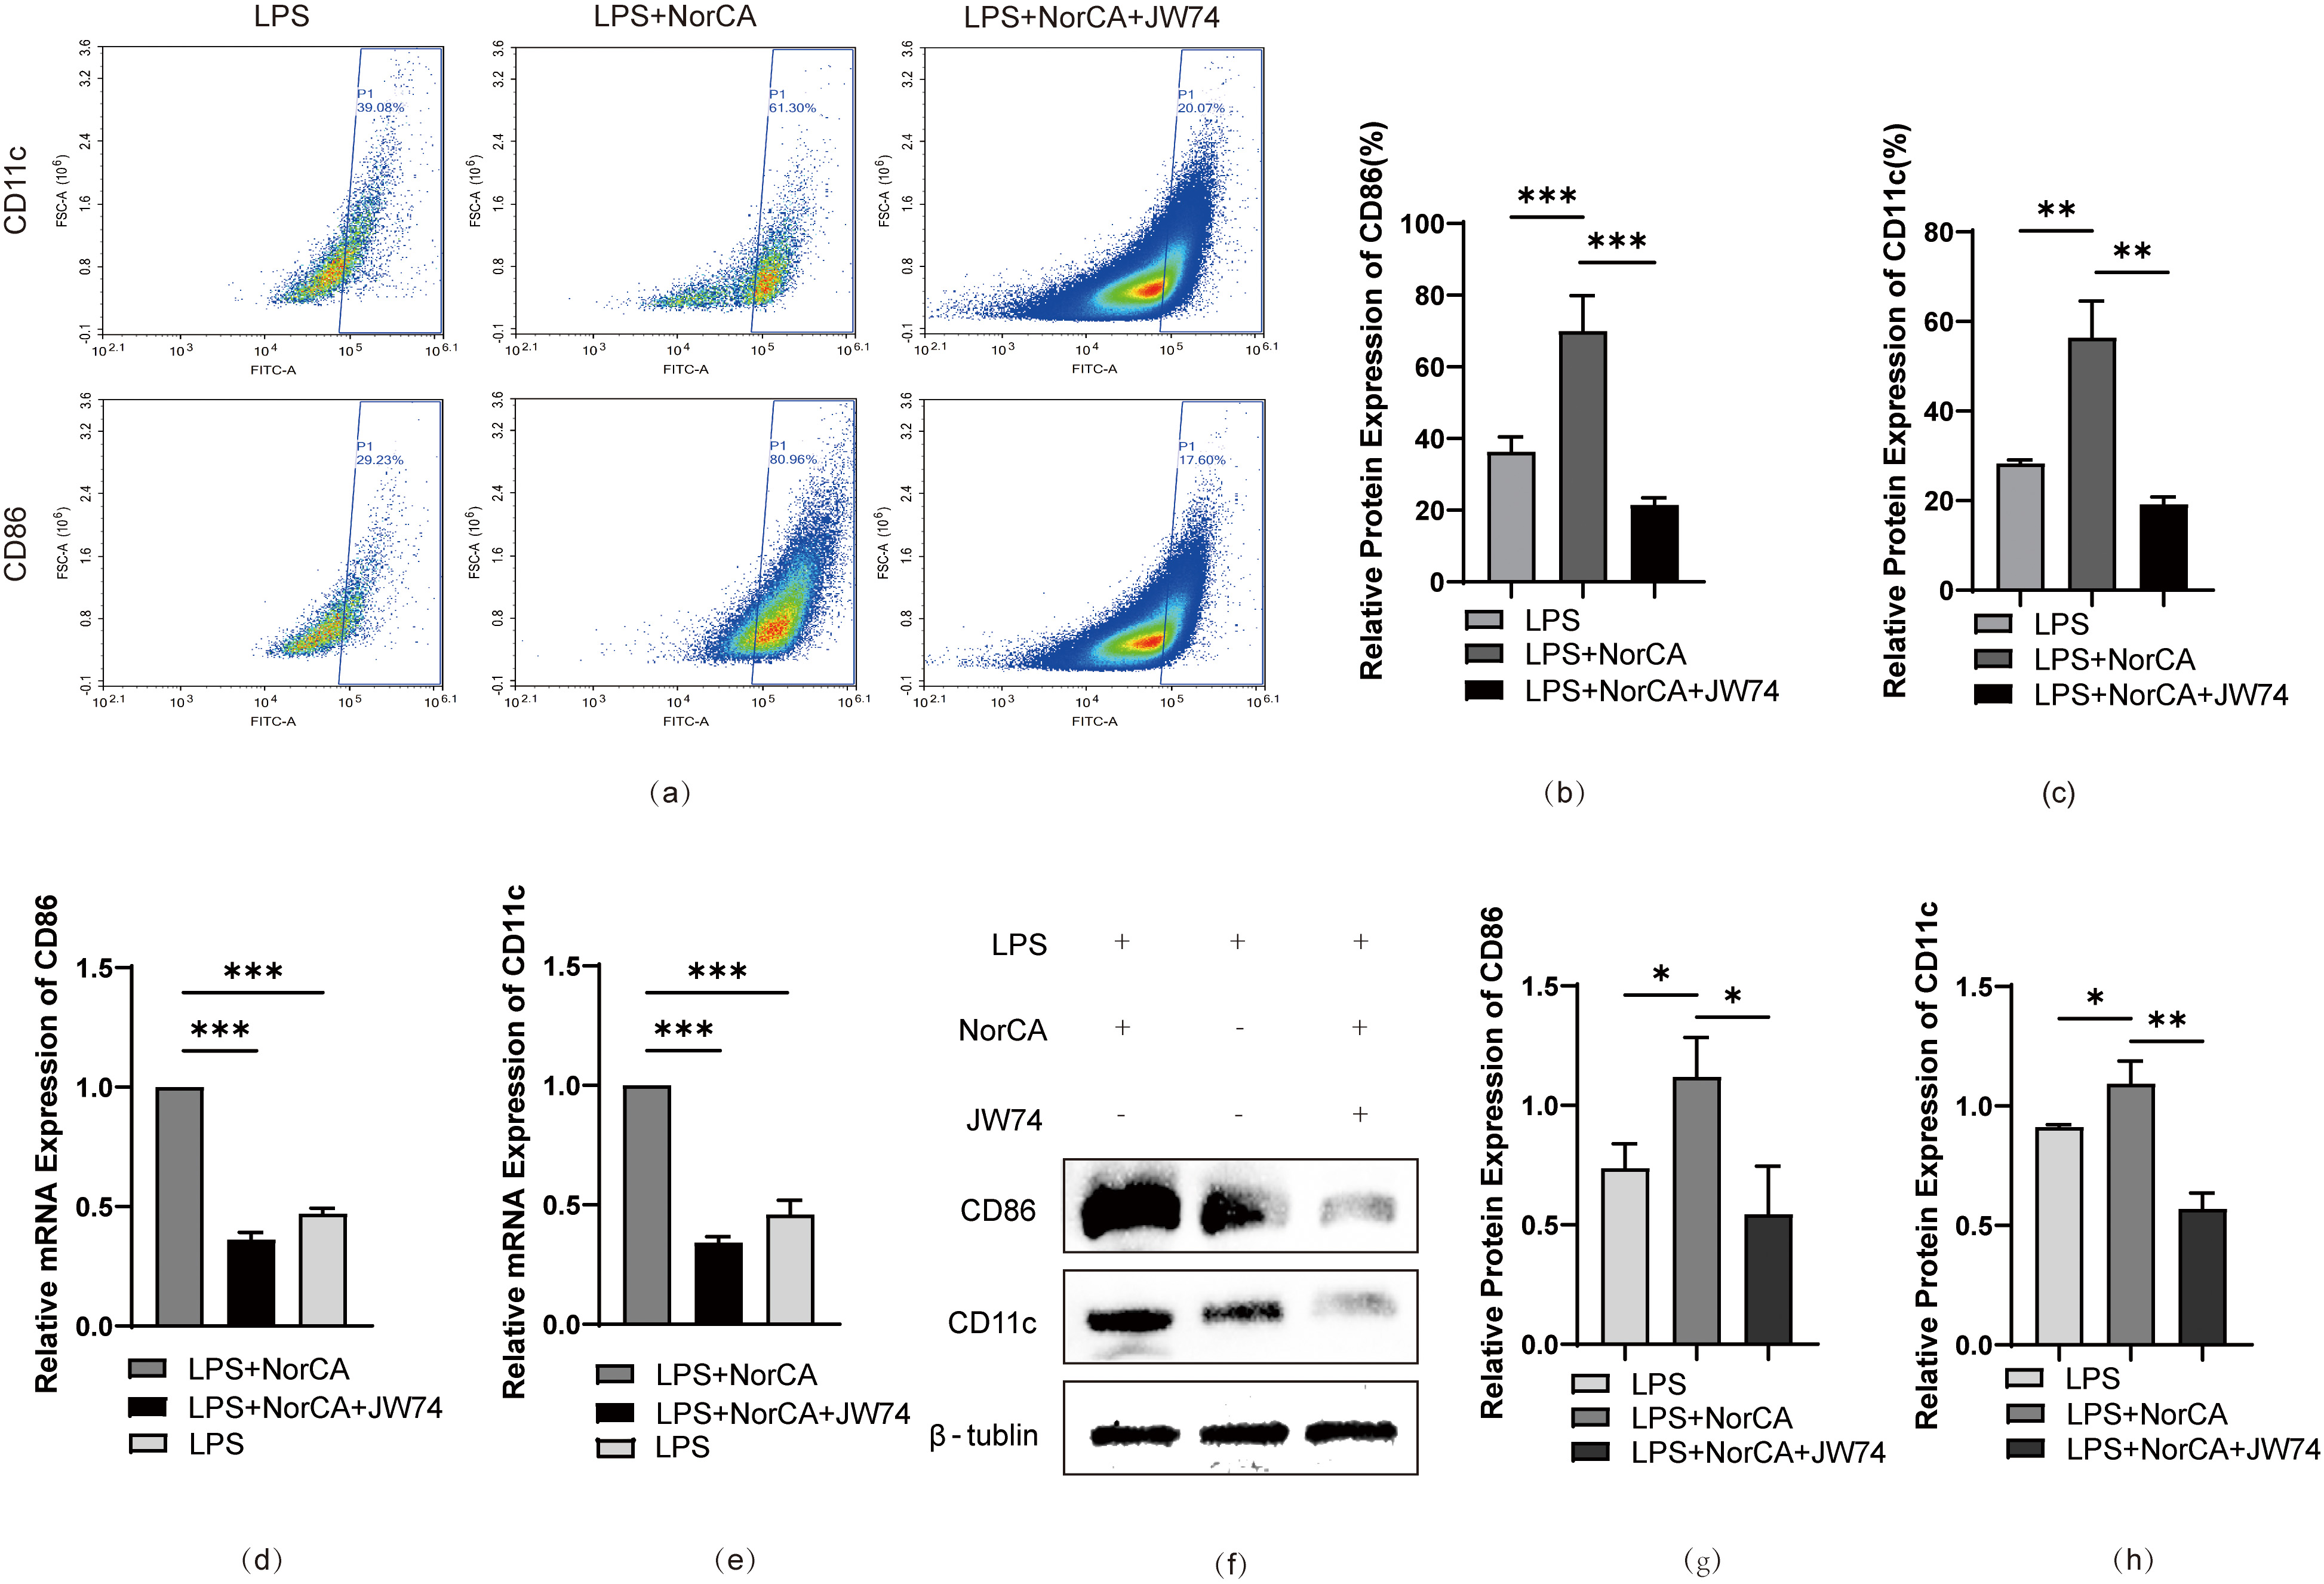
To validate our hypothesis, we added a specific Wnt/
 Fig. 4.
Inhibition of Wnt/
AP is a common, acute, and severe inflammation of the
digestive tract. Owing to the lack of early warning markers and effective
specific therapeutic targets, AP often leads to a poor prognosis. Therefore, a
thorough understanding of the pathological process of AP is of great research
significance and clinical value for accurate diagnosis, prevention, treatment,
and prognosis. In this study, we investigated the relationship between bile acid
metabolism disorders and the progression and severity of AP for the first time.
Our study results showed that NorCA is abnormally elevated in various types of AP
progression and exhibits high sensitivity and specificity as a clinical
diagnostic and prognostic marker for AP. Moreover, elevated levels of NorCA can
promote the polarization of M1 macrophages via the Wnt/
Bile acids (BAs) are metabolic products synthesized from cholesterol in the liver via both classical and nonclassical pathways [13]. Increasing evidence suggests that various types of BAs are closely associated with numerous digestive disorders, inflammation, and even tumors. Research has shown that patients with inflammatory bowel disease [14] experience varying degrees of BA metabolism disorders, which are also associated with a poor prognosis. The excessive accumulation of BAs in cells has cytotoxic effects and is considered to be one of the most important factors in tumor development. Furthermore, BA metabolic disorders can promote the occurrence of hepatocellular carcinoma associated with obesity and fatty liver [15]. NorCA, also known as nordeoxycholic acid, is a metabolite of BAs and belongs to the category of organic compounds containing trihydroxy bile acids, alcohols, and derivatives. NorCA is a highly selective and potent agonist of farnesoid X receptor (FXR). NorCA is biotransformed by bacteria in the intestine and primarily exists in the free form in the bile [16]. Furthermore, NorCA helps regulate various physiological processes in the human body, including bile acid metabolism, lipid metabolism, glucose metabolism, and inflammatory response. However, to date, researchers still have a limited understanding of the pathogenic effects of NorCA on the human body. In the 1970s, Almé et al. [17] detected and quantified NorCA in the urine of healthy controls and patients with congenital intrahepatic cholestasis. Subsequently, NorCA was found to be the major trihydroxy BA present in the urine of patients with liver cirrhosis, suggesting that elevated levels of NorCA may be associated with liver function failure [18]. In 1985, NorCA was discovered in patients with an extremely rare genetic disorder called cerebrotendinous xanthomatosis, which is characterized by the accumulation of cholestanol in various tissues, reduced bile acid synthesis, and excessive accumulation of cholesterol [19]. In recent years, elevated levels of NorCA have been detected in drug-induced liver injury (DILI), suggesting that NorCA may serve as a specific biomarker for predicting the severity of DILI [20, 21]. However, researchers are yet to investigate the significance of NorCA-related data and its effects and mechanisms in disease. However, a recent study showed that NorCA can promote the progression and escape of Hepatocellular Carcinoma (HCC) via negative feedback regulation of the FXR receptor [22], thus confirming the pathogenic effects and mechanisms of NorCA in the human body for the first time. Consistent with existing literature documenting NorCA upregulation in disease states, we observed statistically significant NorCA expression differences both between healthy controls and AP patients, and across AP clinical subtypes. Subsequent validation experiments established NorCA’s sustained upregulation of pro-inflammatory cytokines in M1-polarized macrophages, which exacerbated both AP progression and systemic inflammation. Analytical results identified NorCA as a key pro-inflammatory mediator contributing to AP pathogenesis, leading us to postulate its potential as a specific biomarker for AP severity and prognosis prediction.
The Wnt signalling pathway is a complex and widespread cellular signalling
pathway in the human body. The Wnt/
However, several limitations should be acknowledged in this study. First, the
experimental validation was exclusively performed in vitro, lacking
in vivo confirmation. Second, although we demonstrated that NorCA
modulates AP progression via the Wnt/
Collectively, our findings establish NorCA as a multifunctional mediator in
AP pathogenesis with both diagnostic and therapeutic
significance. Mechanistically, we provide compelling evidence that NorCA drives
AP progression through sustained activation of the Wnt/
The data that support the findings of this study are available upon reasonable request from the corresponding author.
DD and CL conceived of the experiments. XL, QZ, and JY conducted the experiments; LY, Jianshui L and QD performed the statistical analysis; Junning L performed figure generation. All authors contributed to editorial changes in the manuscript. All authors read and approved the final manuscript. All authors have participated sufficiently in the work and agreed to be accountable for all aspects of the work.
Informed consent for specimen collection was obtained from all patients or their legal guardians. The study was approved and overseen by the Ethics Committee of the Affiliated Hospital of North Sichuan Medical College (Approval Number: 2021ER133-1). All procedures were conducted in accordance with the principles of the Declaration of Helsinki.
The authors express their gratitude to EditSprings (https://www.editsprings.cn) for providing expert linguistic services.
This research was supported by the National Natural Science Foundation of China (Grant No.82300737) and the Office of Science and Technology of Nanchong (No. 22SXQT0110).
The authors declare no conflict of interest.
Supplementary material associated with this article can be found, in the online version, at https://doi.org/10.31083/FBL39259.
References
Publisher’s Note: IMR Press stays neutral with regard to jurisdictional claims in published maps and institutional affiliations.