


 , Dominick Benedetto 3,§, Tanmay Deshmukh 2
1 Department of Pathology and Lab Medicine, Rutgers, The State University of New Jersey, Piscataway, NJ 08854, USA
2 Optovibronex, LLC, Ben Franklin Tech Ventures, Bethlehem, PA 18015, USA
3 Center for Advanced Eye Care, Vero Beach, FL 32960, USA
§These two authors had voluntary appointments in Translational Ophthalmology Department at Wills Eye Hospital in Philadelphia.
Abstract
Keratoconus (KC) is a corneal disease that causes changes in corneal topography, leading to central/paracentral cone formation, which affects visual acuity.
We studied in vivo optical coherence tomography (OCT) images of normal and KC corneas images. The relative cellular and collagen content in the control and KC human corneas was measured by collecting OCT images and then dividing the images into low (green), medium (blue), and high pixel intensity (red) subchannel images. The green image was used to evaluate the cellular content in the cornea, the blue image presented information on the collagen content, and the red image provided information on both the cellular and collagen contents.
These results suggest that the cellular and collagen contents decrease with increased corneal depth in KC, while the collagen content appears to reduce as changes in the keratocyte content occur.
This study proposes that using the green, blue, and red subchannel OCT images may be an effective method for detecting KC and other corneal diseases earlier, before observing changes in corneal topography, and that these images can be collected remotely using telemedicine.
Keywords
- epithelial cells
- keratocytes
- collagen
- keratoconus
- OCT
- pixel intensity
- OCT channel subchannel images
Keratoconus (KC) is a progressive corneal disease characterized by changes in curvature and corneal (ectasia) thinning, often leading to visual impairment due to the formation of cones in the central/paracentral regions [1]. Morphological changes in collagen fibers, such as interlamellar alterations and slippage, may explain stromal thinning in eyes with KC [2]. Other observed changes include lower lysyl oxidase enzyme levels for collagen crosslinking, changes in proteoglycans, and increased collagenolytic activity [3]. These ultrastructural abnormalities are associated with modified tissue elastic stiffness and reduced mechanical stability [4]. The detection and use of biomechanical alterations in the elastic modulus have been hypothesized as an early diagnostic criterion for KC [5, 6].
Vibrational optical coherence tomography (VOCT) represents a novel, noninvasive, and nondestructive technique that has been used to analyze the biomechanics of different tissues and materials, such as skin, muscle, nerve, vessel walls, tendon, cartilage, and cornea [6, 7, 8, 9, 10, 11, 12]. We have used VOCT to study the biomechanical properties of human and porcine corneas in vivo and in vitro. These studies indicated that the limbus–corneal junction is important in preventing corneal slippage, folding, and cone formation in vivo [6, 7, 11]. Machine learning studies have demonstrated that Bowman’s membrane contributes to the 110 Hz resonant frequency peak, such as in the collagen fibrils in the anterior corneal lamellae [11]. Moreover, finite element models of normal and KC corneas suggest that the highest corneal deformation is in the central zone and is higher in KC corneas than in normal controls, and leads to central/paracentral cone formation [11]. These results suggest that cone formation in KC corneas occurs centrally/paracentrally, at the point of maximum curvature where the stress concentration is highest, even though collagen fibril slippage appears to happen at the limbus–collagen junction [7, 11].
VOCT and machine learning results are consistent with the largest loss in the elastic modulus occurring in the KC central/paracentral region [11]. The elastic modulus loss in the central/paracentral KC region is partly compensated by increased stiffness in the lower KC cornea [6, 7, 11]. This paper reports preliminary pixel intensity versus depth information to analyze the relative cellular and collagen content changes in control and KC corneas. These results suggest that loss of cells and collagen in the corneal lamellae promotes a reduction in optical coherence tomography (OCT) image pixel intensity observed in all stages of KC. However, using OCT green, blue, and red channel sub-images may be a rapid screening test for determining the onset of KC.
In vivo OCT images were collected for 20 normal control eyes and 20 eyes from subjects diagnosed with Stage I, II, III, and IV KC using a modified Lumedica Labscope 2.0 (Durham, NC, USA). The Labscope was modified to scan the OCT images and convert them into pixel intensity versus depth plots. IRB approval was obtained from Wills Eye Hospital, and informed consent was obtained from patients or their legal guardians as described previously [4, 7, 8]. Eyes from patients exhibiting different stages of KC were studied: Stage I (n = 2), Stage II (n = 9), Stage III (n = 3), and Stage IV (n = 8) (Table 1). None of the patients underwent collagen crosslinking before undergoing the measurements. Meanwhile, the measurements were performed by centrally focusing the infrared light beam while the subject looked forward.
| Number of samples | Posterior radius of curvature (mm) | Thickness (mm) | |
| Control | 20 | 6.71 |
0.538 |
| KC Stage I | 2 | 5.80 |
0.519 |
| KC Stage II | 9 | 5.51 |
0.505 |
| KC Stage III | 3 | 5.07 |
0.506 |
| KC Stage IV | 8 | 4.29 |
0.469 |
KC, keratoconus.
Corneal images were collected using a Lumedica Labscope 2.0 as described previously [4, 7, 8], operating at a wavelength of 840 nm. As reported previously [12], all OCT images were scanned through the cornea cross-section, parallel to the surface curvature, to create pixel intensity versus depth profiles. These images were color-coded and subdivided into low (green), medium (blue), and high (red) pixel intensity images to locate the cell and collagen positions, as described previously [12]. The OCT images were color-coded for better visual observation based on the pixel intensity to enhance image details for visual analysis [4, 7, 8, 12]. In addition, low intensity (green scale), medium intensity (blue scale), and high intensity (red scale) subchannel images were constructed by subdividing the gray scale images using the lookup table presented in Table 2 [12]. The color-coded OCT images were split into green, blue, and red subchannels by applying digital image processing algorithms based on the distribution of pixel intensities (Table 2). Since a combination of red, green, and blue colors in varying intensities can produce all the colors in the color-coded image, the image processing algorithms can map the green, blue, and red components of each pixel. The green image reflects the cellular components, while the blue provides an idea of the locations of the collagen components, and the red channel presents information on both the cells and collagen, as described previously for skin [12]. Furthermore, it is possible to examine the differences in the reflection potential of the different corneal layers by breaking the total image into the differences in pixel intensity distribution at each point. The change in cells or collagen fibers is reflected in the pixel intensity changes in the various corneal components.
| Greyscale value | Red channel | Green channel | Blue channel |
| 0 | 0 | 0 | 0 |
| 50 | 104 | 0 | 221 |
| 100 | 201 | 7 | 78 |
| 150 | 255 | 129 | 0 |
| 200 | 255 | 219 | 0 |
| 255 | 255 | 255 | 255 |
OCT, optical coherence tomography.
The slopes in the pixel intensity versus depth plots were compared using an
unpaired Student’s t-test. A p-value
Fig. 1 shows typical OCT color-coded images of control (A), Stage II (B), and Stage IV (C) KC corneas. The locations of the epithelium, Bowman’s layer, corneal lamellae, and Descemet’s membrane are marked on the images. Notably, the yellow and pink areas in the posterior regions of the Stage II and IV KC corneas were decreased compared to the control. Based on prior skin and skin lesion studies [9, 10, 12], the yellow and pink areas represent reflected light from cells, and the blue regions illustrate reflected light from the collagen fibrils.
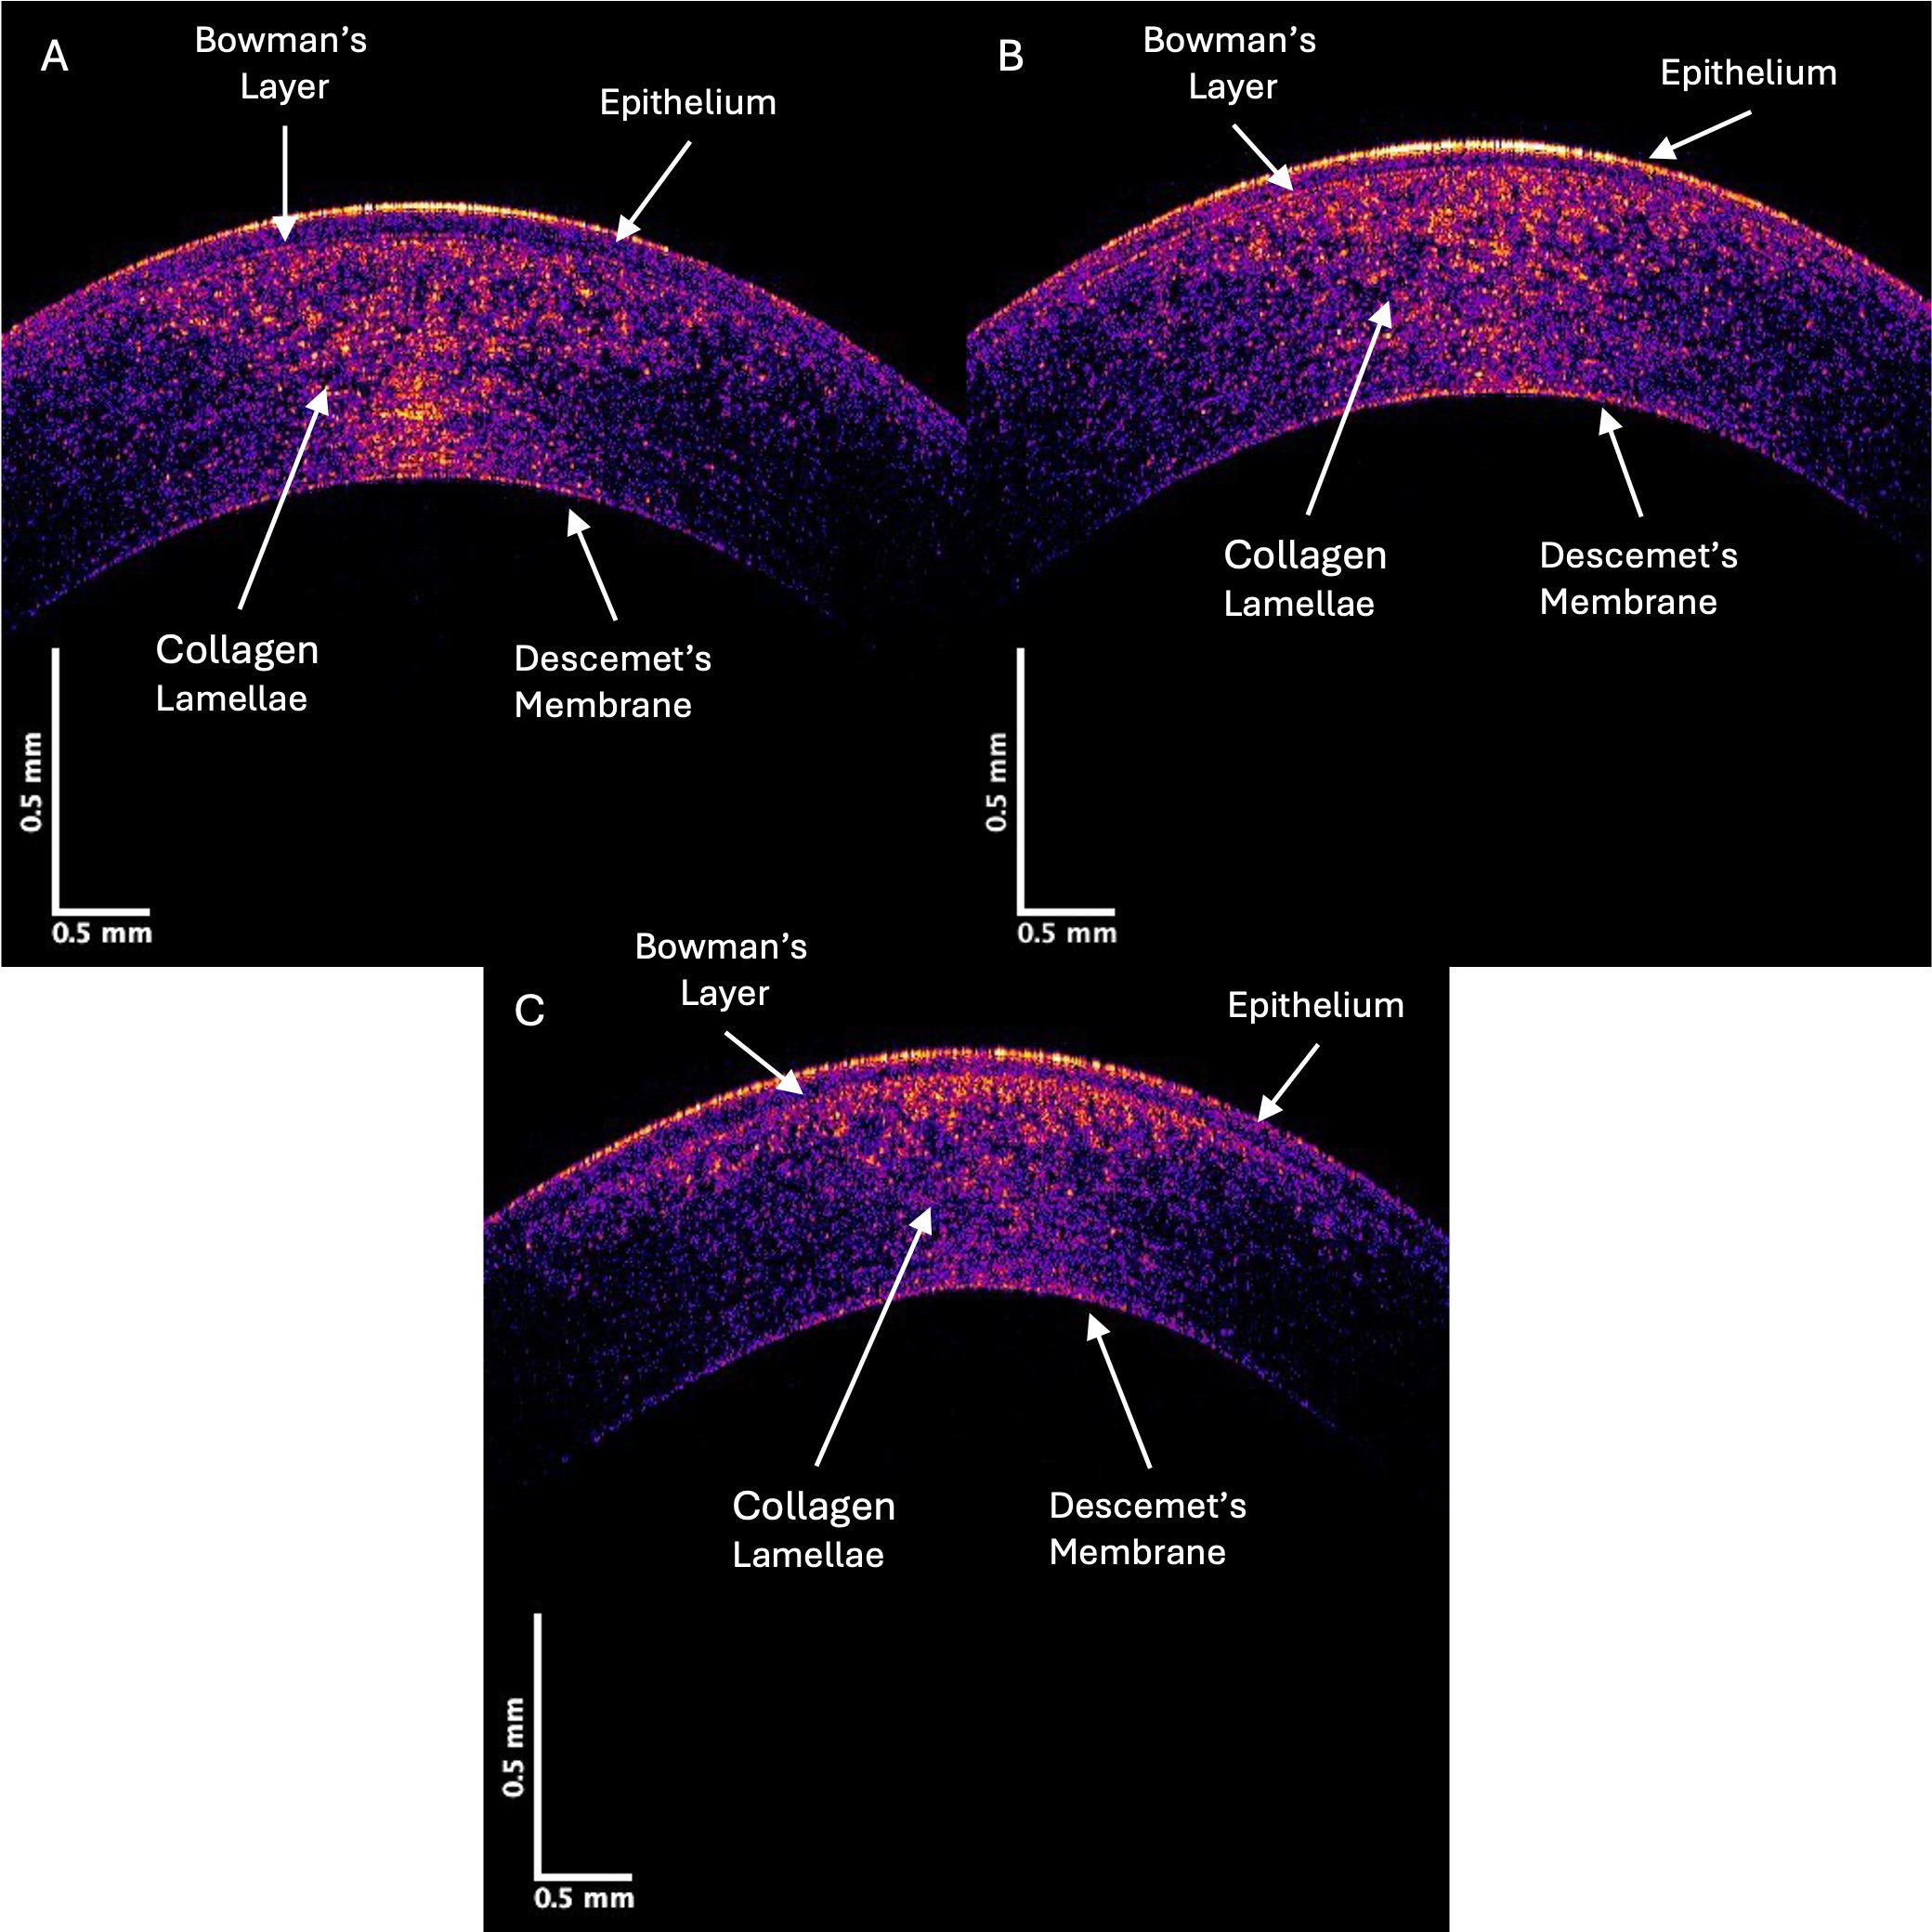 Fig. 1.
Color-coded OCT image of typical control (A), Stage II (B), and Stage IV (C) KC central corneas. Note the qualitative decrease in the yellow, pink, and blue intensities in regions in the Stage IV image compared to the control, which indicates a loss of cells (yellow and pink) and collagen fibrils (blue).
Pixel intensity versus depth plots are obtained when the OCT images are scanned parallel to the corneal surface. Fig. 2 (left) plots the pixel intensity versus depth for typical control, Stage II, and Stage IV KC corneas. Meanwhile, Fig. 2 (right) illustrates the location of the epithelium, Bowman’s layer, the corneal lamellae, and Descemet’s membrane with arrows. Note that the drop in pixel intensity versus depth for the Stage IV KC cornea is more rapid than for the control and Stage II corneas, especially at corneal lamellae depths greater than 0.1 mm. This suggests that the density of reflective components (cells and collagen) decreases in the KC cornea as the disease progresses. If a straight line approximates the initial slope of the pixel intensity versus depth plot, the slopes of the specimens from Stages I and II and Stages III and IV corneas are compared, as shown in Table 3. The statistical analyses, which present the standard deviations and p-values, illustrate that the initial slopes for KC corneas from Stages I and II and Stages III and IV are significantly higher than those of the controls. This indicates a loss of cells and collagenous components, which are associated with the progression of KC.
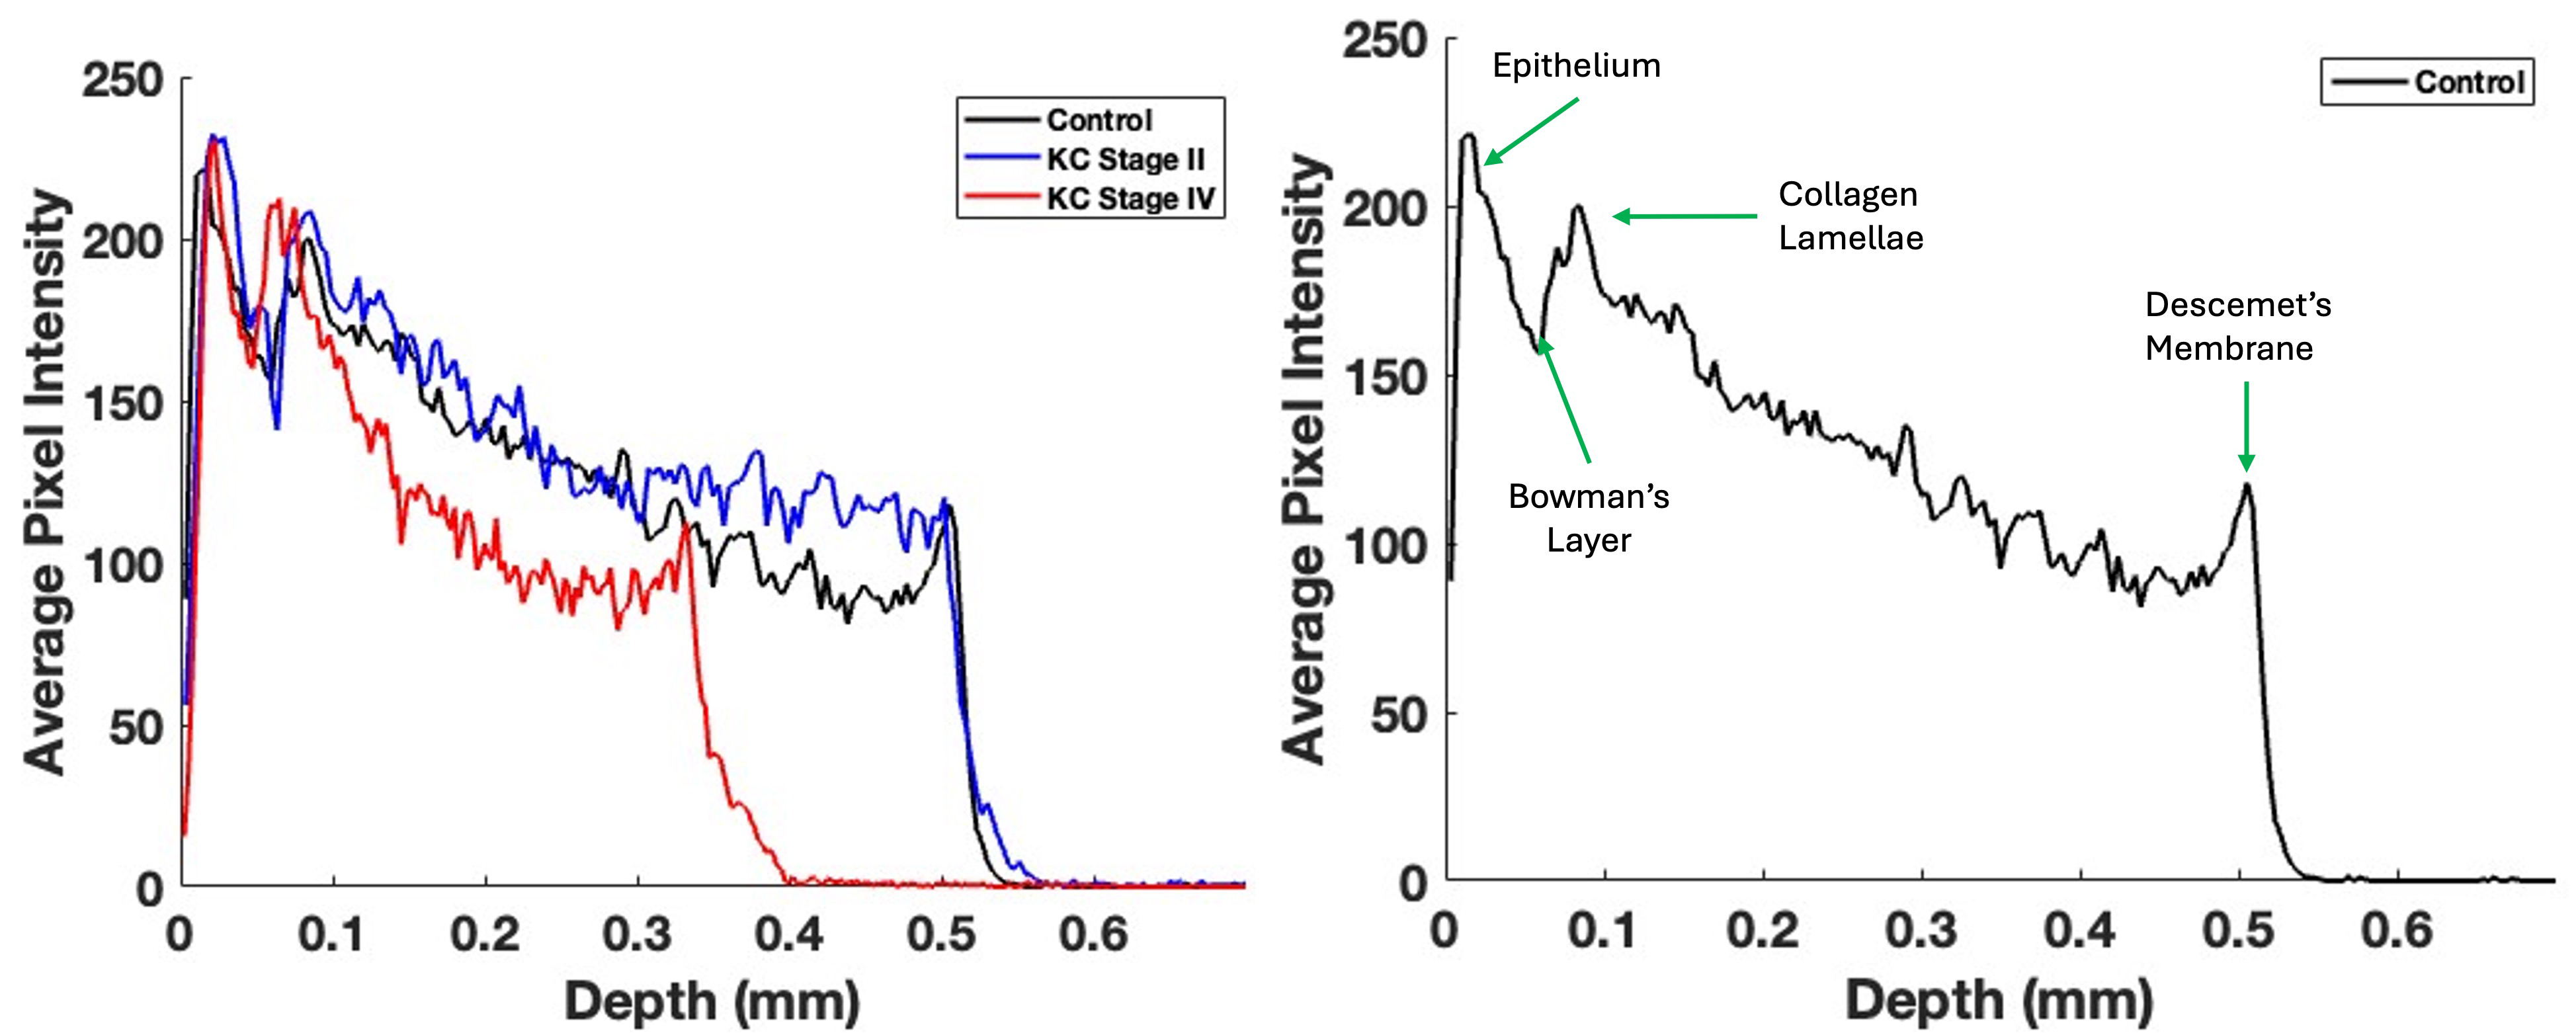 Fig. 2.
Typical central cornea pixel intensity versus depth plots for control, Stage II, and Stage IV KC corneas (left); this image is based on Fig. 1. Note that the pixel intensity concerning the depth of Stage IV corneas reduces more rapidly than the control and Stage II corneas. The mean slopes for Stages I and II and Stages III and IV KC corneas are significantly different from those for the control (Table 3). The mean slopes of Stages I and II and Stages III and IV are not statistically different (Table 2). The plot on the right presents arrows indicating the locations of various components in the cornea.
| Sample | Number | Slope (SD) | p-value vs. control | p-value vs. KC Stages I and II |
| Control | 20 | –440.704 (95.20) | - | - |
| KC Stages I and II | 11 | –598.14 (167.97) | 0.006 | - |
| KC Stages III and IV | 8 | –714.23 (119.22) | 0.04 |
p = 0.08 for comparisons between Stages I and II and Stages III and IV.
The control and KC cornea images were compared when the grayscale images of the control and KC corneas were separated into individual low (green), medium (blue), and high (red) pixel intensities. Fig. 3 shows the OCT images of the central cornea green channel in typical control (A), Stage II (B), and Stage IV (C) KC corneas. Note the decreased green channel pixel intensity in the posterior central cornea compared to the control and Stages III and IV corneas (Fig. 3).
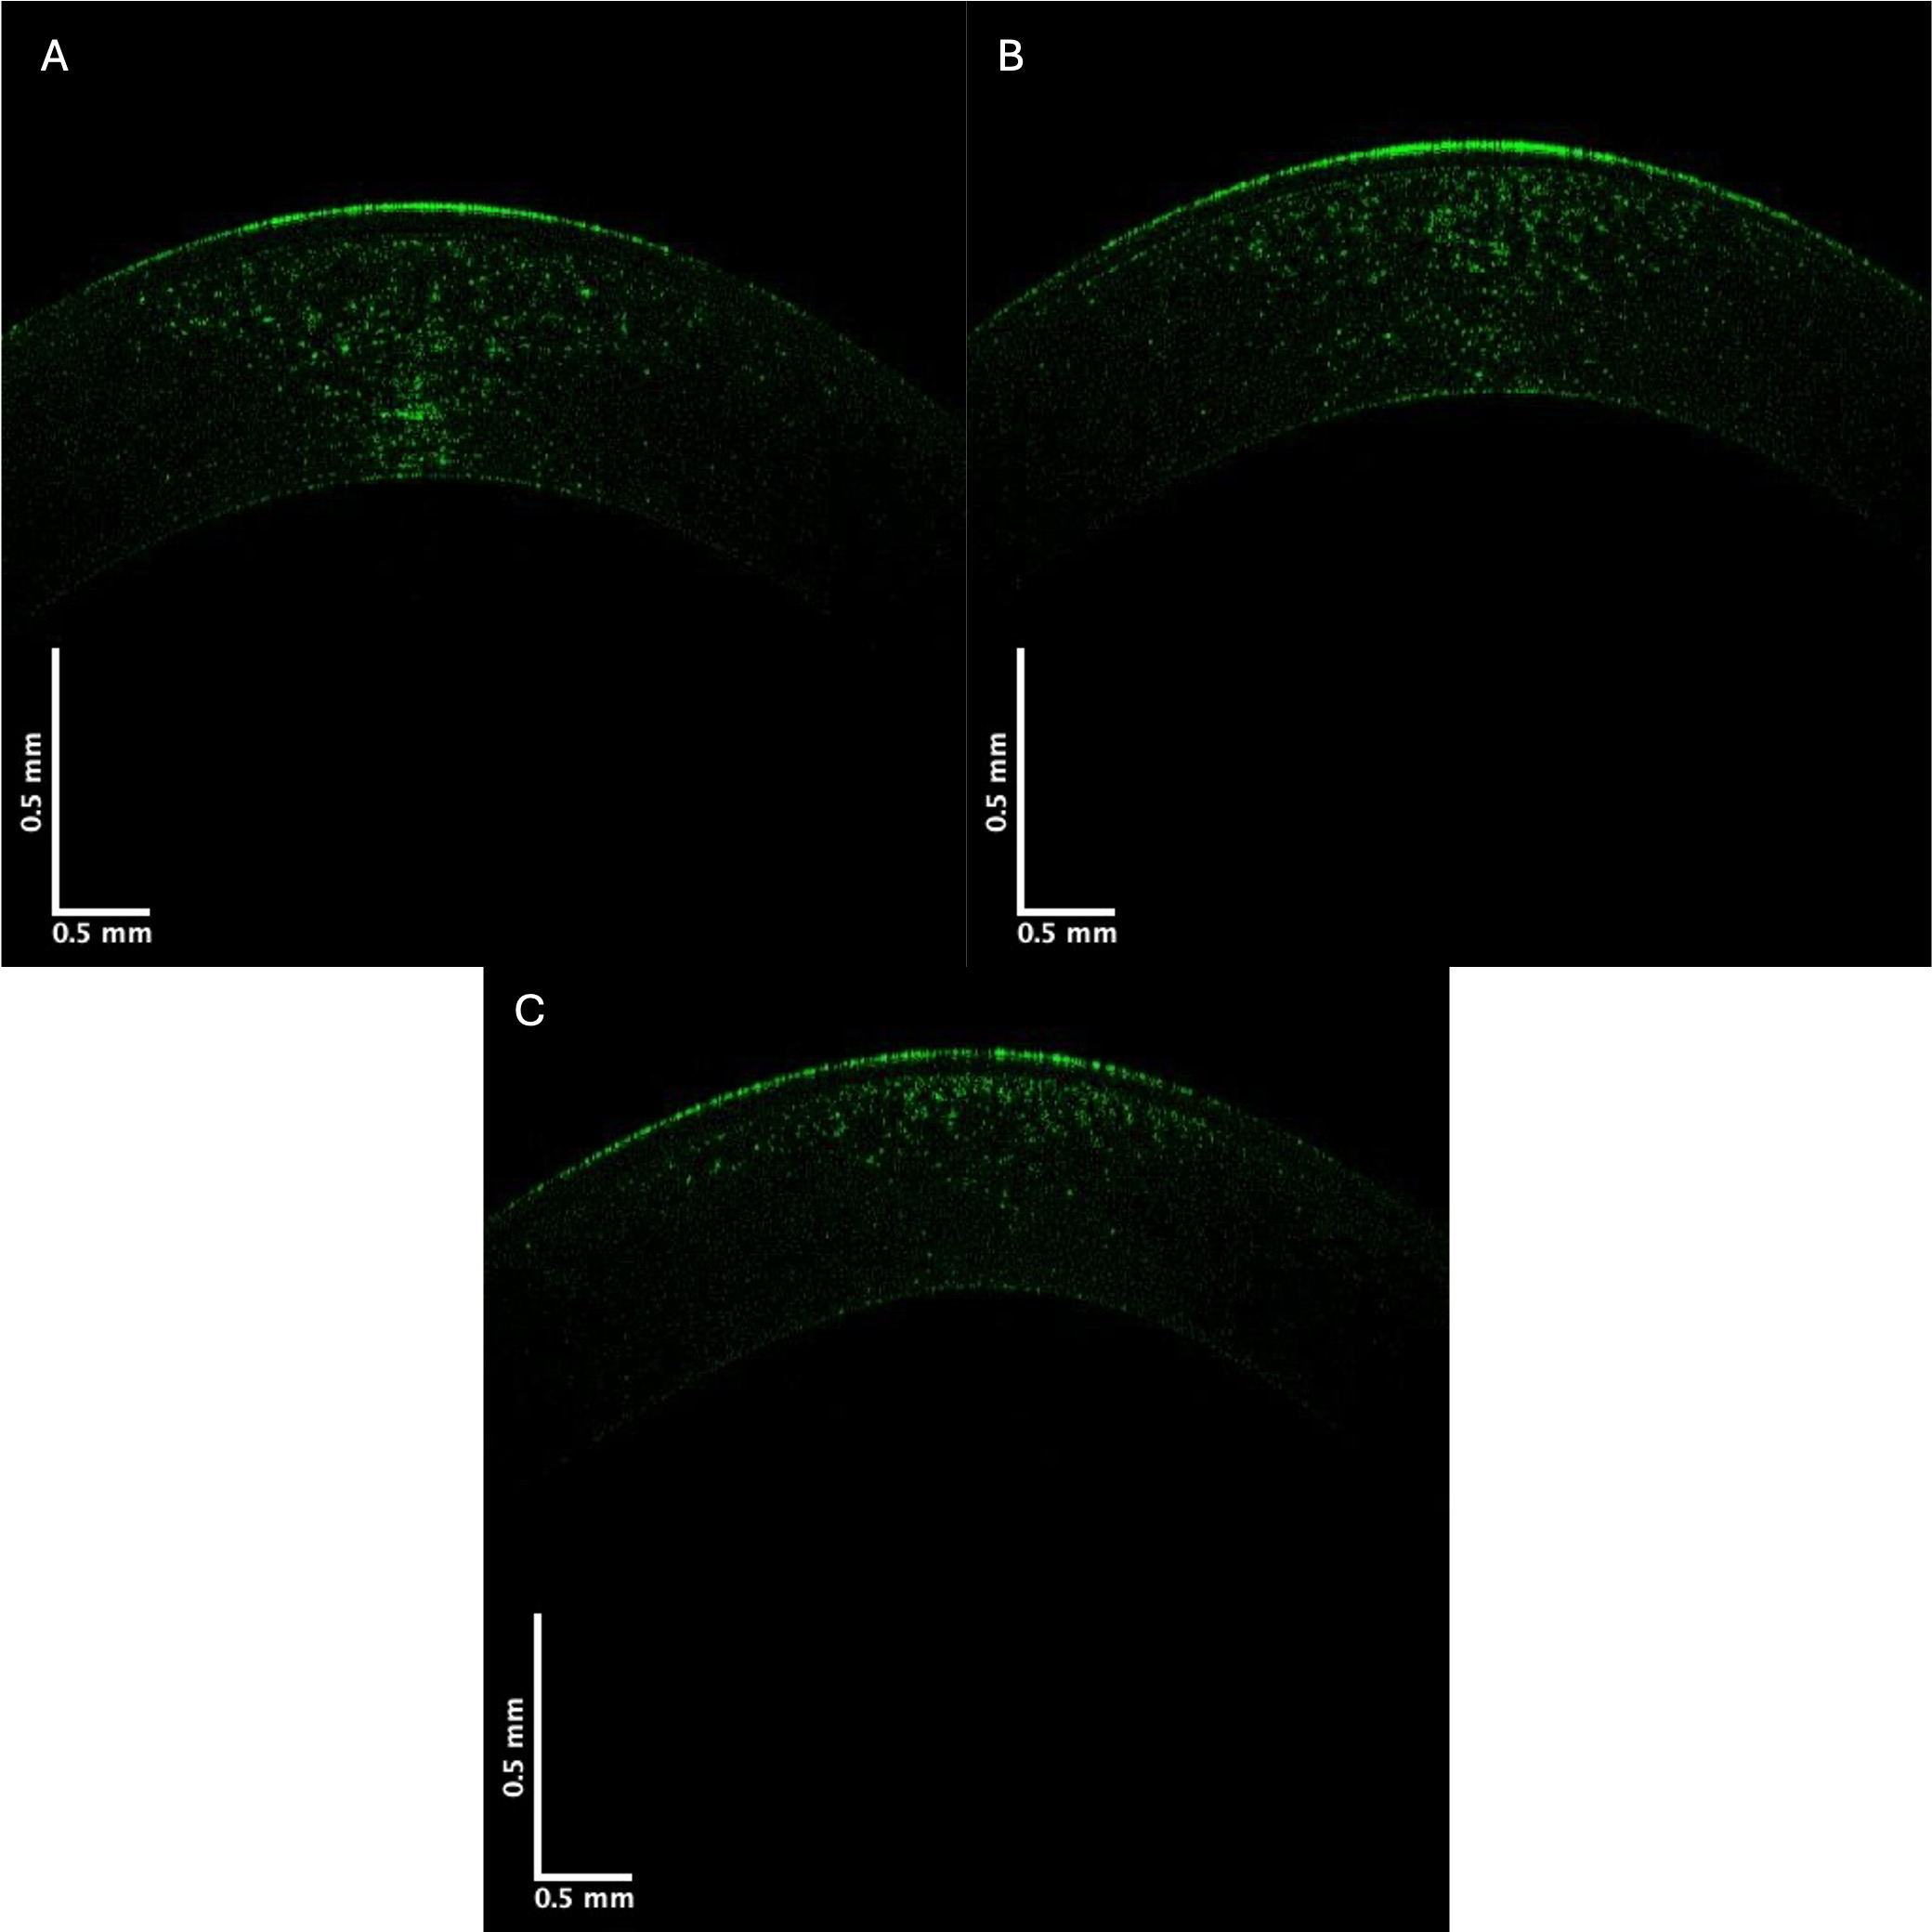 Fig. 3.
Typical green central cornea subchannel images of control (A), Stage II (B), and Stage IV (C) KC corneas. Note the apparent decreased pixel intensity in the posterior region of the corneas in Stages II and IV KC, which suggests a loss of cells (keratocytes) in the posterior cornea.
Pixel intensity versus depth plots for the green channel are shown in Fig. 4. Previous studies on skin demonstrated that the green channel represents the low-intensity cellular contribution to the reflected light [12]. The images in Fig. 4 show that the decreased cellular contribution, presumably of the keratocytes, to the green image decreases in KC.
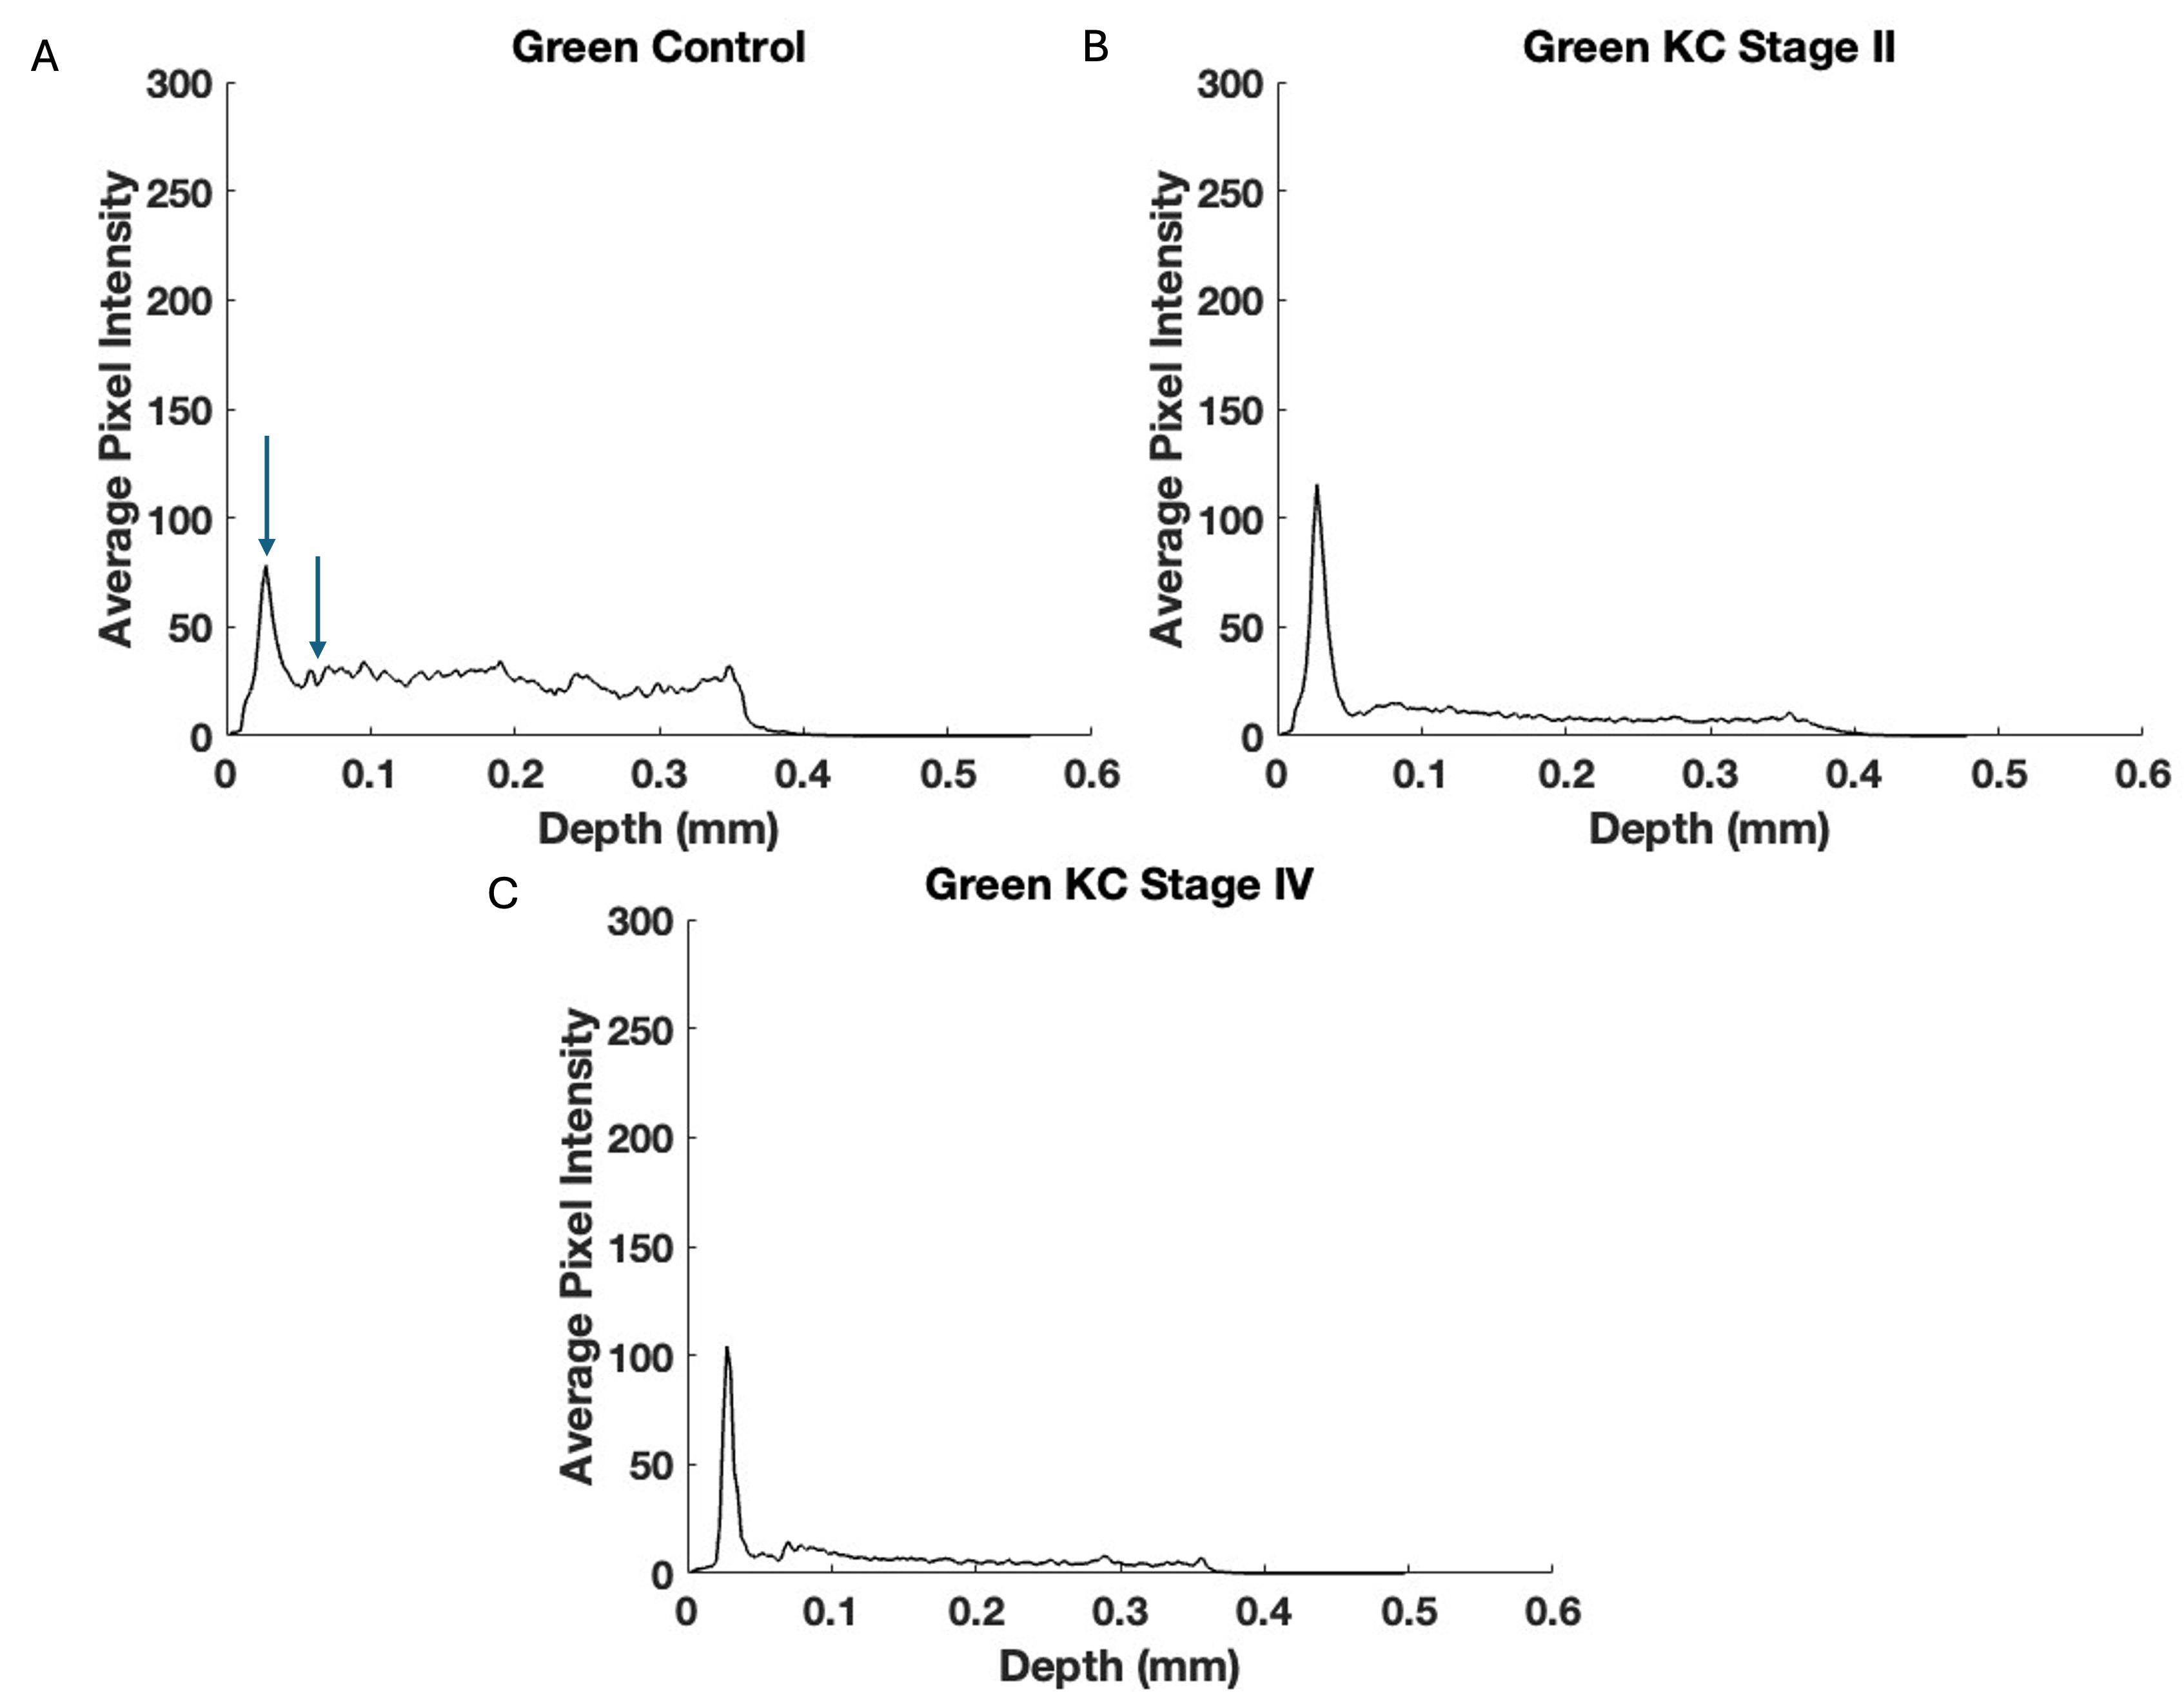 Fig. 4.
The pixel intensity versus depth of the central cornea green channel for control (A), Stage II (B), and Stage IV (C) KC corneas—based on Fig. 3. Note the decreased pixel intensity at depths below 0.1 mm in Stages II and IV in the KC plots suggesting a decrease in the number of keratocytes in posterior corneas. Arrows indicate the points between which the slope was calculated.
The decrease in the initial slope of the pixel intensity versus depth plot for
the green channel of Stages I and II KC corneas was statistically greater than
that of the control. In contrast, the corneas of Stages III and IV were not
statistically different in the data presented in Table 4. These data suggest that
the cellular content of the anterior corneas decreases rapidly in the early
stages of KC. Table 5 illustrates the pixel intensity of the green channel at a
depth of 0.25 mm, which was significantly different for Stage IV but not Stage II
at a p-value
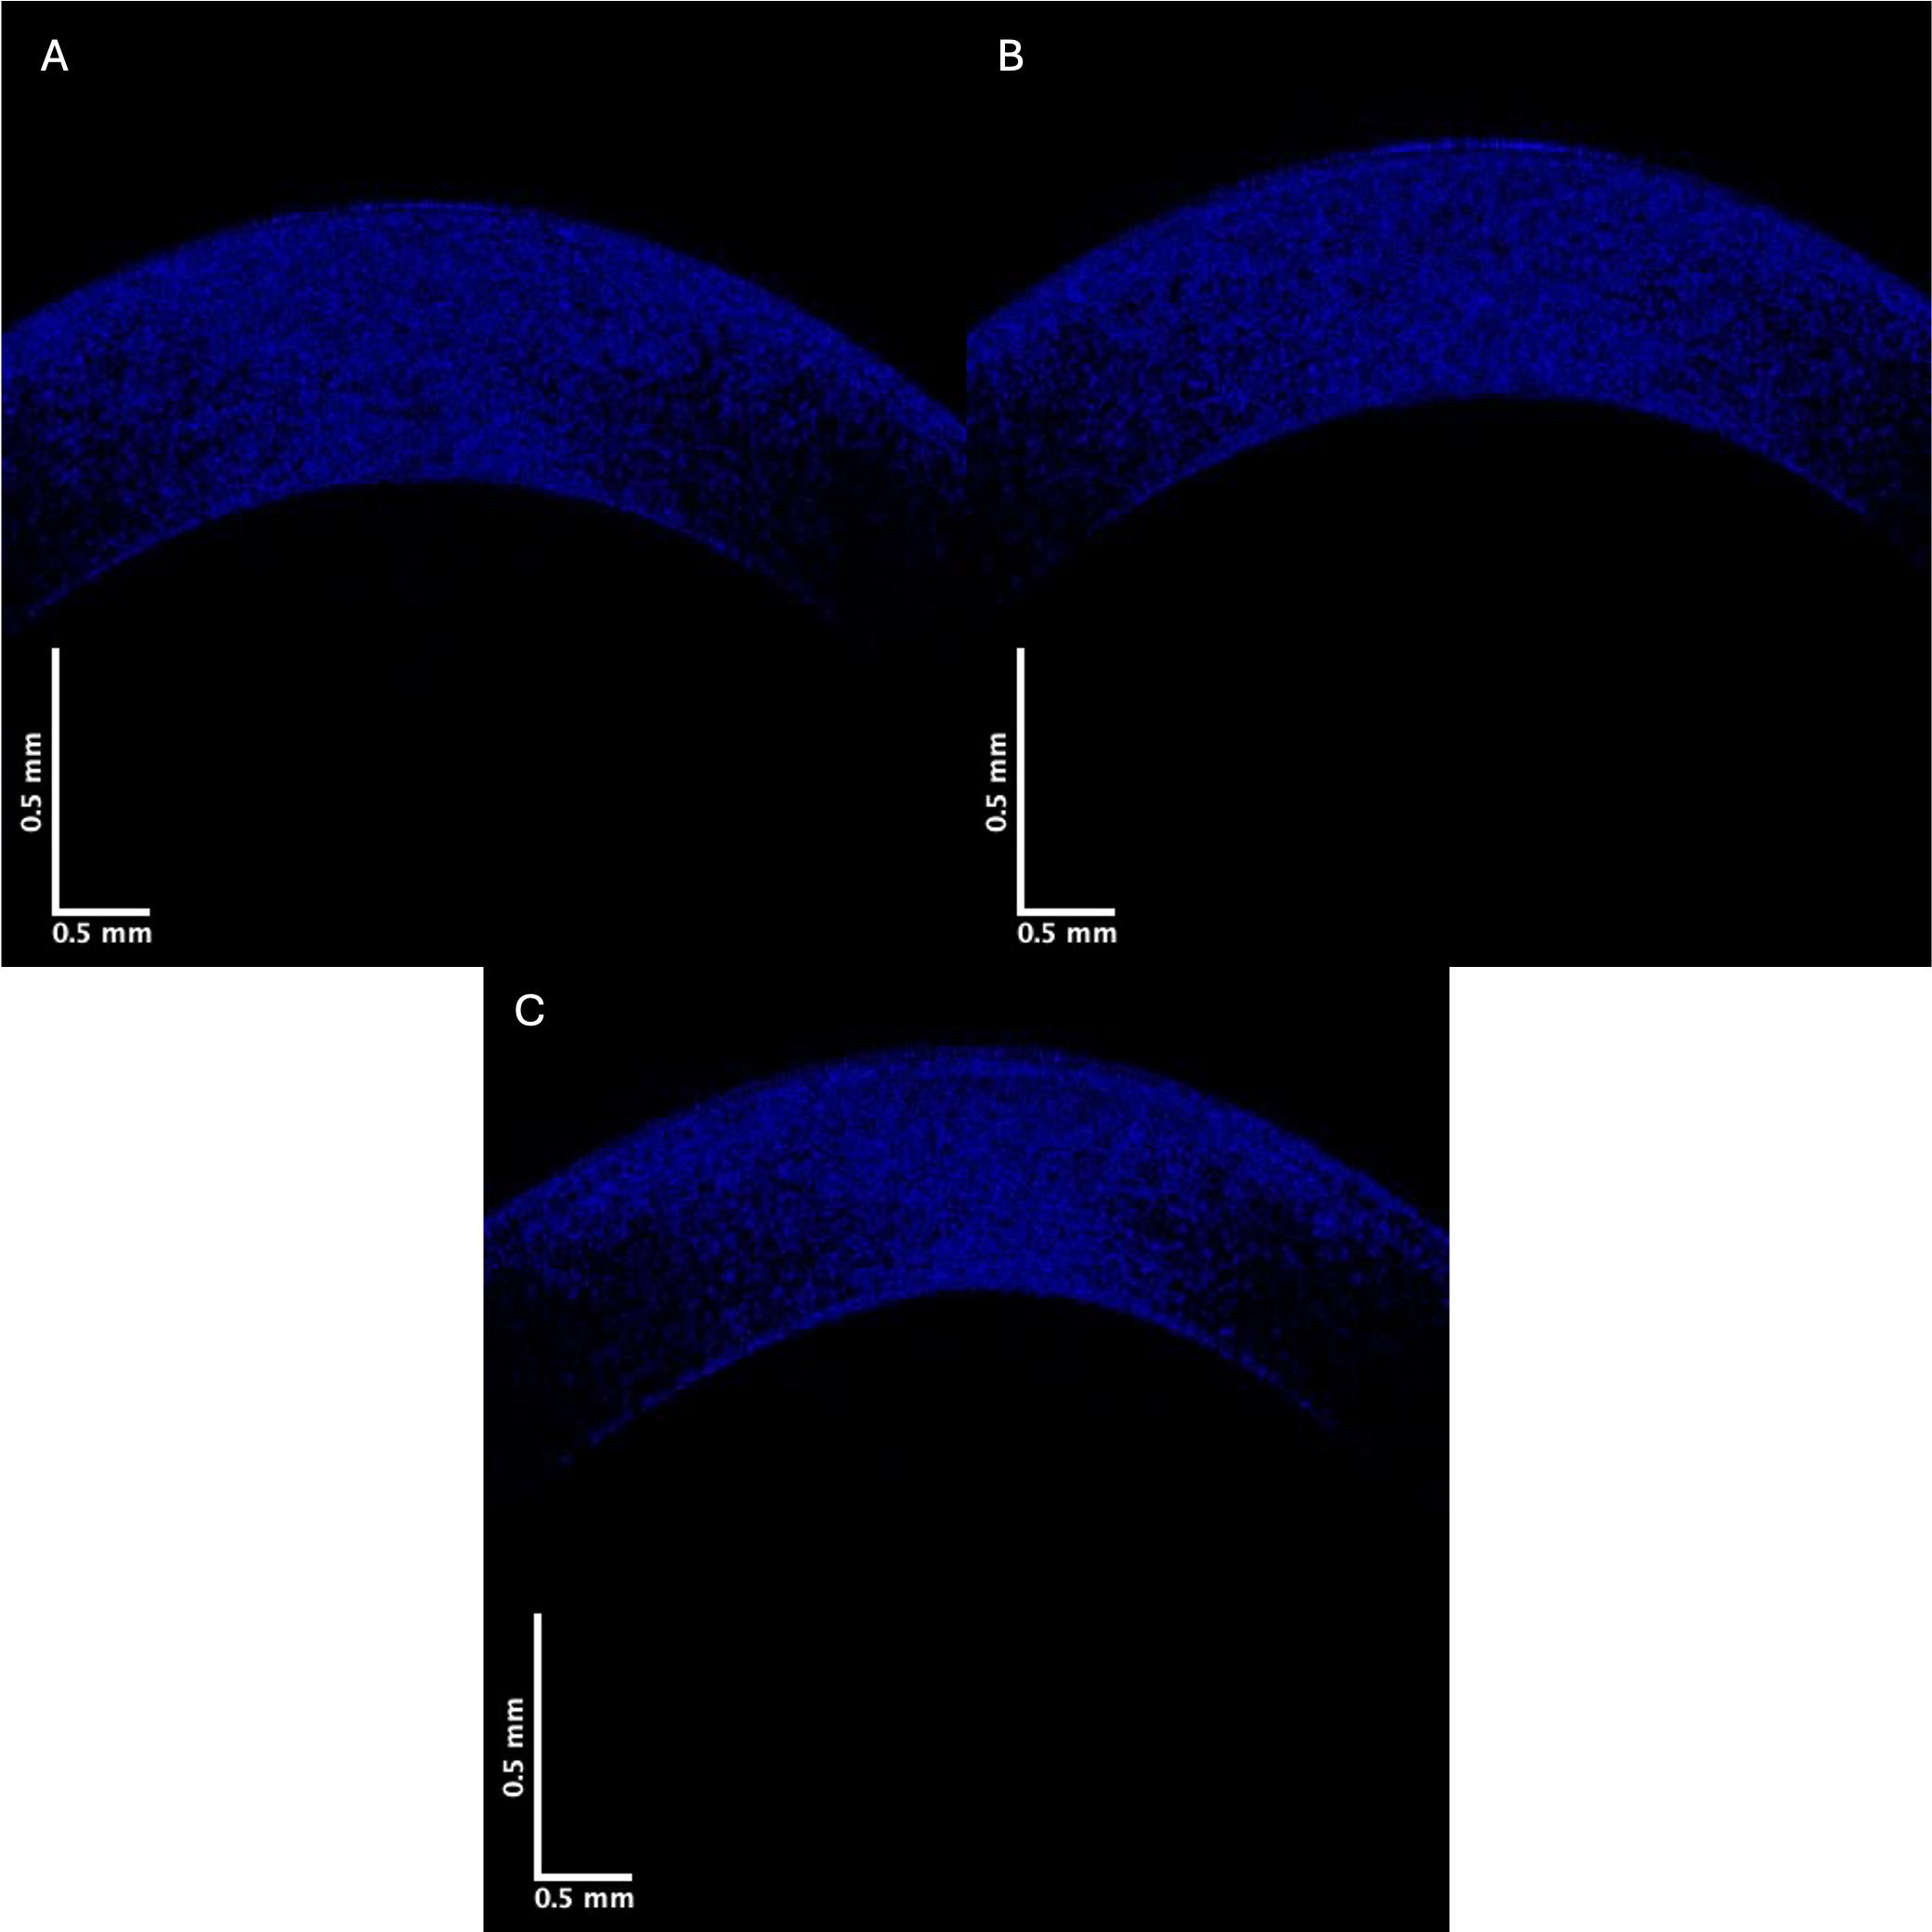 Fig. 5.
Typical blue channel for central cornea images of control (A), Stage II (B), and Stage IV (C). Note that the blue channel pixel intensity of Stage IV KC appears lower than that of the control.
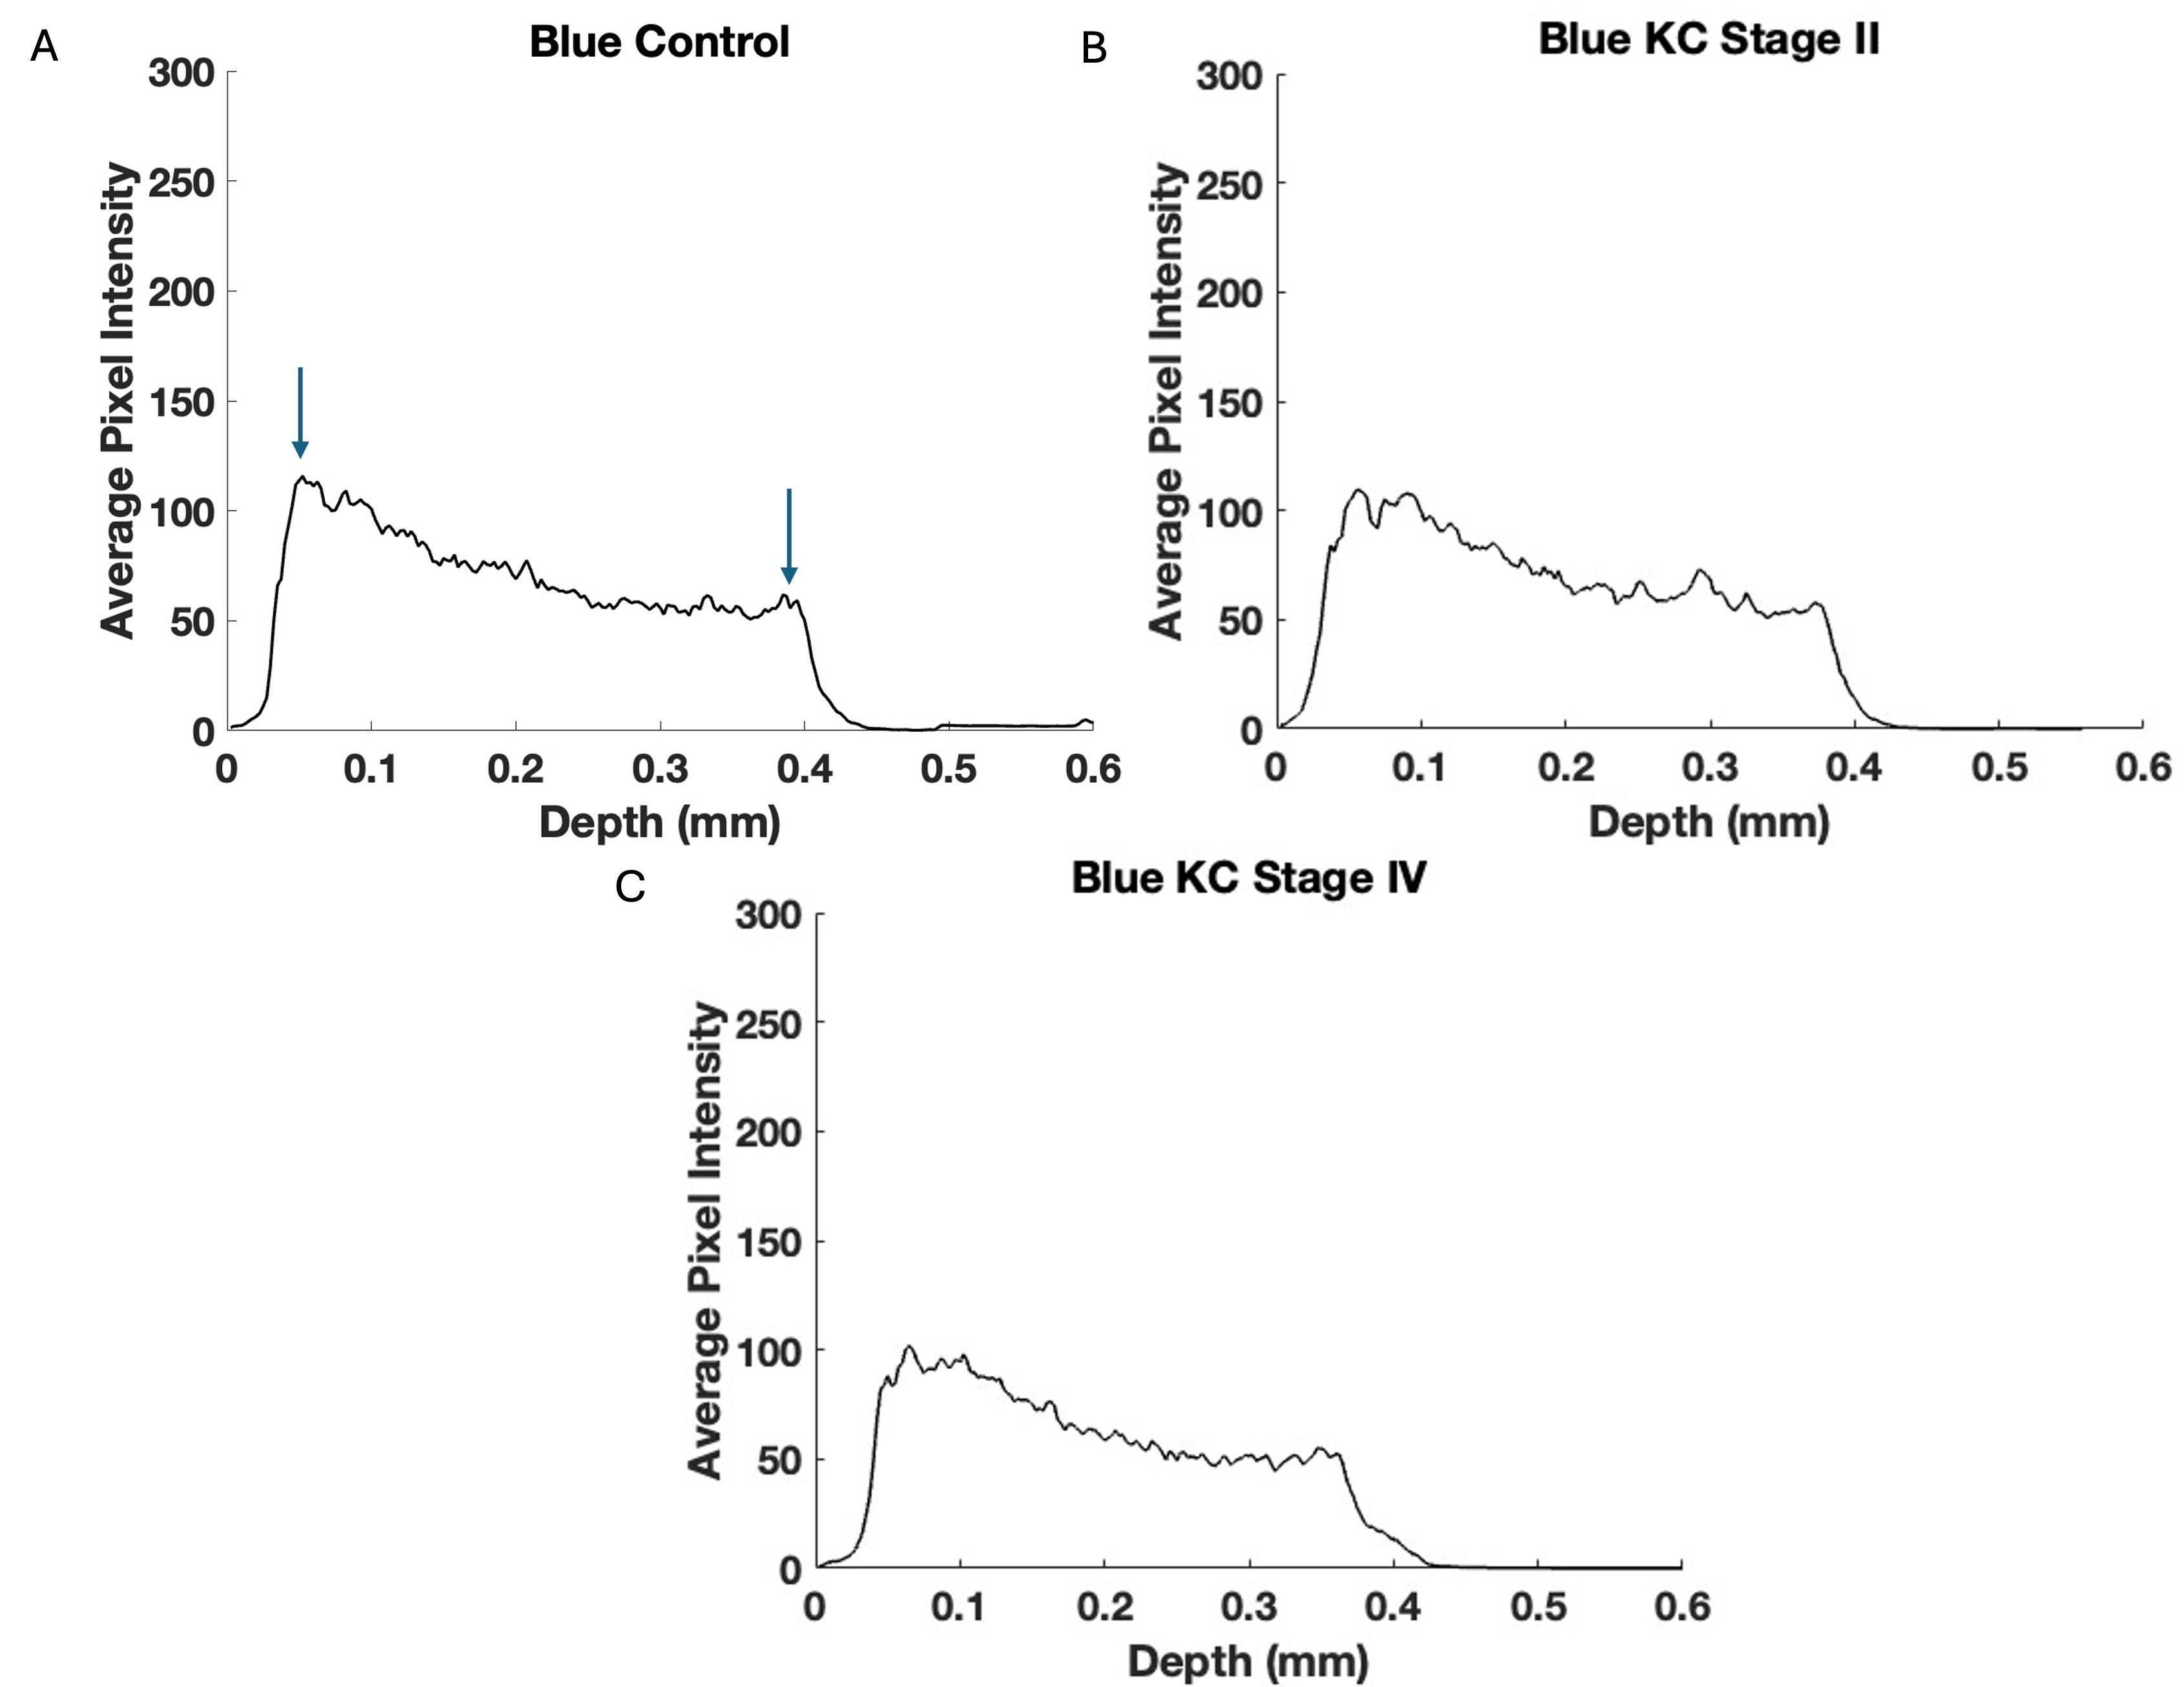 Fig. 6.
Typical central cornea blue channel pixel intensity versus depth plots for control (A), Stage II (B), and Stage IV (C) KC corneas—based on Fig. 5. Note the data in Table 5 suggest that the blue channel loss in pixel intensity is statistically significant only for Stages III and IV indicating that the reduction in collagen appears to follow the loss in keratocyte pixel intensity. Arrows indicate the points between which the slope was calculated and where correlation occurs.
| Sample (green) | Number | Slope (SD) | p-value vs. control | p-value vs. KC Stages I and II |
| Control | 20 | –807.85 (286.45) | - | - |
| KC Stages I and II | 11 | –1429.76 (559.96) | 0.002 | - |
| KC Stages III and IV | 8 | –1140.80 (702.8) | 0.115 | 0.176 |
| Sample (green) | Number | p-value vs. control | p-value vs. KC Stages I and II |
| Control | 20 | - | - |
| KC Stages I and II | 11 | 0.48 | - |
| KC Stages III and IV | 8 | 0.02 | 0.06 |
The data in Table 6 appear to show a more rapid decrease in the pixel intensity versus depth plot for the blue channel in the central corneas for KC Stages III and IV (C) than in KC Stages I and II, and compared to the control. However, the pixel intensity at a depth of 0.25 mm for the blue and red subchannels was not significantly different from the controls. Figs. 7,8 present red channel OCT images and pixel intensity versus depth plots, respectively. Table 7 shows the initial slopes for the control versus Stage I and II and Stage III and IV KC corneas. The decrease in the red channel slope is statistically higher for Stage I and II and Stage III and IV KC corneas than for the control.
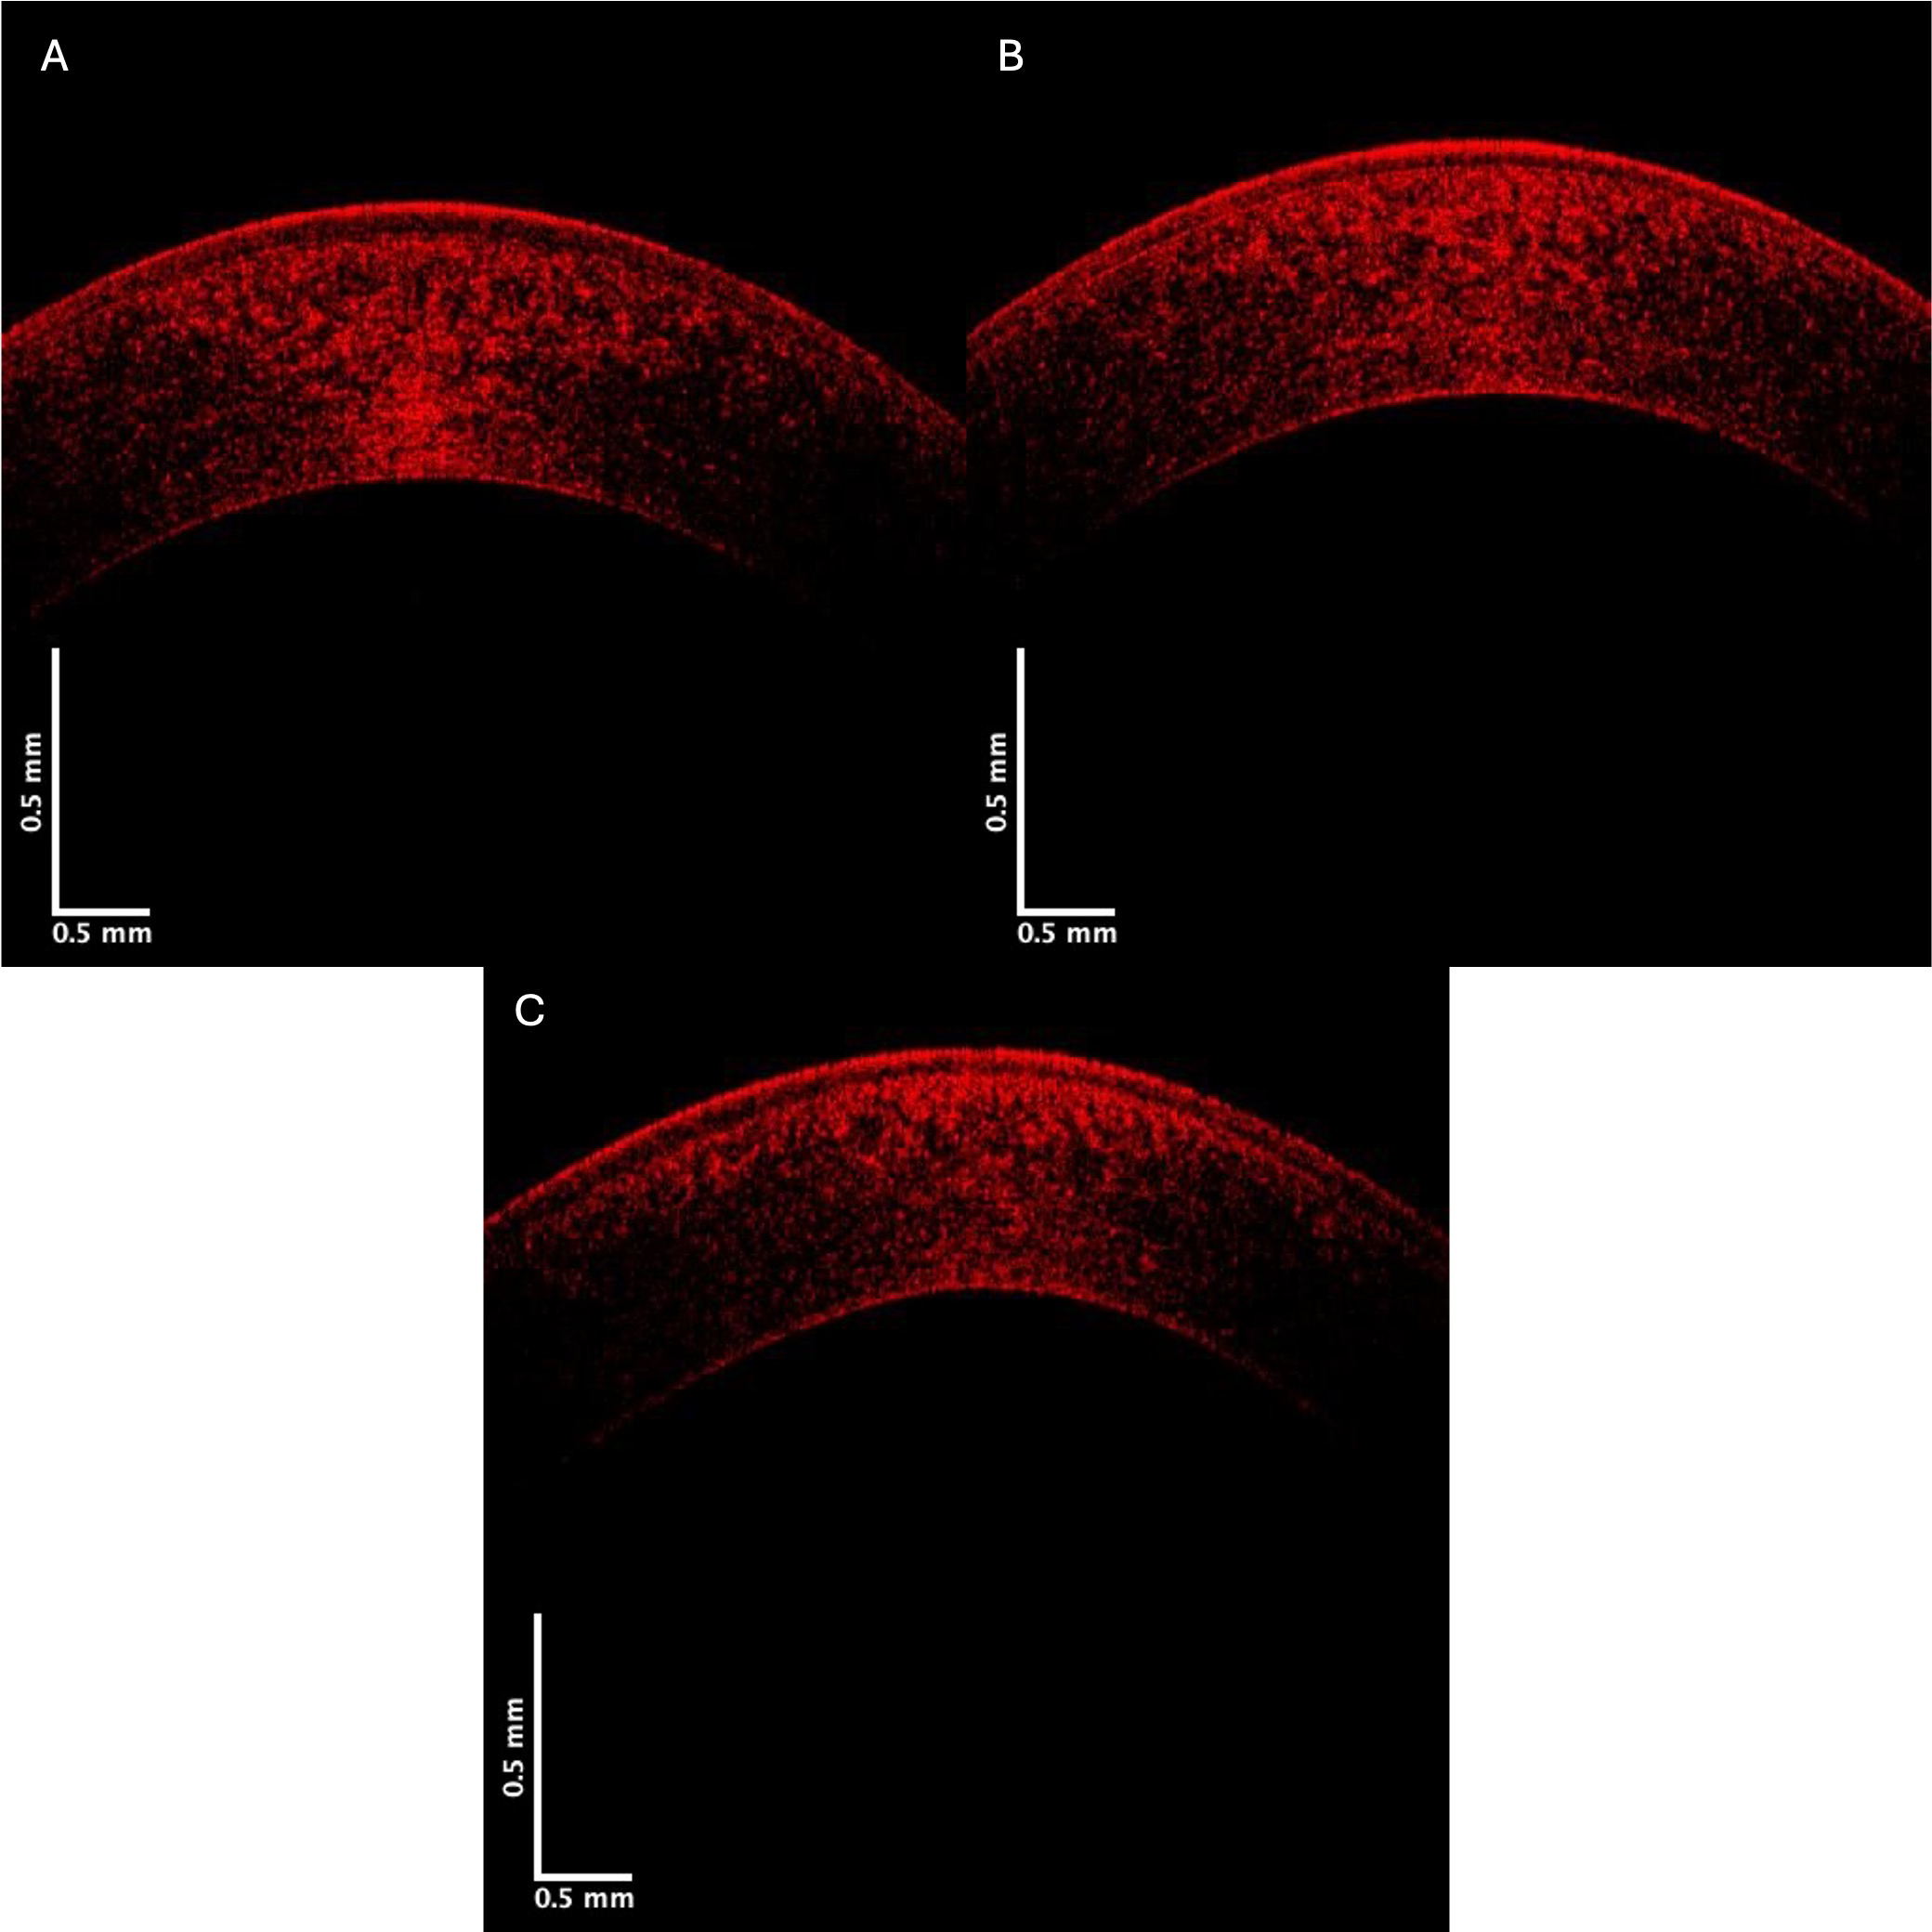 Fig. 7.
Typical central corneal red channel cross-sectional images of control (A), Stage II (B), and Stage IV (C) KC corneas. Note the apparent loss in pixel intensity for the lower corneal lamellae in the Stage IV cornea.
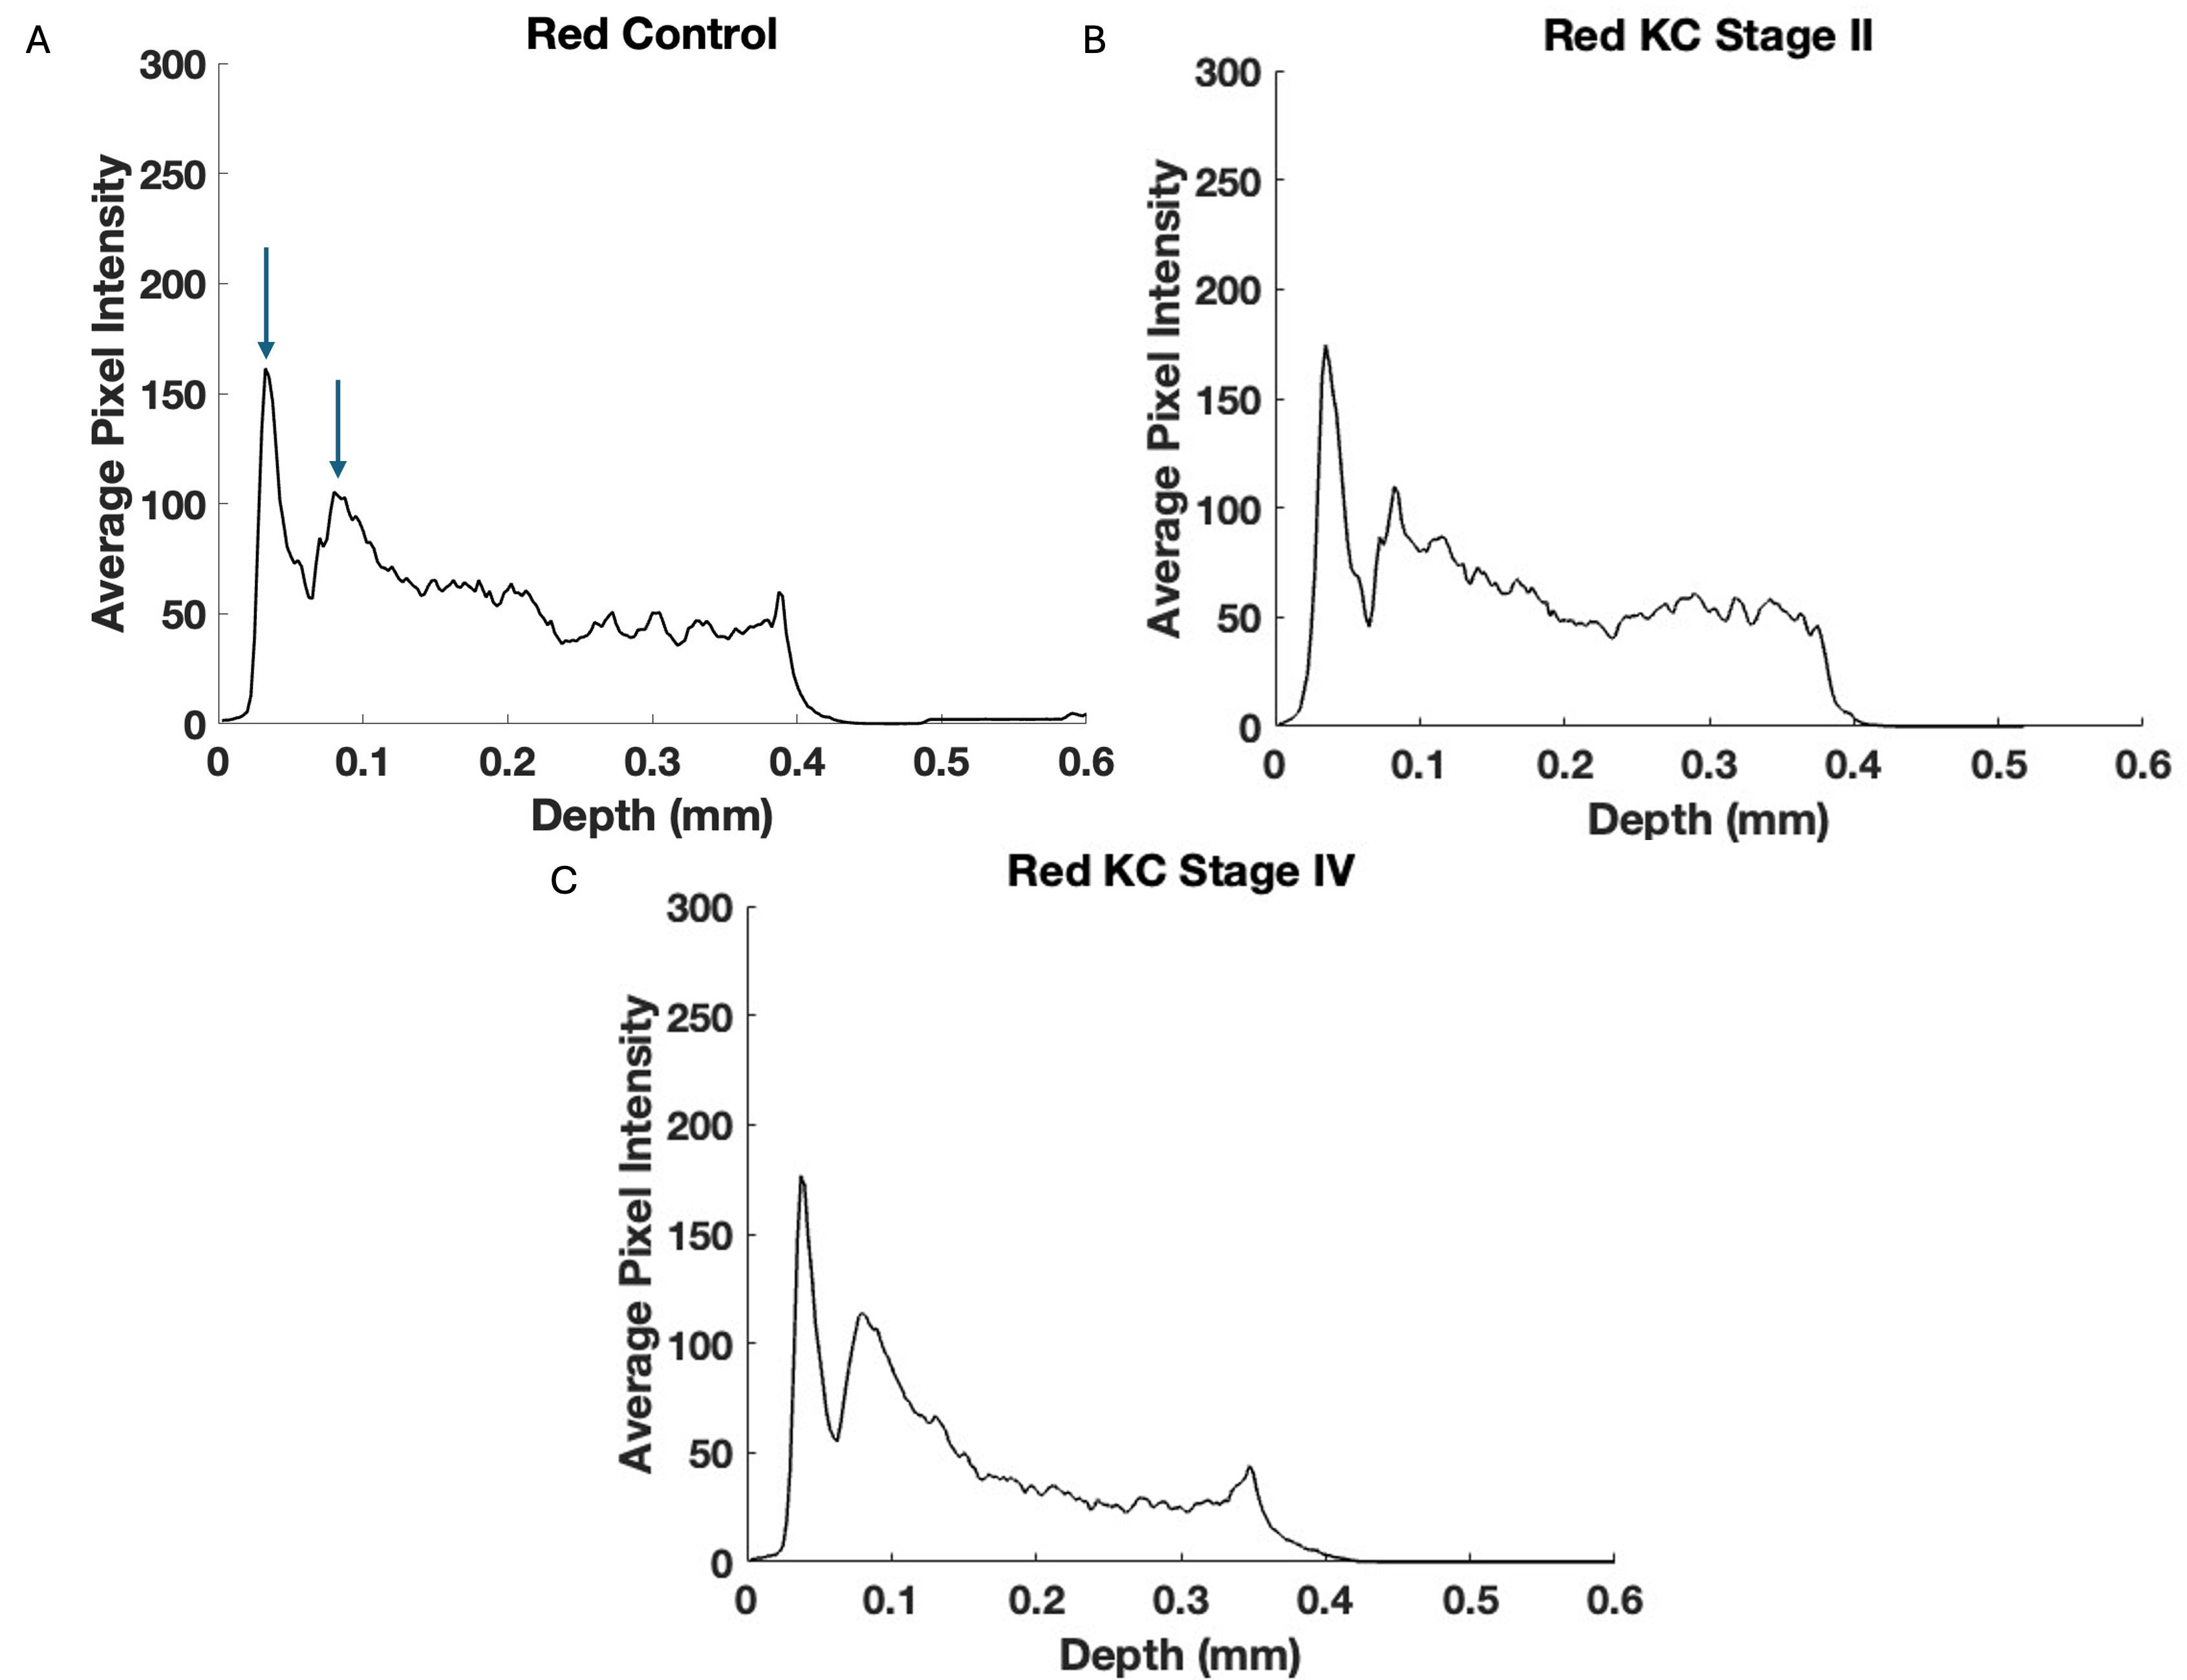 Fig. 8.
Typical plots of central cornea red channel pixel intensity versus depth for control (A), Stage II (B), and Stage IV (C) KC corneas—based on Fig. 7. Note the lower pixel intensity of the posterior Stage III and IV KC corneas suggests that the keratocytes and collagen contents in the posterior corneas are progressively affected alongside the increasing disease stages. Arrows indicate the points between which the slope was calculated.
| Sample (blue) | Number | Slope (SD) | p-value vs. control | p-value vs. KC Stages I and II |
| Control | 20 | –213.37 (37.45) | - | - |
| KC Stages I and II | 11 | –221.10 (46.38) | 0.32 | - |
| KC Stages III and IV | 8 | –252.73 (42.40) | 0.02 | 0.07 |
The decrease in the slope of the blue channel Stages III and IV KC corneas is statistically greater than that of the control, suggesting that the lamellar collagen in Stages III and IV is less abundant than in controls.
| Sample (red) | Number | Slope (SD) | p-value vs. control | p-value vs. KC Stages I and II |
| Control | 20 | –782.23 (291.60) | - | - |
| KC Stages I and II | 11 | –1269.55 (651.81) | 0.01 | - |
| KC Stages III and IV | 8 | –1222.05 (600.73) | 0.04 | 0.43 |
The data for KC corneas in Stages I and II and Stages III and IV differ statistically from the control.
Interest in the measurement of corneal biomechanical properties in vivo has promoted the development of instrumentation for clinical applications such as the Ocular Response Analyzer (ORA; Reichart Ophthalmic Instruments, Buffalo, NY, USA), Corvis ST (Oculus, Wetzlar, Germany), Brillouin optical microscopy, magnetic resonance elastography, and optical coherence elastography [13, 14, 15, 16, 17, 18, 19, 20, 21, 22, 23, 24]. While these methods provide valuable information on the cornea, they do not directly measure the biomechanical properties. The properties of the cornea are quite complex; thus, evaluating changes in the corneal structure and properties represents an ongoing research subject [25, 26, 27, 28, 29, 30]. Moreover, aging, hydration, anesthetic exposure [31, 32, 33, 34, 35, 36], and disease processes affect corneal structure and properties. Our studies have been directed at developing a noninvasive method to evaluate the elastic properties of the cornea and relate the properties to structural components [7, 8, 9, 10, 11].
Previous study results from our laboratory using VOCT indicate that the elastic modulus of KC central corneas decreased from 3.1 MPa for controls to about 2.2 MPa for subjects with KC [7]. The locations of the different corneal components in OCT images have been established through corneal dissection and measurements made on human [7] and pig corneas [10] and their components using vibrational optical coherence tomography. Meanwhile, in keratoconus, morphological changes have been reported in collagen fibers, including interlamellar alterations and slippage [2]. Other changes have also been observed, including decreased collagen crosslinking, changes in proteoglycans, and increased collagenolytic activity [3]. We also have reported that separation between the corneal epithelium and stroma in Stage IV KC was observed at the limbus corneal junction, even though cone formation occurred centrally or paracentrally [4]. The results of modeling studies suggest that cone formation occurs centrally/paracentrally, where the curvature and strain are greatest [11].
The results reported in this study suggest that the pixel intensity of KC corneas appears to reduce more rapidly with depth compared to controls. This reduction could be explained by decreased cell density or collagen content in KC corneas compared to controls. Moreover, the relative changes in reflection from cellular (green), collagen (blue), and both cellular and collagen contents (red) in the cornea can be evaluated by separating the OCT images into low (green), medium (blue), and high subchannel pixel intensity versus depth plots. This relationship between low pixel intensity (green channel) and cellular content and medium pixel intensity (blue channel) and collagen content was previously established for skin [12]. The rapid decrease in the slope in the green channel suggests a reduced cellular content in the anterior cornea in KC, especially in Stage I and II corneas. Pixel intensity differences in the green channel at a depth of 0.25 mm suggest that the keratocyte content decreases in the posterior corneas in Stages III and IV. These results in the green channel OCT images indicated that the epithelial cell content in the anterior cornea is the first change observed in the early KC stages. Meanwhile, the green channel in the Stage IV posterior cornea almost disappears (Figs. 2,3), suggesting a decrease in the keratocyte content in the posterior cornea occurs in later KC stages. The reduced collagen content observed in the blue channel (Figs. 5,6) follows the loss of epithelial cells and is coincidental following the loss of keratocytes in the posterior cornea.
The red channel appears to reflect both the cellular and collagen content in the cornea [12]. As seen in Figs. 7,8, and Table 5, the reflections of the cellular and collagen contents appear to reduce with increased depth. These preliminary results suggest that corneal epithelial and keratocyte changes are seen both in the anterior and posterior cornea during the pathogenesis of KC, and may precede collagen changes in the posterior cornea. Furthermore, these results suggest that the early phases of KC can be observed based on changes in the green subchannel OCT images after the construction of pixel intensity versus depth plots. Reviewing the green, blue, and red subchannel OCT images may represent a screening tool for detecting early changes in the corneal structure in KC and other corneal diseases; however, additional studies are needed to confirm these data.
Limitations to the study include the need for additional data on subjects in Stages I and III. Moreover, the large standard deviations for the slopes in the pixel intensity versus depth plots reflect variations in the structural changes that occur in different patients. For this reason, a larger pool of patients would help identify patient-to-patient variations in the disease and its onset.
The relative cellular and collagen contents in the control and KC human corneas were studied by obtaining OCT images and then dividing the photos into low (green), medium (blue), and high pixel intensity (red) subchannel images. The green image provides a method to determine the cellular content qualitatively, the blue image offers some information regarding the collagen content, and the red image includes information on both the cellular and collagen contents. These results suggest that both the cellular (epithelial and keratocyte) and collagen reflections reduce in KC with increased corneal depth, while the collagen content may decrease following the loss of keratocytes. This study proposes that using the green, blue, and red subchannel images may be an effective screening technique to detect KC and other corneal diseases earlier, before observing changes in corneal topography; however, further studies are needed to confirm these data. Nonetheless, since OCT images can be collected noninvasively, these data can be amassed remotely using telemedicine in areas where corneal specialists are in short supply.
The datasets used and analyzed during the current study are available from the corresponding author on reasonable request.
Conceptualization—FHS, DB, TD; Methodology—FHS, DB, TD; Formal analysis—TD, FHS; Investigation—TD, FHS, DB; Data curation—TD; Writing – original draft preparation—FHS, DB; Writing - review and editing—DB, TD, FHS. All authors have read and agreed to the published version of the manuscript. All authors have participated in the work and agreed to be accountable for the work.
That prospective study was complied with the Health Insurance Portability and Accountability Act, adhered to the tenets of the Declaration of Helsinki, and was approved by the Wills Eye Hospital Institutional Review Board (IRB#2021-36). All patients or their legal guardians provided informed consent prior to inclusion in the study.
Not applicable.
This research received no external funding.
All authors declare no conflicts of interest. Despite they received sponsorship from OptoVibronex, the judgments in data interpretation and writing were not influenced by this relationship.
References
Publisher’s Note: IMR Press stays neutral with regard to jurisdictional claims in published maps and institutional affiliations.