


 , Junying Qu 1,†, Jing Zhao 1, Linkai Qu 2, Lei Wang 3, Cheng Luo 4, Qinsi Yang 5, Wei Wu 6, Da Sun 1,*
 , Dongjuan He 4,*
1 Institute of Life Sciences & Biomedical Collaborative Innovation Center of Zhejiang Province, Wenzhou University, 325035 Wenzhou, Zhejiang, China
2 College of Veterinary Medicine, Jilin University, 130118 Changchun, Jilin, China
3 Technical Institute of Physics and Chemistry, Chinese Academy of Sciences, 100190 Beijing, China
4 Department of Endocrinology, The Quzhou Affiliated of Wenzhou Medical University, Quzhou People’s Hospital, 324000 Quzhou, Zhejiang, China
5 Wenzhou Institute, University of Chinese Academy of Sciences, 325000 Wenzhou, Zhejiang, China
6 Key Laboratory for Biorheological Science and Technology of Ministry of Education, State and Local Joint Engineering Laboratory for Vascular Implants, Bioengineering College of Chongqing University, 400030 Chongqing, China
†These authors contributed equally.
Abstract
Anxiety and depression-like behaviors are common in patients with type 2 diabetes mellitus (T2DM). This study explored the potential of swimming training (ST) to alleviate these symptoms by restoring mitochondrial function. While aerobic exercise is known to influence mitochondrial dysfunction and behavioral abnormalities, the mechanism by which ST achieves this remains unclear.
To investigate how ST improves T2DM and associated anxiety-like behaviors by regulating mitochondrial structure and function.
T2DM was induced in zebrafish with a high-sugar diet, followed by 20 days of ST. Behavioral analysis assessed anxiety-like behaviors, while ELISA and microscopic imaging techniques were used to evaluate changes in mitochondrial structure and function in liver tissue.
ST significantly alleviated anxiety-like behavior and mitigated mitochondrial damage. Furthermore, ST counteracted mitochondrial dysfunction induced by oxidative stress through regulation of reactive oxygen species levels (p < 0.01), stabilization of mitochondrial membrane potential (p < 0.0001), and increasing the production of adenosine triphosphate (p < 0.01). ST also improved T2DM markers, including blood glucose regulation (p < 0.001), insulin level (p < 0.05), and lipid metabolism (p < 0.01 for low-density lipoprotein cholesterol (LDL-C), p < 0.01 for high-density lipoprotein cholesterol (HDL-C), p < 0.01 for total cholesterol (T-CHO)).
This research provides insights into the intricate interplay between mitochondrial dysfunction in T2DM and behavioral outcomes while highlighting the potential of ST as a holistic therapeutic strategy for T2DM patients.
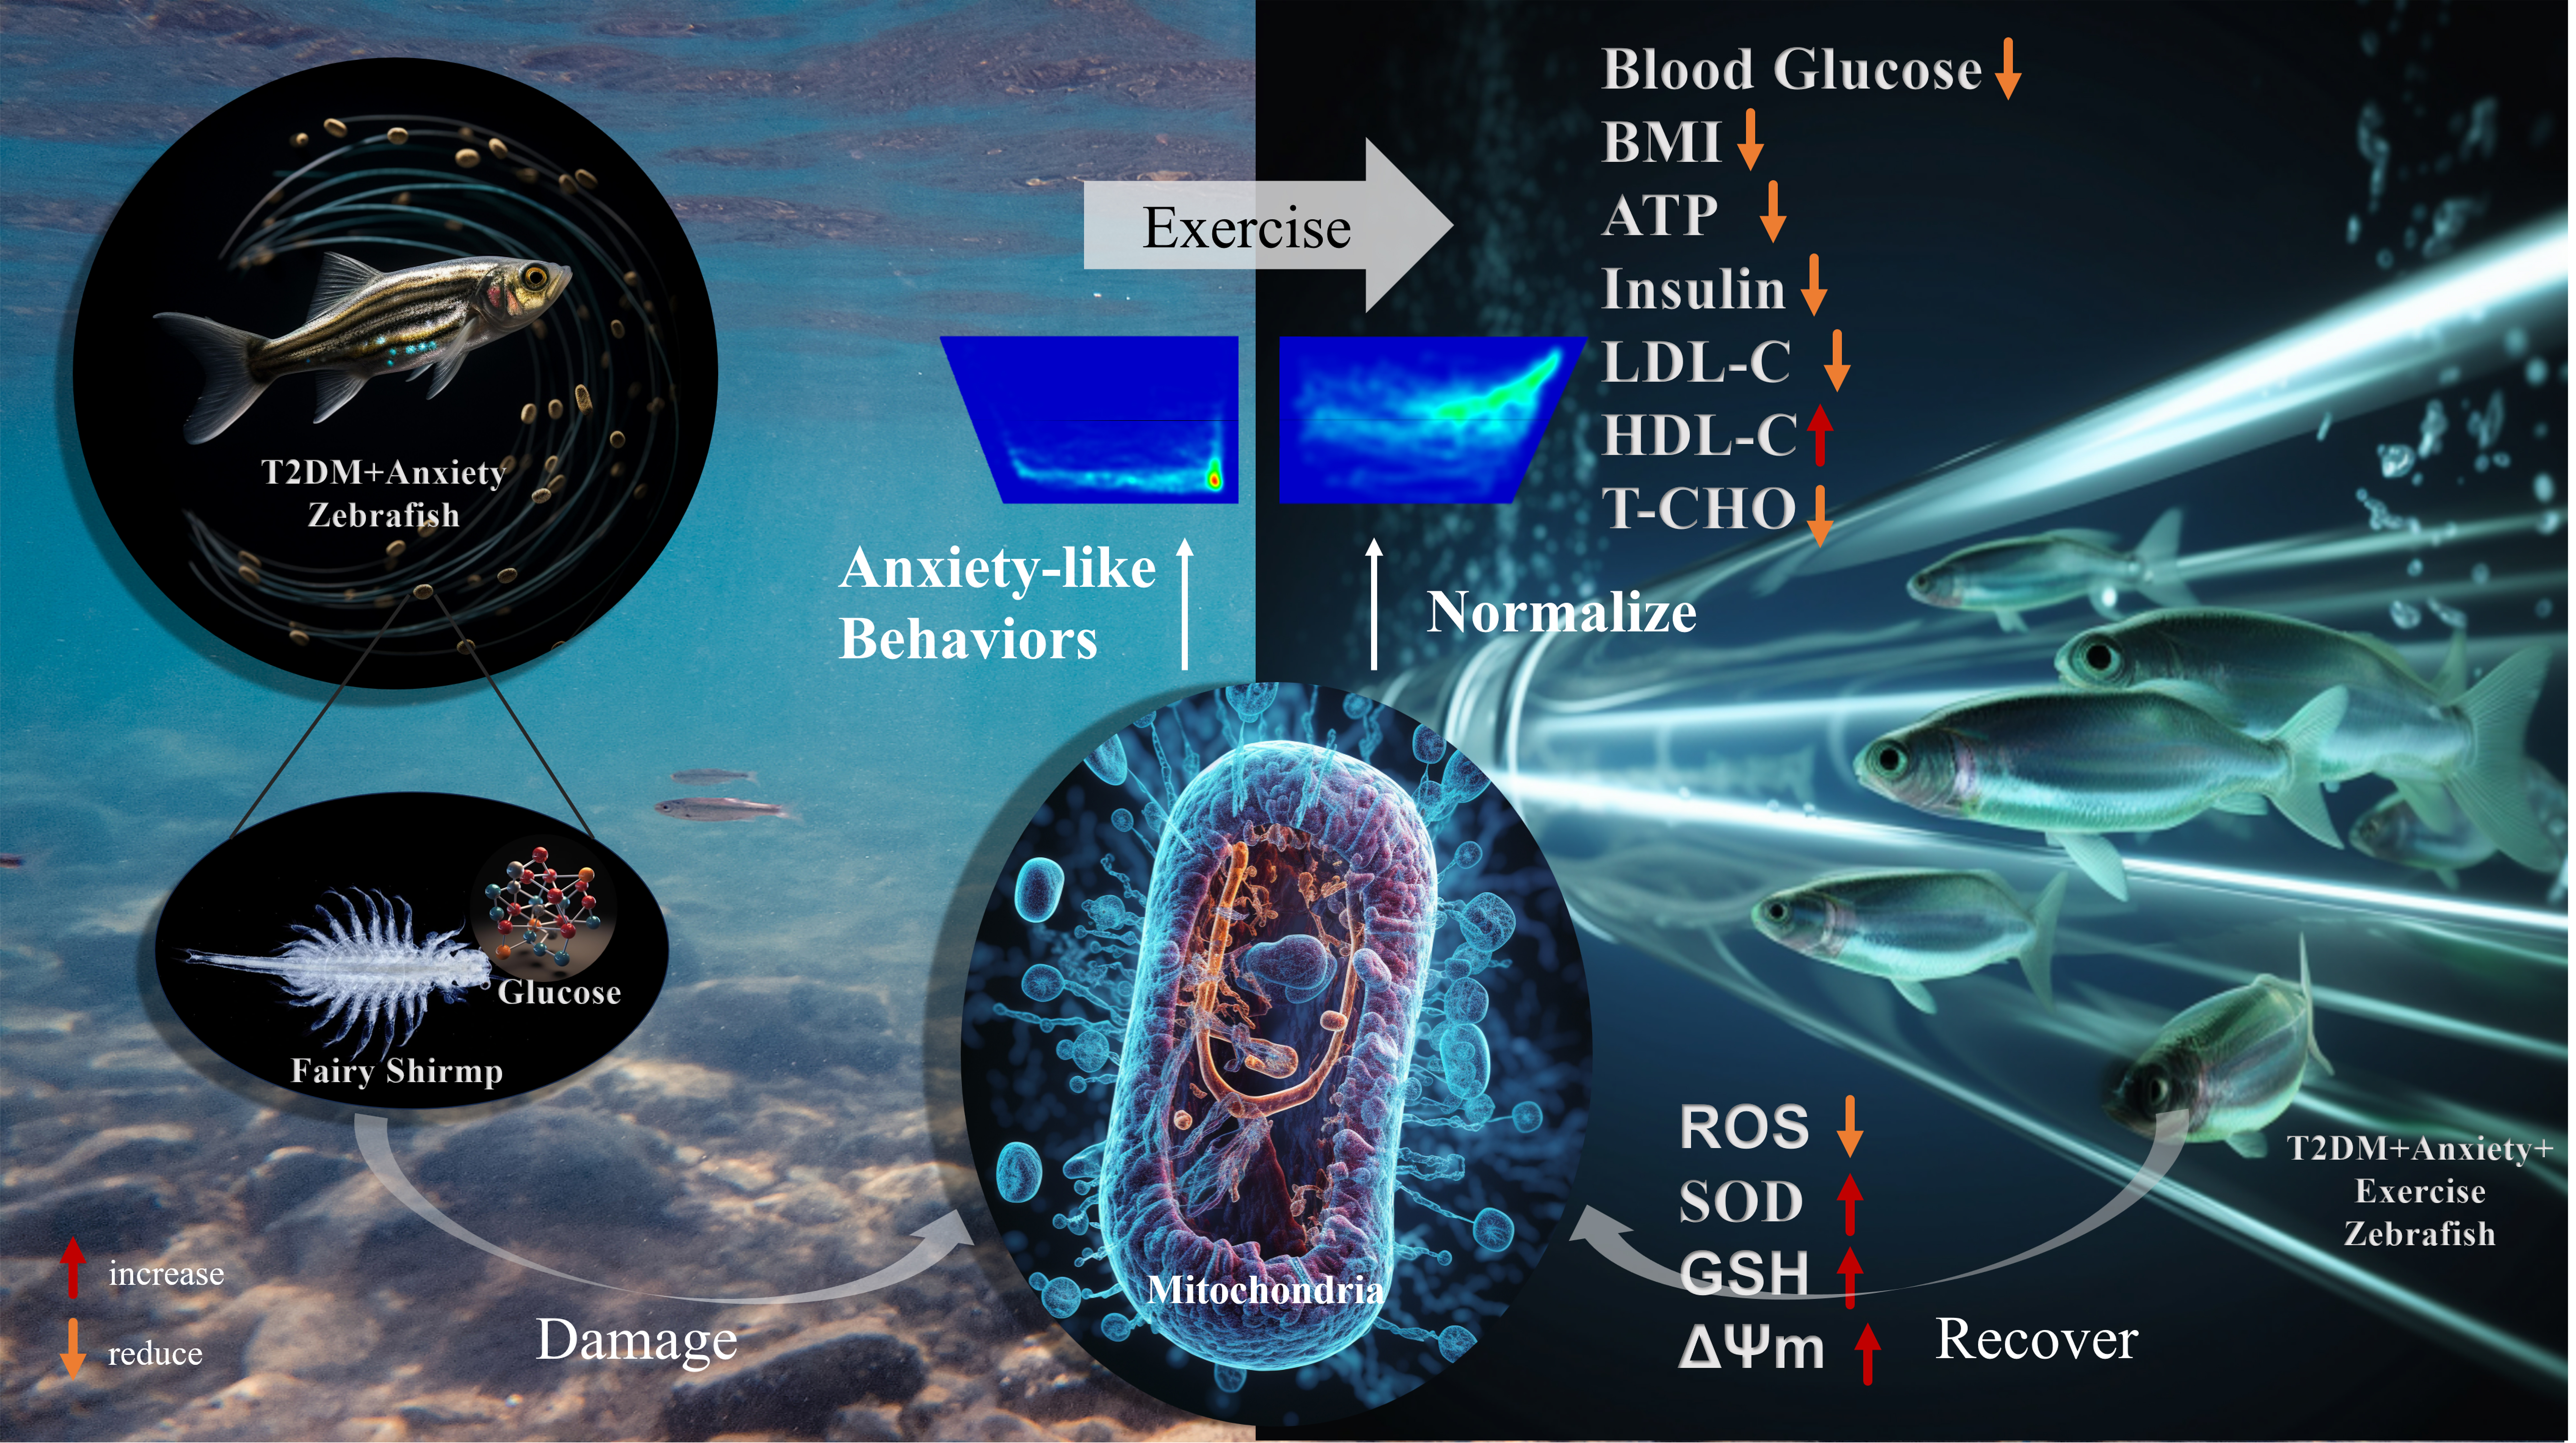
Graphical Abstract
Keywords
- T2DM
- anxiety
- oxidative stress
- mitochondrial damage
- swimming training
The escalating global prevalence of diabetes is a pressing concern, with recent projections suggesting an increase from 463 million affected individuals in 2019 to 700 million by 2045 [1]. Dominating this scenario is type 2 diabetes mellitus (T2DM), which accounts for 90% of all diagnosed cases globally [2]. T2DM is characterized by the body’s compromised capacity to efficiently utilize or produce insulin, which is pivotal for blood glucose regulation.
Mitochondrial dysfunction plays a key role in the pathogenesis of T2DM. The delicate balance between mitochondrial fusion and fission, regulated by dynamin-related GTPases, is essential for cellular homeostasis [3]. Disruptions in this balance contribute to excessive production of reactive oxygen species (ROS), metabolic impairment, and insulin signaling defects, thereby exacerbating the progression of T2DM [4]. Persistent hyperglycemia in T2DM patients induces oxidative stress and neuroinflammation. These are strongly implicated in the onset of neuropsychiatric disorders, including anxiety and depression. A recent study showed that 50.7% of T2DM patients experience anxiety disorders that significantly deteriorate their quality of life [5].
The association between T2DM and anxiety-like behaviors is multifaceted. Chronic hyperglycemia and insulin resistance contribute to neuroinflammation, neurotransmitter imbalance, and hypothalamic-pituitary-adrenal axis dysregulation, all of which have been linked to anxiety disorders [6]. Mitochondrial abnormalities in T2DM, such as impaired adenosine triphosphate (ATP) synthesis and excessive ROS production, further exacerbate neuronal dysfunction and increase susceptibility to anxiety-like behaviors [7]. Additionally, alterations in brain-derived neurotrophic factor levels and synaptic plasticity in T2DM patients have been implicated in the pathogenesis of anxiety and depression [8]. These findings highlight the need for targeted interventions to address both metabolic and neuropsychiatric complications in T2DM.
Swimming training (ST) is a non-drug intervention that can reactivate mitochondria damaged by hyperglycemia [9]. Different structured exercise training modes, such as ST, resistance training, high-intensity interval training, and gentle exercise can result in different outcomes [10, 11, 12, 13]. Swimming is a low-impact aerobic exercise involving multiple muscle groups. It can simultaneously promote calorie consumption, fat metabolism, and cardiovascular health. Thanks to their innate swimming propensity, zebrafish serve as an ideal model for voluntary exercise study [14]. They possess similar insulin regulatory mechanisms to those found in mammals, and share neurochemical features with humans, making them suitable for T2DM and neuropsychiatric research [15]. Notably, zebrafish possess neurotransmitters, hormones, and receptors similar to those present in the hypothalamic-pituitary-adrenal axis of humans. The zebrafish model has therefore been used to study various mental disorders or psychotropic drugs [16], including Alzheimer’s disease [17, 18], anxiety [19], and depression [20].
Despite our growing understanding of the interplay between mitochondria, T2DM, and anxiety-like behaviors, significant knowledge gaps remain in this field. The present study investigated the potential of ST intervention to alleviate T2DM and associated anxiety symptoms in the zebrafish model (Fig. 1A). We employed a novel swimming apparatus to carefully examine the anxiolytic and prosocial effects of ST, while also focusing on its role as a protector of the mitochondria (Fig. 1B–D). Our findings underscore the therapeutic potential of ST for mitigating T2DM-induced mitochondrial dysfunction and associated behavioral abnormalities. Moreover, they provide a novel perspective on holistic treatment strategies for T2DM patients with mental health challenges.
 Fig. 1.
Schematic representation of the study design and underlying mechanisms. (A) Experimental timeline of zebrafish swimming training. (B) Patients with type 2 diabetes mellitus (T2DM) show insulin resistance, hyperglycemia and metabolic abnormalities, causing the liver to synthesize more lipoprotein and cholesterol. (C) T2DM patients also display mitochondrial dysfunction and oxidative stress, which further interfere with lipid and glutamine synthesis pathways and inhibit synthesis of the antioxidant reduced glutathione (GSH). T2DM can also lead to lipid metabolism disorders and inflammation, as well as increase the risk of anxiety symptoms. (D) Through swimming training (ST), zebrafish may undergo gradual recovery of liver mitochondrial function, thereby reconstructing the balance between oxidative stress and antioxidation, and altering mood. LDL, low-density lipoprotein; HDL, high-density lipoprotein cholesterol; ROS, reactive oxygen species; SOD, superoxide dismutase. Created using BioRender.com.
Adult wild-type AB zebrafish (1:1 male/female ratio, 6–8-month-old with body
weight ranging from 0.29 g to 0.43 g, 100 per group) were purchased from the
Wuhan Zebrafish Resource Center (Wuhan, Hubei Province, China). They were
initially maintained in a five-tier, single-drain aquatic system (Shanghai
Haisheng Marine Biological Equipment Co., Ltd., Shanghai, China) under a
controlled 14 h light/10 h dark cycle, with a stable temperature of 28.5
Unfertilized fairy shrimp (10 g, fairy shrimp were purchased from FengNian Aquaculture Co., Ltd., Tianjin, China) were incubated in a 2 L container with 20 g of sea salt (FengNian Aquaculture Co., Ltd., Tianjin, China) and 1.5 L of pure water for 16 h. After hatching, the fairy shrimp were immersed in a 20% D-glucose (#M18078-500G, Meryer, Shanghai, China) solution for 4 h (omitted for the control group), rinsed with ddH2O, flash-frozen in liquid nitrogen, and subsequently freeze-dried for 36–48 h using a vacuum freeze-drying machine (SCIENTZ-12N, Zhejiang Xinzhi Biotechnology Co., Ltd., Ningbo, Zhejiang Province, China). This provided the basic feed (fairy shrimp) for the control group, and the high-sugar feed (high-sugar fairy shrimp) for the T2DM and T2DM+ST groups.
The training device was adapted from previous experiments [23] and configured to facilitate swimming training (ST) at a maximum flow rate of 10 cm/s for 30 minutes daily over 20 days. Training sessions were consistently scheduled at approximately 2:00 PM. Zebrafish were trained simultaneously across three slots (Fig. 2). The training field was a transparent pipe (Acrylic material) with a diameter of 25 mm, length of 15 cm, and thickness of 3 mm.
 Fig. 2.
Zebrafish aerobic exercise equipment. The arrow indicates the direction of water flow. (A) Diagram of the device design. (B) Photograph of the actual device.
A custom-designed trapezoidal transparent fish tank (dimensions: 28 cm upper, 22
cm lower, 15 cm height, 7 cm width) filled to a height of 15 cm with water was
utilized. A warm white LED light panel was positioned behind the tank to provide
consistent illumination (50 lux) [24]. A digital camera (resolution ratio: 1920
The shoal test was conducted in a transparent acrylic tank measuring 20
Weight (g) and body length (cm) were measured using a digital balance
(Sartorius, Gogentin, Germany) and an electronic vernier caliper (Deqing Shengtai
Core electronic Technology Co., Ltd., Huzhou, Zhejiang Province, China),
respectively. The CF was calculated using the formula: CF = (W/L3)
Zebrafish were euthanized, and blood glucose and CF were measured prior to freezing. Samples were then frozen in liquid nitrogen and stored in a –80 °C freezer prior to subsequent biochemical analysis.
(1) Whole-body Homogenate Preparation for Metabolic and Oxidative Stress Indicators. Whole-body homogenates were prepared for systemic metabolic assessments. Briefly, an appropriate amount of saline was added to the sample at a 1:9 (mL/g) ratio, followed by tissue mincing and cooling with liquid nitrogen. The sample was fully ground using a liquid nitrogen cryo-grinder (Model: JXFSTPRP-24L, Shanghai Jingxin Industrial Development Co., Ltd., Shanghai, China), centrifuged at 3000 rpm for 10 min, and the supernatant collected for analysis. Glutathione (GSH) and blood lipid samples were prepared using the same method, with kit-specific extraction buffers provided by the respective commercial kits. Several biochemical markers in the whole-body homogenates were evaluated, as described below. Metabolic indicators: total cholesterol (T-CHO, #A111-1-1), low-density lipoprotein cholesterol (LDL-C, #A113-1-1), high-density lipoprotein cholesterol (HDL-C, #A112-1-1) (Nanjing Jiancheng Biological Engineering Research Institute, Nanjing, Jiangsu province, China). Energy and hormonal markers: insulin and ATP (Shenzhen Zike Biotechnology Co., Ltd., #A016-2, #ZK-F6251, Shenzhen, China). Oxidative stress markers: superoxide dismutase (SOD) (Shenzhen Zike Biotechnology Co., Ltd., Shenzhen, China) and GSH (Jiangsu Keygen Biotechnology Co., Ltd., Nanjing, Jiangsu province, China).
(2) Liver Mitochondrial Isolation and Functional Analysis. To evaluate
mitochondrial function, liver mitochondria were isolated using a kit to prepare a
mitochondrial suspension (#KGA829, Jiangsu Keygen Biotechnology Co., Ltd.,
Nanjing, Jiangsu province, China). Briefly, liver tissues were digested in an
enzyme-containing buffer at 37 °C for 2–4 h with gentle shaking (120
rpm). The suspension was filtered through a 200-mesh sieve (Dongguan City Torch
Feng Screen Products Co., Ltd., Dongwan, Guangdong province, China), washed
twice, and aliquoted. ROS were labeled with
2′,7′-Dichlorodihydrofluorescein diacetate (DCFH-DA, diluted 1000 times)
fluorescent probe (S0033S, Shanghai Bio-Tech Biotechnology Co., Ltd., Shanghai,
China) and quantified by flow cytometry (FCM). To determine the membrane
potential (
Zebrafish biopsy specimens (1 mm
ROS and JC-1 were analyzed using flow cytometry and its software (NovoCyte, version 8.0.2, Agilent, Santa Clara, CA, USA) [28]. For DCFH analysis, the qualitative of ROS levels was based on the fluorescence intensity distribution, where the peak shift in histograms reflects changes in ROS levels. In addition, standardized criteria were established to evaluate the degree of peak shift for each group, enabling a clear distinction between increases and decreases in ROS levels. For quantitative analysis, we used the peak fluorescence intensity values, which allowed for objective comparison of ROS levels across groups. Similarly, for JC-1 analysis, a quadrant gate in NovoCyte was utilized to distinguish between monomeric (green fluorescence) and aggregated (red fluorescence) forms of the dye. Within the standard quadrants, data in the lower-right quadrant reflects the degree of mitochondrial membrane potential depolarization.
Biochemical indicators were analyzed using GraphPad Prism 8.0.2 (GraphPad
Software Inc., San Diego, CA, USA). Data are presented as the mean
The results presented in Fig. 3A show that ST ameliorates hyperglycemia and
insulin resistance in zebrafish. The fasting blood glucose level in the control
group was relatively stable, with individual values of between 1.5 mmol/L and 3.5
mmol/L. In contrast, zebrafish in the T2DM group exhibited significantly elevated
fasting blood glucose levels, ranging from 3.7 mmol/L to 7.8 mmol/L (p
 Fig. 3.
T2DM zebrafish groups display different degrees of blood sugar
and blood lipid metabolism disorders. (A) Blood sugar. (B) Insulin. (C)
Condition factor (CF). (D) Low-density lipoprotein cholesterol (LDL-C). (E)
High-density lipoprotein cholesterol (HDL-C). (F) Total cholesterol (T-CHO). #
denotes a significant difference between the control group and the other groups,
while * denotes a significant difference between the T2DM and T2DM+ST groups.
Significance thresholds are marked as follows: ns p
Given the frequent association of T2DM with insulin resistance and lipid
metabolic anomalies, we compared the blood lipid profiles across the three
groups. The CF level in the T2DM group was significantly higher than in the
control group (p
As expected, a significant increase in ROS production was observed in the liver
of T2DM zebrafish. Furthermore, ST reduced ROS production in the liver of T2DM
zebrafish by an average of 28% (Fig. 4A,B, p
 Fig. 4.
High glucose induces the generation of oxidative stress. (A)
Scatter plot of 2′,7′-Dichlorodihydrofluorescein (DCFH)-labeled cell
clusters in zebrafish liver. (B) Fluorescence intensity analysis of DCFH. (C)
Comparative analysis of superoxide dismutase (SOD) content. (D) Comparative
analysis of GSH content. # denotes a significant difference between the control
group and the other groups, while * denotes a significant difference between the
T2DM and T2DM+ST groups. Significance thresholds are marked as follows: ns
p
To further assess the impact of ST on mitochondrial dysfunction, the
mitochondrial membrane potential (MMP) and ATP levels were evaluated in zebrafish
across the experimental groups. JC-1 staining was used to evaluate MMP. A higher
proportion of cells in Q3–4 (green fluorescence) indicates lower mitochondrial
membrane potential, which is consistent with mitochondrial depolarization. The
T2DM group exhibited a significant decrease in MMP of 68.6% compared to the
control group (Fig. 5A,B, p
 Fig. 5.
Mitochondrial membrane potential and adenosine triphosphate
(ATP) levels in zebrafish liver tissue. (A) Scatter plot of cell clusters
labeled with
5,5′,6,6′-Tetrachloro-1,1′,3,3′-tetraethylbenzimidazolylcarbocyanine
iodide (JC-1) in zebrafish liver. JC-1 staining was used to evaluate the
mitochondrial membrane potential (MMP). (B) Fluorescence intensity analysis of
JC-1. (C) Comparative analysis of ATP content. # denotes a significant
difference between the control group and the other groups, while * denotes a
significant difference between the T2DM and T2DM+ST groups. Significance
thresholds are marked as follows: p
The T2DM group displayed a plethora of mitochondrial anomalies in their liver
myofibrils, characterized by heterogeneous shapes and sizes (Fig. 6). These
mitochondria predominantly exhibited flattened or elongated cristae, accompanied
by the presence of numerous myeloid bodies within. A majority of the mitochondria
in randomly selected microscopic fields of T2DM zebrafish liver exhibited
disrupted double-membrane structures (white arrow in Fig. 6), indicating the
presence of significant structural damage. Concurrently, instances of
mitochondrial fusion and fission were observed (black arrow). In comparison,
zebrafish in the T2DM+ST group showed greatly improved mitochondrial structure. A
substantial accumulation of
 Fig. 6.
Transmission electron micrographs of liver mitochondria in zebrafish. G represents accumulated glycogen in the liver. The black arrows indicate the morphology of mitochondrial fusion/fission, while the white arrows indicate damage to the mitochondrial double membrane structure. Scale bar: 500 nm.
The shoal test was employed to assess anxiety-like behavior in zebrafish. Fish
tracking software was used to measure the distance between individual fish and
the shoal, as well as variations in the average swimming speed (Fig. 7A). The
T2DM group displayed a significantly longer average distance from the shoal
compared to the control group, indicating reduced social interaction in these
zebrafish (Fig. 7B, p
 Fig. 7.
Shoal test results. Ten zebrafish in each group participated in
the test, with the trajectories represented by different colors. (A) Schematic diagram of the shoaling test (Created using BioRender.com) and zebrafish trajectory. (B) The average distance
between zebrafish in the fish shoal test. (C) The average speed of zebrafish in
the shoal test. # denotes a significant difference between the control group and
the other groups, while * denotes a significant difference between the T2DM and
T2DM+ST groups. Significance thresholds are marked as follows: ns p
We next created two identical virtual partitions (Fig. 8A) to analyze the
exploration patterns (i.e., spatial and temporal dynamics of behavior).
Significant differences in the preference for swim zones (up-down distance/time)
were observed between the control and T2DM groups. Heatmap results showed that
T2DM zebrafish showed a strong preference for the lower region (Fig. 8B–E),
whereas zebrafish in the control and T2DM+ST groups generally preferred the upper
region (Fig. 8A, p
 Fig. 8.
Novel tank test (NTT) results. Ten zebrafish in each
group participated in the test. (A) The movement trajectory of zebrafish and a diagram of the test device (Created using BioRender.com). (B) Swimming time in the top region. (C) Driving
distance in the top region. (D) Latency (time required for first access to the
top). (E) The number of shuttles between the top and bottom region. (F)
Preference of zebrafish for top region. (G) Comparison of the distance traveled
by each zebrafish in the top and bottom regions. (H) Comparison of time spent in
the top and bottom regions for each zebrafish. # denotes a significant
difference between the control group and the other groups, while * denotes a
significant difference between the T2DM and T2DM+ST groups. Significance
thresholds are marked as follows: ns p
The primary objective of this study was to investigate the effect of ST on zebrafish exhibiting both T2DM and anxiety symptoms. Our findings demonstrate that a 20-day ST regimen can effectively ameliorate insulin resistance and dyslipidemia in T2DM zebrafish, as well as counteracting oxidative and mitochondrial dysfunction. Furthermore, ST appeared to repair the anxiety and diminished social cohesion behaviors induced by prolonged exposure to a high-glucose environment. These observations align with prior research findings that have consistently reported multifaceted health benefits of regular ST or aquatic exercises, spanning physical, psychological, and biochemical domains [8, 29]. Notably, the T2DM zebrafish induced in this study with a high-sugar fairy shrimp diet appear to closely mirror the symptomatology and behaviors observed in human T2DM patients.
We observed significant metabolic disturbances in T2DM zebrafish, including hyperglycemia, hyperinsulinemia, and abnormal glycogen accumulation in liver tissues. These findings are consistent with previous study in rodent models of T2DM, where high-sugar diets were shown to impair glucose homeostasis and promote insulin resistance [30]. Importantly, our results demonstrate that intervention with ST effectively restored glucose homeostasis in T2DM zebrafish, suggesting that ST may be a promising therapeutic strategy for managing T2DM-associated metabolic dysfunction. This concurs with clinical study showing that regular physical activity by T2DM patients improves insulin sensitivity and reduces glycemic levels [31].
We also observed significant mitochondrial dysfunction in the T2DM zebrafish
model, including reduced MMP (p
Mitochondrial dysfunction caused by oxidative stress is intricately linked to
the onset of anxiety [34]. Excessive free radical production can disrupt
neurotransmitter equilibrium and neural function, thereby predisposing
individuals to heightened anxiety responses post-stimulation [35]. Previous
studies have focused on the effects of ST in human or rodent models of T2DM.
However, our study is the first to investigate these effects in a zebrafish model
of T2DM with anxiety symptoms, thus providing a novel platform for understanding
the interplay between metabolic and psychological disturbances. As observed in
the NTT experiment, zebrafish introduced to unfamiliar surroundings exhibit
protective diving behaviors characterized by a proclivity to remain at the bottom
of the tank. This behavior is indicative of heightened vigilance to mitigate
potential threats [36]. The T2DM group in our study exhibited more severe
anxiety-like behavior, and especially an increase in latency (p
Our study has several limitations. First, the zebrafish T2DM model induced with a high-sugar diet may not fully reflect the genetic and multifactorial nature of human T2DM. Second, the behavioral assays we conducted provide only indirect measures of anxiety-like behavior. Further studies should incorporate more advanced behavioral analyses to better characterize the psychological changes observed in our model. Third, we did not investigate the underlying molecular mechanisms that might explain how ST affects mitochondrial function and anxiety behavior, which limits our understanding of the detailed pathways involved. Future research should also focus on exploring the specific molecular and cellular mechanisms by which metabolic disturbances can impact mitochondrial function and behavior. Finally, research into the potential role of gut-brain interactions in the pathophysiology of T2DM-related anxiety could offer valuable insights into novel therapeutic approaches.
Collectively, our findings highlight the multifaceted benefits of ST in alleviating metabolic dysregulation, oxidative stress, mitochondrial dysfunction, and anxiety-like behaviors in T2DM zebrafish. ST offers a promising non-pharmacological intervention for T2DM management through its effects on regulating glucose and lipid metabolism, enhancing antioxidant capacity, and preserving mitochondrial integrity. Furthermore, our comprehensive assessment of MMP, ATP, ROS, GSH and SOD levels, as well as ultrastructural analysis, provides strong evidence for the role of ST in maintaining mitochondrial function. Future studies should aim to elucidate the precise molecular mechanisms underlying these protective effects, particularly the involvement of key metabolic and stress-response signaling pathways. This should deepen our knowledge regarding the therapeutic potential of exercise in T2DM treatment.
T2DM, type 2 diabetes mellitus; ST, swimming training; MMP, mitochondrial membrane potential; ATP, adenosine triphosphate; CF, condition factor; LDL-C, low-density lipoprotein cholesterol; HDL-C, high-density lipoprotein cholesterol; T-CHO, total cholesterol; GSH, glutathione; SOD, superoxide dismutase; NTT, novel tank test; TEM, transmission electron microscopy; FCM, flow cytometry; DCFH-DA, 2′,7′-Dichlorodihydrofluorescein diacetate; JC-1, 5,5′,6,6′-Tetrachloro-1,1′,3,3′-tetraethylbenzimidazolylcarbocyanine iodide.
The original contributions presented in this study are included in the article/supplementary material, further inquiries can be directed to the corresponding authors.
Conceptualization, DS, DH and WW; software, LW, JQ and LQ; investigation, DH, JZ, QY and LW; data curation, YF and QY; data interpretation: JQ, JZ and QY; Methodology, YF, WW and CL; writing—original draft preparation, YF; writing—review and editing, YF, JQ and JZ; visualization, CL; supervision, DS; Funding acquisition, DS. All authors contributed to editorial changes in the manuscript. All authors have read and agreed to the published version of the manuscript. All authors have participated sufficiently in the work and agreed to be accountable for all aspects of the work.
The research protocol was approved by the Ethics Committee of Wenzhou University (Ethic Approval Number: WZU-2023-080). Throughout the entire experimental process, the principles of the 3R (Replacement, Reduction, and Refinement) were strictly followed to ensure ethical and responsible use of animals.
We would like to thank Ejear Language Editing Services for their professional assistance in improving the language quality of our manuscript.
This research was funded by Quzhou Municipal Science and Technology Bureau (2022K67, 2022K69).
The authors declare no conflict of interest.
Supplementary material associated with this article can be found, in the online version, at https://doi.org/10.31083/FBL37100.
References
Publisher’s Note: IMR Press stays neutral with regard to jurisdictional claims in published maps and institutional affiliations.