


 , Valeria Gutiérrez-Almaraz 1, Valentina García-Garay 1, Victoria Hernández-Gómez 1, Nohemí Salinas-Jazmín 3, Mónica Graciela Mendoza-Rodríguez 2, Jonadab Efraín Olguín 1,*
1 Área de Citometría de Flujo, Laboratorio Nacional en Salud: Diagnóstico Molecular y Efecto Ambiental en Enfermedades Crónico-degenerativas, Facultad de Estudios Superiores Iztacala, Universidad Nacional Autónoma de México (UNAM), Tlalnepantla, MEX 54090, Mexico
2 Unidad de Biomedicina, Facultad de Estudios Superiores Iztacala, Universidad Nacional Autónoma de México (UNAM), Tlalnepantla, MEX 54090, Mexico
3 Departamento de Farmacología, Facultad de Medicina, Universidad Nacional Autónoma de México (UNAM), 04360 Mexico City, Mexico
Abstract
It is well known that the microenvironment in which an immune response develops, generally pro-inflammatory or immunosuppressive, along with other overproduced biomolecules recognized by pattern recognition receptors, may promote the stimulation and differentiation of monocytes into macrophages with effector functions. Low-density lipoprotein (LDL) plays a fundamental role in cholesterol transport. By contrast, its oxidized form (ox-LDL), which is overexpressed in conditions of obesity and chronic low-grade inflammation, has been associated with cardiovascular diseases. Depending on the microenvironmental context, prostaglandin E2 (PGE2) participates in various scenarios such as inflammation, anti-inflammation, and homeostasis. Therefore, obesity-derived biomolecules such as LDL, ox-LDL, and PGE2 could induce the differentiation of immune cells into effector populations with either pro-inflammatory or immunosuppressive profiles.
In the present work, we studied the effects of LDL, ox-LDL, and PGE2 on the differentiation of the human THP1 monocytic cell line into macrophages under two different protocols, analyzing several activation markers associated with either pro-inflammatory M1 or anti-inflammatory M2 profiles by flow cytometry and quantitative PCR (qPCR).
Our data suggest that native LDL induces the differentiation of human THP1 monocytes into M1 macrophages even more efficiently than classic phorbol 12-myristate 13-acetate (PMA) stimulation, whereas ox-LDL and PGE2 induce the expression of activation markers similarly to interferon gamma or interleukin 4 during PMA preactivation of macrophages.
The results of this study add evidence to the role of obesity-derived biomolecules as non-canonical differentiation stimuli in macrophages, which could be relevant in contexts where these biomolecules are chronically overproduced, such as obesity, low-grade inflammation, type 2 diabetes, and cancer.
Keywords
- macrophages
- monocytes
- immune response
- activation profile
- low-density lipoprotein (LDL)
- oxidized LDL
- prostaglandin E2
- flow cytometry
Overweight and obesity are a public health problem with a prevalence of nearly one billion people worldwide [1, 2]. During their development, both overweight and obesity induce a particular phenomenon called low-grade inflammation, causing chronic activation of the immune response, which in turn is associated with comorbidities such as hypertension, dyslipidemia, type 2 diabetes, and cancer [3, 4]. In the microenvironment where the effector functions of immune cells are developed, such as low-grade inflammation induced by obesity, there are no homogeneous and unique stimuli that clearly polarize immune cell populations towards a specific profile. Instead, there is an interaction with a wide variety of obesity-related biomolecules that induce distinct and multiple phenotypes [5], affecting immune cells’ effector capacity and activation profile. Oxidized low-density lipoprotein (ox-LDL) can differentiate monocytes into macrophages with a proinflammatory profile [6] in a macrophage colony-stimulating factor (M-CSF)-dependent manner [7]. This ox-LDL originates from the oxidation of LDL under conditions of constant stress, which is common in individuals with obesity or elevated triglycerides and cholesterol [8]. It can trigger cardiovascular diseases such as atherosclerosis [6]. Prostaglandin E2 (PGE2) is key in differentiating immune cells during chronic inflammatory processes. Although PGE2 levels increase in conditions such as atherosclerosis, PGE2 can also promote the polarization of macrophages towards an alternatively activated or M2 profile [9], which favors immunosuppression. Finally, macrophages exposed to native LDL can transform into foam cells storing cholesterol [10]; however, native LDL can induce the differentiation of peripheral blood monocytes into macrophages [11], although its M1/M2 profile is still undefined. Therefore, although the literature has shown that classic individual stimuli such as lipopolysaccharide (LPS) or phorbol 12-myristate 13-acetate (PMA) have effects on the activation and differentiation of monocytes and macrophages, it is feasible that direct stimulation of these myeloid cells with LPS, PMA, or obesity-derived biomolecules could induce a completely different effect if monocytes are first preactivated with PMA [12] and subsequently differentiated with obesity-derived biomolecules. This scenario, despite its limitations, would simulate the effects of in vivo processes, where immune cells are constantly stimulated by pathogen- or damage-associated molecular patterns, which are recognized by pattern recognition receptors [13].
In this work, we studied the effects of the biomolecules LDL, ox-LDL, and PGE2
on the differentiation of the THP1 human monocytic cell line into cluster of
differentiation 68-positive (CD68+) macrophages in vitro,
evaluating the activation markers CD14, CD16, Toll-like receptor 2 (TLR2),
lectin-like oxidized low-density lipoprotein receptor-1 (LOX-1) programmed death
ligand-2 (PD-L2), and galectin 9 (Gal9) by flow cytometry. We also described and
compared these effects to those of classical LPS, PMA, interferon gamma
(IFN-
For this work, the THP1 human monocytic cell line (ATCC, Manassas, VA, USA) was
cultured in RPMI-1640 medium (HyClone Laboratories, Logan, UT, USA) supplemented
with 10% fetal bovine serum (FBS) (Mayimex Inc., Mexico City, Mexico) and
2-mercaptoethanol 0.05 mM (Sigma, St. Louis, MO, USA) at 37 °C with 5%
CO2. Culture density did not exceed 2
A frozen vial of THP-1 cells was thawed in a 37 °C water bath for
approximately 2 min. Once removed from the bath, the vial content was transferred
to a 15 mL conical tube (Falcon, Corning, NY, USA) containing 9 mL RPMI complete
medium, which was centrifuged at 600 rpm for 5 min at 25 °C. The pellet
was decanted, and 10 mL saline solution was added for a second wash, followed by
centrifugation under the same conditions. The pellet was resuspended in 5 mL
complete culture medium and placed in a 25 cm2 culture flask (Corning,
Corning, NY, USA), which was incubated at 37 °C with 5% CO2 in the
dark until reaching a confluence of 1
A total of 200,000 monocytes were cultured in non-adherent 24-well culture
plates (Corning) in triplicate for 24, 48, and 72 h. The negative control
consisted of unstimulated THP1 monocytes. Cells were stimulated with 250 ng/mL
LPS (Sigma), 50 ng/mL PMA (Sigma), and 250 ng/mL LPS plus 50 ng/mL PMA. THP-1
cells were stimulated for 72 h with 100 µg/mL LDL (Invitrogen, Carlsbad,
CA, USA), 100 µg/mL ox-LDL (Invitrogen), and 10 ng/mL PGE2 (Sigma). In the
differentiation experiments with IFN-
For phenotype characterization of THP1 monocytes differentiated into macrophages, cells were collected after the respective stimulation protocol into 5 mL round-bottom tubes (Sarstedt Group, Newton, NC, USA). A double wash was performed in each well of culture plates with 200 µL FACS sheath fluid (BD Biosciences, Franklin Lakes, NJ, USA), centrifuging at 1500 rpm at room temperature for 5 min. The supernatant was decanted, and the pellet was resuspended in 50 µL FACS sheath fluid with antibodies targeting the surface molecules to be analyzed by flow cytometry. The antibodies were titrated to evaluate the optimal concentration for every sample. The antibodies used were anti-CD16-PE (50-0166-T100) and anti-CD14 VioletFluor 450 (75-0149-T100) (Cytek Biosciences, Fremont, CA, USA), anti-PD-L2 APC/Cy7 (345516), anti-LOX-1-APC (358605), anti-TLR2-PE/Cy7 (309722), anti-Gal9-FITC (348911), and anti-CD68-APC/Cy7 (333822) (Biolegend, San Diego, CA, USA). Once the antibodies were added, the sample was mixed using a vortex and incubated in the dark at 4 °C for 30 min. To stop the reaction, 1 mL FACS sheath fluid was added, and the sample was centrifuged at 1500 rpm for 5 min at 4 °C. Finally, the supernatant was decanted, the pellet was resuspended in 300 µL FACS sheath fluid, and samples were analyzed using the Attune NxT Flow Cytometer (Thermo Fisher Scientific). Twenty thousand events were recorded from the monocyte cell population defined by size, measured by forward scatter area (FSC-A) and granularity, measured by side scatter area (SSC-A).
Two million THP1 cells were added to 25 cm2 culture flasks (Corning) and stimulated with either PMA or LDL for 72 h. THP1 cells were stained with anti-CD68-APC/Cy7 antibody (Biolegend) as described. Cells were selected by FSC-A, forward scatter height, and SSC-A characteristics and the CD68+ cells with a purity greater than 95% were sorted in the FACSAria Fusion Flow Cytometer (BD Biosciences).
Total RNA was extracted from sorted THP1 cells using Trizol®
(Invitrogen). RNA concentration was determined by measuring the absorbance at 260
nm. One microgram of RNA was used for first-strand cDNA synthesis with the Revert
Aid H Minus First Strand cDNA Synthesis Kit (Thermo Fisher Scientific). Gene
expression was assessed with the 2X Universal SYBR Green Fast qPCR Mix (ABclonal,
Woburn, MA, USA) in the CFX96 Touch Real-Time PCR Detection System (Bio-Rad,
Hercules, CA, USA). Relative gene expression values were normalized to the
constitutive expression of the RPLP0 gene encoding 60S acidic ribosomal protein
P0. Values were determined using the 2-ΔΔCT method. The
specific primers sequences were as follows: inducible NOS (iNOS) F:
5′-CCCTTCCGCAGTTTCTGGCAGCAAC-3′ R:
5′-ATGTCCTGAACATAGACCTTGG3′; IL-1
Flow cytometry samples were analyzed using FlowJo V10 software (BD Biosciences),
To evaluate the statistical differences between experimental groups, the
Student’s t-test was performed with the Shapiro–Wilk test resulting in
W value
Monocytes stimulated with PMA or LPS can express both the CD14 molecule, which
is one of the receptors that recognize LPS [14], and the CD16 molecule, which is
the receptor that recognizes the heavy chain of immunoglobulin Fc
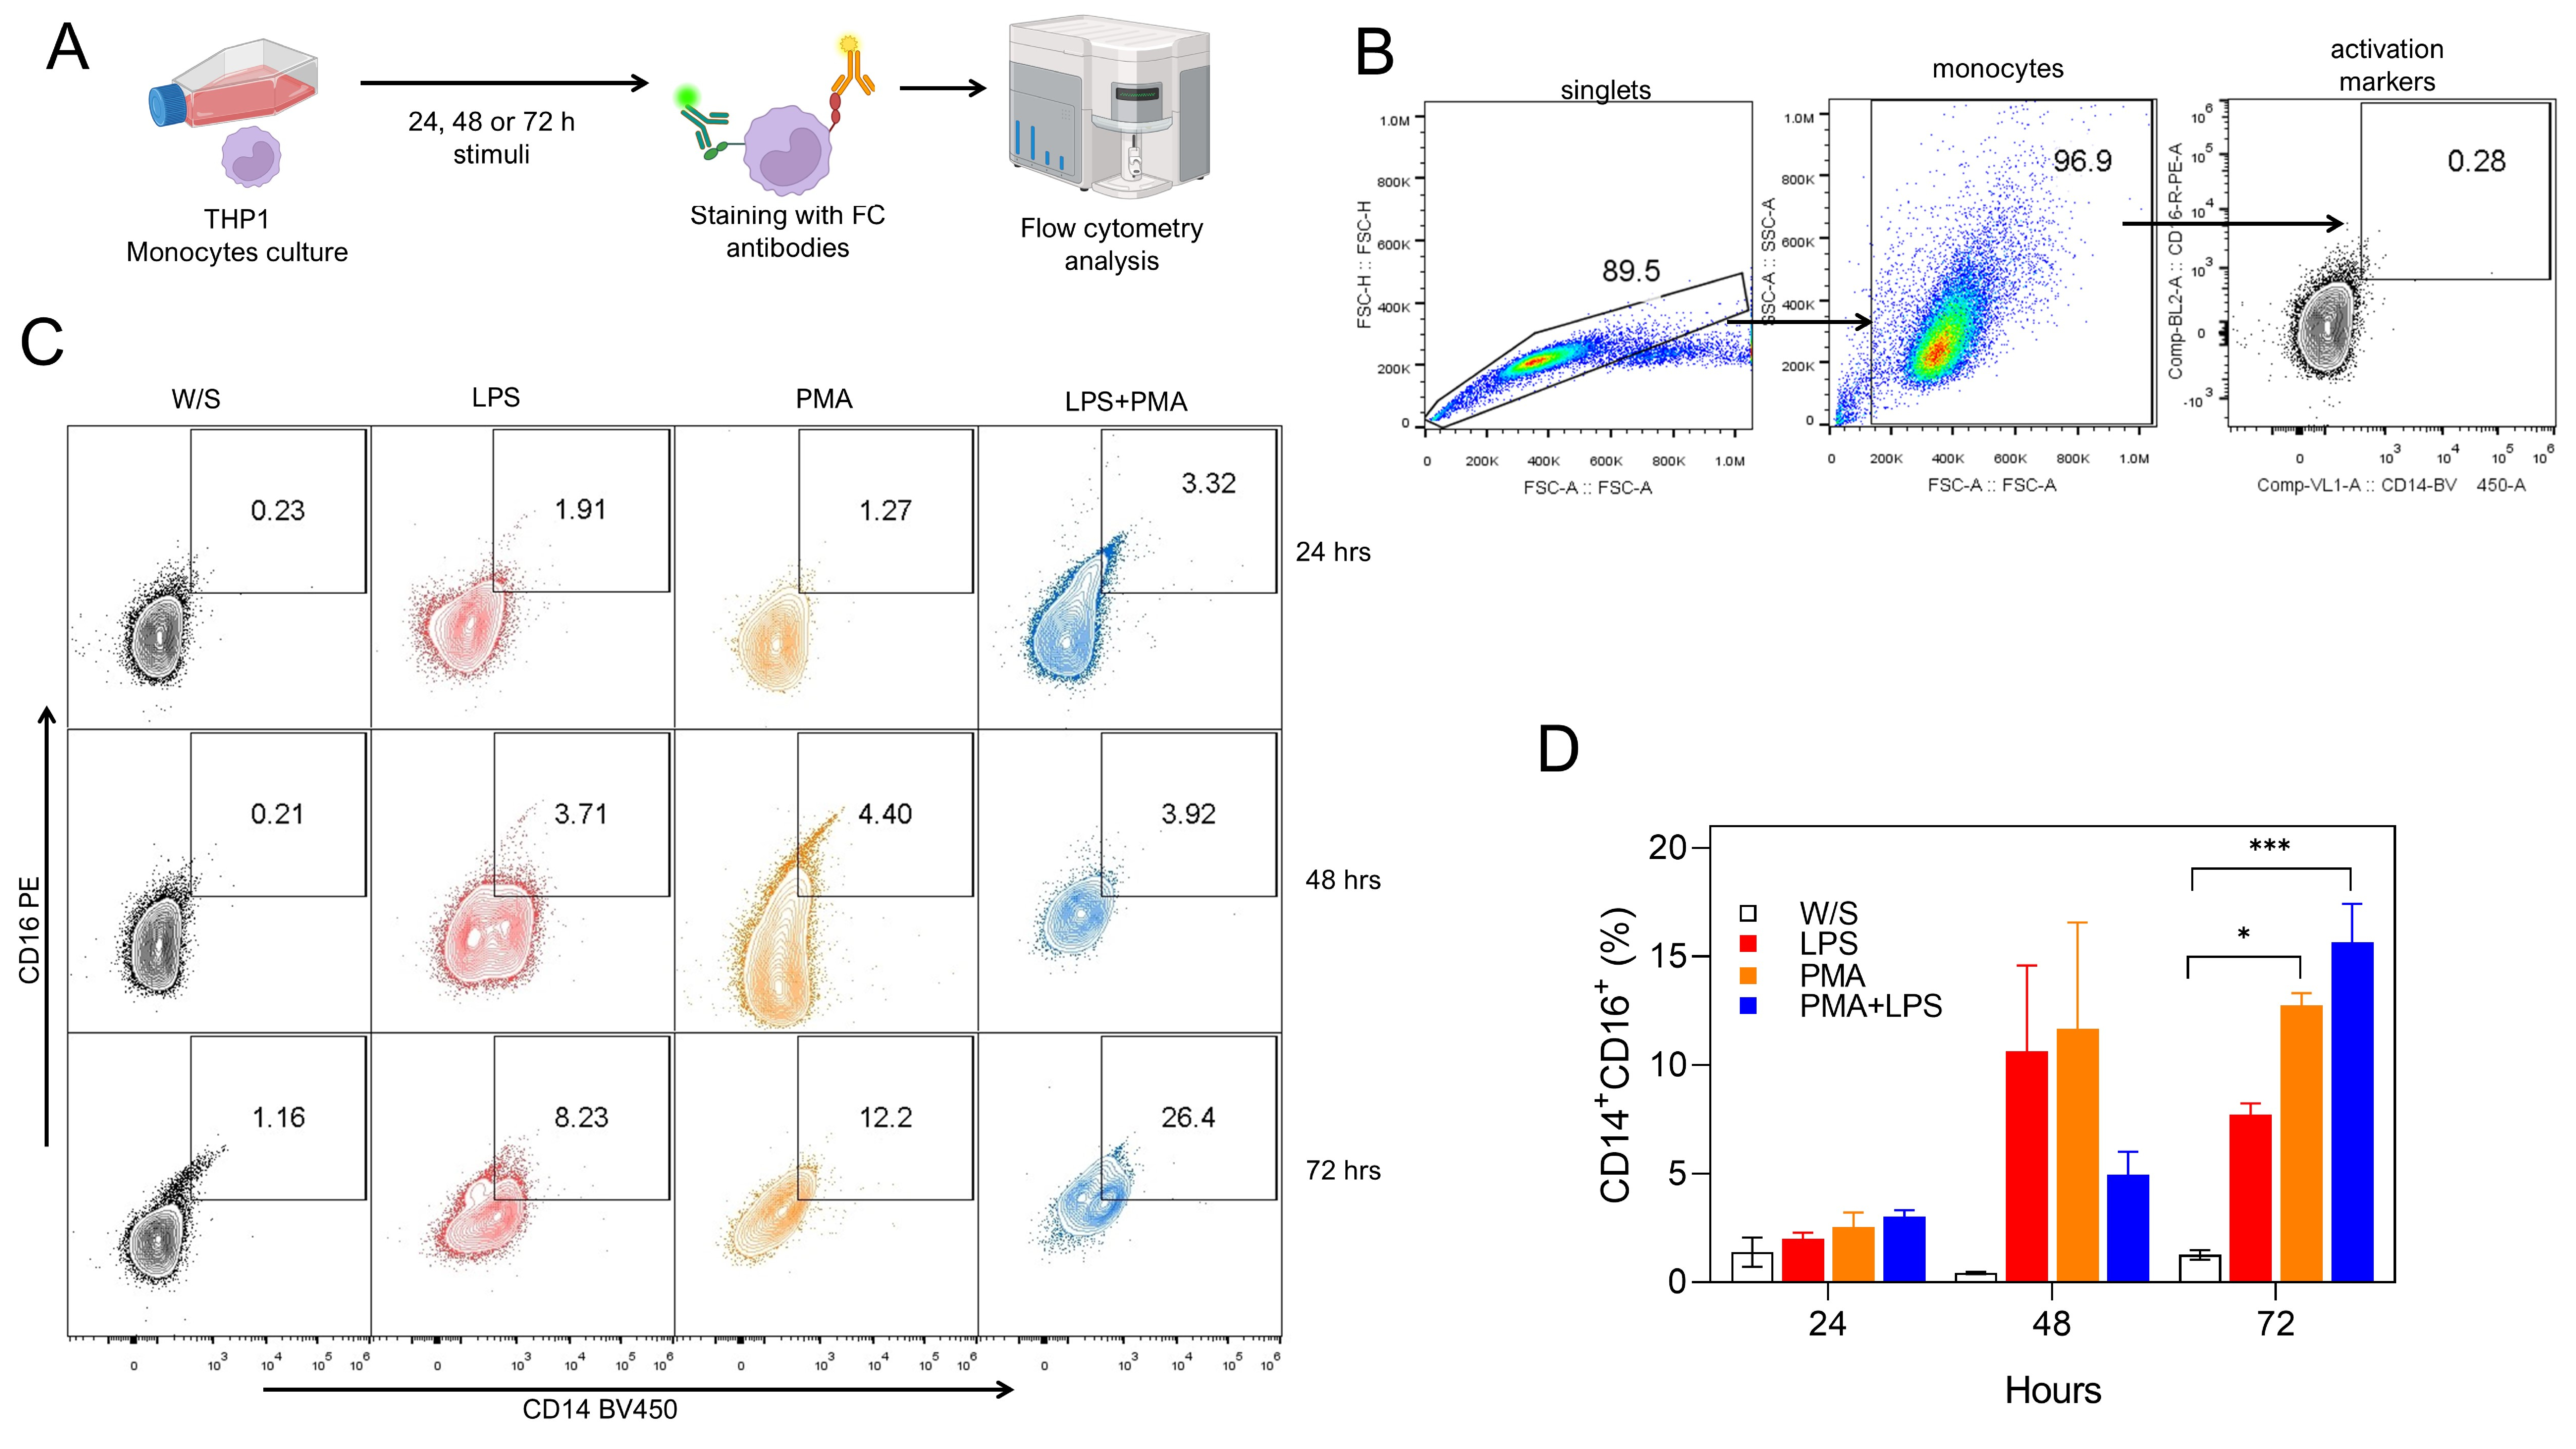 Fig. 1.
Both PMA and LPS induced the activation of monocytes in vitro. (A) Experimental strategy. THP1 cells were cultured for 24, 48, or 72 h with LPS, PMA, or LPS+PMA, after which cells were stained with fluorochrome-coupled antibodies and analyzed by flow cytometry. (B) Analysis strategy for CD14 and CD16 percentage obtained by flow cytometry, where singlets were selected after stimulated monocytes were defined by their FSC-A and SSC-A characteristics. Finally, monocytes were selected by CD14 and CD16 coexpression. (C) Representative (left) and (D) total (right) data obtained from nine independent experiments conducted in duplicate for CD14 and CD16 percentages. W/S: without stimulus in all figures. Statistical differences were assessed by one-way ANOVA followed by the Dunnett’s multiple comparison test with unstimulated cells serving as the control group. *p = 0.0208 and ***p = 0.0002. and CD16 percentages. PMA, phorbol 12-myristate 13-acetate; LPS, lipopolysaccharide; FSC-A, forward scatter area; FSC-H, forward scatter height; SSC-A, side scatter area; ANOVA, analysis of variance; FC, flow cytometry.
Next, we evaluated whether obesity-associated molecules LDL, ox-LDL, and PGE2 may induce a higher percentage of activation markers in THP1 monocytes after 72 h of stimulation. Monocytes were defined by CD16 positivity, and the percentage of CD14, TLR2, LOX-1, PD-L2, and Gal9 markers was simultaneously evaluated based on the analysis strategy described (Fig. 2A). We observed that monocytes exposed to both LDL and ox-LDL displayed a higher percentage of the CD14 population within the CD16+ population, even more efficiently than LPS plus PMA stimulation (Fig. 2B,C). We also found that the combination of LPS plus PMA stimulus on monocytes increased the percentage of the non-classical markers LOX-1 and PD-L2, suggesting that monocytes under these stimuli showed a dual activation profile (Fig. 2B,C) since they simultaneously expressed both classical and alternative activation markers. On the other hand, monocytes stimulated with LDL and ox-LDL did not promote increasing percentages of the LOX-1 molecule, but a significant reduction of PD-L2 expression was observed within the CD16+ population (Fig. 2B,C). The percentage of Gal9+ cells within the CD16 gate increased after LDL exposure (Fig. 2B,C). Stimulation with PGE2 induced a slight, non-significant increase in most of the markers evaluated. Also, the CD16+ monocyte population constitutively expressed the TLR2 receptor under all stimuli analyzed (Fig. 2B,C). These data suggest that the combination of PMA plus LPS stimulus induces the dual expression of classical and non-classical receptors in the THP1 monocyte population, whereas obesity-associated molecules such as LDL and ox-LDL favor a classical profile of CD14+CD16+ monocytes, preventing the expression of molecules associated with suppressive activities on the immune response.
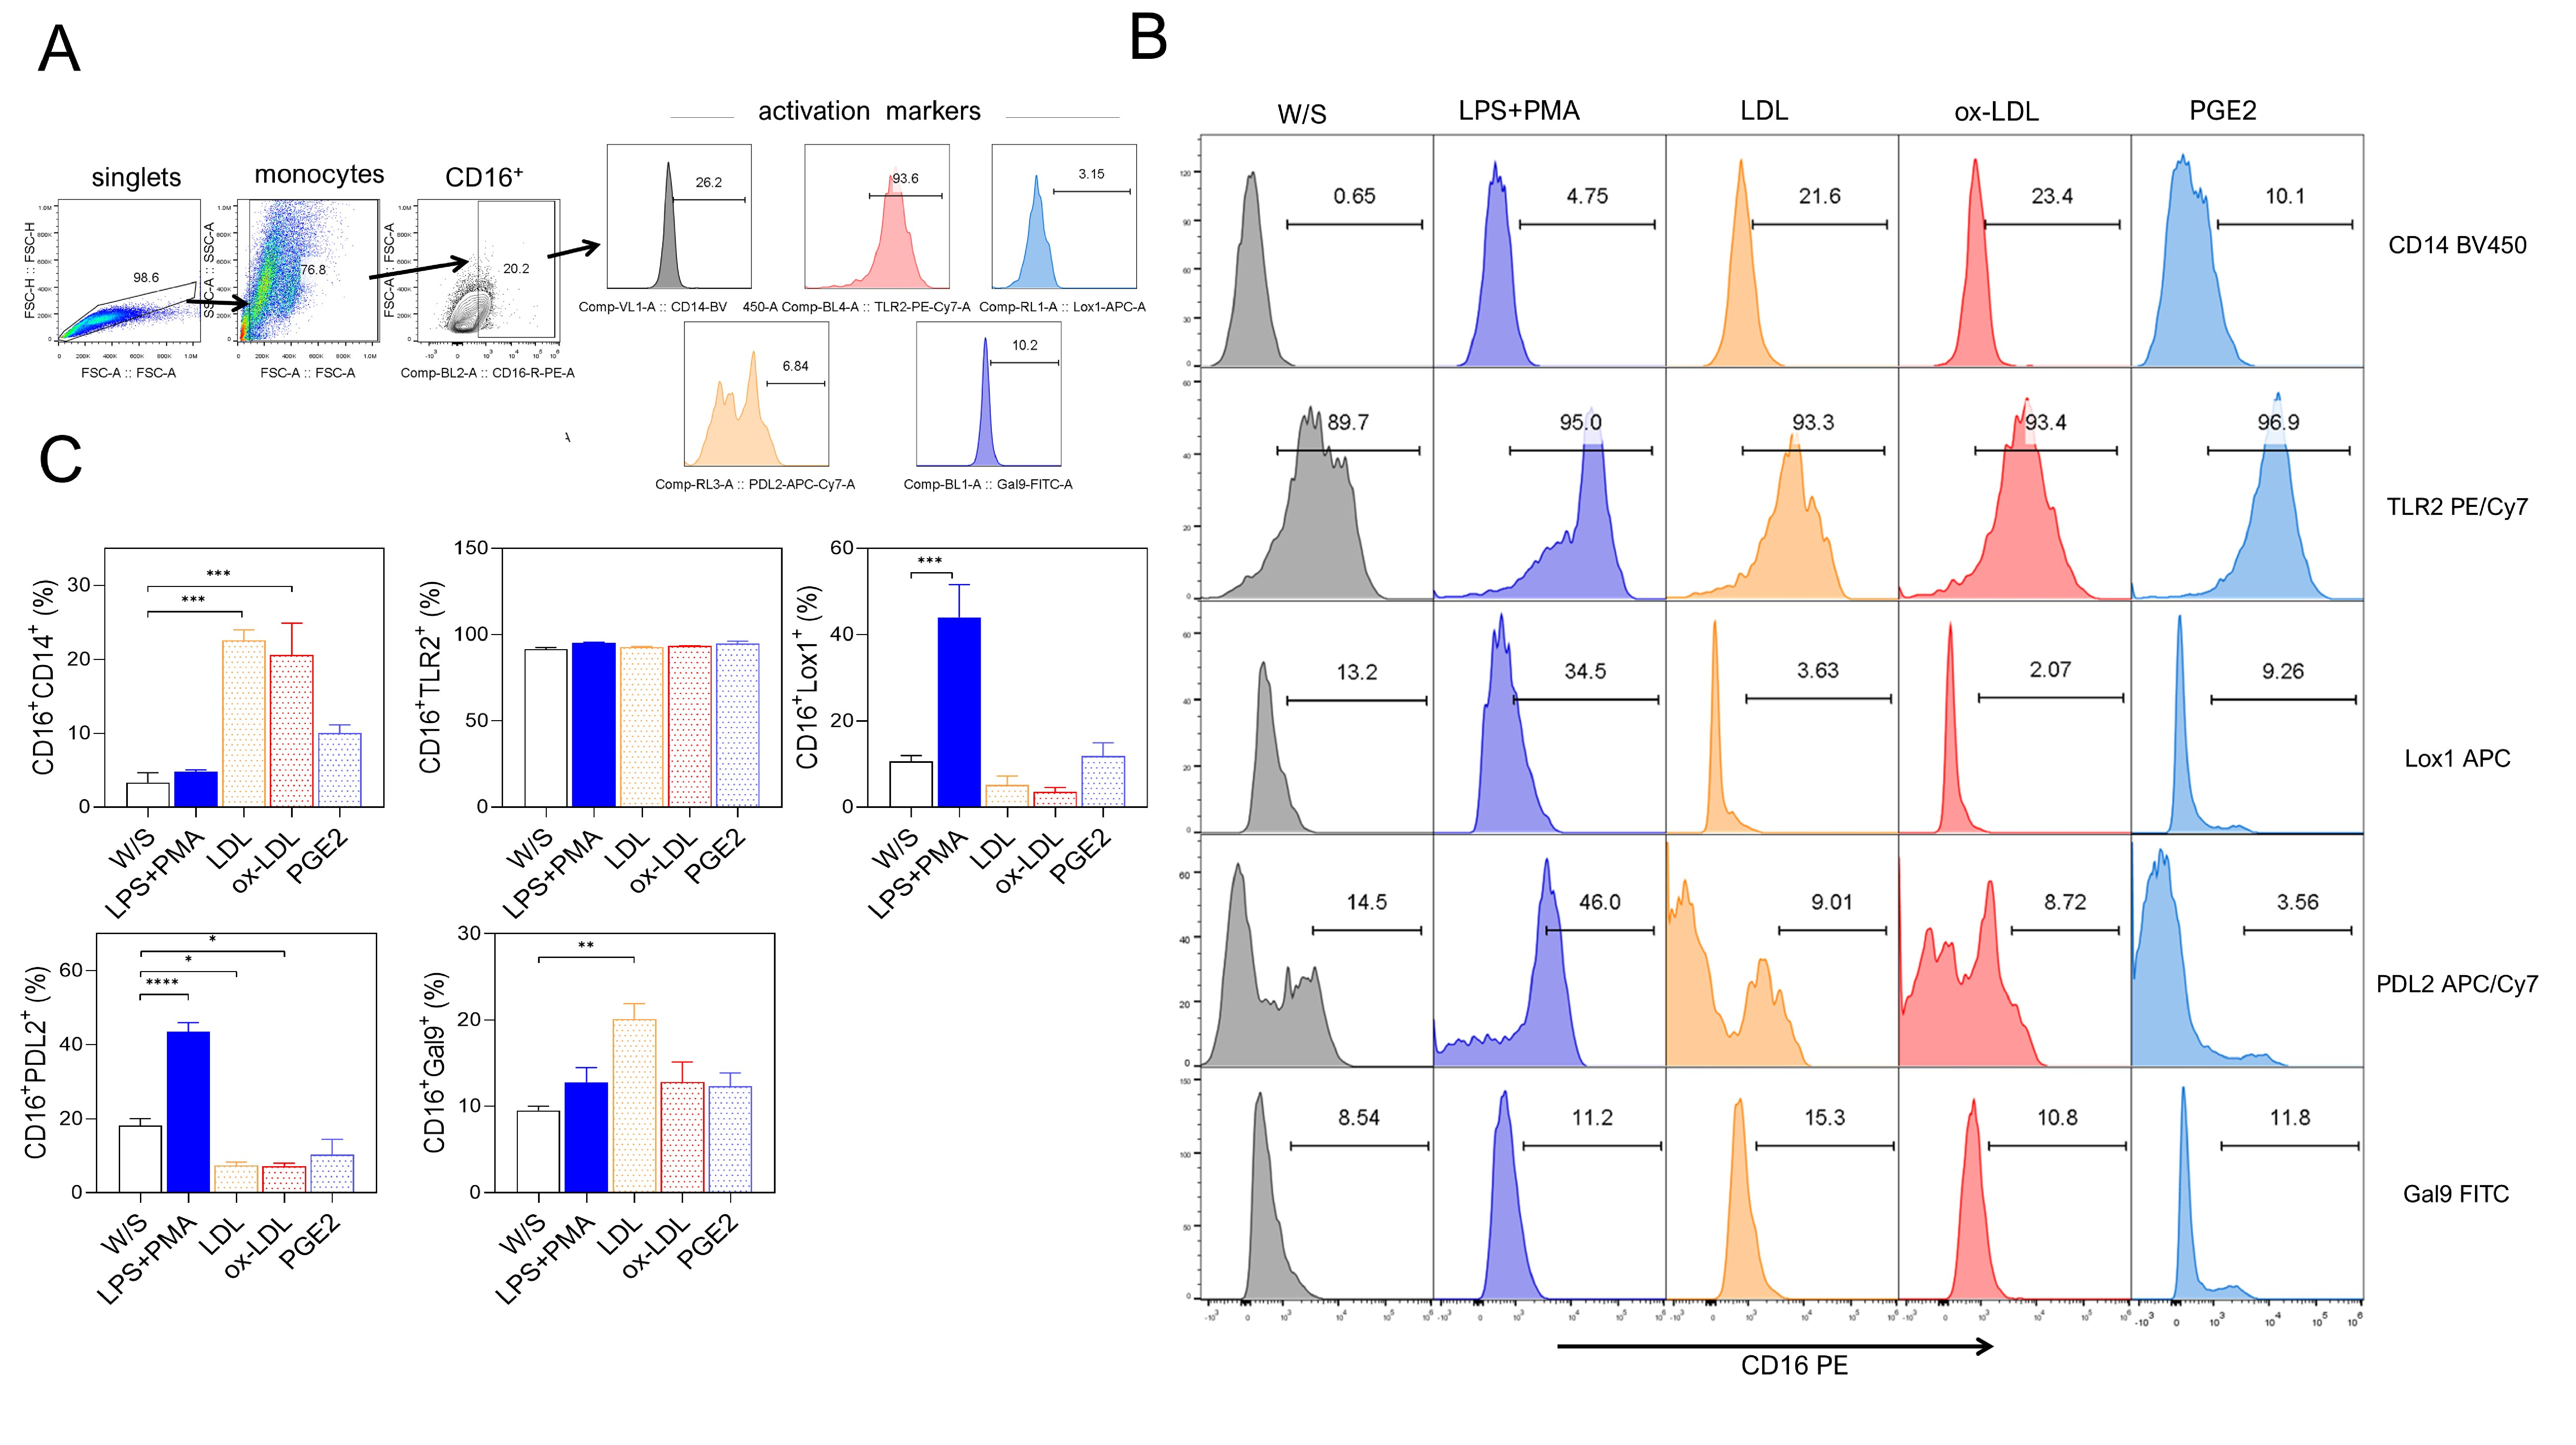 Fig. 2.
Native LDL and ox-LDL induced a pro-inflammatory profile in THP1
monocytes. (A) THP1 cells were cultured for 72 h with LPS+PMA, LDL, ox-LDL, or
PGE2, and analyzed for CD14, CD16, TLR2, LOX-1, PD-L2, and Gal9 percentages by
flow cytometry according to the analysis strategy, where singlets were selected
after stimulated monocytes were defined by their FSC-A and SSC-A characteristics
to select CD16+ cells expressing CD14, CD16, TLR2, LOX-1, PD-L2, and Gal9.
(B) Representative and (C) Total data obtained from three independent experiments
performed in duplicate. Statistical differences were analyzed by one-way ANOVA
followed by Dunnett’s multiple comparison test with unstimulated cells as the
control group. ***p = 0.0003 for LDL and ***p = 0.0007 for
ox-LDL in CD16+CD14+ population; ***p = 0.0004 in
CD16+LOX-1+ population; ****p
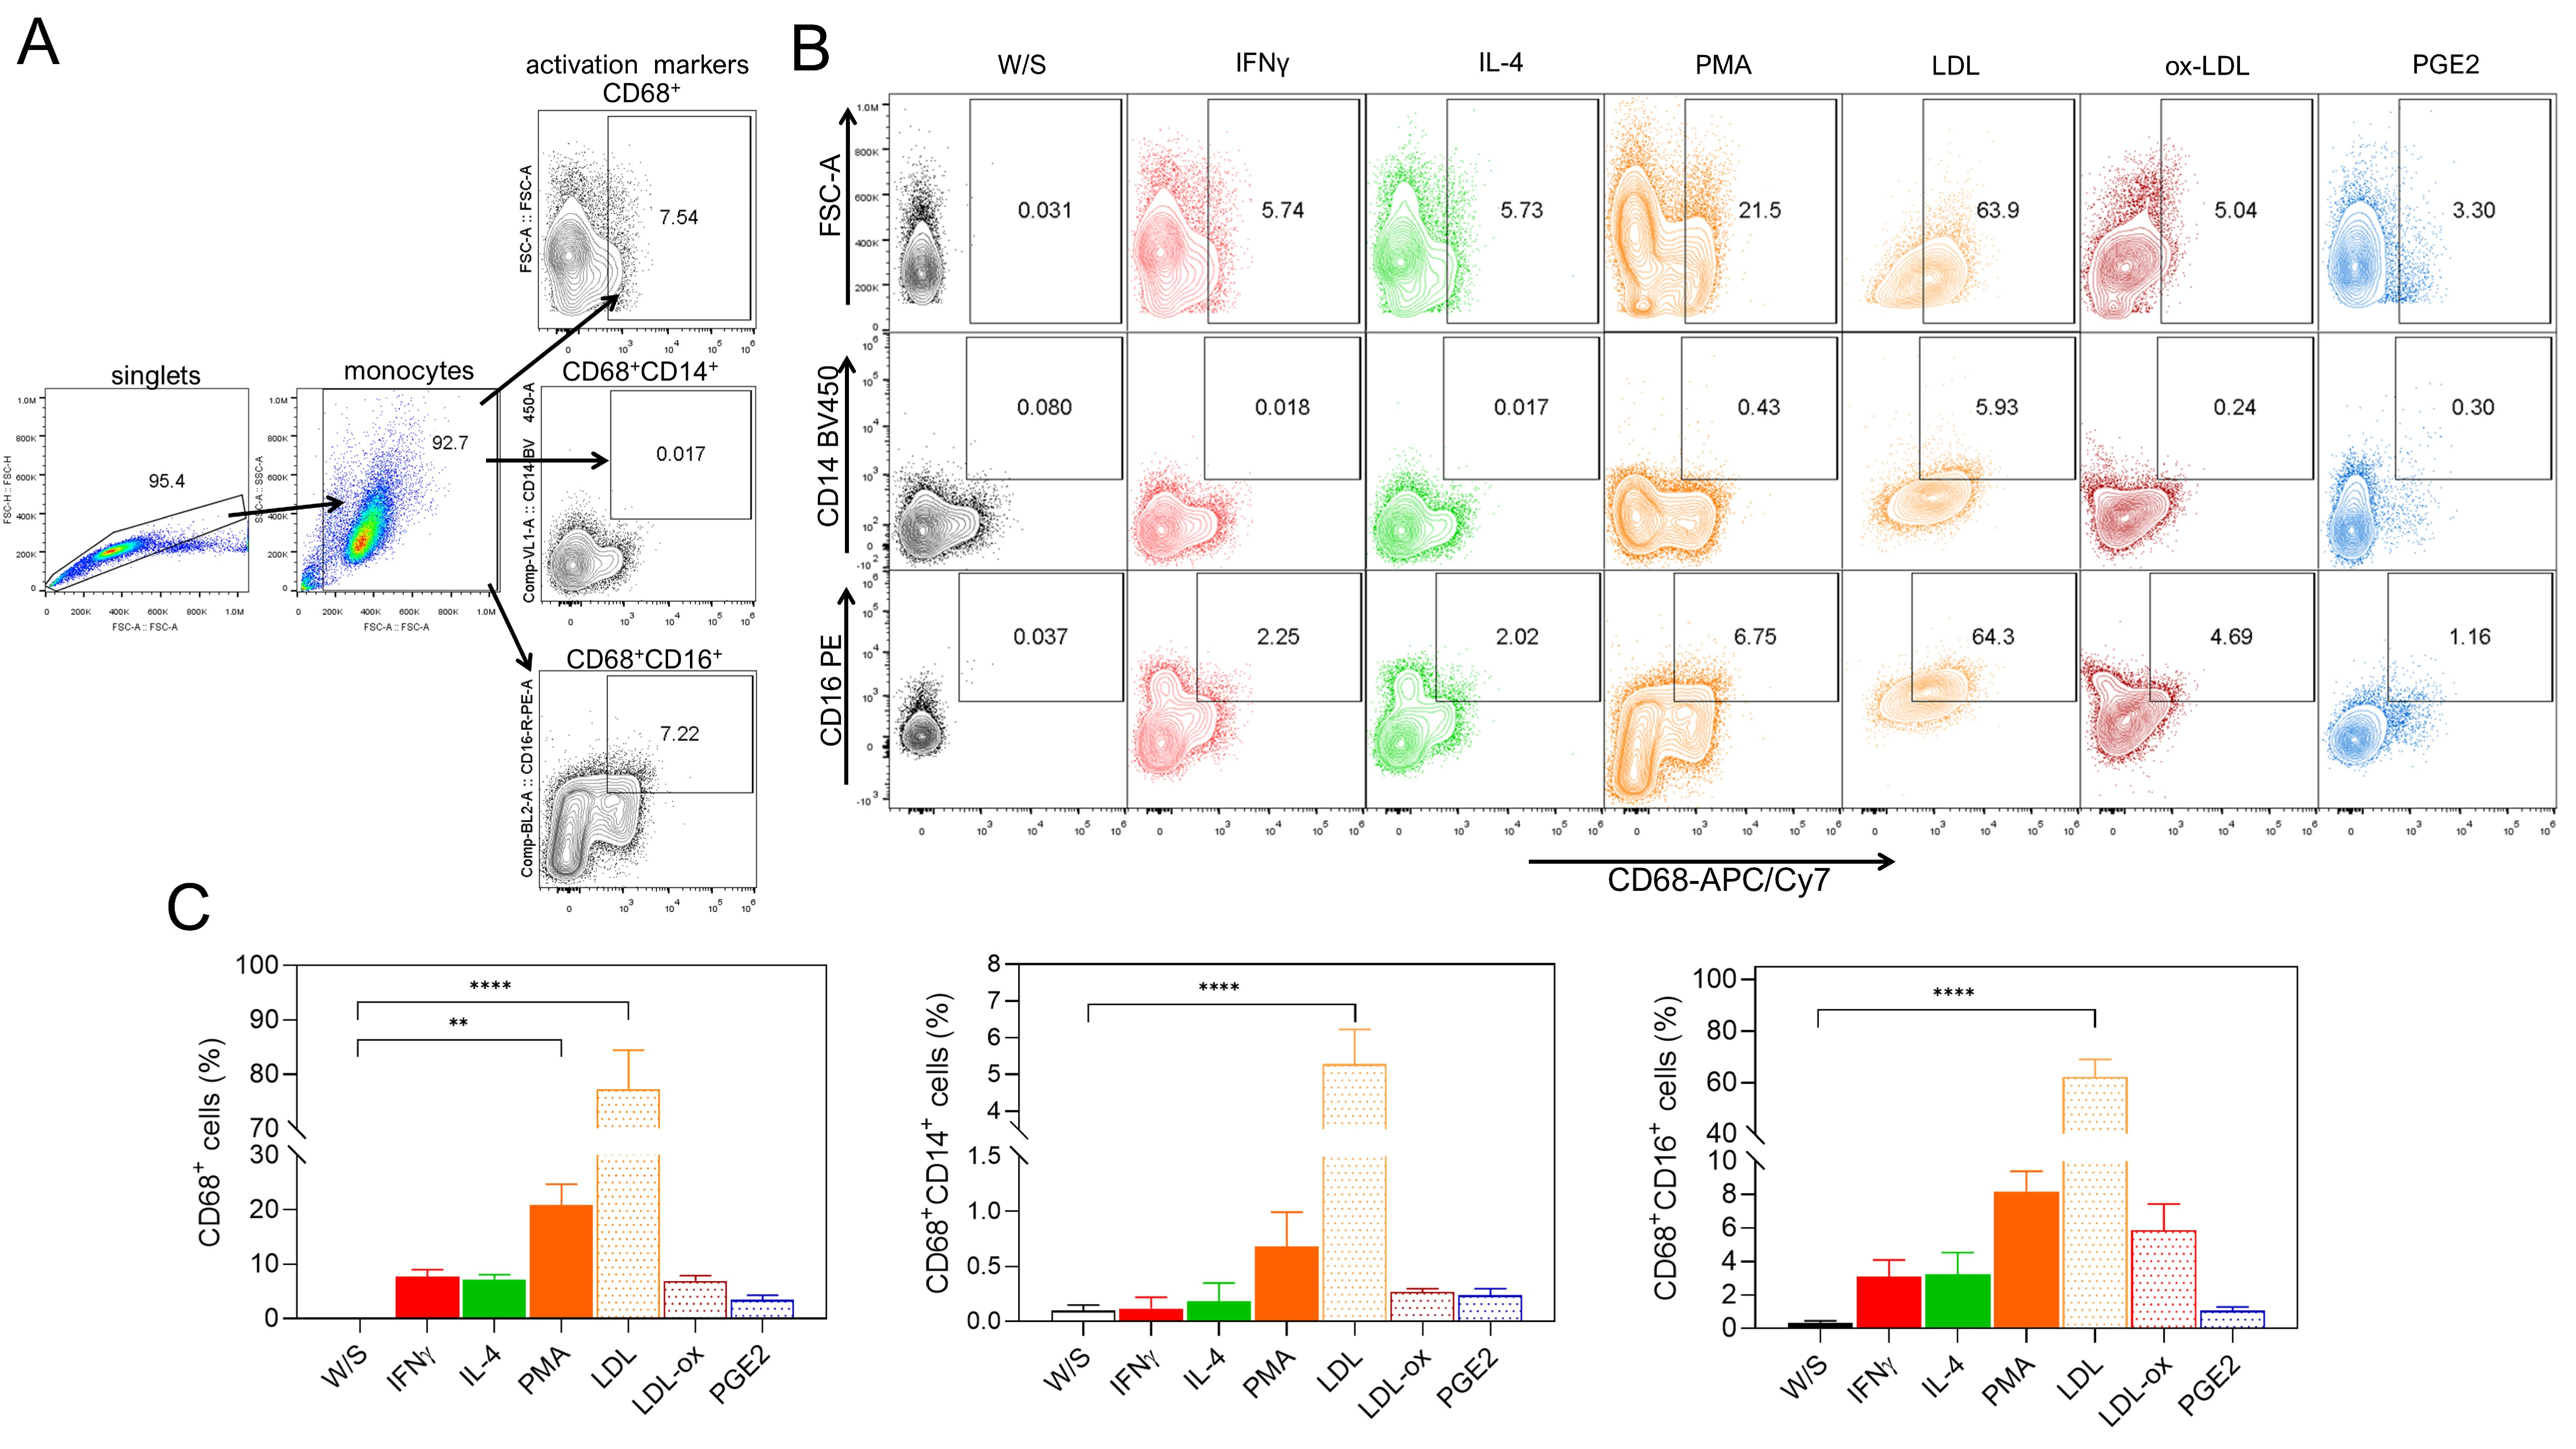
In addition to studying the effect of obesity-associated molecules on the
activation of THP1 monocytes, we also determined whether LDL, ox-LDL, and PGE2
could induce monocyte differentiation into CD68+ macrophages after 72 h of
stimulation. We simultaneously analyzed the percentage of CD14+ and
CD16+ cells within the CD68+ macrophage population (Fig. 3A). We
evaluated the effect of classical stimuli, such as PMA or cytokines like
IFN-
 Fig. 3.
Native LDL and ox-LDL induce the differentiation of THP1
monocytes to CD68+ macrophages. (A) THP1 cells were cultured for 72 h with
IFN-
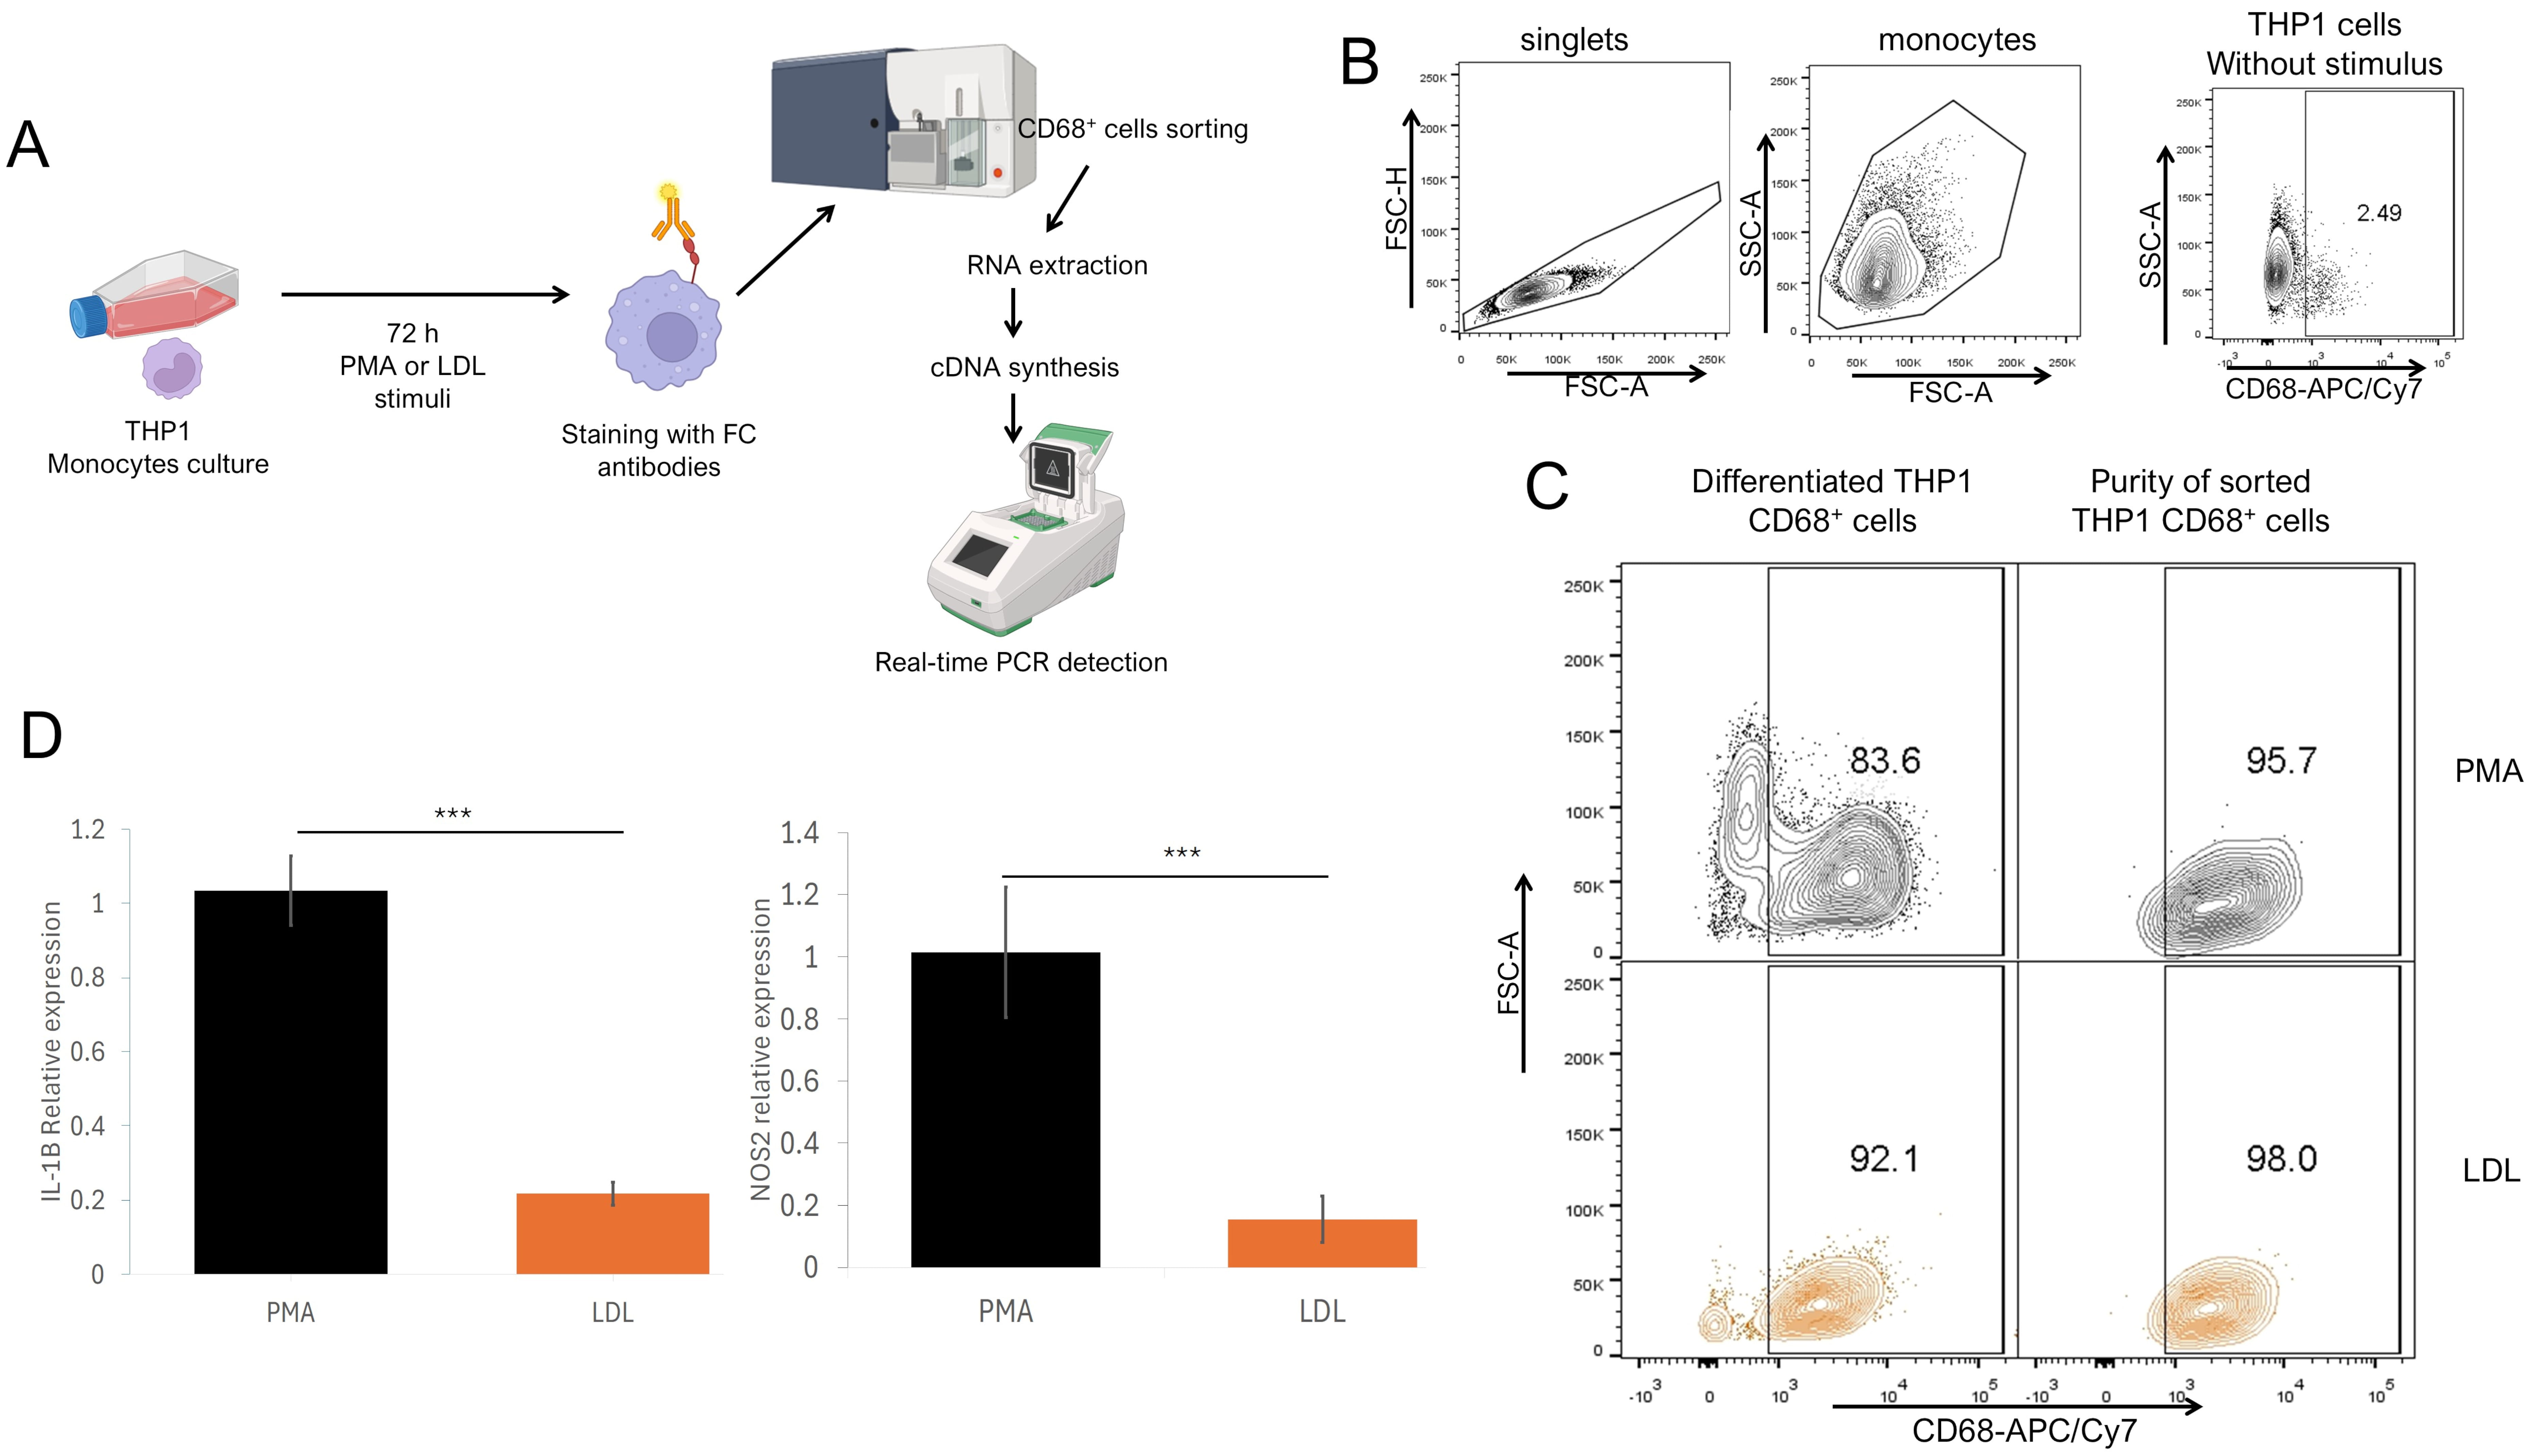 Fig. 4.
M1 gene profile in THP1 CD68+ macrophages stimulated with
native LDL. (A) Experimental strategy. THP1 cells were cultured and stimulated
for 72 h with PMA or LDL, and stained with anti-CD68 fluorochrome-coupled
antibodies and sorted by flow cytometry. CD68+ sorted cells were processed
for RNA extraction and cDNA synthesis for qPCR detection. (B) Analysis strategy
for sorted THP1, using unstimulated THP1 as a control where singlets were
selected after stimulated monocytes were defined by their FSC-A SSC-A
characteristics to sort CD68+ cells vs. SSC-A characteristics. (C) Total
differentiated cells percentage (left) and purity of sorted (right) cells
stimulated with PMA (upper) or LDL (lower). (D) Relative IL-1
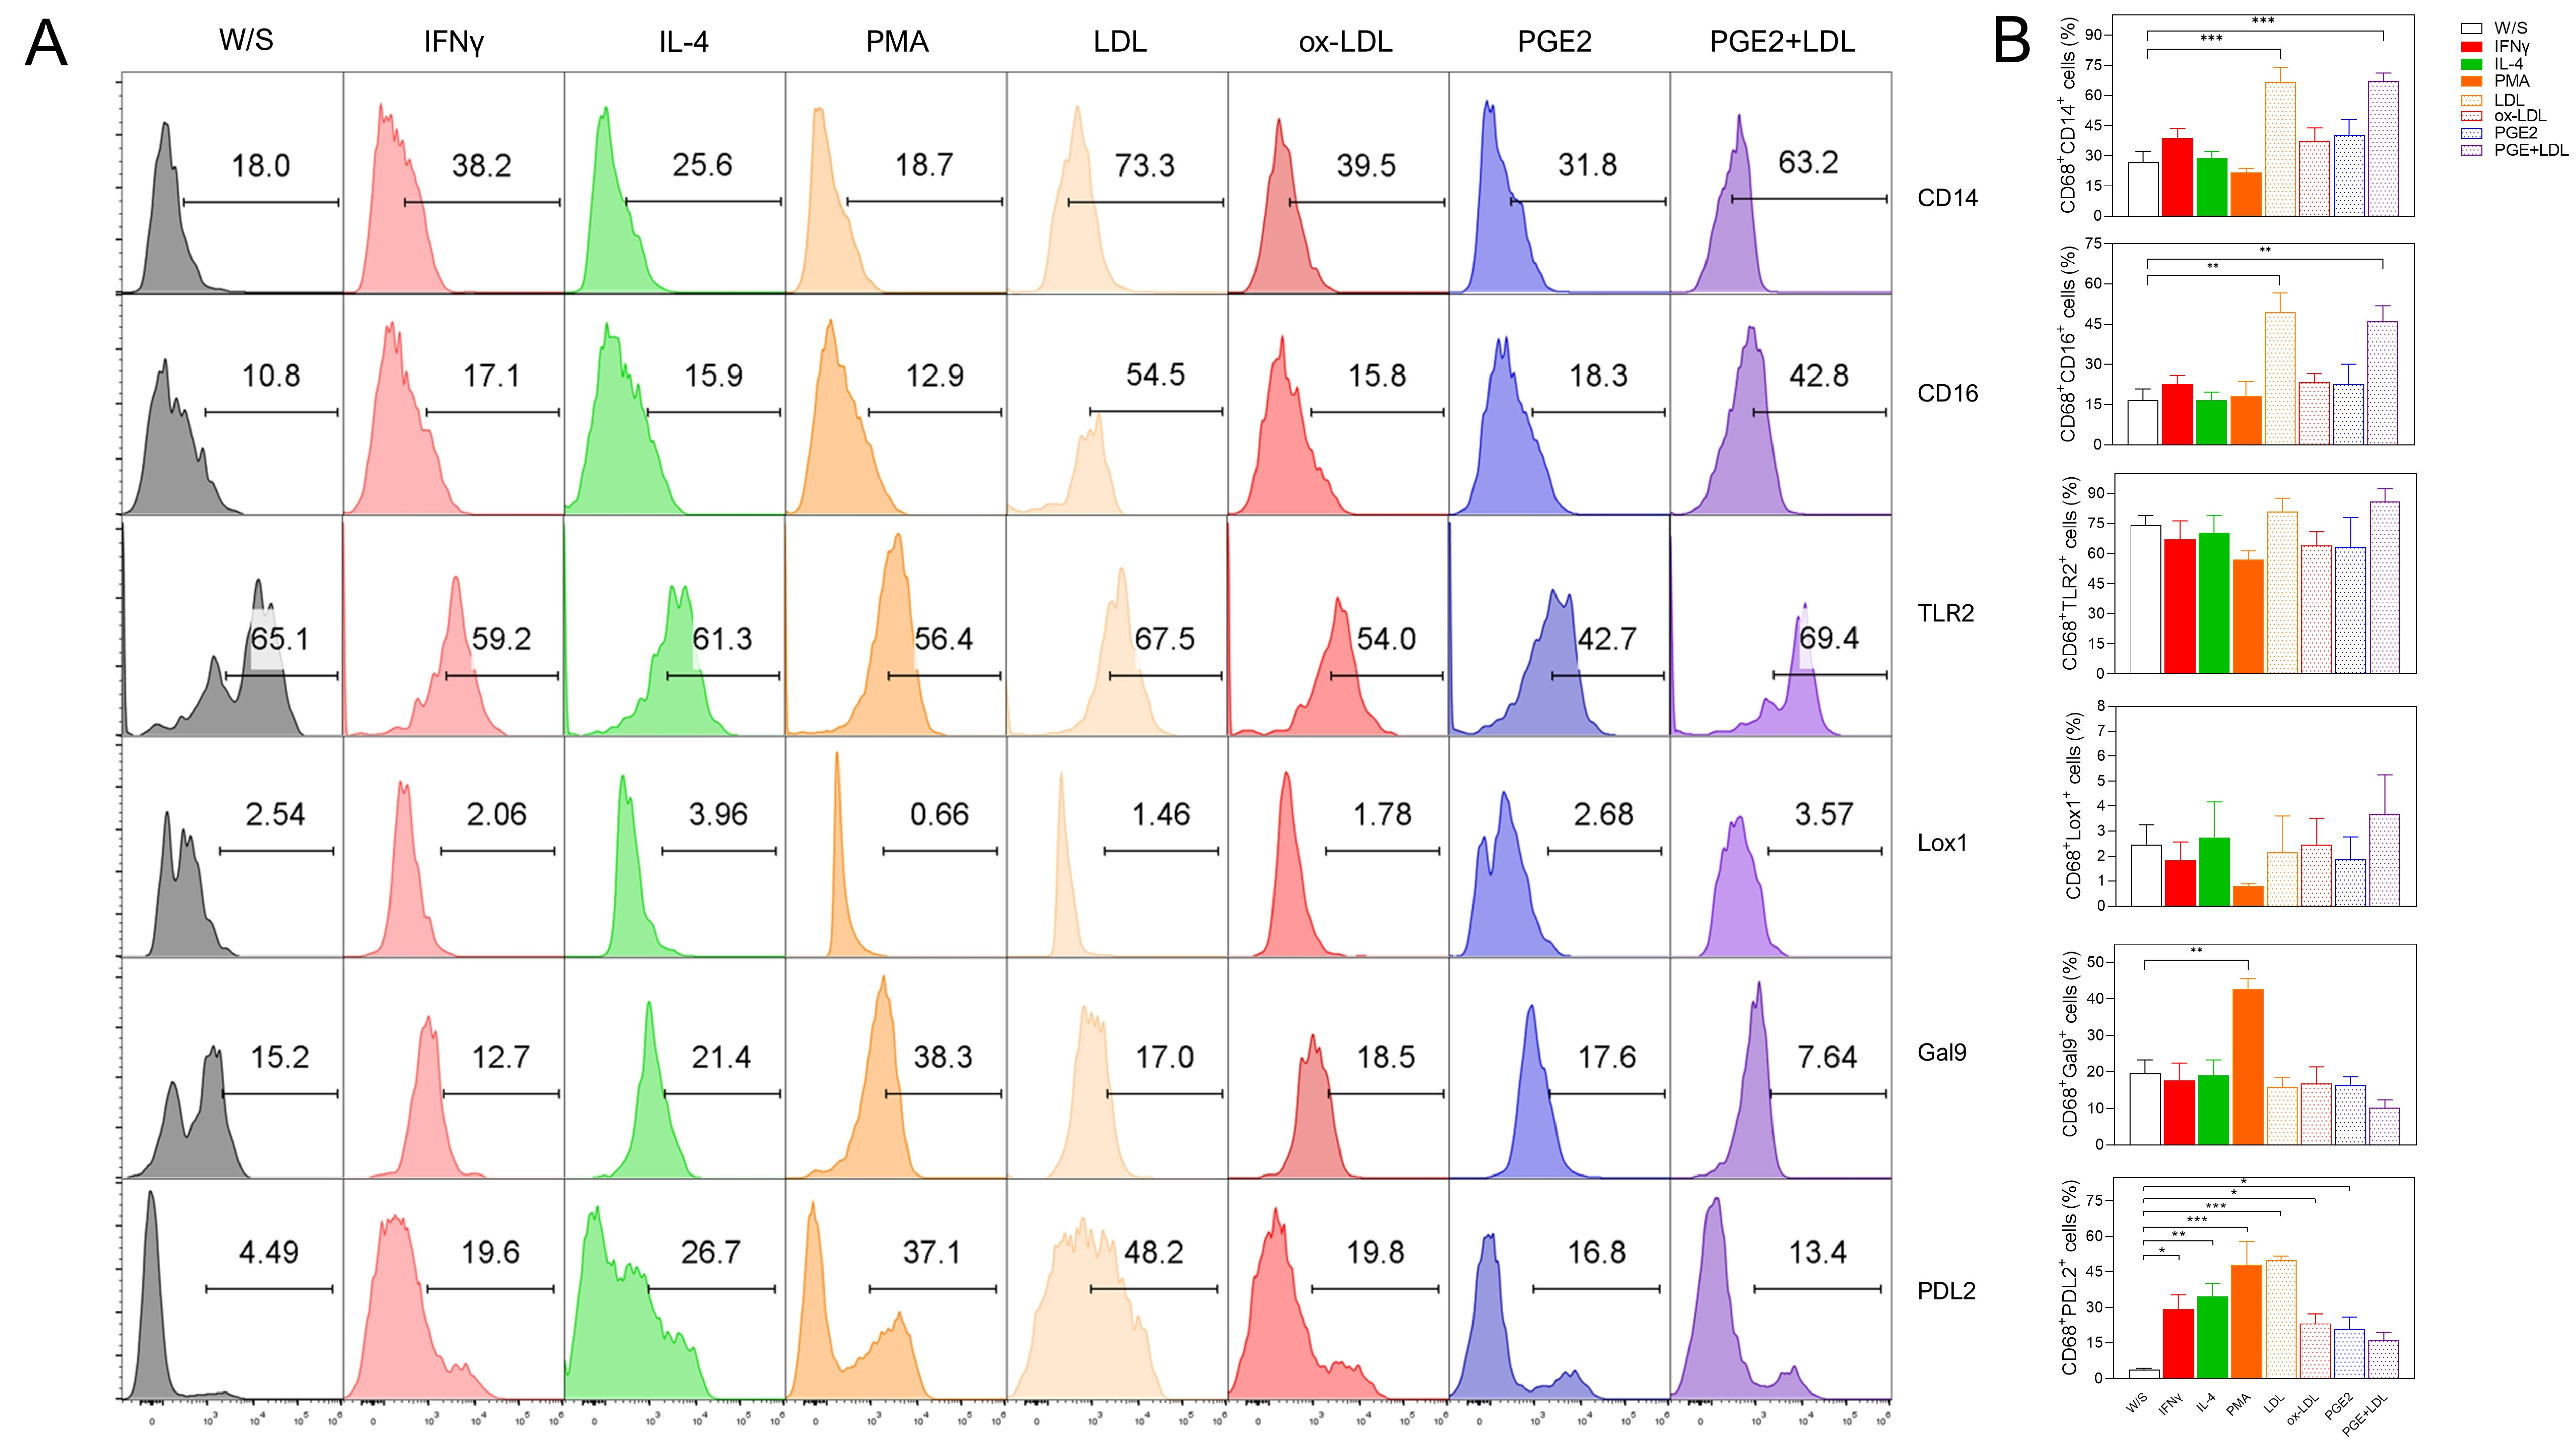
Since we found that native LDL promotes the differentiation of THP1 monocytes
into macrophages, we evaluated whether the obesity-associated molecules LDL,
ox-LDL, and PGE2 may induce changes after pre-differentiating monocytes into
macrophages with PMA [12]. Based on this experimental strategy, THP1 monocytes
were stimulated with PMA for 48 h and characterized by CD11b and CD68 positivity
(Fig. 5B), showing that PMA stimulation significantly increased the percentage of
CD11b+CD68+ macrophages (Fig. 5C). Subsequently, the cultured cells
were rested for 24 h and then stimulated for 72 h with obesity-associated
molecules, as well as classical stimuli such as PMA and cytokines IFN-
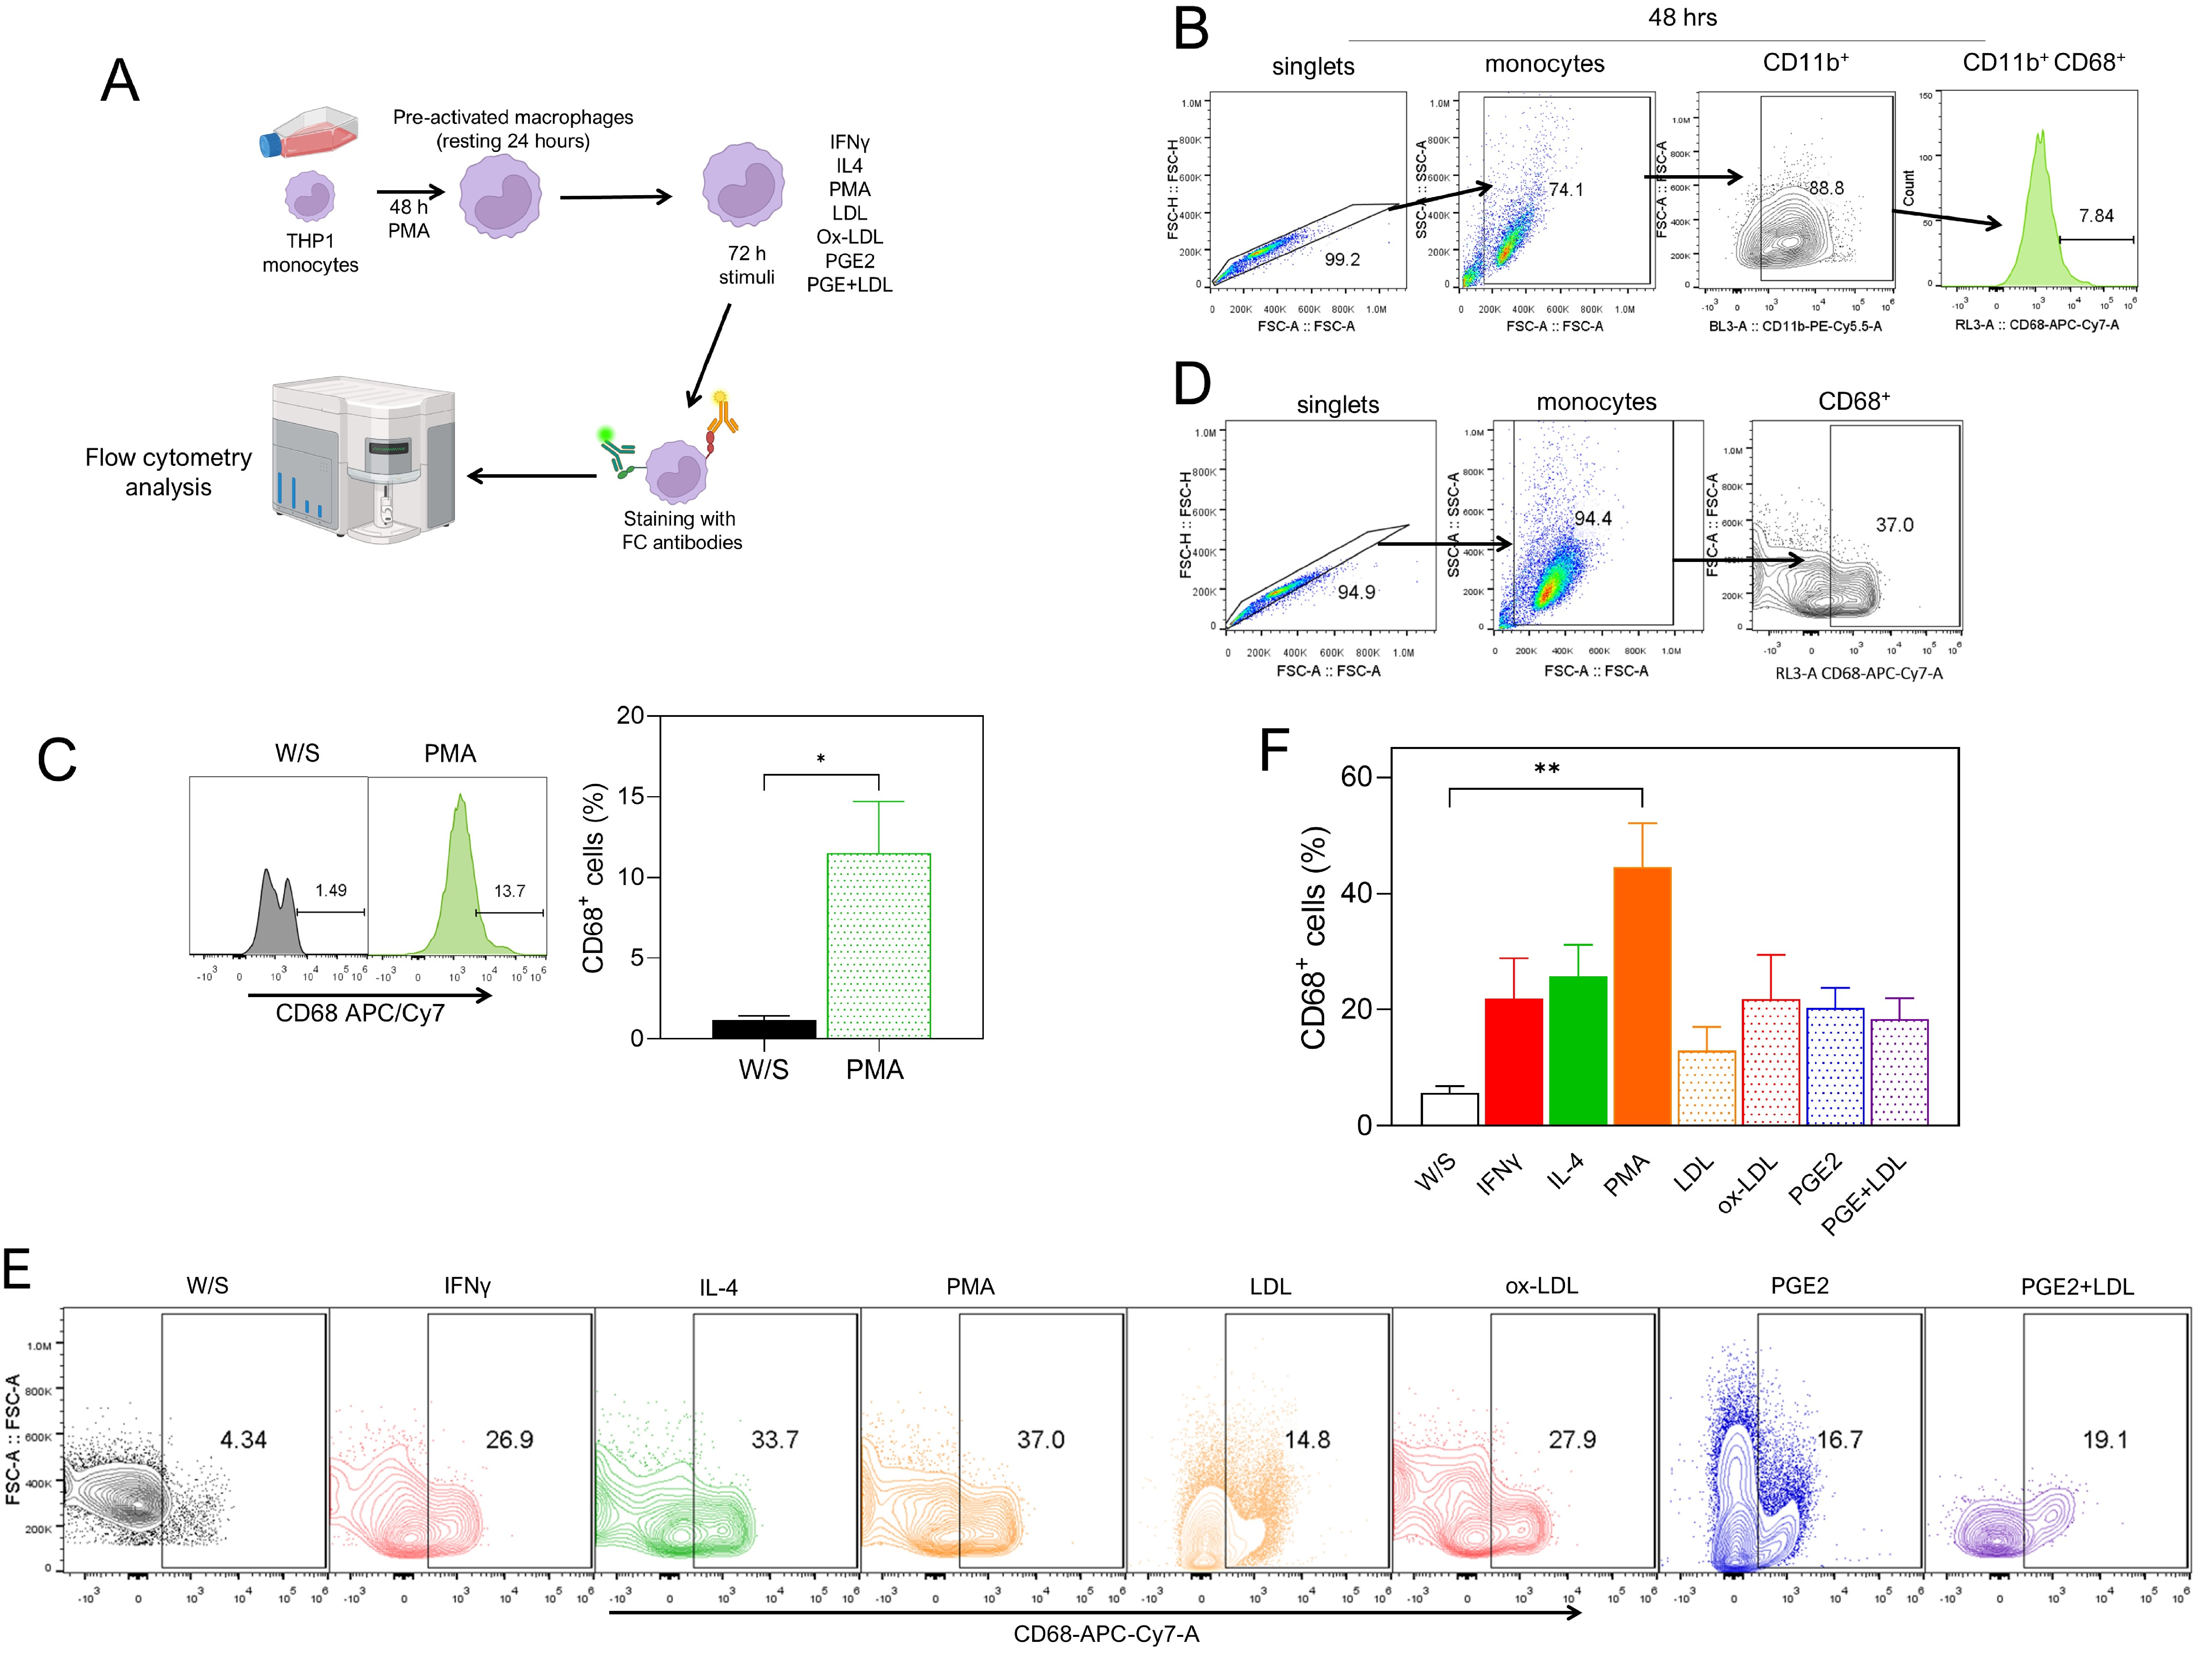 Fig. 5.
Native LDL, ox-LDL, and PGE2 induced increased differentiation
of PMA-preactivated THP1 monocytes to CD68+ macrophages. (A) Experimental
strategy. THP1 cells were cultured for 48 h with PMA, washed and rested for 24 h,
and finally stimulated for 72 h with IFN-
 Fig. 6.
Native LDL, ox-LDL, and PGE2 induced a dual activation profile
in PMA-preactivated THP1 CD68+ macrophages. THP1 cells were cultured for 48
h with PMA, washed and rested during 24 h, and finally stimulated for 72 h with
IFN-
Monocytes and macrophages are myeloid cells with essential mechanisms for
immunity generation; monocytes develop their functions mainly in blood,
macrophages are differentiated in tissues where they are involved in processes
like phagocytosis, antigen presentation, cytokine production, or tissue repair
[16]. Classical, intermediate, and non-classical nomenclature has been described
for blood monocytes based on CD14 and CD16 expression [17]. However, this
classification is not homogeneous in THP1 cells, where it has been widely
accepted that either PMA [18, 19] or LPS stimulation induces a pro-inflammatory
profile [20, 21, 22]. Under controlled in vitro conditions, the classical or
M1 macrophage profile is obtained from monocytes stimulated with either PMA [20],
LPS [23], cytokines such as IFN-
Our results strongly showed that when THP1 cells were exposed for 72 h to LPS,
PMA, or IFN-
On the other hand, when monocytes were pre-stimulated with PMA for 48 h and subsequently stimulated with obesity-associated biomolecules such as LDL, ox-LDL, and PGE2, we observed improved differentiation into CD68+ macrophages under all evaluated conditions. These macrophages exhibited a dual activation phenotype. This finding, despite its in vitro approach, better represents the frequent conditions encountered by monocytes in an ordinary in vivo context, where a wide variety of stimuli collectively define the activation profile of immune cells.
A homogeneous or singular stimulation does not exist under ordinary stimulus
conditions, such as inflammation. Instead, the immune response faces varied mixed
stimuli, such as cytokines, pathogens, and damaged-associated molecular patterns,
which are potent stimulants for differentiating innate immune cells [33].
Likewise, how innate immune cells are activated and differentiated directly
affect the adaptive immune response that occurs, promoting exacerbated or chronic
pro-inflammatory processes and even immunosuppression [34]. During chronic
inflammatory processes such as low-grade inflammation induced by overweight and
obesity, the native biomolecules LDL and PGE2, as well as biomolecules modified
by inflammatory processes like ox-LDL, which are present in both the inflammatory
microenvironment and the adipose tissue associated with inflammation, can favor
the activation and differentiation of immune cells [35]. A spotlight has been
placed on the capacity of the adipose microenvironment to influence the
differentiation of adaptive immune cells [35]. Still, it is important to focus on
the response capabilities of innate cells, such as monocytes and macrophages.
Recently, it has been suggested that the exposure of macrophages to lipid
products from obesity can affect their activation and differentiation and play a
relevant role in the homeostatic metabolism of lipids, which could trigger
systemic inflammatory processes [36]. As previously mentioned, ox-LDL is involved
in the monocyte to macrophage differentiation process during atherosclerosis [7].
However, even the images shown by the authors, data were obtained classifying
macrophages with CD11b myeloid marker, which is expressed in a wide range of
immune cells including both monocytes and macrophages [37]. It is necessary to
comprehensively characterize samples from patients who developed diseases
associated with obesity to have a better approach to immune cell profile
activation. Our study was limited to controlled in vitro variables;
however, it could be interesting to characterize the immune cells in obese human
samples, probably by analyzing data from single-cell RNA sequencing with flow
cytometry data validation. Recently it was demonstrated by single-cell RNA
sequencing that triggering receptor expressed on myeloid cells 2-positive
(TREM2+) macrophages play a major role in inducing protection from kidney
injury in obese patients [38]. On the other hand, obesity-derived biomolecules
could have an infinity loop effect over immune cell differentiation, inducing
pro-inflammatory phenotypes associated with the reactive oxygen species (ROS)
overproduction, which in turn induces LDL oxidization [8]. Our results add
evidence to the pro-inflammatory role of ox-LDL in THP1 monocytes. It has been
shown with a different re-stimulation protocol using LPS over human monocytes
that ox-LDL induces a pro-inflammatory profile with IL-6 and TNF-
The ability of obesity-associated molecules to induce monocyte activation or
macrophage differentiation, as shown in this work, is because immune cells
possess a broad range of pattern recognition receptors such as TLRs, NOD-like
receptors, RIG-I-like receptors (RLRs), C-type lectin receptors, and scavenger
receptors, among others. Once these receptors interact with their ligands, they
trigger the activation and effector function of the immune cell [40]. PGE2 can be
recognized by prostanoid receptors EP1 to EP4, which are constitutively expressed
in mast cells and T lymphocytes. In fact, it is strongly suggested that PGE2,
when bound to EP receptors expressed in T lymphocytes, can influence the adaptive
response profile they present, whether it is T helper 1 (Th1) or Th17 cells [41].
Additionally, the prostanoid receptor EP4 is expressed in macrophage
subpopulations in the intestine, promoting mucosal repair [42]. However, it
remains unclear whether these prostanoid receptors are constitutively expressed
in monocytes or macrophages. This might explain why we did not find a significant
effect of PGE2 stimulation on THP1 monocyte cultures. On the other hand, the role
of LDL in macrophages is to transform into foam cells associated with adipose
tissue [43, 44] and macrophages internalize LDL through pinocytosis or
receptor-mediated phagocytosis via the LDL receptor [43], requiring
pre-stimulation with PMA [44]. Although it is known that LDL can induce the
differentiation of blood monocytes into macrophages [11], to the best of our
understanding, this is the first report showing that LDL can differentiate
monocytes into macrophages with an M1 activation phenotype without PMA
pre-stimulation, as demonstrated by the higher percentage of CD68 and CD16
markers, and the expression of IL-1
Our data suggest that native LDL induces the activation of THP1 monocytes and
its differentiation into M1 macrophages even more efficiently than classic PMA
stimulation, and ox-LDL favors the monocyte activation profile. On the other
hand, ox-LDL and PGE2 induce the expression of activation markers similarly to
IFN-
The datasets used and/or analyzed during the current study are available from the corresponding author on reasonable request.
Conception and experimental design: JEO, LIT, VGA and VGG. Experimental performance: JEO, VGA, VGG, VHG, MGM and NSJ. Data analysis: VGA, JEO, LIT, MGM and VGG. Interpretation of the results: JEO, VGA, VGG, MGM, and NSJ. Paper writing: JEO and LIT. Funding resources: JEO and MGM. All authors contributed to editorial changes in the manuscript. All the authors read and approved the final manuscript. All authors have participated sufficiently in the work and agreed to be accountable for all aspects of the work.
Not applicable.
Not applicable.
This work was supported by Programa de Apoyo a Proyectos de Investigación e Innovación Tecnológica (PAPIIT) de la Dirección General de Asuntos de Personal Académico (DGAPA)-UNAM IA205622, and Programa de Apoyo a Profesores de Carrera (PAPCA) de la FES Iztacala FESI-PAPCA-2021-2022-24 to JEO, and CF-2023-I-563 from MGM. Victoria Hernández Gómez was a doctoral student in the Doctoral Program in Biomedical Sciences (PDCB) at the National Autonomous University of Mexico (UNAM) and received CONAHCYT scholarship number 1178069 from August 2023 to April 2025.
The authors declare no conflict of interest.
References
Publisher’s Note: IMR Press stays neutral with regard to jurisdictional claims in published maps and institutional affiliations.