


 , Xuhui Fan 1,†, Dongya Chen 2, Huibin Yao 1, Zhihui Huang 1, Heng Li 1, Qing Zhang 3, Yuqi Wang 1, Haihan Song 4, Yufeng Yan 1,*
1 Department of Neurosurgery, Jinshan Hospital, Fudan University, 201508 Shanghai, China
2 Department of Neurology, Jiangsu University, 212013 Zhenjiang, Jiangsu, China
3 Shanghai Cyan Medical Co., Ltd, 201200 Shanghai, China
4 Department of Immunology, DICAT National Biomedical Computation Centre, Vancouver, BC V6B 5A6, Canada
†These authors contributed equally.
Abstract
Ischemic stroke triggers inflammatory responses that lead to neuronal damage, with microglial polarization significantly influencing post-stroke inflammation. This study explores the role of Fc gamma receptor Ia (FCGR1A) in microglial polarization and its regulatory mechanisms in ischemic stroke.
Differentially expressed genes (DEGs) associated with ischemic stroke were identified using the GSE58294 dataset. Hub genes were found by analyzing protein–protein interaction (PPI) networks. BV2 microglia were subjected to oxygen–glucose deprivation/reoxygenation (OGD/R) to mimic ischemic conditions in vitro, and FCGR1A and inflammatory marker levels were assessed. Besides, BV2 cells were stimulated with lipopolysaccharide (LPS) and interferon-gamma (IFN-γ) to induce M1 polarization, and the effects of FCGR1A overexpression and knockdown on cytokine production and microglial polarization were evaluated. The function of the AMP-activated protein kinase (AMPK)-mTOR pathway in regulating microglial polarization was further investigated using the mTOR inhibitor rapamycin (RAP).
From the 327 DEGs identified, FCGR1A was chosen as a hub gene. OGD/R treatment of BV2 cells produced a time-dependent rise in FCGR1A, induction of brown adipocytes 1 (Iba1), and interleukin 6 (IL-6) expression, indicating enhanced inflammation. FCGR1A overexpression induced a proinflammatory response and promoted M1 polarization, whereas FCGR1A knockdown reduced inflammation and shifted toward an anti-inflammatory M2 phenotype. Inhibition of the mTOR pathway using RAP, combined with FCGR1A knockdown, significantly enhanced AMPK activation and promoted a shift toward an anti-inflammatory M2 phenotype.
FCGR1A modulates microglial polarization by affecting the AMPK–mTOR signaling pathway in ischemic conditions. Targeting FCGR1A and related pathways could offer new therapeutic strategies to lessen inflammation and facilitate the healing process after an ischemic stroke.
Keywords
- ischemic stroke
- FCGR1A
- AMPK–mTOR signaling pathway
- microglial polarization
- inflammation
Stroke, a severe neurological condition, is defined by the abrupt stoppage of blood flow to a particular brain area, resulting in a significant loss of neurologic function [1]. Ischemic stroke, the most prevalent form, is driven by several risk factors, such as atrial fibrillation, smoking, diabetes, hypertension, and hyperlipidemia [2]. Despite advances in preventive measures, stroke remains a major global contributor to morbidity and mortality [3]. The high incidence rates and substantial long-term disability in survivors highlight the ongoing challenge of ineffective management [4]. Current treatments, such as thrombolysis and mechanical thrombectomy, aim to restore blood flow rapidly; however, their effectiveness is often limited by the narrow therapeutic window and the complexities involved in post-stroke recovery [5].
Recent research in ischemic stroke has increasingly focused on the role of
central nervous system microglia [6]. A Study employing oxygen–glucose
deprivation/reoxygenation (OGD/R) models have provided valuable insights into
microglial responses during ischemic conditions [7]. Furthermore, research
involving lipopolysaccharide (LPS) and interferon-gamma (IFN-
Fc gamma receptor Ia (FCGR1A), also known as CD64, encodes a high-affinity receptor for the Fc portion of immunoglobulin G (IgG) and is predominantly expressed in monocytes, macrophages, and dendritic cells [11]. This receptor plays a pivotal role in mediating antibody-dependent cellular phagocytosis and inflammatory responses by facilitating the clearance of pathogens and activating pro-inflammatory pathways. Given its role in these processes, FCGR1A is recognized as a significant contributor to various inflammatory diseases. Weng W et al. [12] identify FCGR1A as crucial in peripheral immune activation and neuroinflammation in aneurysmal subarachnoid hemorrhage (aSAH), while Minett T et al. [13] link FCGR1A to microglial activation and Alzheimer’s disease-related decrease in cognition. A recent analysis of datasets from ischemic stroke and non-alcoholic fatty liver disease (NAFLD) identified FCGR1A, among other genes, as a familiar immune-related candidate [14]. The AMP-activated protein kinase (AMPK)–mTOR pathway regulates cellular metabolism, growth, and stress responses and has also been implicated in modulating inflammatory processes. A study demonstrated this pathway’s critical function in controlling neuroinflammation and microglia/macrophage polarization in cerebral ischemia–reperfusion injury [15]. Furthermore, Sun Z et al. [16] demonstrated that AMPK–mTOR signaling pathway activation can protect human umbilical cord mesenchymal stem cells (HUMSCs) from stroke-induced apoptosis and inflammation. These results highlight the possibility of focusing on the interplay between FCGR1Aand the AMPK–mTOR pathway to develop novel therapeutic strategies for stroke and related diseases.
This study aims to elucidate the function of FCGR1A in ischemic stroke and its underlying processes in BV2 microglia. The effects of FCGR1A overexpression and knockdown, and mTOR inhibition on cellular inflammation and polarization were investigated to explore potential therapeutic targets for alleviating stroke-induced neuroinflammation. Our findings highlight FCGR1A as a key regulator of inflammatory processes and cellular phenotypic transitions, providing insights into new strategies for managing ischemic stroke and related neuroinflammatory conditions.
The microarray dataset from GSE58294 was obtained from Gene Expression Omnibus
(GEO, https://www.ncbi.nlm.nih.gov/gds/) and preprocessed by the R software
(Version 4.0.3; R Foundation for Statistical Computing, Vienna, Austria). The
dataset includes blood samples from cardiogenic stroke patients (n = 69) and
control subjects (n = 23). The average expression value of these probe sets was
computed for genes with multiple probe sets. Differential analysis was performed
using the GEO2R tool after the probe IDs were converted to gene symbols. Fold
change (FC) threshold
We conducted a network analysis utilizing the Search Tool for the Retrieval of
Interacting Genes (STRING, https://string-db.org/) database to investigate PPI
networks within the DEGs. The resulting network, which included clusters
recognized by maximal neighborhood component (MNC) and molecular complex
detection (MCODE), was shown with Cytoscape (Version 3.7.1; Institute for Systems
Biology, Seattle, WA, USA), a platform for network visualization that is
open-source. This allowed for a comprehensive examination of the interactions
among proteins. The criterion for statistical significance was fixed at
p
The genes in the MCODE and MNC modules were cross-analyzed to acquire overlapping genes using the bioinformatics platform (https://bioinformatics.psb.ugent.be/webtools/Venn/). To evaluate the expression levels of overlapping genes, we used R for data processing and boxplot visualization and examined their expression in the case and regular groups of the GSE58294 dataset.
Mouse microglia (BV2) were obtained from the National Collection of Authenticated Cell Cultures (Shanghai, China) and maintained in Dulbecco’s Modified Eagle Medium (DMEM; Gibco; Thermo Fisher Scientific, Inc.; Waltham, MA, USA; cat. no. 11965) supplemented with 1% penicillin–streptomycin (Gibco; Thermo Fisher Scientific, Inc.; Waltham, MA, USA; cat. no. 15140122) and 10% fetal bovine serum (FBS; Gibco; Thermo Fisher Scientific, Inc.; Waltham, MA, USA; cat. no. 16000044). The temperature of the cell cultures was kept at 37 °C in a humidified environment with 5% CO2.
OGD/R is a popular in vitro experimental method to simulate
ischemia-reperfusion damage and investigate associated cellular protection
mechanisms. The medium was replaced with D-glucose-free DMEM (Corning; Riverfront
Plaza, Corning, NY, USA; cat. No. 17-207-CV) and incubated at 37 °C in a
hypoxic incubator (94% nitrogen and 5% carbon dioxide) for 2 h
to simulate OGD damage. The cells were transferred to a standard
glucose-containing DMEM (Gibco; Thermo Fisher Scientific, Inc.; Waltham, MA, USA;
cat. no. 11965) medium in a regular incubator (reoxygenation). In this
investigation, BV2 cells were given OGD/R conditions for 12, 24, and 48 hours to
model ischemic injury. To induce an inflammatory response and promote M1
polarization, BV2 cells were treated with IFN-
For transient transfection, a density of 2
The total RNA of BV2 cells was extracted using the TRIzol reagent (Tiangen; Xuhui District, Shanghai, China; Cat. no. 4992730) according to the manufacturer’s instructions. To synthesize cDNA, we utilized a PrimeScript RT kit (Takara Biotechnology Co., Ltd.; Changping District, Beijing, China; cat. no. RR037). SYBR Green PCR Master Mix (Vazyme Biotech Co., Ltd.; Nanjing Economic and Technological Development Zone, Nanjing, China; cat. no. A0012) was applied for qRT-PCR via the StepOnePlus Real-Time PCR System (Applied Biosystems; Thermo Fisher Scientific, Inc.; Waltham, MA, USA). The levels of gene expression were measured and adjusted for GAPDH. The 2-ΔΔCT method was utilized to compute each target expression level. A primer sequence was set in Table 1.
| Target | Direction | Sequence (5′-3′) |
| FCGR1A | Forward | CTCACAGGGTGGATGGGTTC |
| FCGR1A | Reverse | CAAATCTGGGGAGGGTGCAT |
| CD16 | Forward | GAGTCAGTCTGTCAGTCGGC |
| CD16 | Reverse | GCCCCGAGTCTTGATTCGAT |
| CD32 | Forward | GTACTATCTGCCAAGCCGGG |
| CD32 | Reverse | CATGAGTCCCAGCAGCAAGA |
| iNOS | Forward | GGAGCGCTCTAGTGAAGCAA |
| iNOS | Reverse | TCCACTGCCCCAGTTTTTGA |
| CD206 | Forward | GGCTGATTACGAGCAGTGGA |
| CD206 | Reverse | ATGCCAGGGTCACCTTTCAG |
| Arg-1 | Forward | ATCGGAGCGCCTTTCTCAAA |
| Arg-1 | Reverse | CAGACCGTGGGTTCTTCACA |
| IL-10 | Forward | CCAAGGTGTCTACAAGGCCA |
| IL-10 | Reverse | ACGAGGTTTTCCAAGGAGTTGT |
| IL-1 |
Forward | GAGCCGGGTGACAGTATCAG |
| IL-1 |
Reverse | ACTTCTGCCTGACGAGCTTC |
| IL-1 |
Forward | TGCCACCTTTTGACAGTGATGA |
| IL-1 |
Reverse | GCCTGCCTGAAGCTCTTGTT |
| IL-6 | Forward | TGATGGATGCTACCAAACTGGA |
| IL-6 | Reverse | GTGACTCCAGCTTATCTCTTGG |
| TNF- |
Forward | CACACTCACAAACCACCAAGTG |
| TNF- |
Reverse | GCAGCCTTGTCCCTTGAAGA |
| TGF- |
Forward | CTCAGATGGGGCGCTCATAC |
| TGF- |
Reverse | AGAGCACACACAGGGATTGC |
| GAPDH | Forward | CCCTTAAGAGGGATGCTGCC |
| GAPDH | Reverse | ATGAAGGGGTCGTTGATGGC |
qRT-PCR, quantitative real-time polymerase chain reaction; FCGR1A, Fc
gamma receptor Ia; CD16, Fc gamma receptor IIIa; Arg-1,
Arginase-1; iNOS, Inducible nitric oxide synthase; IL,
interleukin; TNF-
Protease and phosphatase inhibitors (CoWin Biosciences; Taizhou, Jiangsu, China; cat. no. CW2200S) were added to radio-immunoprecipitation assay (RIPA) lysis buffer (Solarbio; Tongzhou Dist, Beijing, China; cat. no. R0010) to obtain protein lysates from BV2 cells. The bicinchoninic acid (BCA) Protein Assay Kit (Beyotime Biotechnology; Haimen, Jiangsu, China; cat. no. P0009) was applied to measure the protein concentration. Polyvinylidene fluoride membranes (PVDF; Beyotime Biotechnology; Haimen, Jiangsu, China; cat. no. FFP22) were utilized to receive equal quantities of protein that had been separated with 10% Sodium dodecyl sulfate polyacrylamide gel electrophoresis (SDS-PAGE). Membranes were blocked with 5% skim milk and then incubated with primary antibodies against FCGR1A (cat. no. ab140779), interleukin (IL)-6 (cat. no. ab233706), induction of brown adipocytes 1 (Iba1) (cat. no. ab178847), FC gamma receptor IIIa (CD16) (cat. no. ab246222), inducible nitric oxide synthase (iNOS) (cat. no. ab178945), CD206 (cat. no. ab64693), Arginase-1 (Arg-1) (cat. no. ab133543), p-AMPK (cat. no. ab133448), AMPK (cat. no. ab32047), p-mTOR (cat. no. ab109268), and mTOR (cat. no. ab32028) (all from Abcam, Cambridge, MA, USA). Except for FCGR1A, which was diluted at a ratio of 1:4000, all other antibodies were diluted at a ratio of 1:1000. Membranes were cleaned and then treated with the relevant secondary antibodies, including goat anti-rabbit IgG-HRP (cat. no. ab6721; dilution 1:5000) and goat anti-mouse IgG-HRP (cat. no. ab6789; dilution 1:5000) (all from Abcam, Cambridge, MA, USA). GAPDH (Kangcheng; Caohejing Hi-Tech Development Zone, Shanghai, China; cat. no. KC-5G4; 1:5000) was an internal reference. A ChemiDoc imaging system (Bio-Rad, Shanghai, China; cat. no. 12003153) was employed to obtain the images of the protein bands, which were viewed using an enhanced chemiluminescence (ECL) kit (Tiangen; Xuhui District, Shanghai, China; cat. no. ZN1926).
Samples of cell culture supernatant were appropriately diluted and put into the
wells of an ELISA plate that had been coated beforehand with tumor necrosis
factor-alpha (TNF-
Cells or tissue sections were fixed with 4% paraformaldehyde (Beyotime
Biotechnology; Haimen, Jiangsu, China; cat. no. PFA; P0099) at room temperature
for 15 minutes. Following fixation, samples were permeabilized with 0.2% Triton
X-100 (Bioss; Tongzhou District, Beijing, China; cat. no. C03-02002) for 10
minutes. To reduce non-specific binding, samples were stopped utilizing 5% BSA
(Solarbio; Tongzhou Dist, Beijing, China; cat. no. SW3015) in PBS for 1 hour. The
samples were treated with primary antibodies diluted in 1% BSA in PBS and
incubated at 4 °C for a whole night. The primary antibodies used were
Iba1 (cat. no. ab178847, dilution 1:100), FCGR1A (cat. no. ab140779, dilution
1:100), CD16/32 (cat. no. ab25235, dilution 1:200), and CD206 (cat. no. ab64693,
dilution 1:100) (all from Abcam, Cambridge, MA, USA). After washing with PBS,
samples were incubated with fluorescent dye-conjugated secondary antibodies,
including goat anti-rabbit IgG Alexa Fluor® 488 (cat. no.
ab150077, dilution 1:500) and goat anti-mouse IgG Alexa Fluor®
594 (cat. no. ab150116, dilution 1:500) (all from Abcam, Cambridge, MA, USA) at
room temperature for 1 hour. DAPI (Invitrogen; Thermo Fisher Scientific, Inc.;
Carlsbad, CA, USA; cat. no. D1306) was applied as a five-minute counterstain on
the nuclei. Finally, samples were elevated using Fluoromount-G (Yeasen, Shanghai,
China; cat. no. 36307ES) and pictured using a confocal microscope (FV1000,
Olympus, Beijing, China), magnification 20
R software was employed to conduct statistical analysis. Data from experiments
carried out thrice are displayed as mean
In this study, we followed strict standard operating procedures for cell culture and assays to ensure the quality and authenticity of the cell lines used. The cells we used, BV2, were obtained from the National Center for the Preservation of Certified Cell Cultures. To further validate these cell lines’ authenticity and rule out the possibility of mycoplasma contamination, we performed mycoplasma testing on all cell lines. The assay results showed no mycoplasma contamination was detected in any of the cell lines tested, and all results were negative (Supplementary Fig. 1). While STR profiling was not independently performed in our lab, STR reference data are available from the supplier (https://www.cellbank.org.cn/search-detail.php?id=899), and the cell line has not been reported to be misidentified or contaminated. We are committed to complying with scientific and ethical standards for all cell lines used in our research, and we will continue to monitor and maintain the integrity of our cell lines.
A total of 197 downregulated and 130 upregulated DEGs were found in the GSE58294 dataset, comprising 23 control and 69 cardioembolic stroke samples (Fig. 1A). Through the STRING database, PPI network analysis of these DEGs revealed a network with 164 nodes and 302 edges. The MCODE algorithm identified a subnetwork containing 12 nodes and 24 edges, while the MNC algorithm identified a subnetwork with 10 nodes and 22 edges (Fig. 1B,C). Five overlapping genes (catenin beta 1 (CTNNB1), SRY-box transcription factor 9 (SOX9), matrix metallopeptidase 9 (MMP9), CD19 molecule (CD19), and FCGR1A) were identified using the bioinformatics platform from the MCODE and MNC subnetworks (Fig. 1D). Expression analysis indicated that CTNNB1, MMP9, and FCGR1A were upregulated in the stroke samples, whereas SOX9 and CD19 were upregulated in the non-stroke control samples within the GSE58294 dataset (Fig. 1E and Supplementary Table 1). FCGR1A plays a role in the immune system, helping to clear damaged tissue and control inflammation, which is essential for stroke recovery. FCGR1A may work by affecting the activity and movement of immune cells, affecting inflammation and repair processes after stroke. The increase in FCGR1A in stroke patient samples in the GSE58294 dataset may indicate its role in the early stages of stroke, which may be in response to ischemic injury. FCGR1A was bioinformatically associated with ischemic stroke in a previous study [14]. Still, its detailed functional role and mechanism in stroke have not been fully explored and deserve further study, so we chose it as a hub gene.
 Fig. 1.
Identification of DEGs and selection of hub genes in the
GSE58294 dataset. (A) Volcano plot of DEG screening results in the GSE58294
dataset. Red represents upregulated DEGs, black represents downregulated DEGs,
and gray represents genes with insignificant expression. (B,C) PPI network
analysis of DEGs, including MCODE (B) and MNC (C) algorithms. The MCODE algorithm
contains 12 nodes and 24 edges, and the MNC algorithm includes 10 and 22 edges.
Nodes represent proteins or protein domains, and edges represent interactions
between these proteins. (D) Venn diagram of 5 overlapping genes in MCODE and MNC,
including CTNNB1, SOX9, MMP9, CD19, and
FCGR1A. (E) Analysis of overlapping gene expression in non-stroke
control and stroke samples of the GSE58294 dataset. Red represents the control
sample, and black represents the case sample. DEGs, differentially expressed
genes; PPI, protein–protein interaction; MCODE, molecular complex detection;
MNC, maximal neighborhood component; CTNNB1, catenin beta 1;
SOX9, SRY-box transcription factor 9; MMP9, matrix
metallopeptidase 9. ****p
WB analysis was conducted to evaluate the protein levels of FCGR1A in BV2 cells exposed to 12, 24, and 48 hours of OGD/R. The results demonstrated a time-dependent increase in FCGR1A protein expression, with higher levels observed at longer treatment durations (Fig. 2A,B). In addition, we used immunofluorescence staining to detect the expression of FCGR1A and Iba1, which are specific markers for microglia and macrophages and whose expression plays a role in microglia activation and polarization. Immunofluorescence results showed enhanced fluorescence signals of FCGR1A and Iba1 in BV2 cells after 24 hours of reoxygenation, indicating increased FCGR1A activation (Fig. 2C). These observations suggest that FCGR1A is activated in response to OGD/R-induced injury. Furthermore, the protein levels of IL-6 in BV2 cells increased progressively with OGD/R treatment durations of 0, 12, 24, and 48 hours, as shown by WB analysis (Fig. 2D,E).
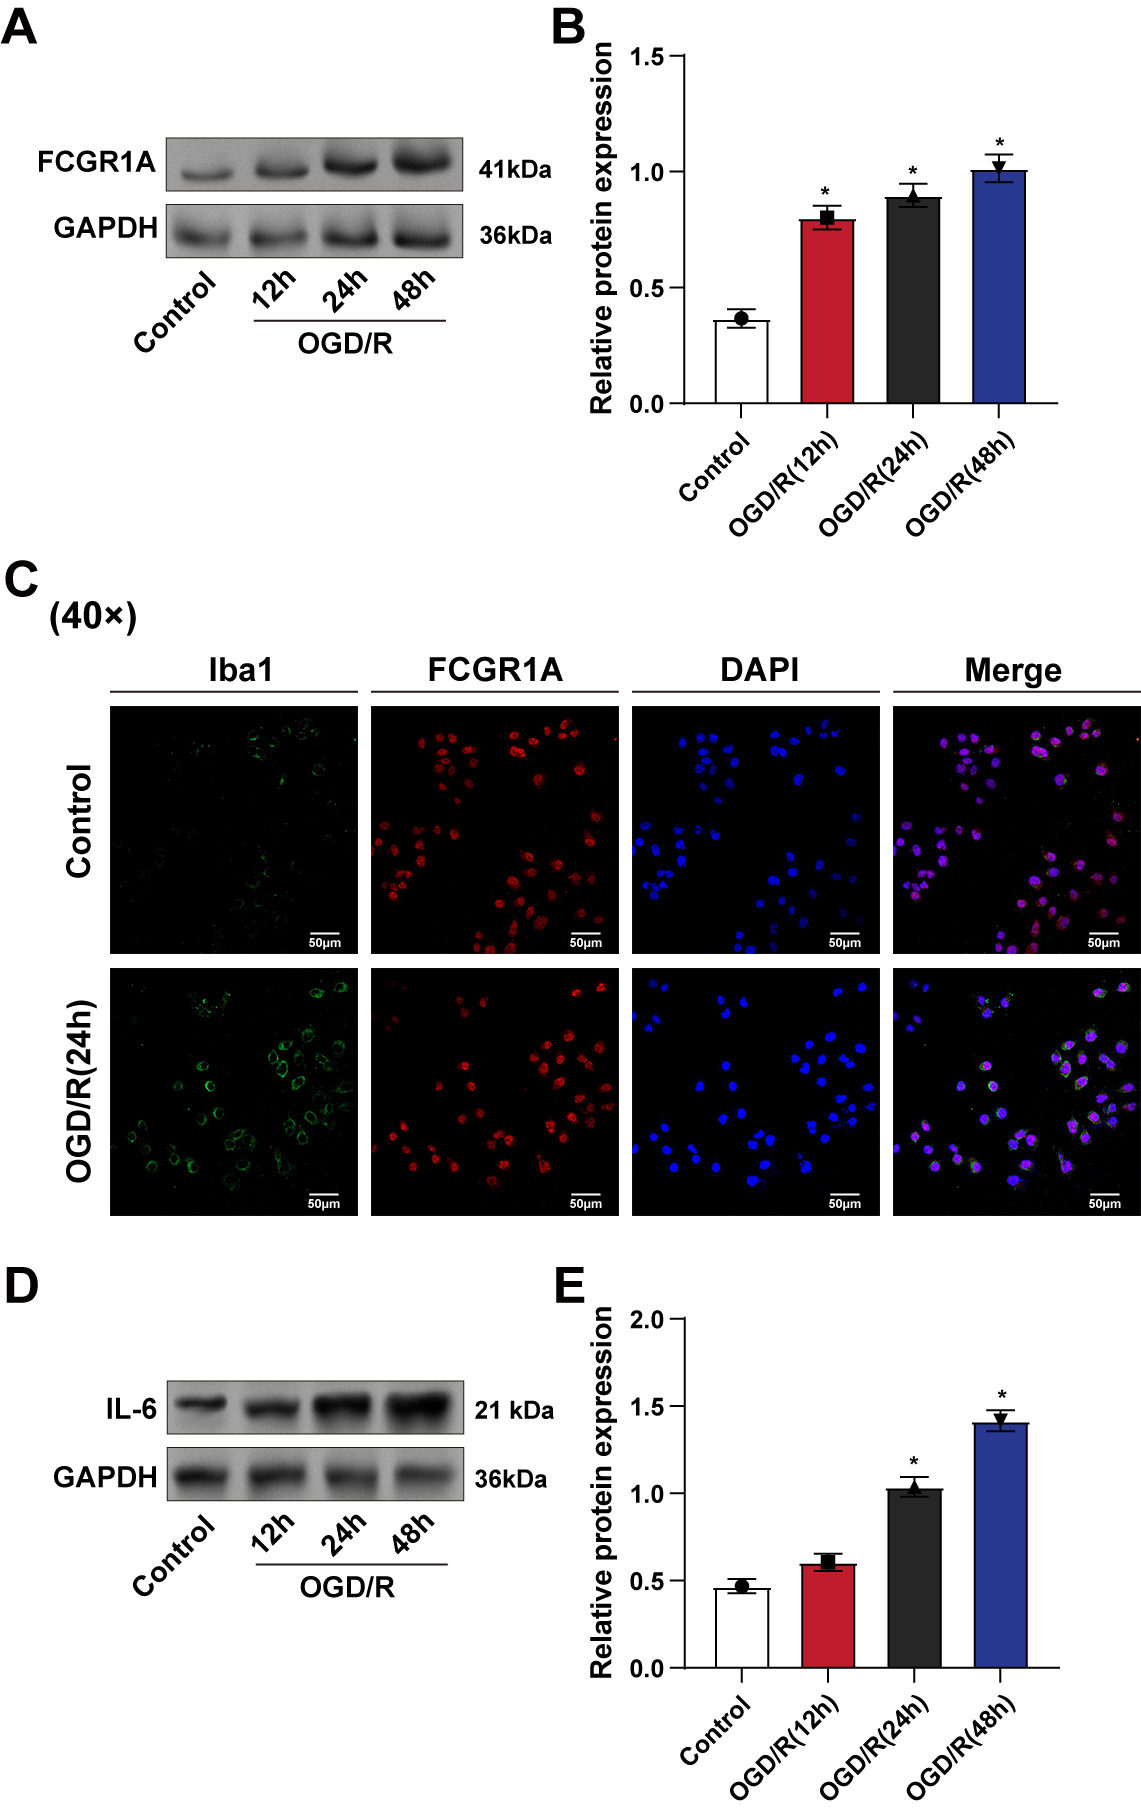 Fig. 2.
Time-dependent upregulation of FCGR1A and IL-6 in BV2
cells after OGD/R treatment. (A,B) WB detection of FCGR1A protein level in BV2
cells after OGD/R treatment for 12 h, 24 h, and 48 h. (C) Iba1 (green) and FCGR1A
(red) protein expressions in BV2 cells were detected by immunofluorescence after
24 h of OGD/R treatment. (D,E) WB detection of inflammatory factor IL-6 protein
level in BV2 cells after OGD/R treatment (12, 24, 48 h). WB, Western blot; OGD/R,
oxygen–glucose deprivation/reoxygenation; Iba1, induction of brown adipocytes 1.
*p
The effectiveness of FCGR1A overexpression in BV2 cells was confirmed
by qRT-PCR and WB methods (Fig. 3A–C). The levels of pro-inflammatory cytokines
in BV2 cells were calculated using the ELISA method after treatment with
LPS+IFN-
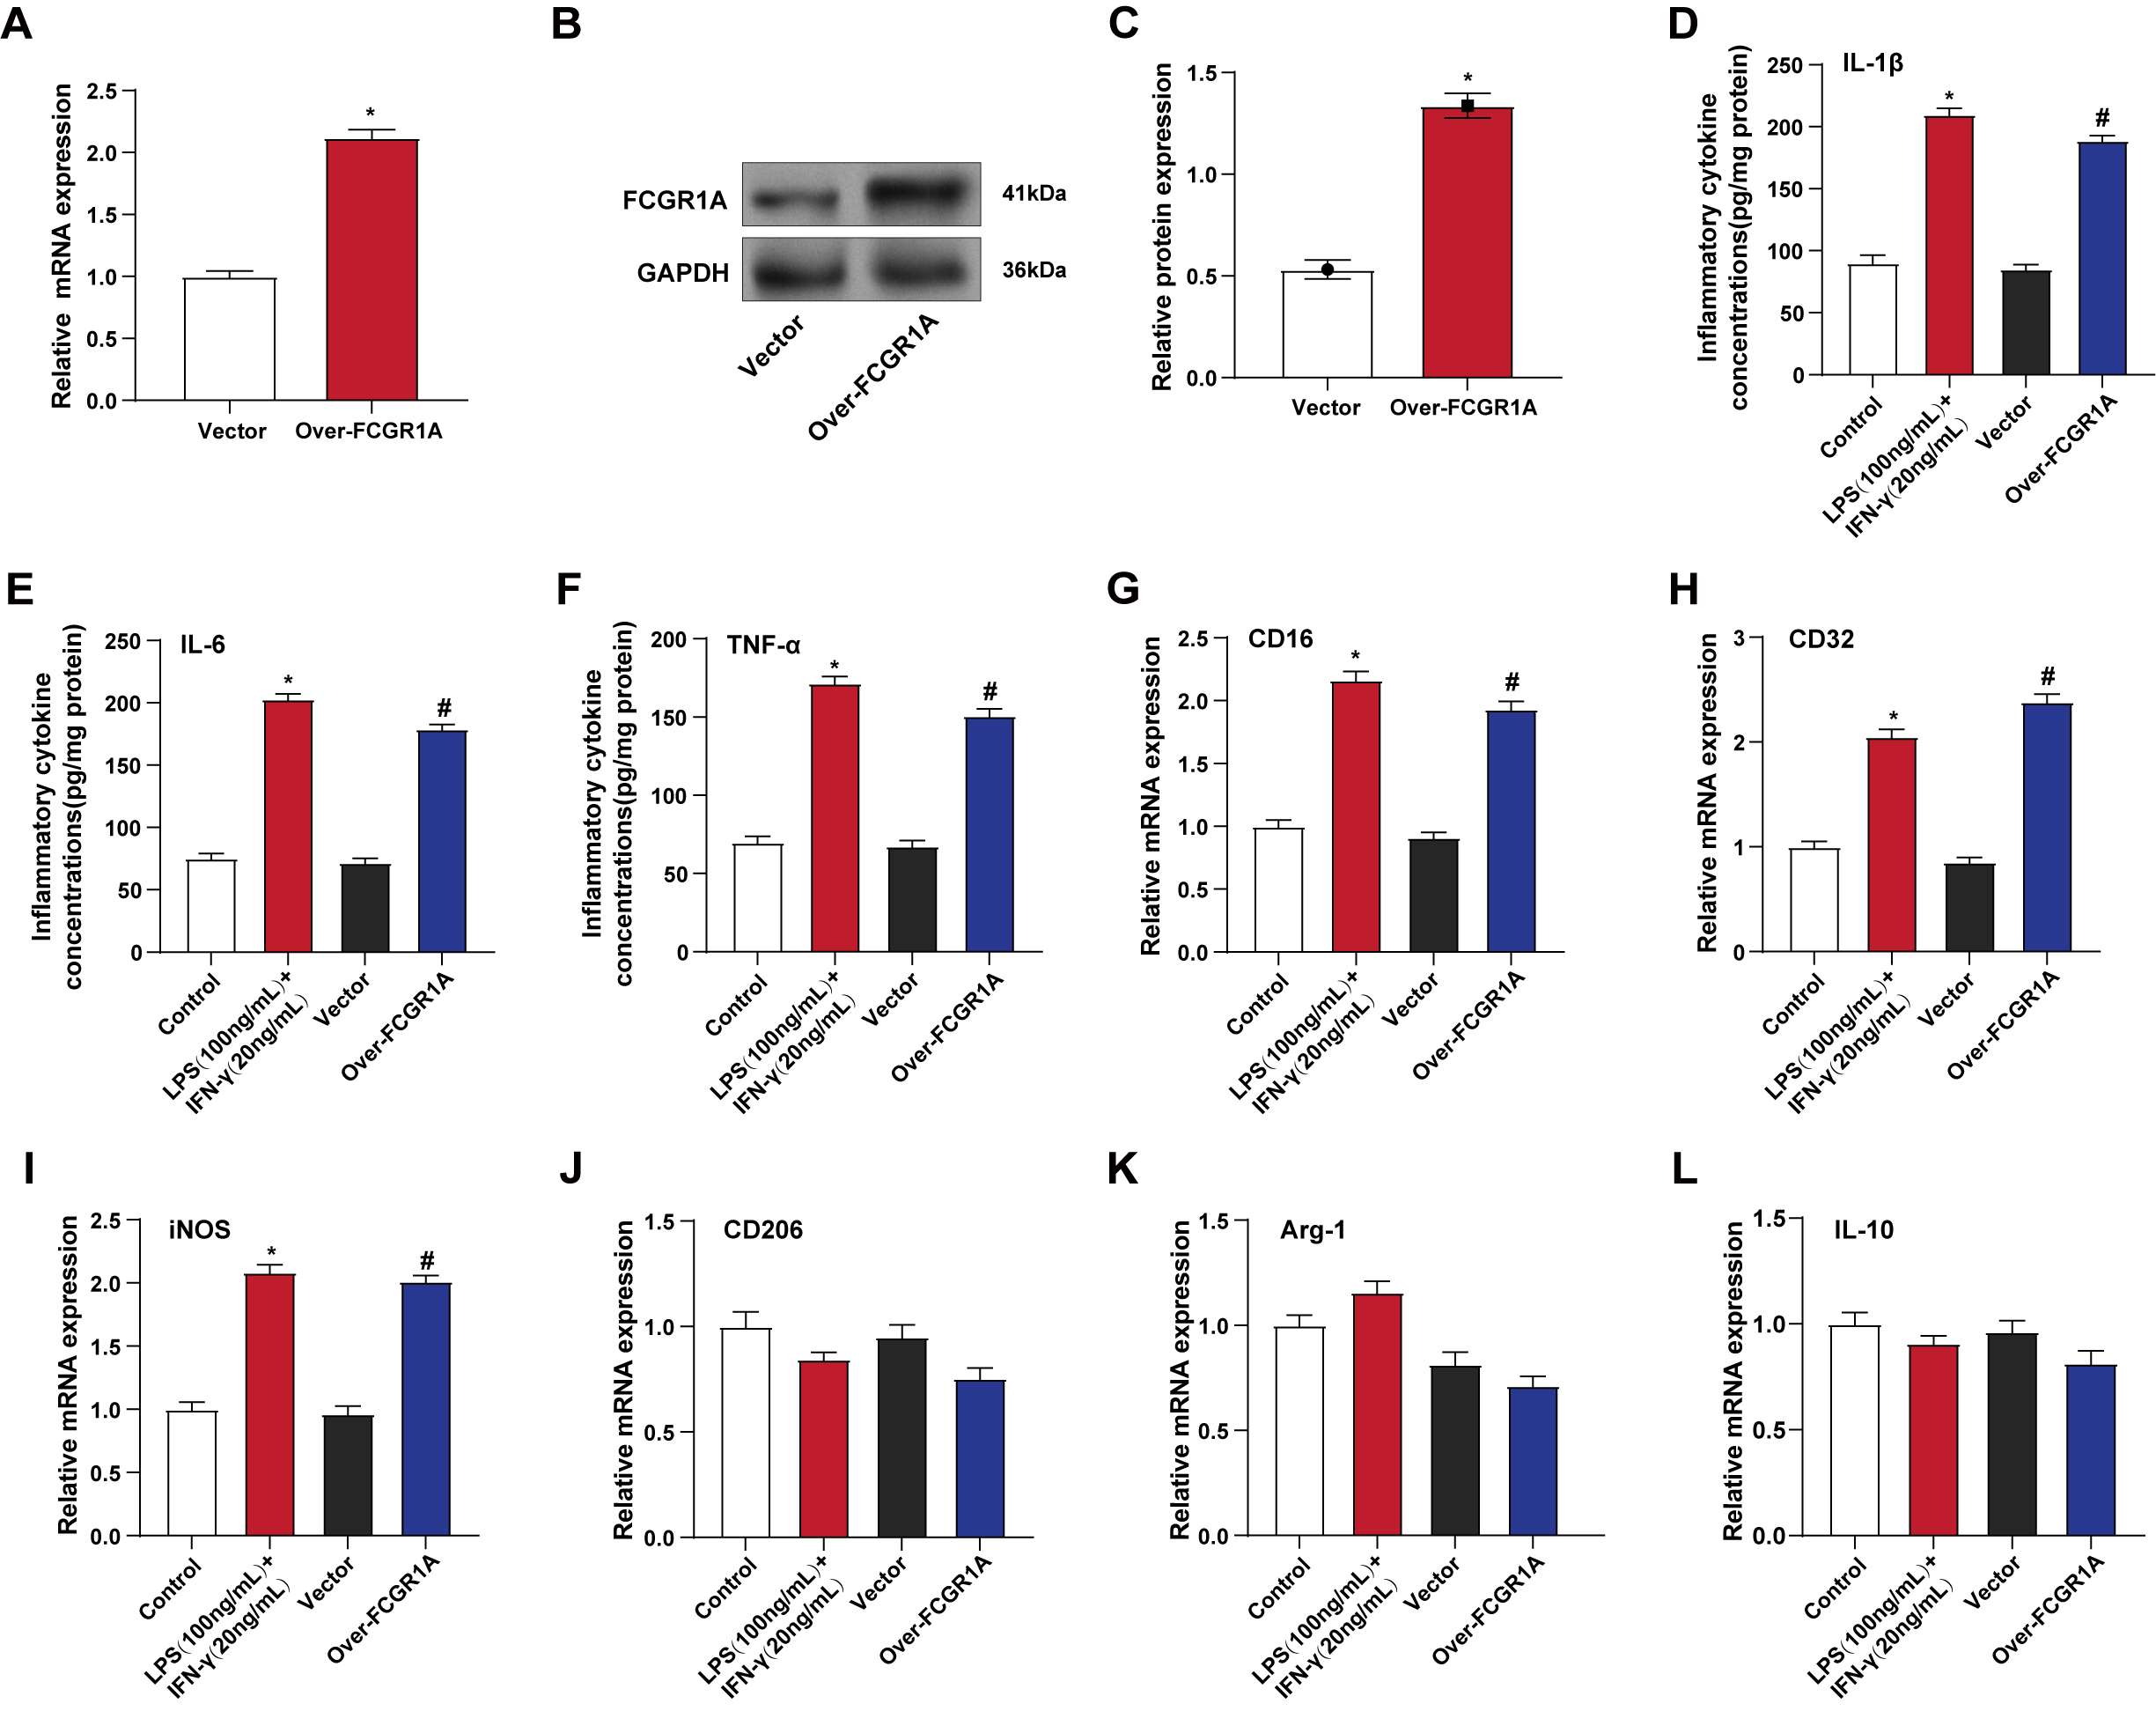 Fig. 3.
FCGR1A overexpression induces inflammatory responses
and promotes M1 polarization in BV2 cells. (A–C) qRT-PCR (A) and WB (B,C) were
used to detect the efficiency of FCGR1A overexpression in BV2 cells.
*p
The knockdown efficiency of FCGR1A in BV2 cells was verified using
qRT-PCR and WB analysis (Fig. 4A–C). Subsequent qRT-PCR analysis under OGD/R
treatment conditions showed that silencing FCGR1A significantly reduced
the mRNA expression levels of IL-1
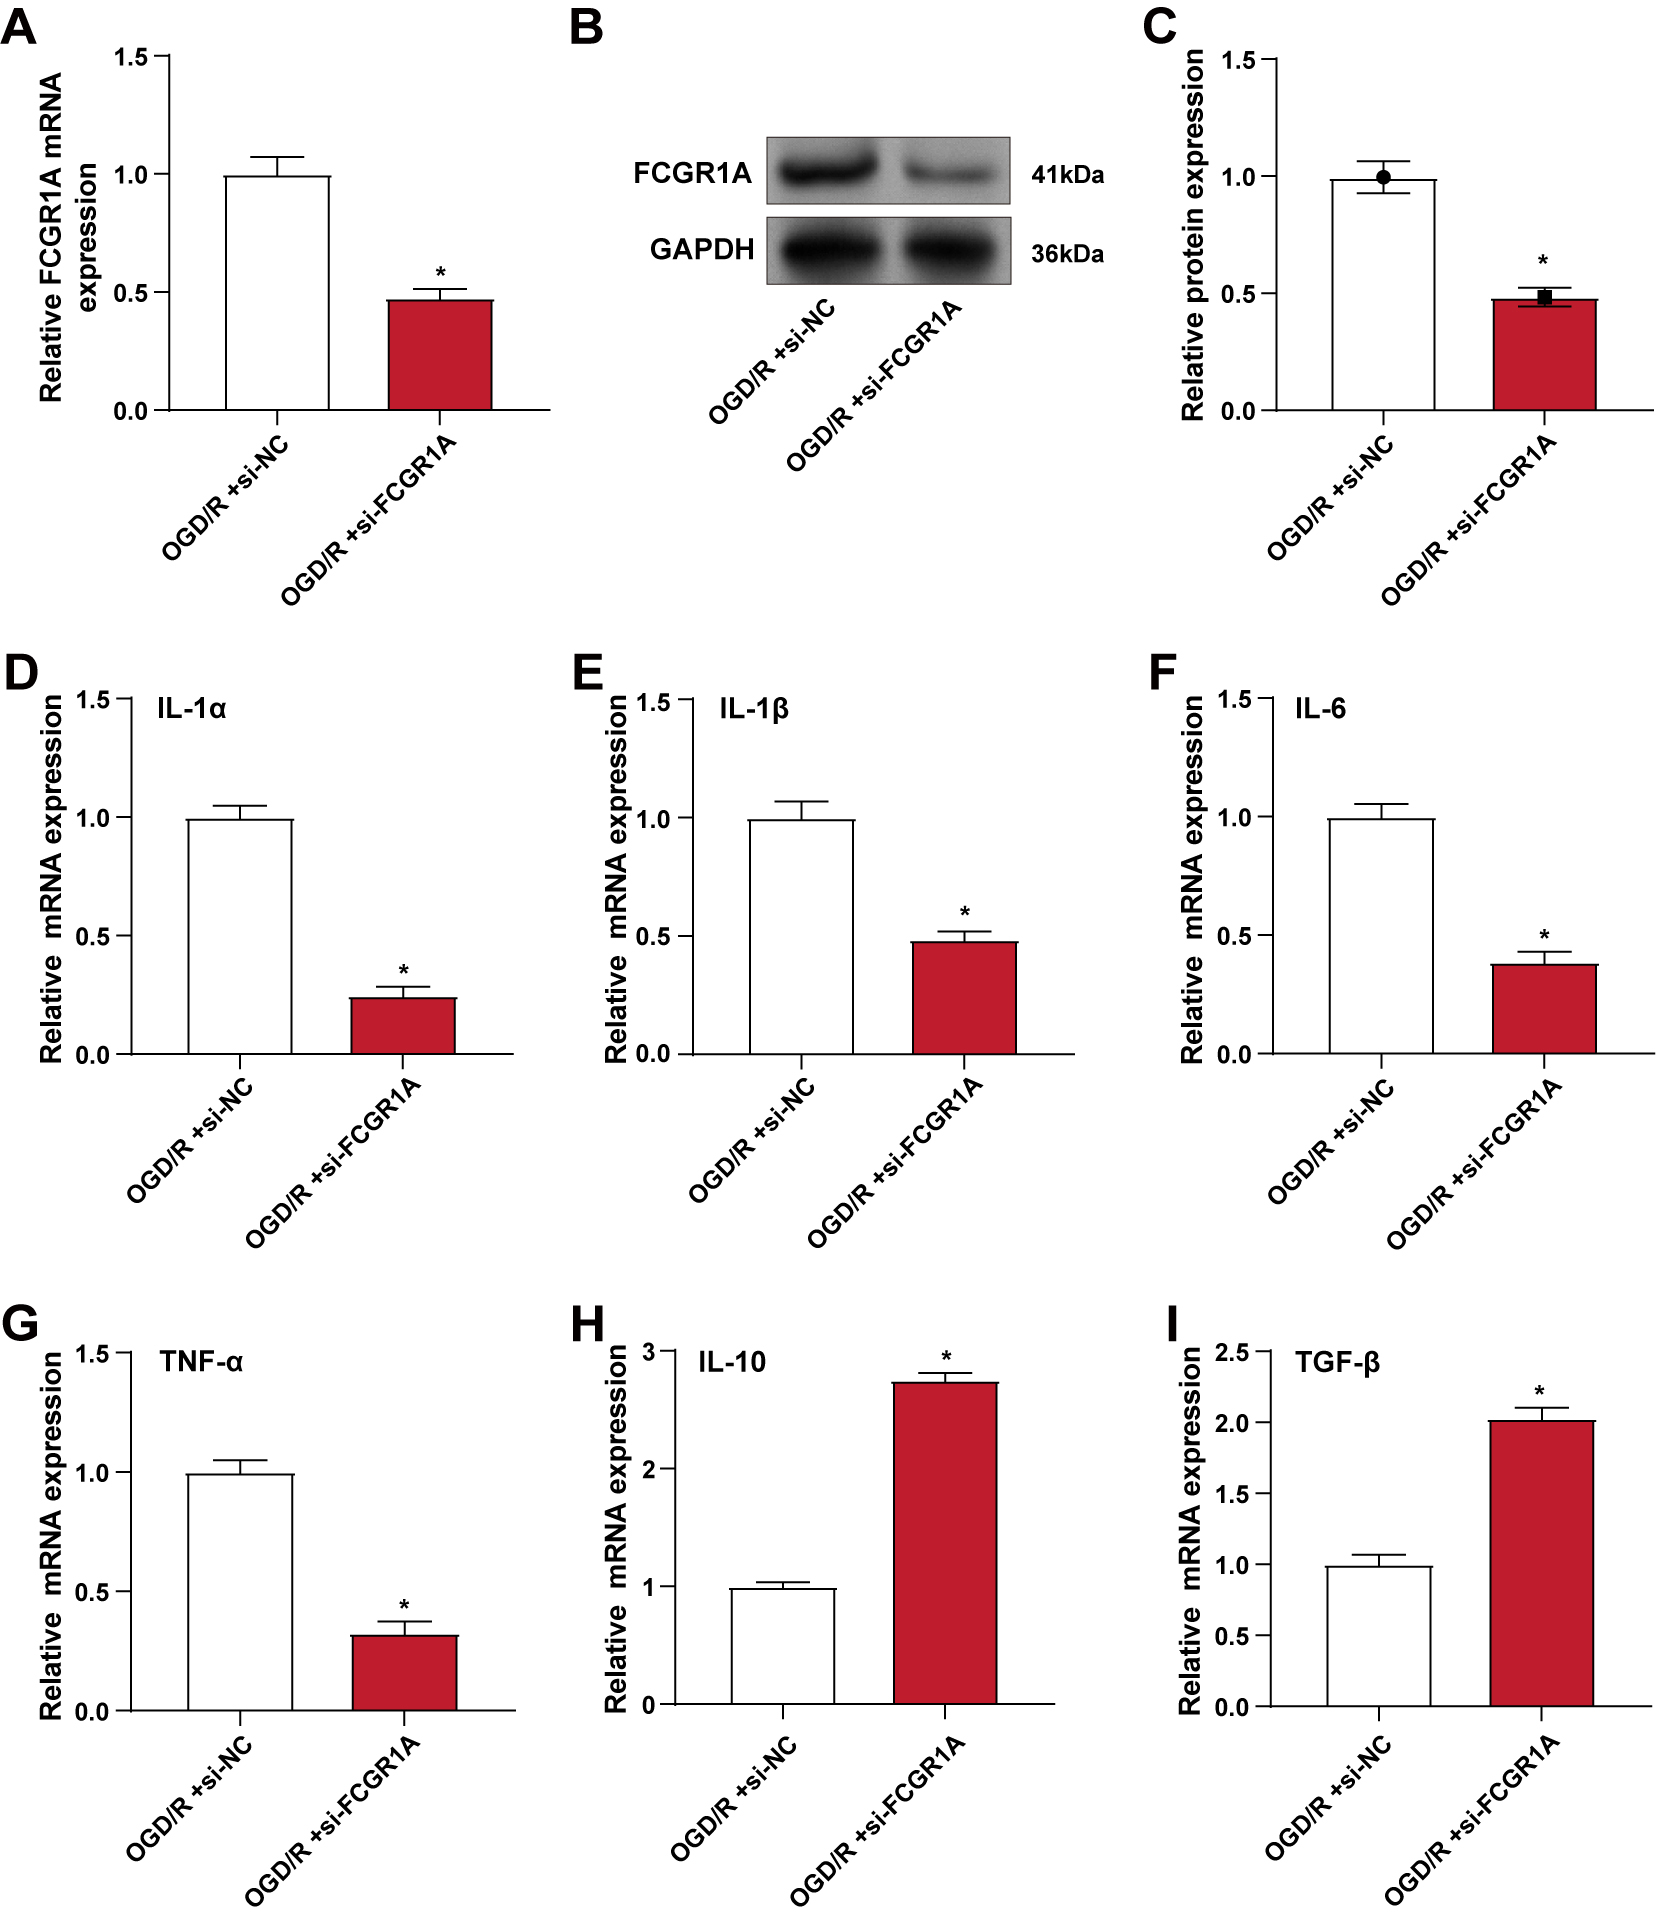 Fig. 4.
Knockdown of FCGR1A alleviates OGD/R-induced
inflammatory response in BV2 cells. (A–C) qRT-PCR (A) and WB (B,C) were used to
detect the knockdown efficiency of FCGR1A in BV2 cells under OGD/R
conditions. (D–I) qRT-PCR was used to detect the changes in the mRNA levels of
pro-inflammatory factors IL-1
The expression of M1 markers (CD16 and CD32) and M2 markers (CD206) in BV2 cells
following OGD/R therapy and FCGR1A knockdown was assessed by
immunofluorescence labeling. CD16/32 is usually associated with M1-type
microglia, whereas CD206 is with M2-type microglia. Differences in the expression
of Iba1, CD16/32, and CD206 reveal the polarization characteristics of microglia
in different states. The results showed that the number of Iba1-positive
microglia/macrophages expressing M1 markers CD16 and CD32 was significantly
reduced in FCGR1A knockdown cells compared with cells only exposed to
OGD/R. Conversely, the number of cells expressing M2 marker CD206 increased,
indicating a shift from M1 to M2 phenotype (Fig. 5A). Further qRT-PCR analysis
showed that FCGR1A knockdown significantly elevated the levels of M2
polarization markers and reduced the levels of M1 polarization markers compared
with the OGD/R group (Fig. 5B–F). ELISA results revealed that IL-10 was elevated
and IL-1
 Fig. 5.
FCGR1A knockdown promotes the transition of BV2 cells
from M1 to M2 phenotype after OGD/R treatment. (A) Immunofluorescence staining
of BV2 cells for Iba1, M1 markers (CD16, CD32), and M2 marker (CD206) after OGD/R
and FCGR1A knockdown. (B–F) qRT-PCR detection of the mRNA levels of M1
polarization markers CD16 (B), CD32 (C) and iNOS (D), M2 markers CD206 (E) and
Arg-1 (F) in BV2 cells after OGD/R and FCGR1A knockdown. (G,H) ELISA
detection of the protein concentrations of M1 polarization inflammatory factor
IL-1
Rapamycin (RAP), a well-known mTOR inhibitor, was applied to BV2 cells subjected to OGD/R. WB analysis revealed that both si-FCGR1A and 50 nM RAP treatment significantly increased p-AMPK protein levels while decreasing p-mTOR protein levels compared to OGD/R treatment alone, with no notable alterations in total AMPK and mTOR protein expression. The combination of si-FCGR1A and RAP further amplified these effects (Fig. 6A,B). qRT-PCR analysis demonstrated that M1 polarization markers expression was significantly reduced, while M2 polarization markers were correspondingly increased following si-FCGR1A or RAP treatment. These changes were even more pronounced when the two interventions were combined (Fig. 6C–G). ELISA results showed that both si-FCGR1A and RAP treatment led to a rise in the anti-inflammatory cytokine and a significant decline in the pro-inflammatory cytokine, with a more substantial effect observed with combined treatment (Fig. 6H,I). WB analysis further confirmed these findings, showing a marked decrease in Iba1 and the M1 marker CD16 and a significant increase in CD206 in cells treated with either si-FCGR1A or RAP, with more pronounced changes following the combined treatment (Fig. 6J,K). These findings suggest that under OGD/R conditions, FCGR1A knockdown and mTOR inhibition synergistically enhance AMPK activation, leading to the promotion of M2 polarization and suppression of M1 polarization in BV2 cells.
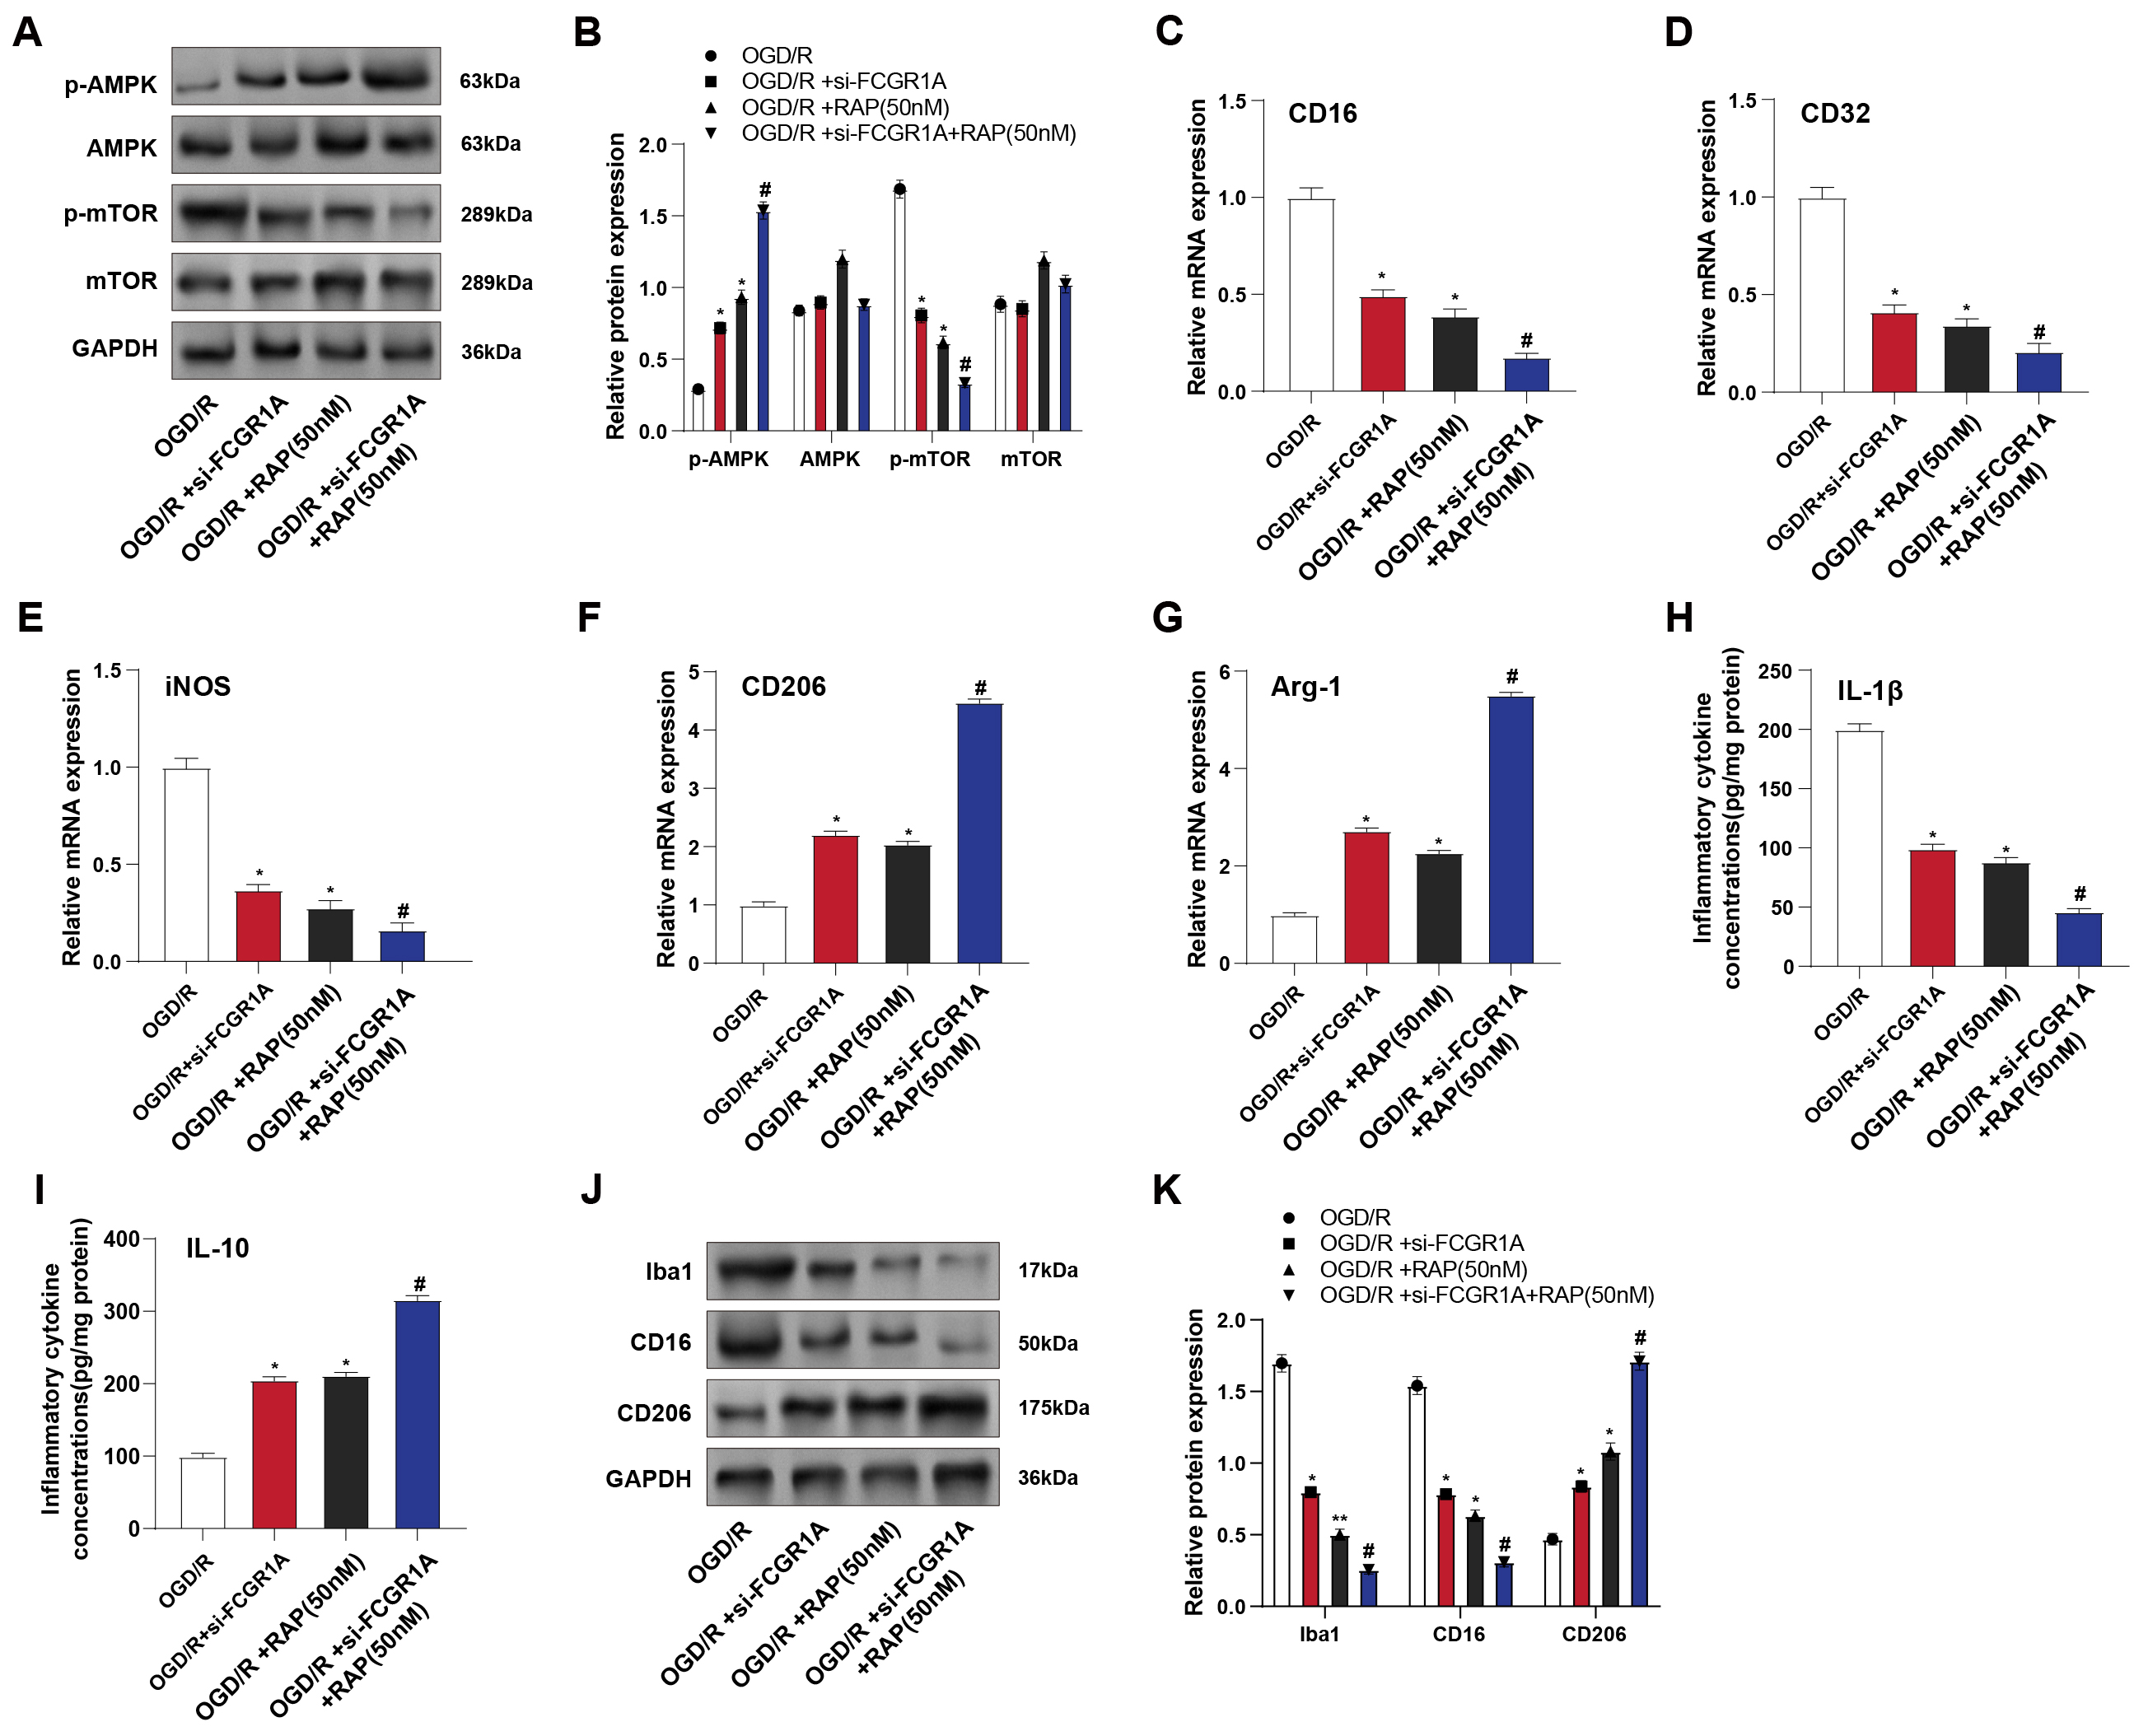 Fig. 6.
FCGR1A regulates the AMPK–mTOR signaling pathway to
promote the transition of BV2 cells to the M2 phenotype. (A,B) WB detected the
levels of proteins related to the AMPK–mTOR signaling pathway in BV2 cells after
OGD/R, si-FCGR1A, and RAP (mTOR inhibitor) treatment. (C–G) qRT-PCR
detected the mRNA levels of M1 polarization markers CD16 (C),
CD32 (D), and iNOS (E) and M2 markers CD206 (F)
and Arg-1 (G) in BV2 cells after OGD/R, si-FCGR1A and RAP
treatment. (H,I) ELISA detected the protein concentrations of M1 polarization
pro-inflammatory factor IL-1
Worldwide, ischemic stroke accounts for the majority of stroke cases, making it a primary cause of mortality and disability [18]. Identifying the molecular mechanisms involved in stroke can provide insights into potential therapeutic targets. This study’s bioinformatics analysis of the GSE58294 dataset revealed five overlapping genes: CTNNB1, SOX9, MMP9, CD19, and FCGR1A. Our results showed that CTNNB1, MMP9, and FCGR1A were significantly upregulated in stroke samples, while SOX9 and CD19 were downregulated. Zhao XY et al. [19] identified that the CTNNB1 polymorphism rs2953 increases stroke risk in the Chinese Han population by reducing CTNNB1 mRNA expression through miR-3161 binding. Xu X et al. [20] demonstrated that SOX9 limits post-stroke recovery by upregulating CSPG production, with SOX9 knockout mice showing enhanced axonal sprouting and improved neurological outcomes, suggesting SOX9 inhibition as a potential therapeutic strategy. Meanwhile, Zielińska-Turek J et al. [21] found that elevated MMP-9 levels, coupled with reduced TIMP activity, are predictors of stroke risk and restenosis in patients with carotid stenosis undergoing stenting or endarterectomy. Although some bioinformatics studies have indicated that FCGR1A may be connected to ischemic stroke, its specific function and mechanism in stroke remain unclear. Therefore, we chose FCGR1A as a hub gene for further investigation in this study to elucidate its potential role in stroke pathology.
OGD/R is a typical model for ischemic stroke simulation and evaluating
microglial responses in vitro [22]. This treatment induces a stress
response in microglia, characterized by heightened inflammation and activation,
which is critical for understanding stroke pathophysiology. In our study, OGD/R
treatment increased inflammation in BV2 cells, as indicated by elevated Iba1 and
IL-6 levels. Increased Iba1 is associated with more severe stroke and poorer
outcomes, highlighting its clinical relevance. IL-6 is a prognostic marker in
ischemic stroke, with higher levels linked to cognitive dysfunction, suggesting
its role not only in stroke onset but also in post-stroke recovery and cognitive
impairment—an integrative review: challenges [23]. LPS, a component of
Gram-negative bacterial membranes, triggers a strong immune response, leading to
pro-inflammatory cytokine production. IFN-
Microglial polarization is intricately linked to stroke outcomes, with M1
polarization exacerbating inflammation and neuronal damage, while M2 polarization
supports tissue repair and neuroprotection [26]. Recent studies have highlighted
various mechanisms influencing microglial polarization in ischemic stroke. Zou J
et al. [27] reported that electroacupuncture (EA) enhances M2
polarization through annexin A1 (ANXA1) upregulation, reducing neuroinflammation
and improving neurological outcomes. Conversely, Zhou X et al. [28] identified that chemokine-like-factor 1 (CKLF1) upregulation in neurons drives M1
polarization, exacerbating neuroinflammation and neuronal damage, with
NF-
The AMPK–mTOR pathway regulates cellular energy homeostasis and growth. AMPK senses cellular energy status and, when activated, inhibits the mTOR pathway to conserve energy. AMPK activation can suppress excessive neuronal growth and inflammation in ischemic stroke by downregulating mTOR signaling [29]. This modulation helps maintain cellular metabolism and protect neurons from damage. Moreover, AMPK activation promotes autophagy, a process essential for removing damaged cellular components, further aiding in neuroprotection and recovery post-stroke [30]. Recent investigations have demonstrated the critical function of the AMPK–mTOR signaling pathway in stroke management. Zhao M et al. [31] showed that metformin reduces oxidative stress and enhances neurological function in individuals suffering from acute stroke with type 2 diabetes by modulating this pathway, thereby improving neuroprotection and recovery. Yuan Y et al. [32] showed that kaempferol protects against harm from cerebral ischemic–reperfusion by activating the AMPK–mTOR signaling pathway, which induces autophagy, reduces neuronal apoptosis, and improves outcomes in a rat stroke model. Conversely, Wang L et al. [33] found that epigallocatechin-3-gallate (EGCG) mitigates harm from ischemia–reperfusion by inhibiting autophagy through the AKT/AMPK/mTOR cascade, leading to reduced infarct volume and neuronal loss in both mouse models and in vitro cell cultures. Similar to the above studies, this research found using in vitro cell experiments that under OGD/R conditions, FCGR1A knockdown and mTOR inhibition synergistically enhanced AMPK activation, resulting in the inhibition of M1 polarization and the promotion of M2 polarization in BV2 cells, that is, FCGR1A regulates the AMPK–mTOR pathway and promotes the change of BV2 cells to the M2 phenotype. This suggests that dysregulation of the AMPK–mTOR pathway may lead to adverse consequences, highlighting its capacity as a target for therapy for improving stroke recovery and minimizing neuronal damage.
FCGR1A, a high-affinity IgG Fc receptor expressed on macrophages and monocytes, is key in regulating immune responses and inflammatory processes. Our findings that the expression level of FCGR1A was significantly upregulated in microglia under in vitro simulated ischemic conditions echoed the upregulation of FCGR1A in peripheral blood, suggesting that FCGR1A may play an essential role in the inflammatory response in stroke. Our findings support a functional role for FCGR1A in microglia polarization, particularly in promoting M1-type inflammatory responses and inhibiting M2-type anti-inflammatory responses. This was further confirmed by FCGR1A overexpression and knockdown experiments, in which upregulation of FCGR1A promoted inflammatory factor production and M1-type microglia polarization. In contrast, the downregulation of FCGR1A reduced inflammation and promoted M2-type anti-inflammatory polarization. These findings are consistent with previous studies that point to a role for FCGR1A in various inflammatory diseases and emphasize its potential importance in CNS inflammation. In addition, our study explored how FCGR1A regulates microglia polarization by affecting the AMPK–mTOR signaling pathway, which plays a central role in cellular metabolism, growth, and stress responses and whose role in regulating neuroinflammation and microglia/macrophage polarization in cerebral ischemia–reperfusion injury has been extensively studied. Our experimental results suggest that downregulation of FCGR1A in combination with the mTOR inhibitor RAP synergistically enhances AMPK activation, thereby promoting anti-inflammatory polarization of microglia toward the M2 type. This finding opens the possibility of developing new therapeutic strategies to attenuate the inflammatory response after stroke and promote neural repair by targeting FCGR1A and its associated signaling pathways.
A limitation of this study is that all experiments were performed in vitro using BV2 cells, which may not fully mimic the complex environment of ischemic stroke in vivo. Although BV2 cells provide a valuable model for studying the inflammatory response of microglial cells, they may not fully represent human microglial cell behavior. In addition, in vitro experimental conditions differ from the in vivo environment, such as cell–cell interactions, the composition of the extracellular matrix, and hemodynamics, which play an essential role in the in vivo stroke environment. Therefore, our findings need to be further validated by in vivo models in future studies to assess the accuracy of the therapeutic potential of FCGR1A in ischemic stroke. Furthermore, although our study revealed a role for FCGR1A in microglia polarization and provided strong evidence for a potential role of FCGR1A in ischemic stroke, there are still limitations that need to be further explored, especially about other possible mechanisms of FCGR1A’s role in poststroke inflammatory responses. Future studies should cover the analysis of FCGR1A expression patterns in stroke patient samples and assess the efficacy of FCGR1A-targeted therapies in stroke models.
This study identifies FCGR1A as a critical regulator of inflammation and microglial polarization in the context of ischemic stroke. Bioinformatics analysis showed that FCGR1A is a hub gene associated with stroke pathology. Experimental results demonstrated that FCGR1A overexpression in BV2 cells promotes M1 polarization and enhances inflammatory responses following OGD/R. Conversely, FCGR1A knockdown alleviates inflammation and facilitates the transition from M1 to M2 phenotype, indicating an anti-inflammatory shift. Notably, FCGR1A knockdown, combined with mTOR inhibition, synergistically activates the AMPK pathway, further promoting M2 polarization. These outcomes highlight the function of FCGR1A in regulating the AMPK–mTOR pathway and suggest its possibility as an intended treatment for adjusting inflammatory responses and improving outcomes in ischemic stroke.
The datasets used and/or analyzed during the current study are available from the corresponding author upon reasonable request.
ML, XF, DC, and YY designed the research study. HY, ZH, and HL performed the experiments. QZ, YW, and HS provided technical guidance and assistance with data collection. HS, ML, and DC analyzed the data. YY, XF, HY supervised the project and revised the manuscript. All authors contributed to editorial revisions, read and approved the final manuscript, and agreed to be accountable for all aspects of the work.
Not applicable.
Not applicable.
This study was funded by Shanghai Jinshan District Medical Key Specialty Construction Project Seventh Cycle (JSZK2023B01), and Jinshan Hospital Affiliated to Fudan University Reserve Discipline Platform Construction Project (HBXK-2022-4).
The authors declare no conflict of interest. Although the author Haihan Song is from Shanghai Cyan Medical Co., Ltd., the judgments in data interpretation and writing were not influenced by this relationship.
The authors used ChatGPT only to improve the language of the Introduction and Discussion section, with an emphasis on improving clarity and correcting grammar. The scientific content was written entirely independently by the authors, without the use of AI tools. We hope that this clarification will resolve any issues with the use of AI in our submitted manuscript. The authors read the full article after using the AI tool and is responsible for the article.
Supplementary material associated with this article can be found, in the online version, at https://doi.org/10.31083/FBL26614.
References
Publisher’s Note: IMR Press stays neutral with regard to jurisdictional claims in published maps and institutional affiliations.