


 , Liting Yan 1,2, Xiangrong Zhao 1,2, Ying Wang 1,2, Huiting Li 1,2, Xinlu Jiang 1,2, Yangmeng Feng 1,2, Dandan Ouyang 3, Cuixiang Xu 1,2,*
 , Jianhua Wang 4,*
1 Shaanxi Provincial Key Laboratory of Infection and Immune Diseases, Shaanxi Provincial People’s Hospital, 710068 Xi’an, Shaanxi, China
2 Research Center of Cell Immunological Engineering and Technology of Shaanxi Province, Shaanxi Provincial People’s Hospital, 710068 Xi’an, Shaanxi, China
3 Department of Graduate School, Xi’an Medical University, 710021 Xi’an, Shaanxi, China
4 Second Department of General Surgery, Shaanxi Provincial People’s Hospital, 710068 Xi’an, Shaanxi, China
Abstract
The medicinal phytochemical oleandrin (Ole) is obtained from the Nerium oleander plant. The exact relationship between Ole-induced apoptosis and autophagy in gastric cancer (GC) is unclear despite the fact that it has outstanding anti-tumor capabilities. This research aimed to demonstrate how autophagy and Ole-induced apoptosis interact in GC.
The Cell Counting Kit (CCK)-8 assay and colony formation assays were employed to evaluate cell proliferation. Cellular apoptosis was evaluated with Calcein/Propidium Iodide (PI) assays and flow cytometry. Confocal and electron microscopes were employed to examine the morphology of autophagy. Protein concentrations were assessed by western blotting. Luciferase-positive HGC-27 cells were administered subcutaneously to Balb/c nude mice to evaluate Ole’s anti-tumor activity. Immunohistochemistry assessed Ki67 expression and H&E staining in tumor tissue.
Ole causes GC cells to undergo intracellular apoptosis and autophagy at low nanomolar doses, halting the cell cycle at the G0/G1 phase. Whereas 3-methyladenine (3-MA), the inhibitor of autophagy, counteracts the apoptosis generated by Ole in vitro and in vivo.
Ole may trigger apoptosis through the activation of autophagy in GC. It offers a secure and efficacious candidate drug for the treatment of tumors in the digestive system.
Keywords
- oleandrin
- gastric cancer
- apoptosis
- autophagy
- G0/G1 phase
Globally, gastric cancer (GC) ranks as the fourth main cause of cancer-related deaths and the fifth most common cancer type [1]. It is one of the most common malignancies of the digestive system. China accounts for nearly half of all gastric cancer cases (43.8%) and nearly half of all gastric cancer deaths (47.5%) [2]. Surgery and chemotherapy are currently the gold standards for treating gastric cancer. Surgery causes a lot of damage, and chemotherapy has certain unavoidable side effects that reduce its effectiveness [3]. As a potential new approach to treating gastric cancer, natural substances show a wide variety of anticancer properties with little toxicity [4].
A wide range of natural product anti-cancer effects were investigated, including immunosurveillance, DNA damage linked to carcinogenesis, cell cycle regulation, and inhibition of cell proliferation [5, 6, 7]. For instance, Costunolide, a compound derived from the root of Auckiandialappa Decne, has the ability to trigger autophagy and apoptosis in GC cells [8]. It has been found that Honokiol, a compound derived from the bark of the Magnolia officinalis tree, reduces angiogenesis and peritoneal metastasis in GC [9]. Consequently, plant-derived natural compounds are regarded as significant for medication discovery in cancer therapy.
Oleandrin (Ole) is a foremost compound of Nerium oleander plant extracted from the Nerium oleander leaves [10]. Numerous researchers have documented that Ole exhibits anti-inflammatory and anti-cancer properties against colon, lung, pancreatic, and breast cancers [11, 12, 13, 14]. Previous study indicated that oleandrin prompted apoptosis [15]. Additionally, the report indicated that oleandrin may trigger death-promoting autophagy in breast cancer [16]. Nonetheless, the role and molecular mechanism of Ole in GC remains ambiguous. Our study sought to reveal the role and molecular mechanism.
Human gastric cancer (GC) cell lines HGC-27 (Cat NO., CL-0107), SNU-1 (Cat NO., CL-0474), and human gastric mucosa epithelial cells GES-1 (CL-0563) were supplied by Procell Life Science & Technology (Wuhan, China). Mycoplasma testing was negative for all cell lines that underwent validation by Short Tandem Repeats (STR) profiling. At 37 °C in a 5% CO2 atmosphere, cells were cultured in Roswell Park Memorial Institute (RPMI) 1640 supplemented with 10% fetal bovine serum (FBS), streptomycin (100 µg/mL), penicillin (100 U/mL).
We used a Multiskan™ FC microplate reader (Thermo Fisher, Carlsbad, CA, USA) to measure the optical density at 450 nm after exposing GC cells to Ole at various doses (0, 2.5, 5, 10, 20, 40, 80, and 160 nM) [17] for 24 hours after overnight culture in 96-well plates. Then, we tested the cells using a CCK-8 assay.
Following the injection of 500 GC cells into plates for a duration of 24 hours, the cells underwent a ten-day treatment with Ole at several doses (0, 10, 20, 40 nM). Before fixation with 4% paraformaldehyde, the cells were washed twice with PBS (0.2 M, pH 7.8). Subsequently, they were subjected to staining with 1% crystal violet for 15 minutes at ambient temperature. Colonies comprising over fifty cells were enumerated and analyzed. The colony formation rate can be determined by dividing the number of treatments by the number of controls and subsequently multiplying the result by 100%.
After seeding GC cells onto 96-well plates, they were treated with Ole at multiple concentrations (0, 10, 20, 40 nM) for a duration of 24 hours. In order to stain the cells, calcein AM and PI were diluted a thousand times with the working solution. Olympus Corporation’s BX41 fluorescence microscope (Tokyo, Japan) was used to examine and capture images of the fluorescence.
GC cells were cultured for 24 hours with gradient concentration of Ole (0, 10, 20, 40 nM) or 3-methyladenine (3-MA) (30 µM). The cells were incubated with 75% ethanol at 4 °C overnight, and the following day, they were stained with PI for cell cycle analysis. Apoptosis assessment was conducted on cells treated with Ole and stained with Annexin V-Fluorescein Isothiocyanate (FITC) and Propidium Iodide (PI).
Ole (0, 10, 20, 40 nM) or 3-MA (30 µM) were applied to GC cells during 24 hours. Various proteins involved in cell cycle regulation, intrinsic and extrinsic apoptosis, and autophagy were examined using western blotting. To summarize, the proteins from these cells were isolated by lysing them on ice with Radio Immuno Precipitation Assay (RIPA) lysis buffer. Beyotime Biotech’s Bicinchoninic Acid (BCA) Protein Assay Kit (P0011, Shanghai, China) was used to quantify the supernatant. Sodium dodecyl sulfate-polyacrylamide gel electrophoresis (SDS-PAGE) was used to extract proteins of the same grade, which were then transferred to nitrocellulose membranes. Skim milk in PBS (0.2 M, pH 7.8) was used to block the membranes for 2 hours. The next step was to incubate the primary antibodies (rabbit anti-human cell division cyclin 25 homolog C (Cdc25c) (1:1000, cat. No. 4866S), rabbit anti-human Cdk1(1:1000, cat. No.77055S), rabbit anti-human Cyclin B1 (1:1000, cat. No. 12231S), rabbit anti-human Caspase 3 (1:1000, cat. No. 9662S), rabbit anti-human Bak (1:1000, cat. No. 12105S), rabbit anti-human Bax (1:1000, cat. No. 2774S), rabbit anti-human Bcl-2(1:1000, cat. No. 4223S), rabbit anti-human PARP (1:1000, cat. No. 9532S), rabbit anti-human Caspase 8 (1:1000, cat. No. 4790S), rabbit anti-human Fas (1:1000, cat. No. 4233S), rabbit anti-human Fas ligand (FasL) (1:1000, cat. No. 68405S), rabbit anti-human microtubule-associated protein1 light chain3B (LC3B) (1:1000, cat. No. 3868S), rabbit anti-human Beclin (1:1000, cat. No. 34) at 4 °C throughout the night. Membranes were incubated at room temperature for 1 hour with HRP-conjugated secondary antibodies (Proteintech, SA00001-2, Chicago, IL, USA) not long ago. Alpha’s FluorChem FC2 (92-13779-00, Center Valley, CA, USA) was used to detect the blots. Using GAPDH, the data was standardized.
After a 24-hour Ole treatment at 20 nM, GC cells were collected and fixed with paraformaldehyde. Cell blocking and permeabilization were done with 5% BSA and Triton X-100 (Beyotime Biotech, Shanghai, China). Overnight, the cells were exposed to anti-microtuble-associated protein light chain 3 (LC3) antibody from Cell Signaling Technology (A32731, A11072, Cambridge, MA, USA) at 4 °C. Nuclear DNA was counterstained with DAPI for 15 minutes in the dark after cells were incubated with Alexa-Fluor 488/594-conjugated secondary antibodies (Thermo Fisher, Carlsbad, CA, USA) in 1% bovine serum for 1 hour at 37 °C. A confocal laser scanning microscope (Olympus Corporation, Center Valley, CA, USA) was used to take the pictures.
1
All animal experiments adhered to the National Institutes of Health (Bethesda,
MD, USA) guidelines for laboratory animal care and utilization. Weighing 90–120
grams, 10 female Balb/c nude mice were supplied by the Laboratory Animal Center
of Xi’an Jiaotong University. The mice were aged 4–6 weeks. All mice were fed
normal diet during the test period. A subcutaneous injection was made into the
right flank of nude Balb/c mice containing luciferase-positive HGC-27 cell
suspensions (5
After being fixed in 4% formaldehyde, the tumor tissues were subjected to alcohol gradient drying, embedded in paraffin at 60 °C for 3 hours, sawn into pieces, and then baked. At ambient temperature, the antigen was repaired for 15 minutes in a citrate buffer (0.01 M, pH 6.0), and then, to inhibit endogenous peroxidase, it was incubated for another 15 minutes in 3% hydrogen peroxide. For 30 minutes, we let the serum block at room temperature. After being treated overnight with anti-Ki67 antibodies (1:500, Proteintech, 98224-1-RR, Wuhan, China), the slices were incubated with HRP-conjugated goat anti-rabbity IgG (1:2000, Sigma-Aldrich, AP-307P, Darmstadt, Germany) for 2 hours at room temperature. Using 3, 3-diaminobenzidine (DAB), the chromogen may be observed under a microscope. A phase contrast microscope (CKX53, Olympus, Tokyo, Japan) was used to examine the slices after dehydrating them and staining them with hematoxylin for three minutes.
The tumors, hearts, livers, spleens, lungs, kidneys, and other tissues were preserved by fixing, drying, embedding in paraffin, sectioning, and baking. Xylene was employed for dewaxing and hydration. The slices were subsequently stained with hematoxylin and differentiated using 0.1% hydrochloric acid ethanol. Subsequently, the sequential processes of eosin staining, alcohol dehydration, xylene transparency, and resin sealing were executed. The slices were finally examined and photographed using a phase contrast microscope. For morphological evaluation, slices were stained with terminal deoxynucleotidyl transferase–mediated dUTP nick end labeling (TUNEL).
Data is presented as mean
The inhibition effect of Ole (chemical structure featured in Fig. 1A) on proliferation of HGC-27 and SNU-1 cells was tested by CCK-8. The results showed that the proliferation of HGC-27 and SNU-1 cells were significantly inhibited by Ole in a dose-dependent manner compared to GES-1 cells (p
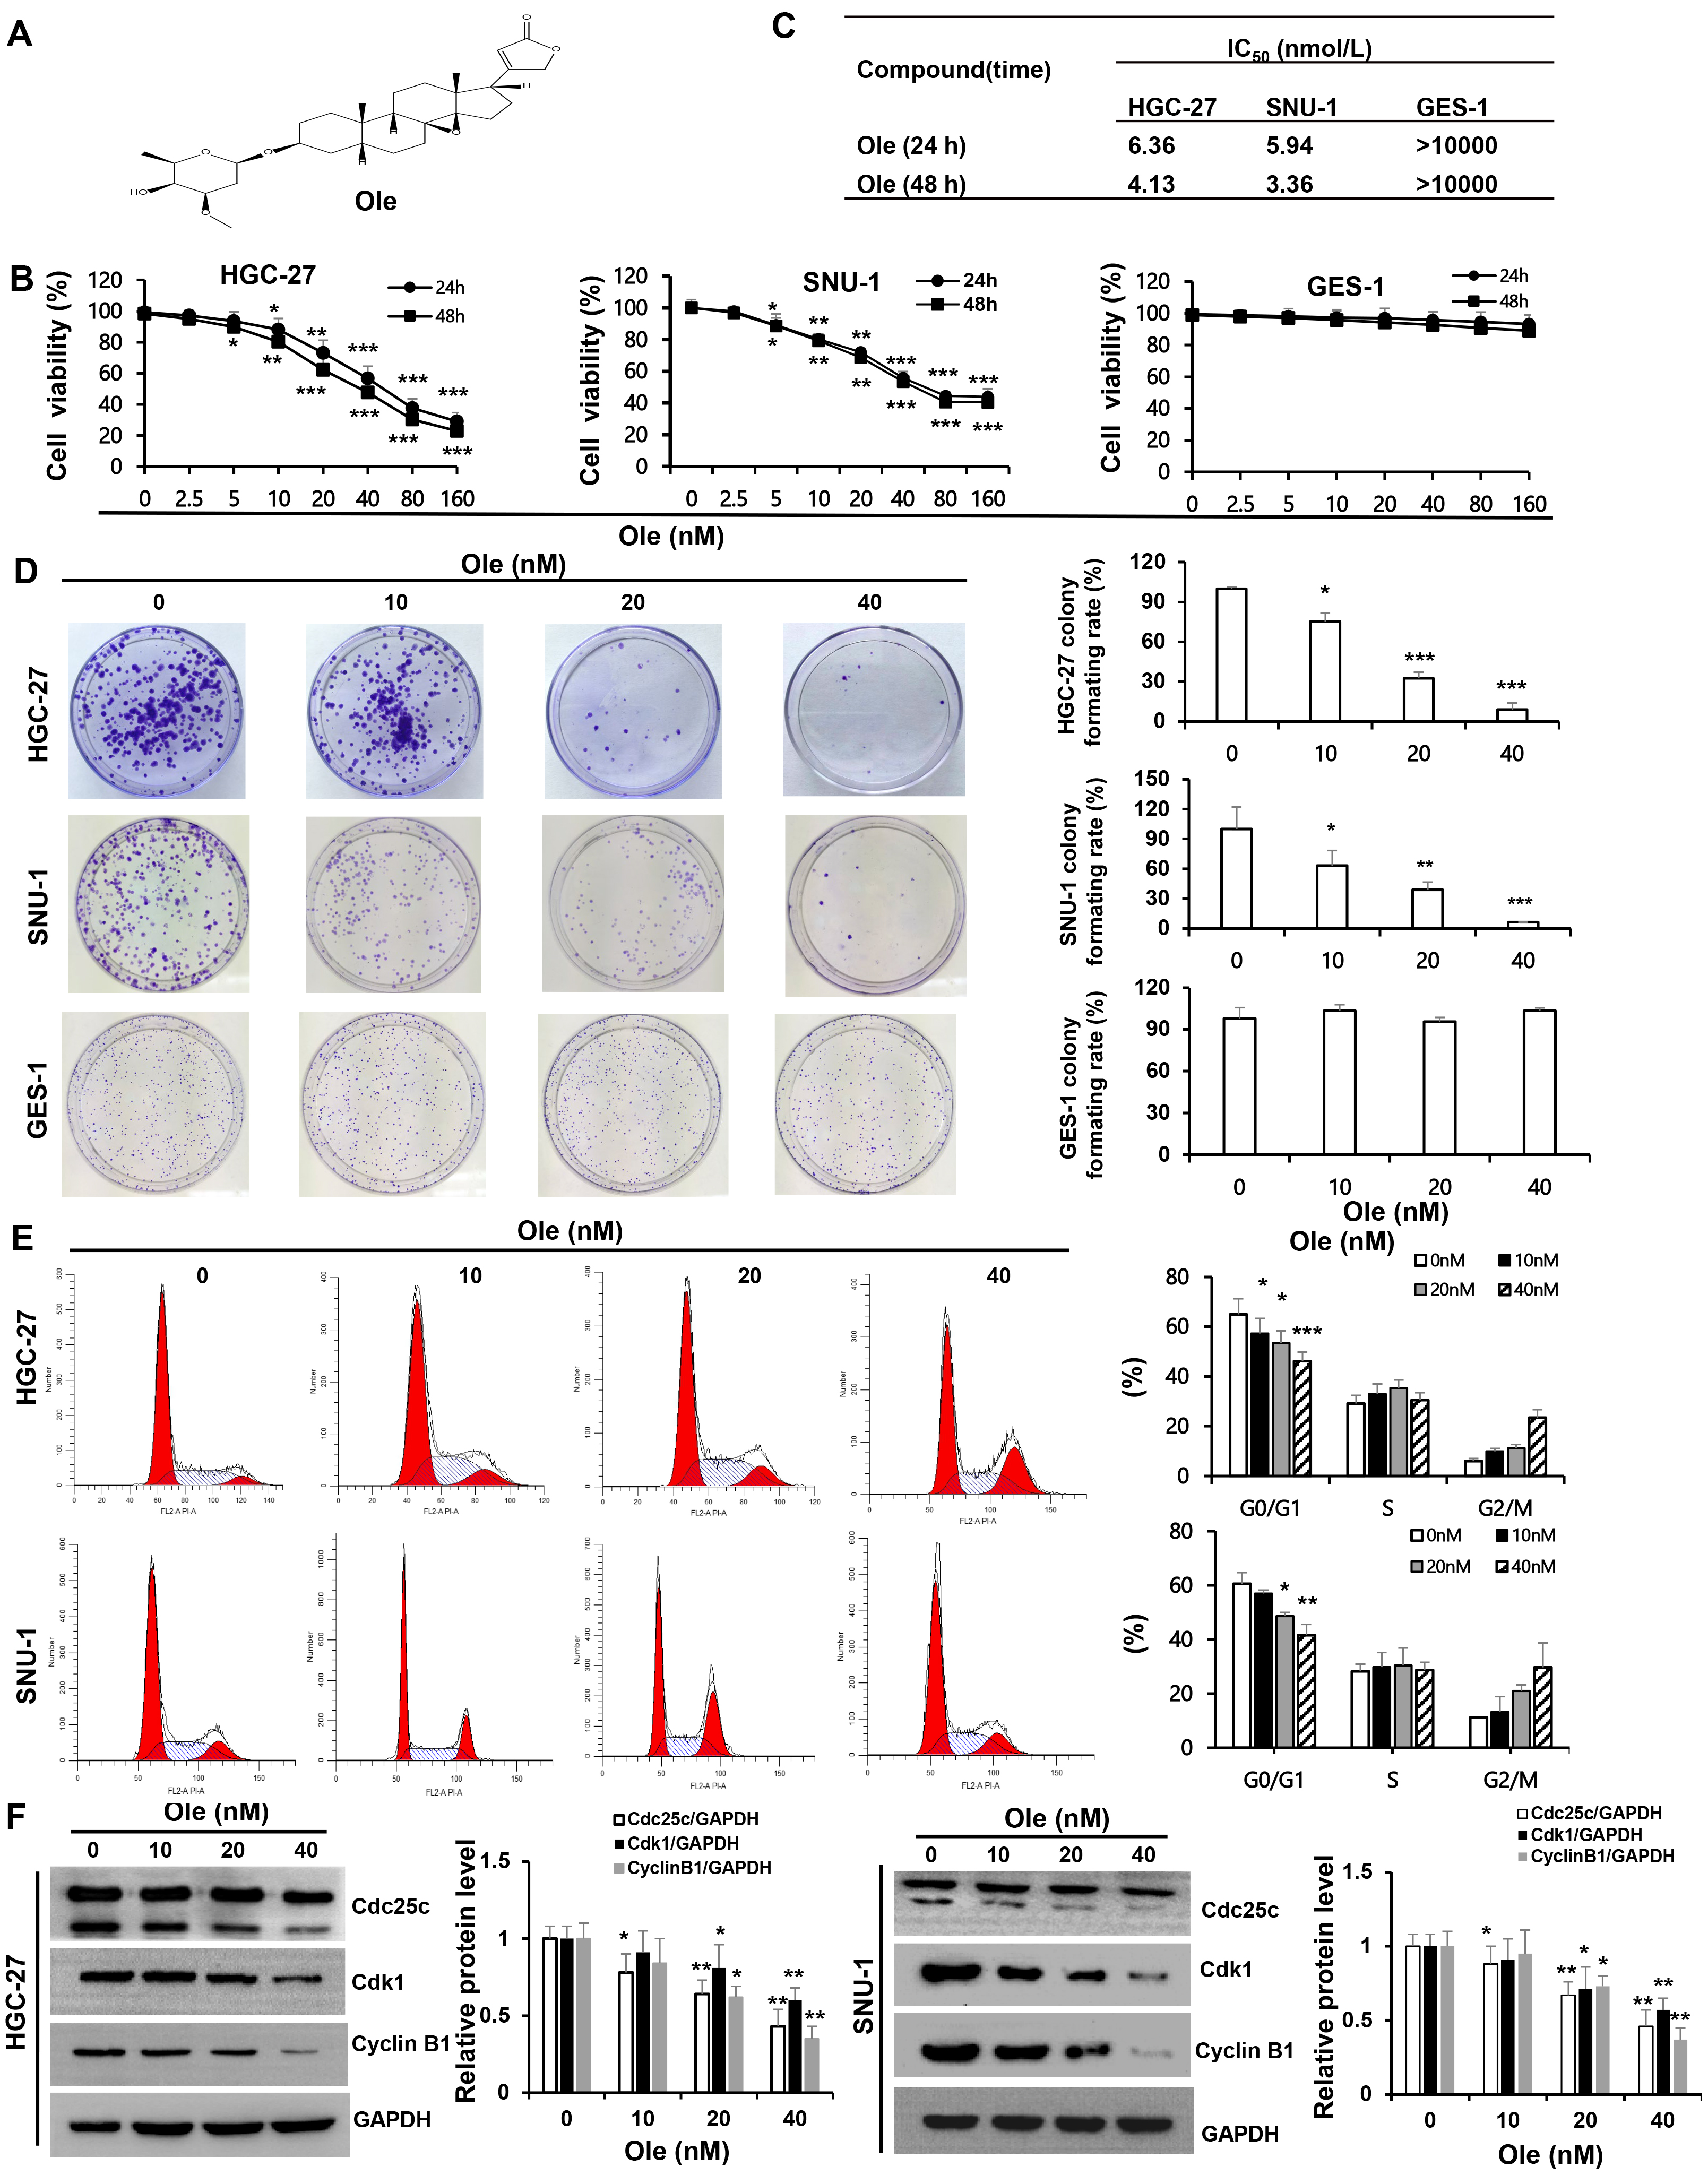 Fig. 1.
Oleandrin (Ole) suppresses the growth of
gastric cancer (GC) cells by drawing the cell cycle into a G0/G1 arrest. (A)
Chemical structure of oleandrin; Molecular formula: C32H48O9;
Molecular weight: 576.72 g/mol. (B) Ole was applied to HGC-27,
SNU-1, and GES-1 cells at different doses for 24 and 48 hours, and the Cell
Counting Kit (CCK)-8 assay was used to evaluate the cells’ viability. (C)
IC50 of Ole on GC and GES-1 cells at 24 hours and 48 hours. (D) Ole reduced
the colony development of GC cells. (E) The impact of Ole at various doses on the
cell cycle of GC cells was assessed using flow cytometry. (F) The quantities of
cell cycle-associated proteins treated with varying amounts of Ole were assessed
by western blotting analysis. In contrast to the control group,
*p
Calcein/PI and flow cytometry was performed to verify the apoptosis effect of Ole on gastric cancer cells. The results shown that active cells stained by Calcein Acetoxymethyl Ester significantly decreased and apoptotic cells stained by Propidium Iodide increased depending on dosage in HGC-27 and SNU-1 cells (p
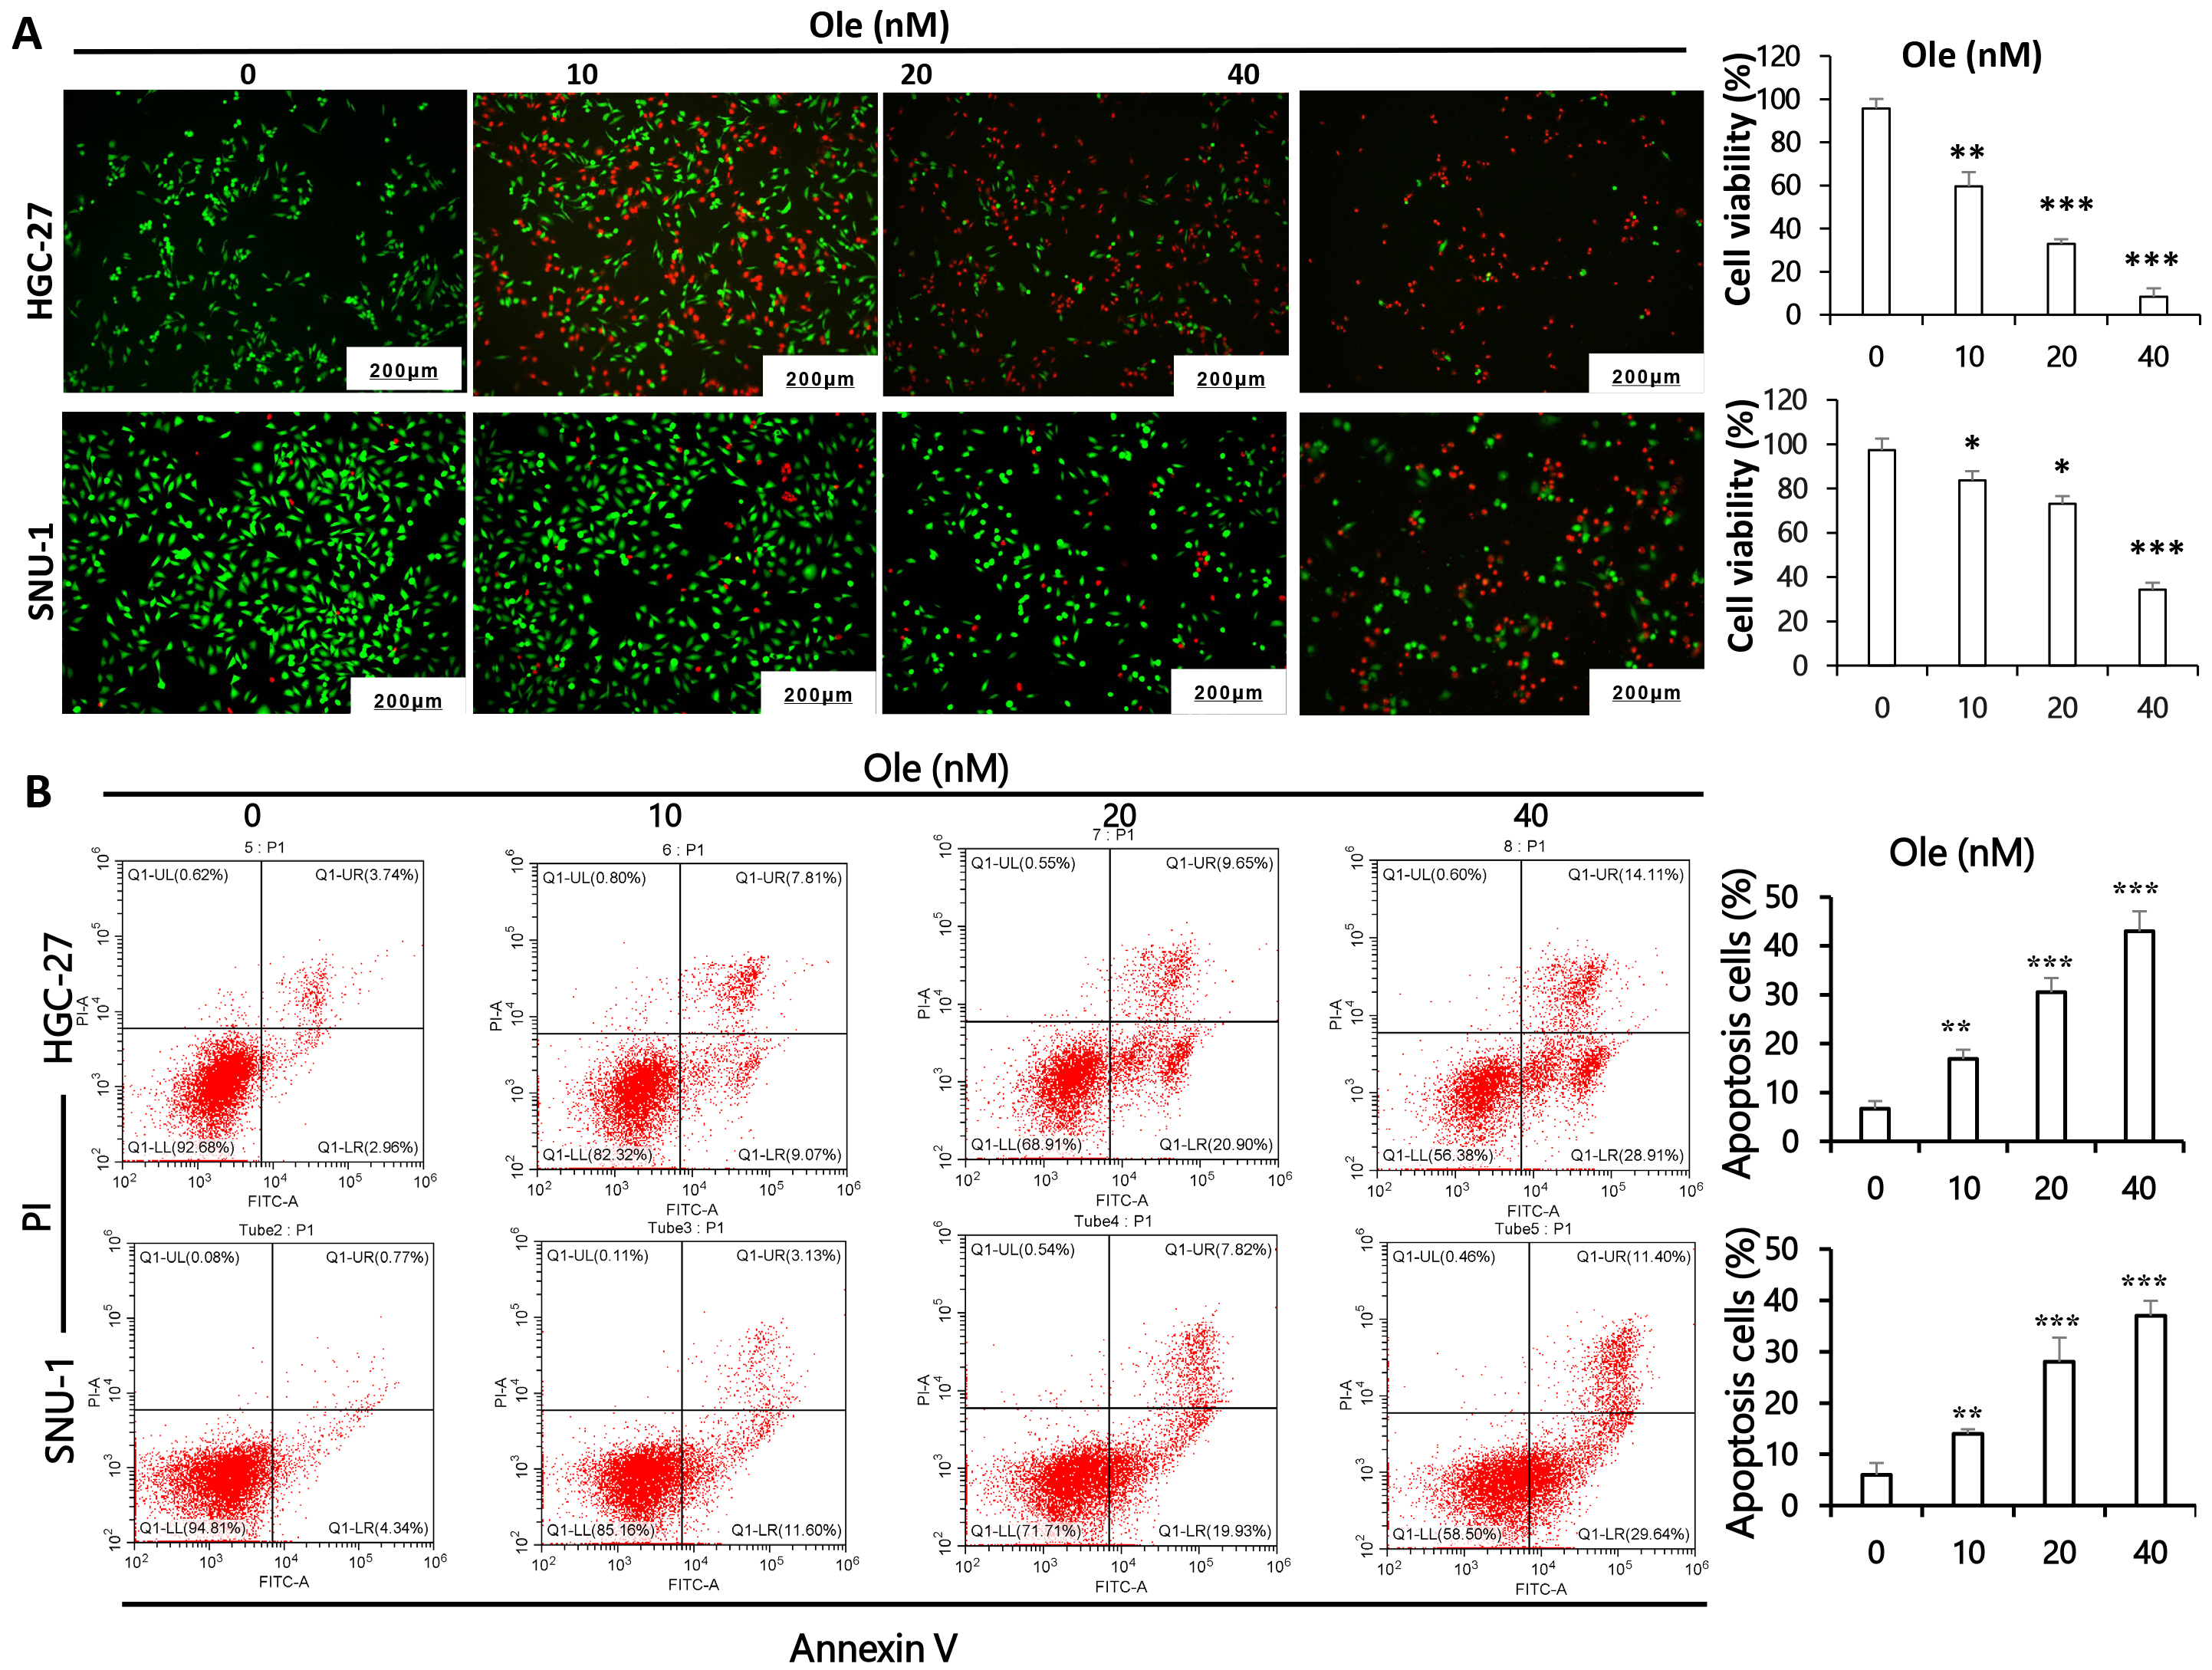 Fig. 2.
Ole triggers apoptosis in GC cells. (A) Calcein/PI assays was
employed to clarify the apoptotic potential of GC cells exposed to varying doses
of Ole. (Scale bars = 200 µm) (magnification:
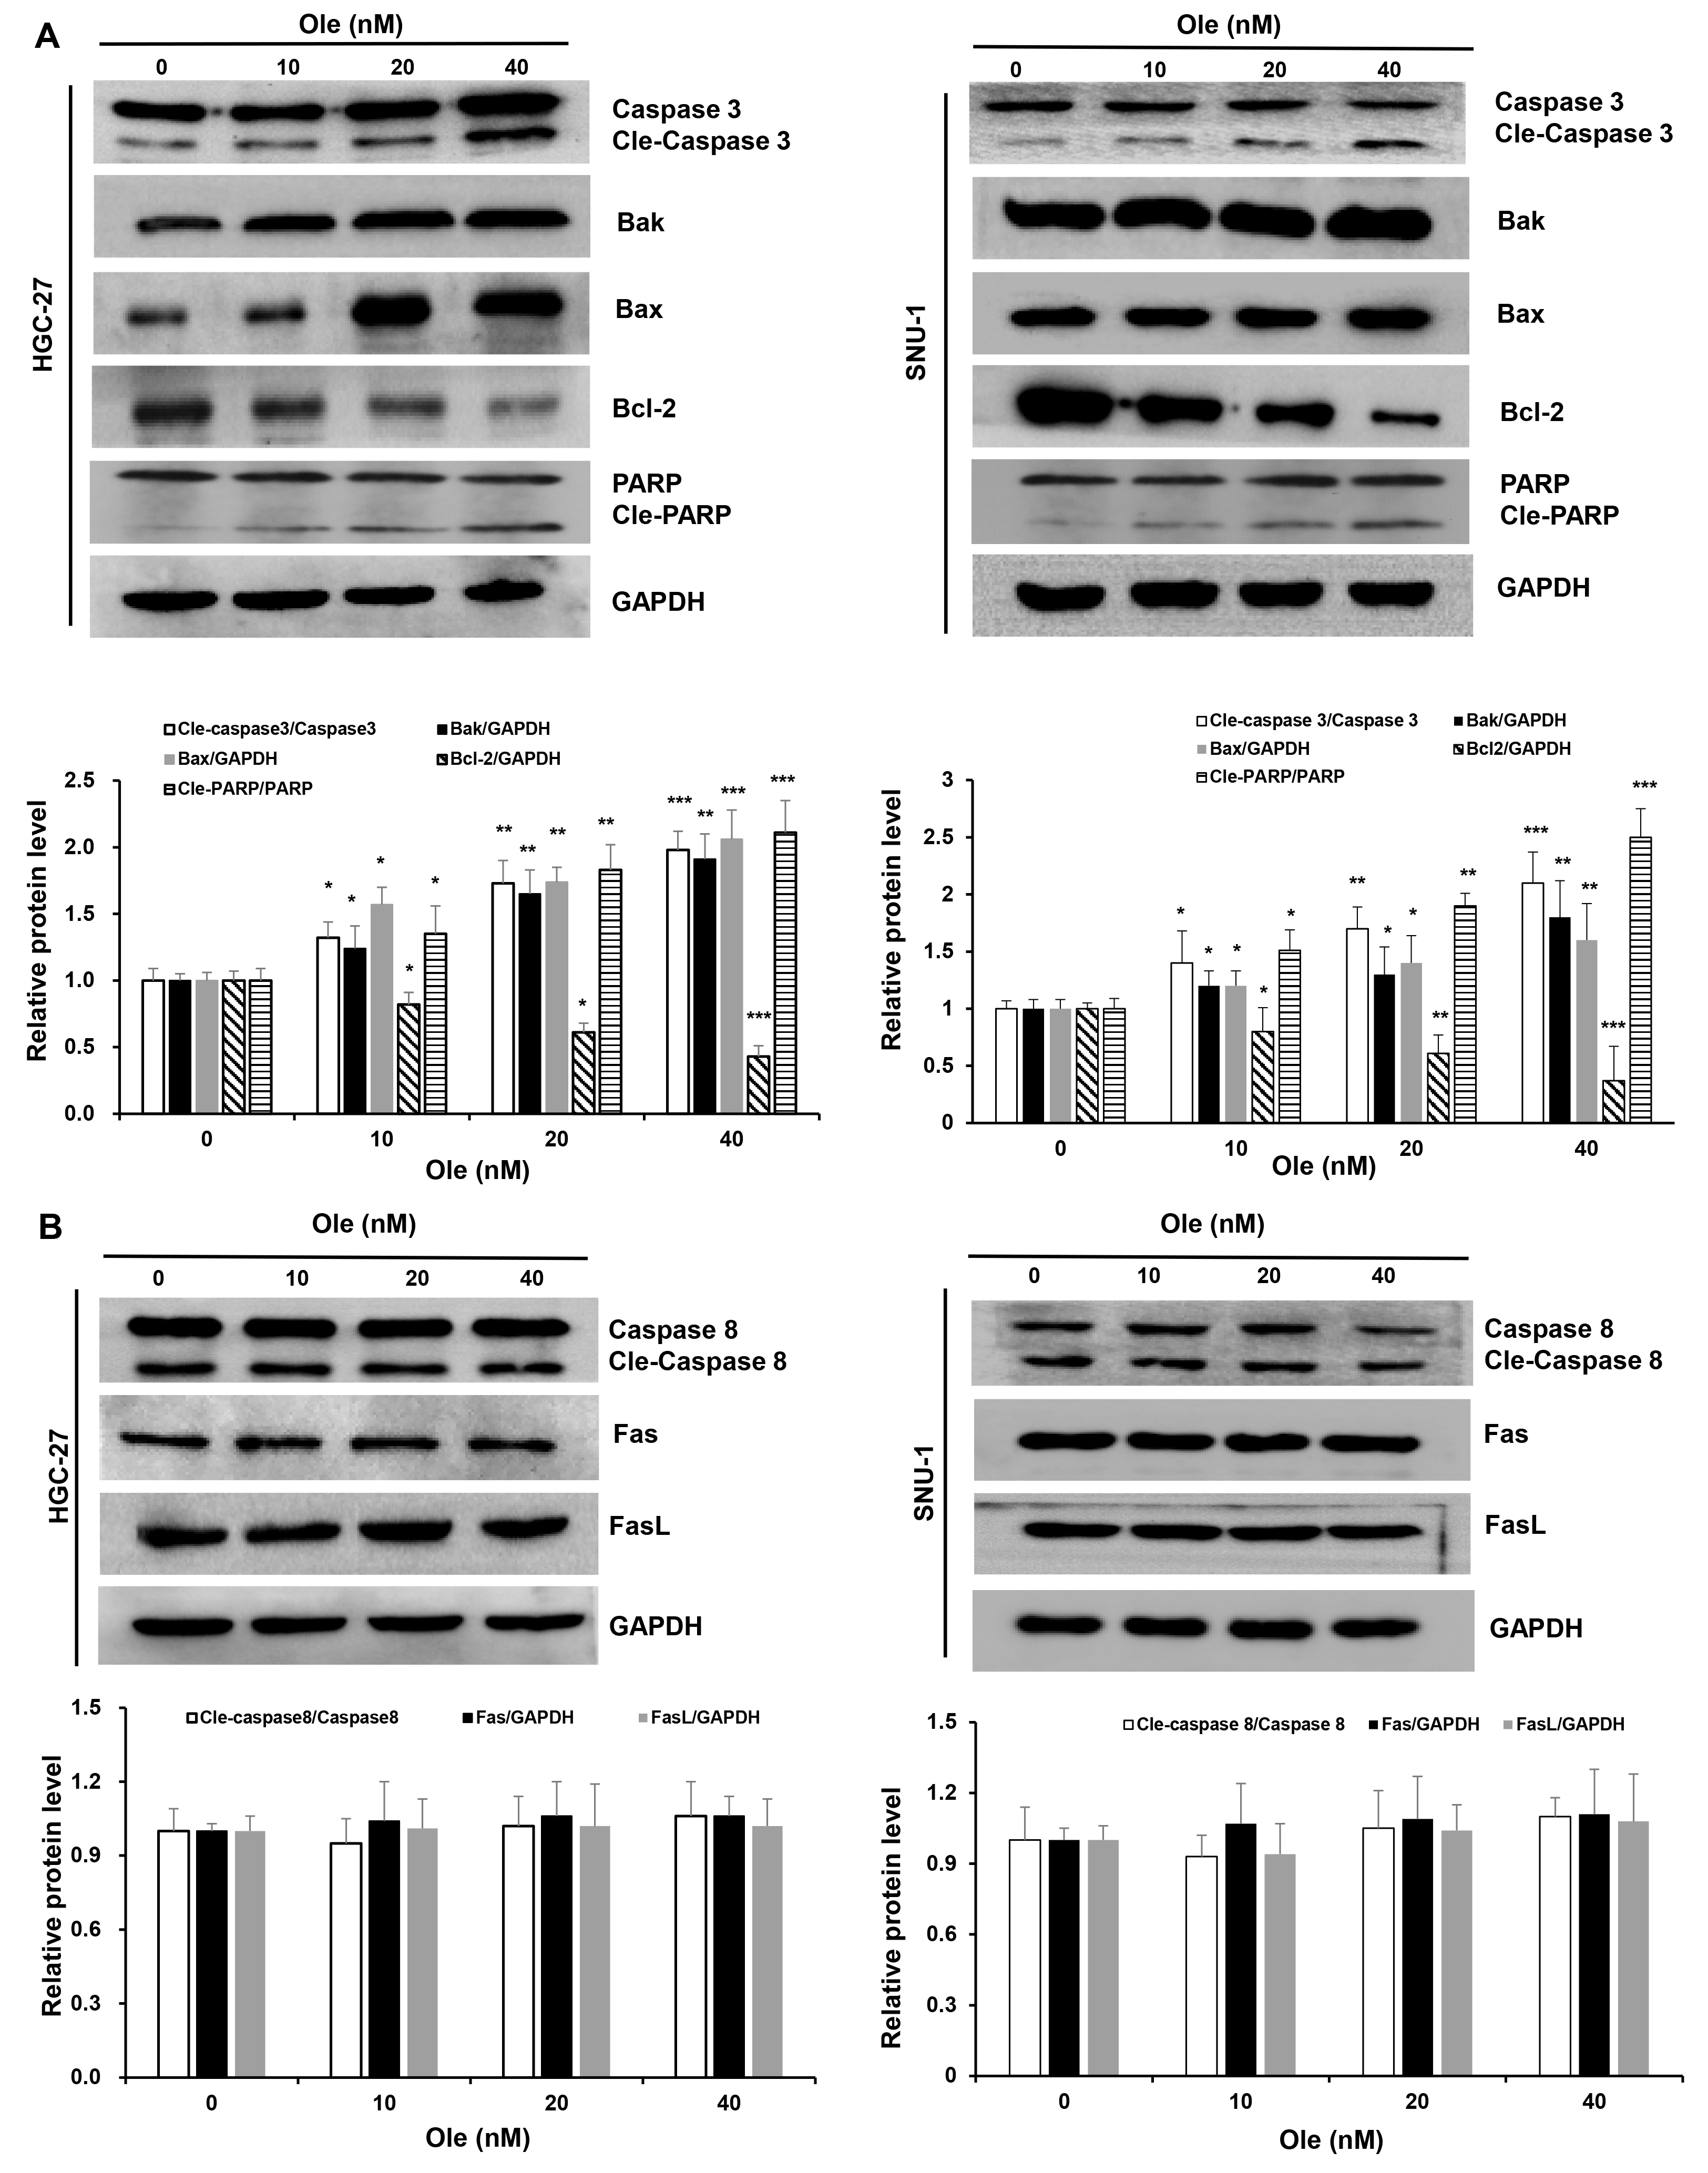 Fig. 3.
Ole triggers intrinsic apoptosis in GC cells. (A)
Western blotting analysis of the intrinsic apoptosis proteins
in GC cells triggered by Ole at varying doses. (B) Western blotting analysis of
the extrinsic apoptosis proteins in GC cells. In contrast to the control group,
*p
The variation of autophagy treated with Ole in HGC-27 and SNU-1 cells were investigated. Transmission electron microscopy revealed that the formation of autophagic vacuoles in HGC-27 and SNU-1 cells treated with Ole was obviously increased compared to control group (Fig. 4A). And the confocal microscopy also showed that Ole lead to aggregation of autophagosomes in HGC-27 and SNU-1 cells compared to control group (Fig. 4B). Western blot results also showed that autophagy related proteins such as LC3BⅡ/LC3BⅠ ratio and beclin-1 were increased and p62 was decreased (p
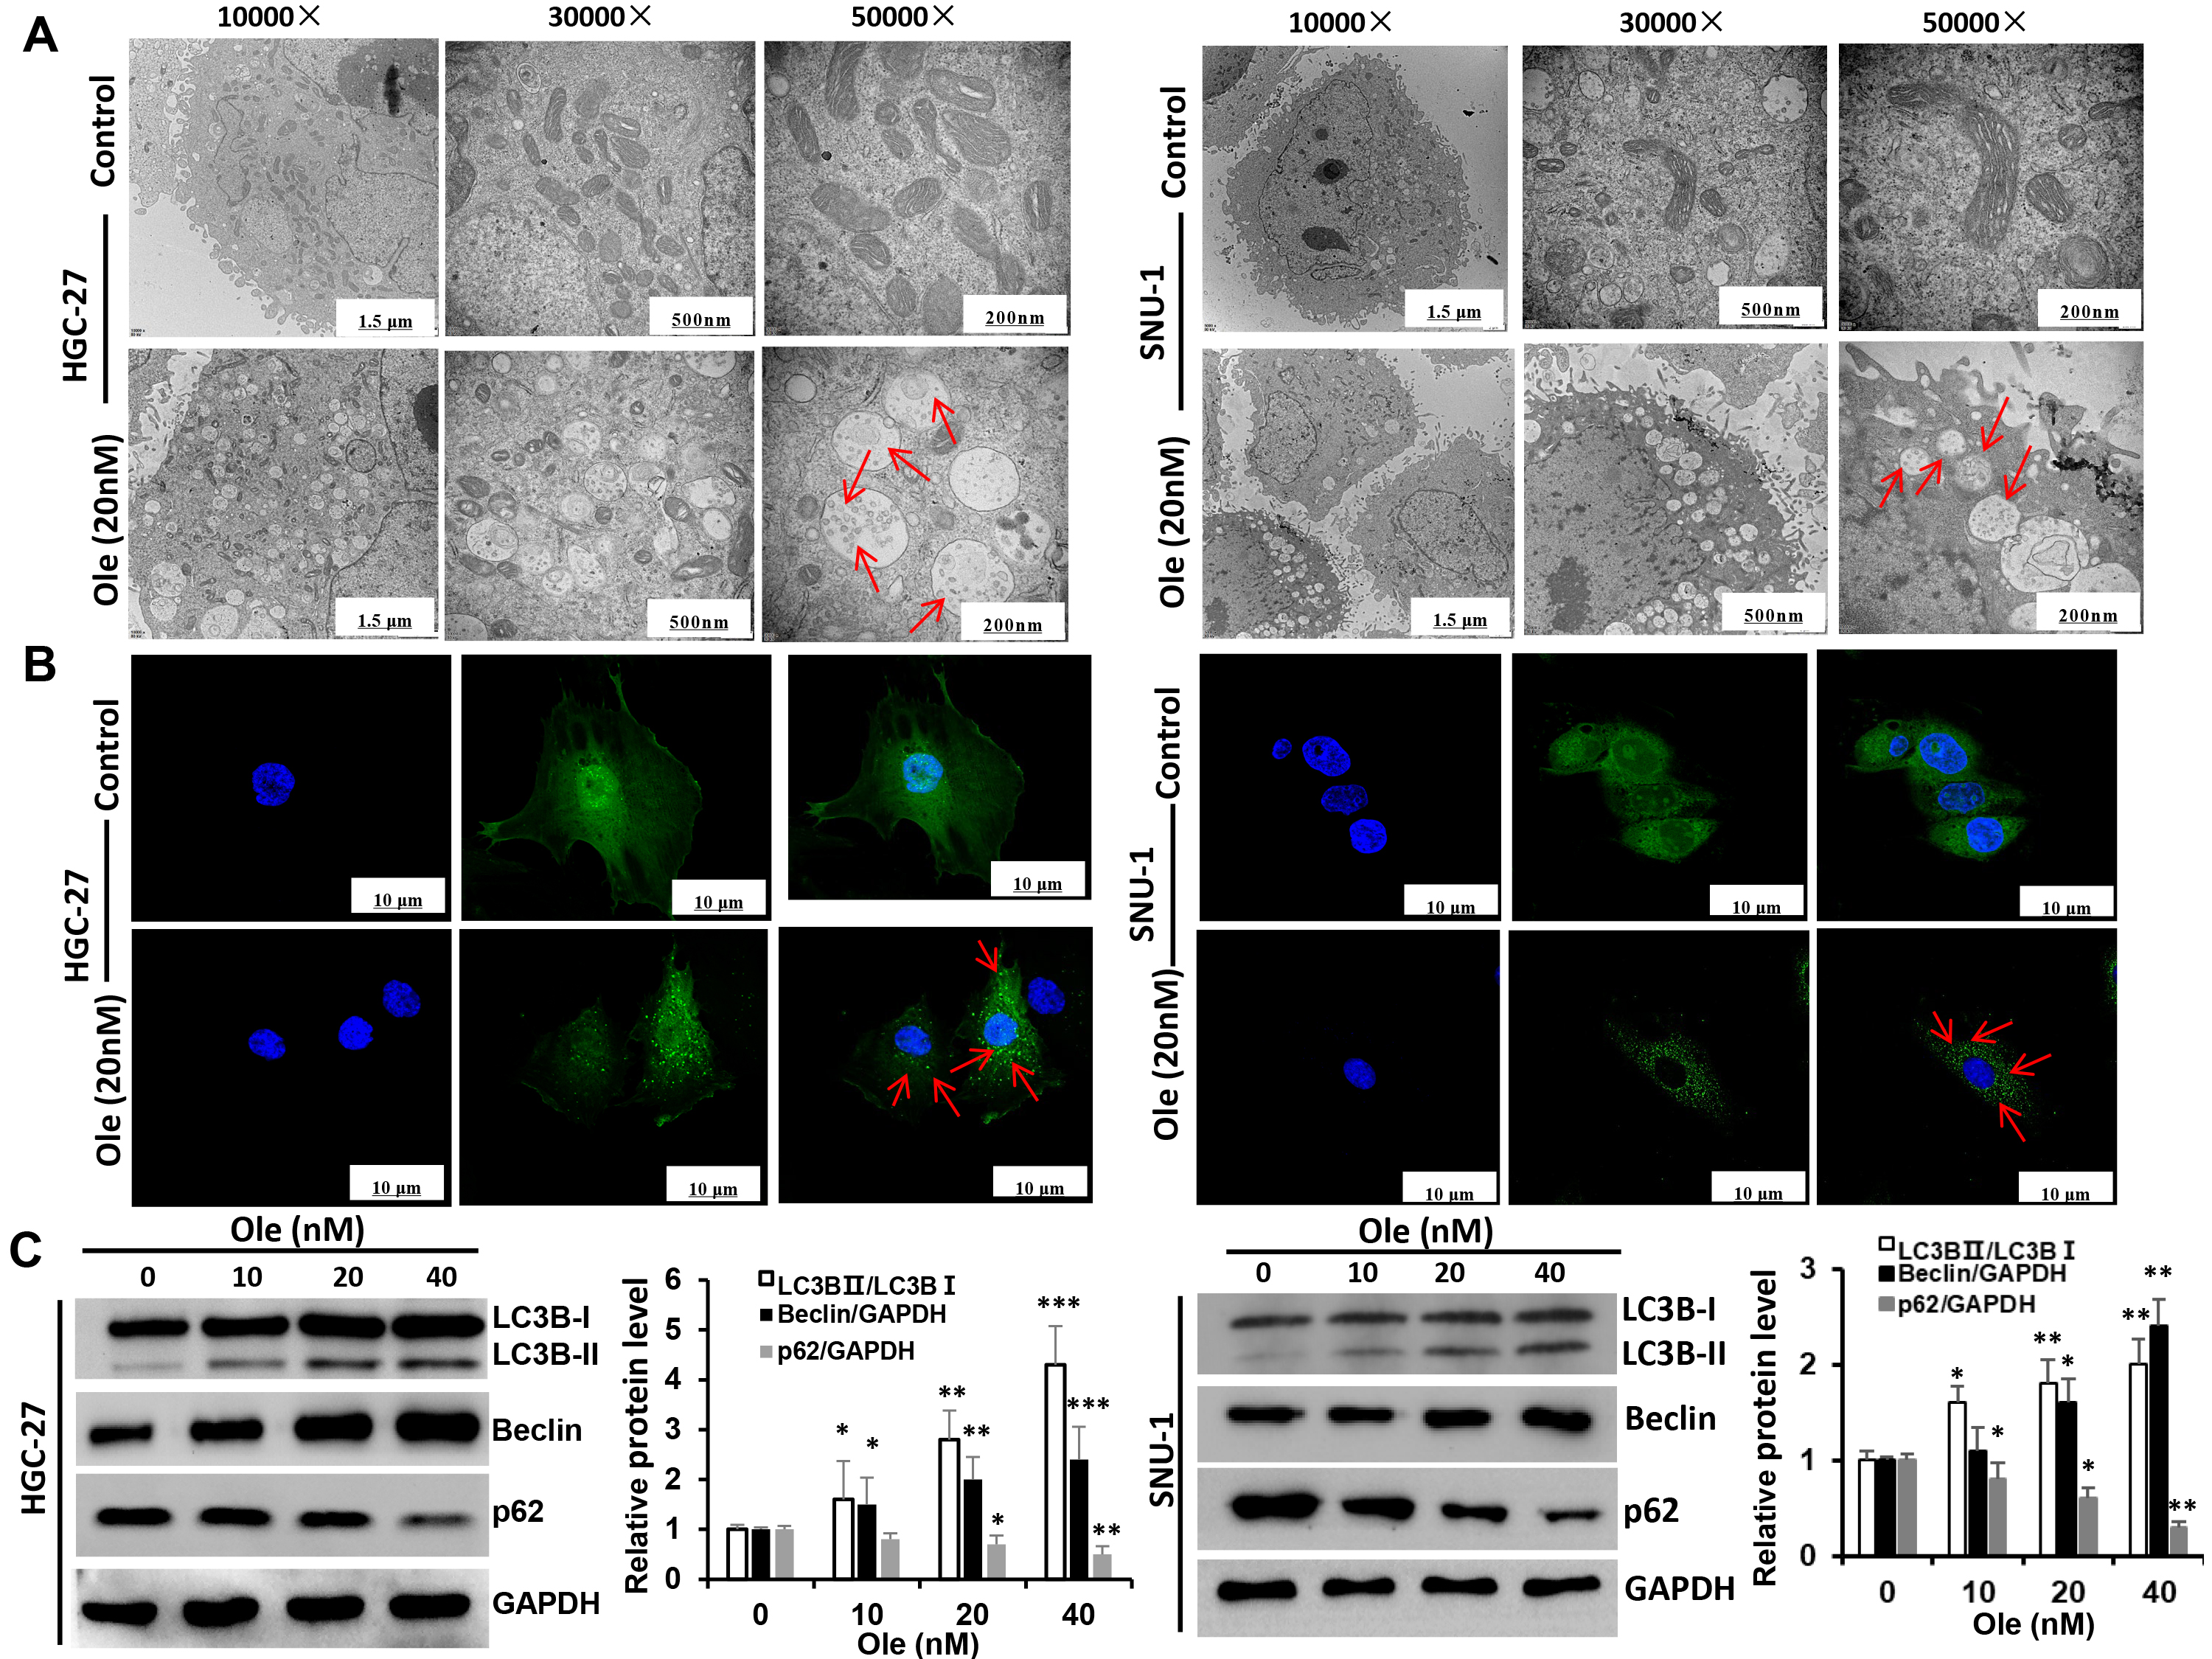 Fig. 4.
Ole promotes autophagy in GC cells. (A) The
autophagosomes of GC cells treated with Ole (20 nM) were examined using
transmission electron microscopy (red arrow: autophagosomes). (Scale bars = 1.5 µm, 500 nm, 200 nm). (B) The development of endogenous LC3 puncta in GC cells
treated with Ole (20 nM) was assessed using immunofluorescence (magnification:
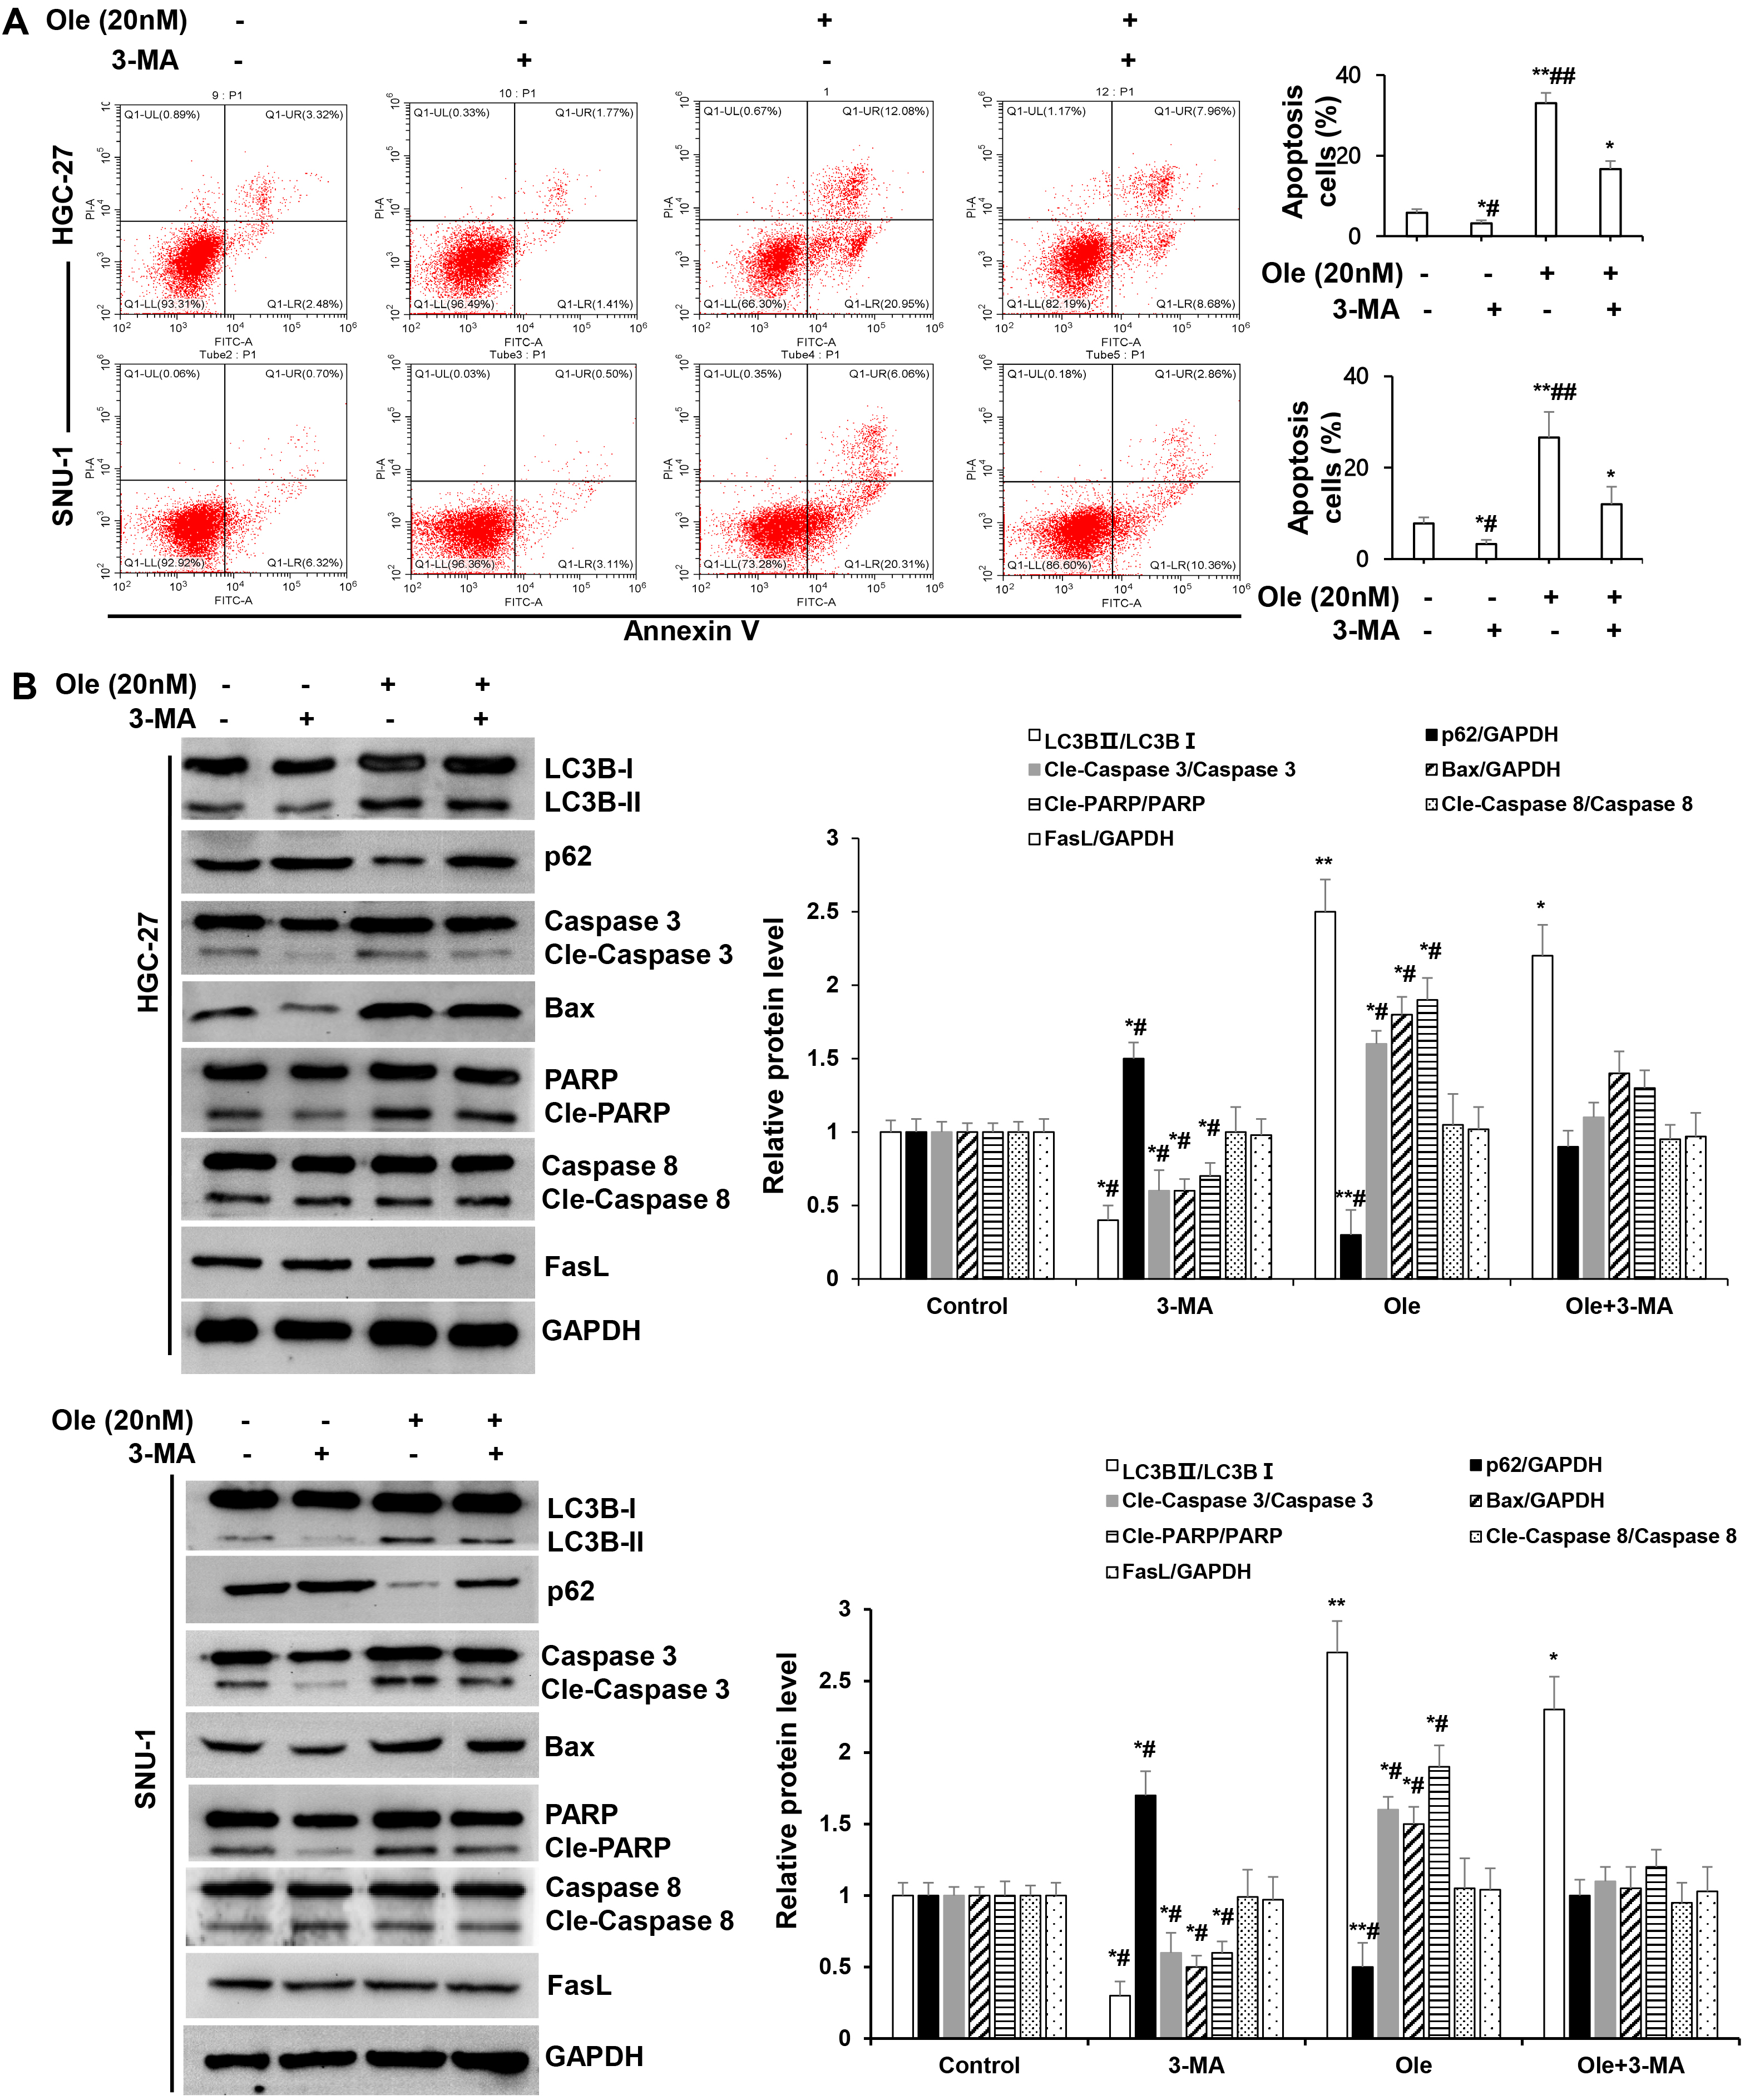 Fig. 5.
Ole promoted endogenous apoptosis by enhancing autophagy in GC
cells. (A) Apoptosis of GC cells treated with Ole (20 nM) in
the existence or non-existence 3-methyladenine (3-MA) (30 µM) were examined
by Flow cytometry. (B) Western blotting analysis of the protein levels of GC
cells treated with Ole (20 nM) either with or without 3-MA (30 µM). In
contrast to the control group, *p
Subcutaneous xenograft model of gastric cancer cells were used to define effect of Ole on tumor growth. The tumour size and weight in Ole (50 μg/kg) group were significantly reduced compared to control group (p
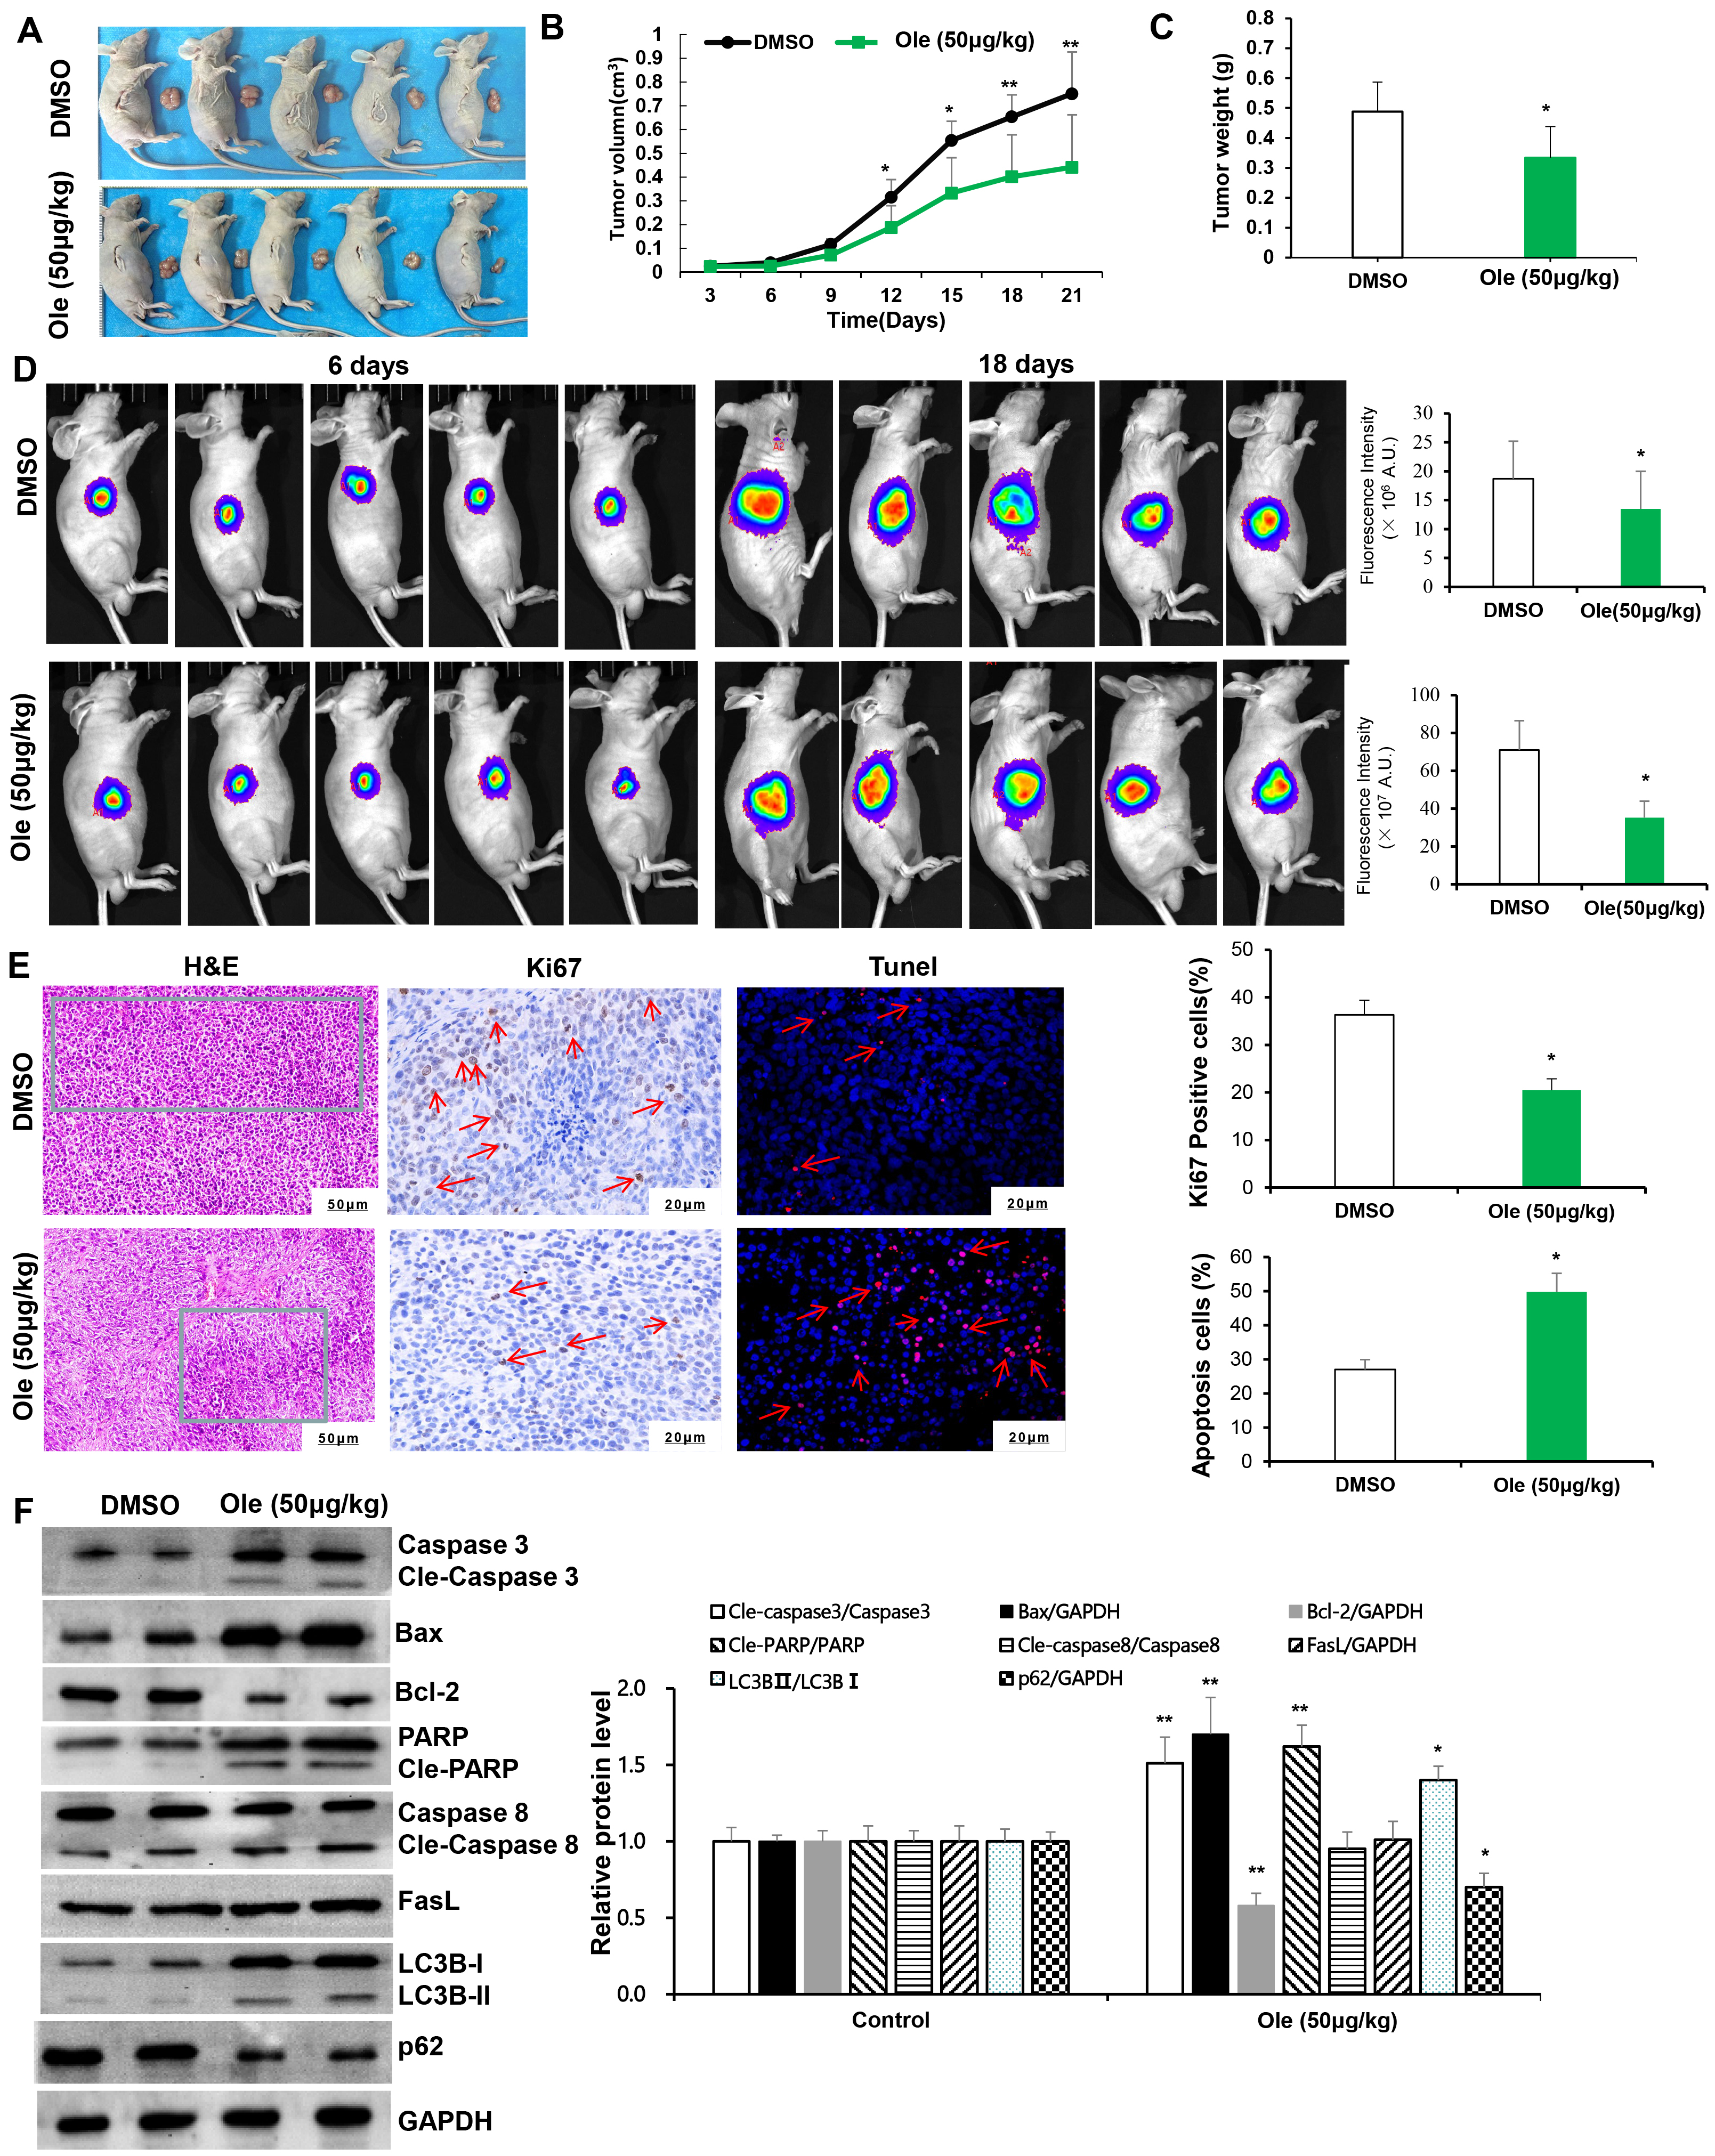 Fig. 6.
Ole suppressed tumor growth by promoting
apoptosis and autophagy in living organisms. (A) The tumor images in the DMSO
group and the Ole (50 µg/kg) group. (B) The tumor volumes
of the mice were monitored every three days. (C) Tumor weight of mice was
assessed after 21 days of therapy in the DMSO group and the Ole (50 µg/kg)
group. (D) IVIS images of murine tumors after 6 days and 18 days in the DMSO
group and the Ole (50 µg/kg) group. (E) H&E staining (green framework:
Infiltrating inflammatory cells) (magnification:
The toxicity of Ole on tumor bearing animals were evaluated. The body weight and liver weight has no significant changes in Ole group compared to control group (p
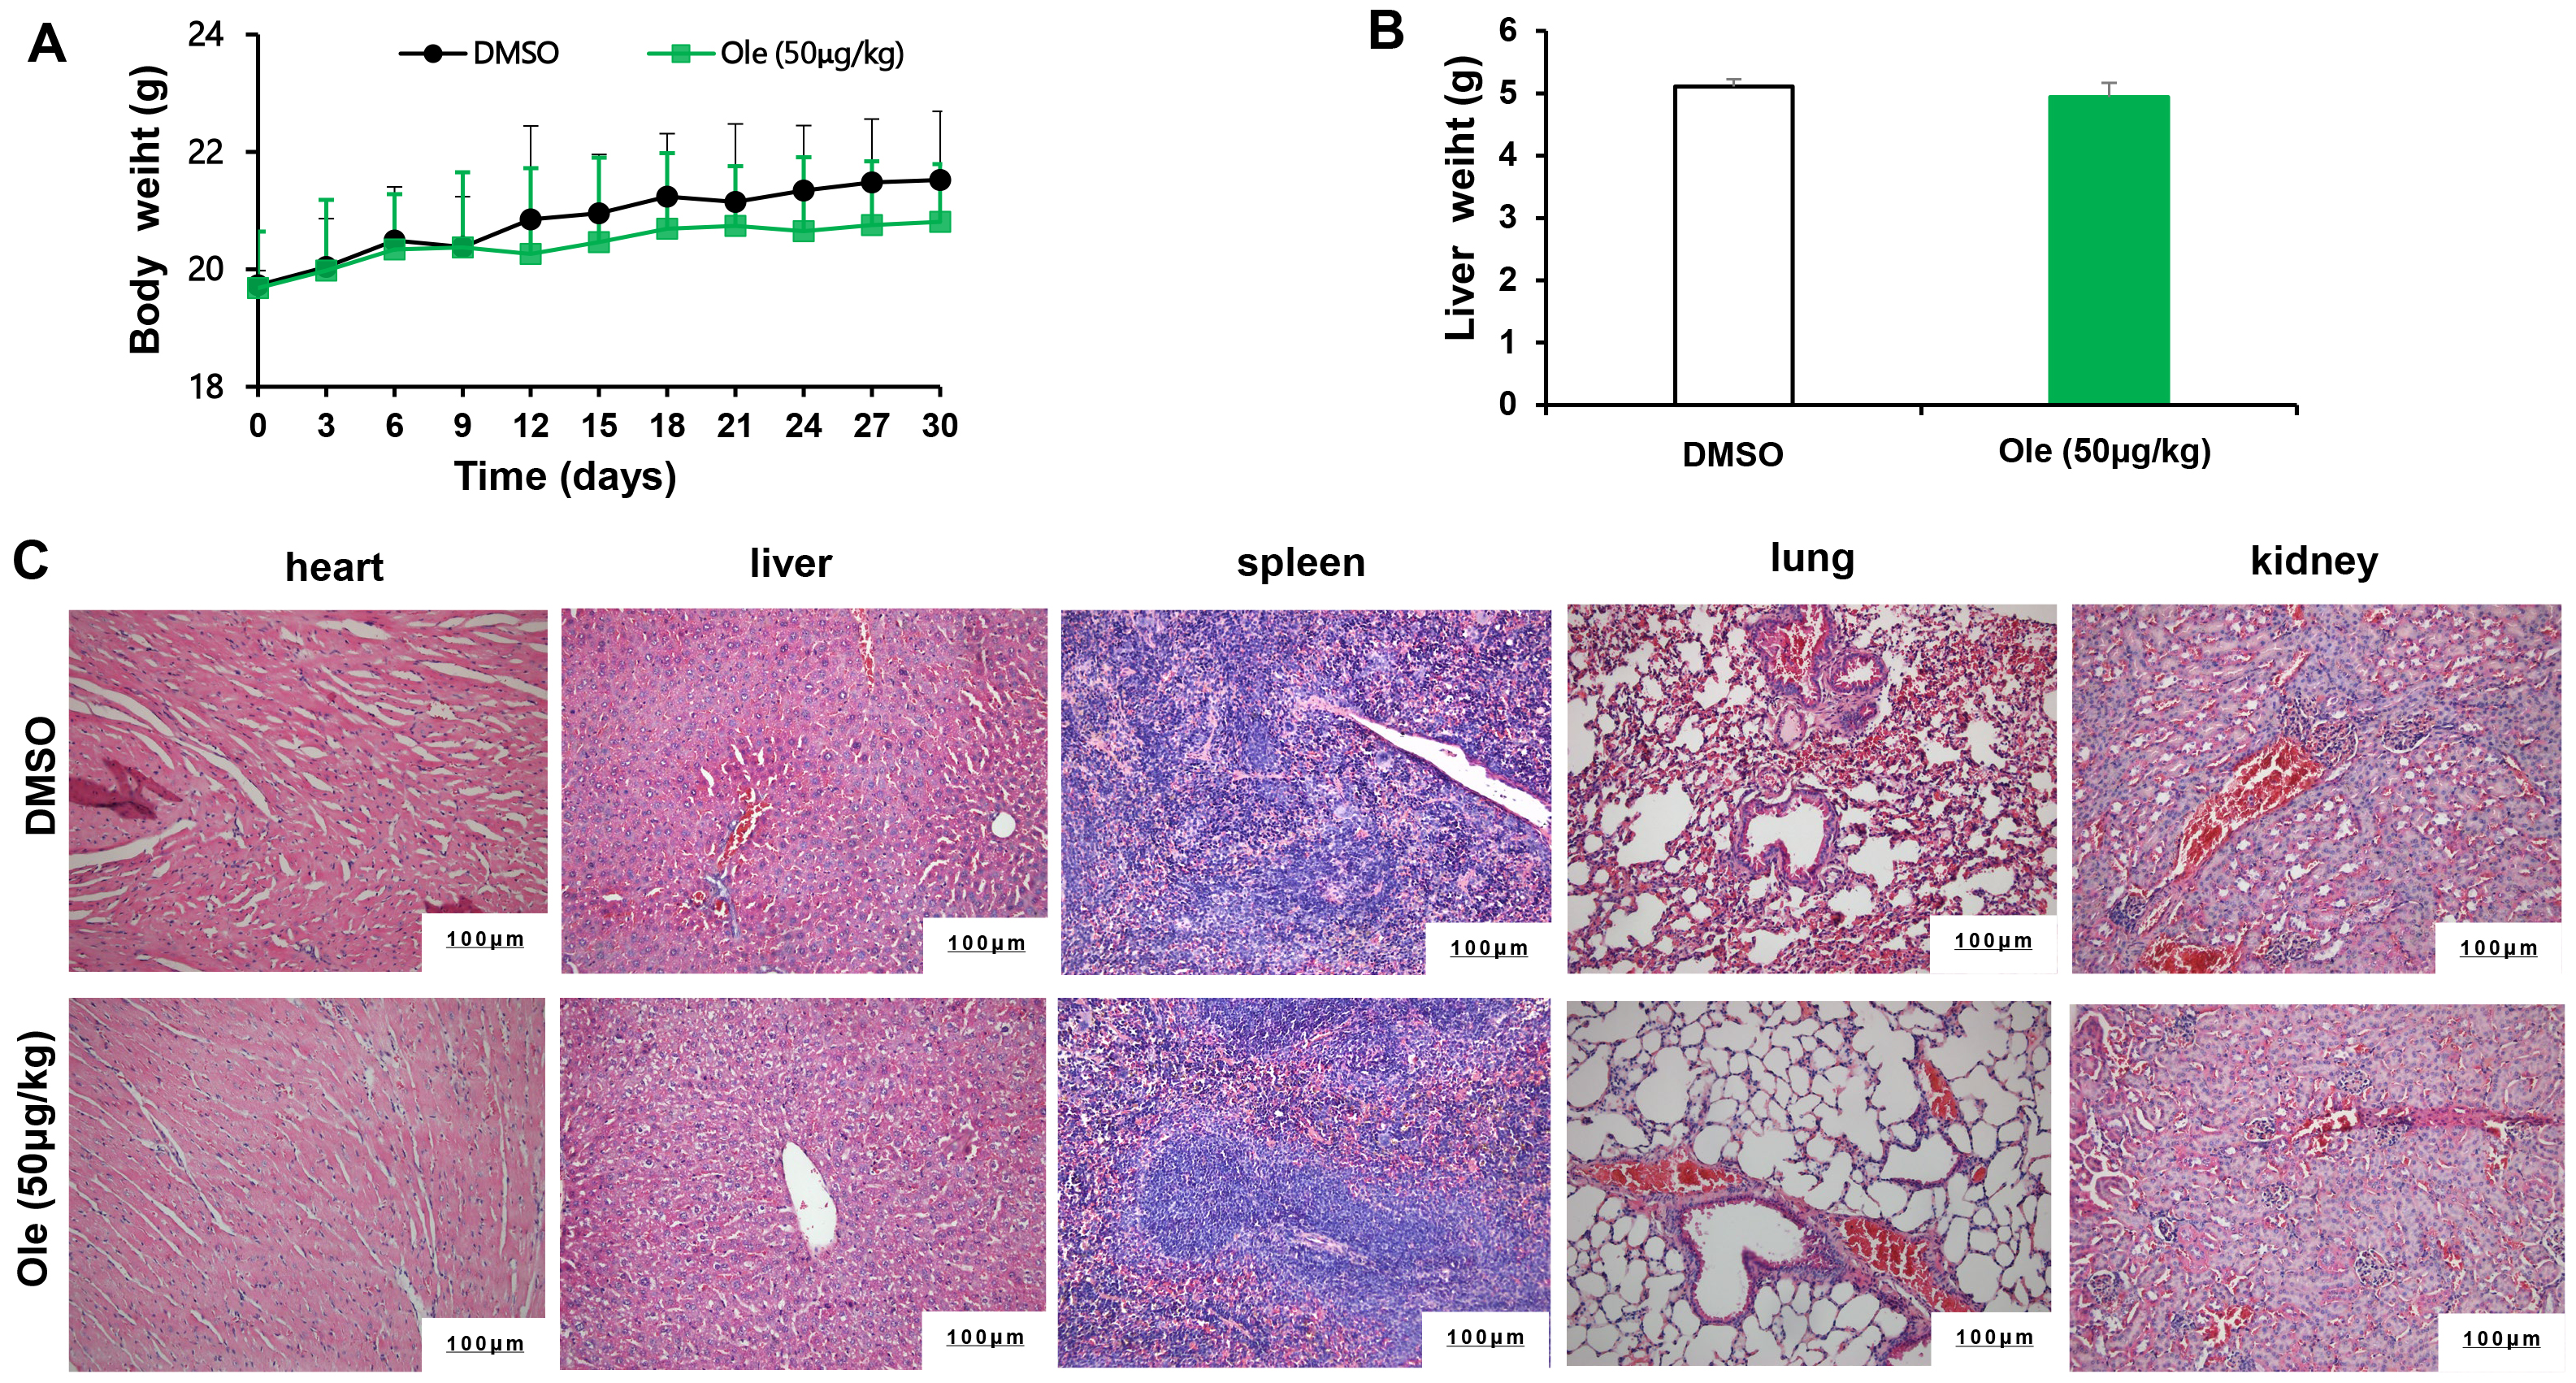 Fig. 7.
The toxicity of Ole in tumour bearing mice. (A) Mice’s weight was tracked every three days. (B) The mice’s liver weight was assessed after a 21-day period. (C) The toxicity of Ole was assessed by measuring the H&E staining of sections of heart, liver, spleen, lung, and kidney tissue (Scale bars = 100 µm).
Ole is among the most pharmacologically potent phytochemical constituents in Nerium oleander, exhibiting efficient and non-toxic anti-cancer properties. The anti-cancer efficacy of oleandrin on osteosarcoma [18], colon cancer [4, 11], and pancreatic cancer [19] has been documented by other researchers [10]. There has been little investigation into the role of Ole or its underlying mechanism in GC. This work initially demonstrated that Ole can reduce the growth of GC cells in a dose-dependent manner at low nanomolar doses, while showing no significant effect on GES-1. Cell cycle dysregulation is well recognized as a critical characteristic of malignancies. Prior investigations demonstrated that Ole had significant anti-cancer activity by disrupting the cell cycle [20, 21]. For example, Ole could suppress cells proliferation in colon cancer via blocking in the G2/M phase [22], and Ole also inhibit proliferation of pancreatic cancer via arresting cells cycle at G2/M phase [23]. Our finding suggested that Ole could block cell cycle at G0/G1 phase and thus suppressed the growth in GC cells.
Cancer cells have a remarkable ability to evade apoptosis. Ole could promote cell apoptosis in human melanoma cells by means of the toll-like receptor pathway and is associated with microRNAs [24]. Ole could trigger cell apoptosis in colorectal cancer patients by way of the mitochondrial pathway [22]. Our findings demonstrated that Ole substantially causes apoptosis in GC cells through initiating intrinsic apoptosis, with no noticeable modifications in extrinsic apoptosis.
An increase in acidic vesicle organelles during autophagy, a vital biological process requiring lysosomal breakdown within cells, is typically dysregulated in cancer cells, providing an alternative mode of programmed cell death [25, 26, 27]. Ole is claimed to trigger the death of the human pancreatic cancer cell line PANC-1 by activating autophagy and may also cause autophagic cell death in undifferentiated human colon cancer CaCO-2 cells [28]. Autophagy occurs during cell stress. To prevent apoptosis, the cell will autophagically respond to non-lethal stress [29, 30]. When cells exceed an intensity threshold, autophagy and related proteins may degrade biological components or activate apoptotic pathways, causing cell death [31, 32]. According to our findings, Ole may significantly increase gastric cancer cell autophagy. Moreover, we reasoned that Ole may induce endogenous apoptosis in gastric cancer cells by activating autophagy. According to the research, Bcl-2-interacting protein 1 (Beclin1) is involved in autophagy and apoptotic cell death pathway regulation [33]. We found that Beclin was significantly upregulated in Ole-induced autophagy in GC cells, while Bcl-2 was significantly downregulated in activated apoptosis, and 3-MA reversed the shift of apoptosis-related proteins. This suggests that Ole may induce apoptosis by stimulating autophagy through Beclin.
There are certain limitations on this research. First, the dual role of pharmacology and toxicology of Ole remains a major puzzle in phytomedicine. Therefore, the safe dose of Ole must be concerned in future studies. Second, we have not addressed Ole-induced autophagy-dependent intracellular apoptotic signaling. In next step, we will find the key proteins and related pathways by single-cell sequencing and proteome sequencing, and knock them down using siRNA or CRISPR to further clarify the relationship between the key proteins and signaling pathways with apoptosis and autophagy. Third, the effectiveness of Ole should be evaluated on patient-derived xenograft models to assess its potential in personalized medicine. We will construct the patient-derived organoid and organoid xenograft models. Last, we will analyze the impact of Ole on mitochondrial function and integrity, as mitochondria play a crucial role in both apoptosis and autophagy.
In summary, Ole can limit the proliferation of gastric cancer cells by stopping the cell cycle at the G0/G1 phase, and trigger apoptosis through the activation of autophagy in gastric cancer. It offers a secure and efficacious candidate drug for the treatment of tumors in the digestive system (Fig. 8).
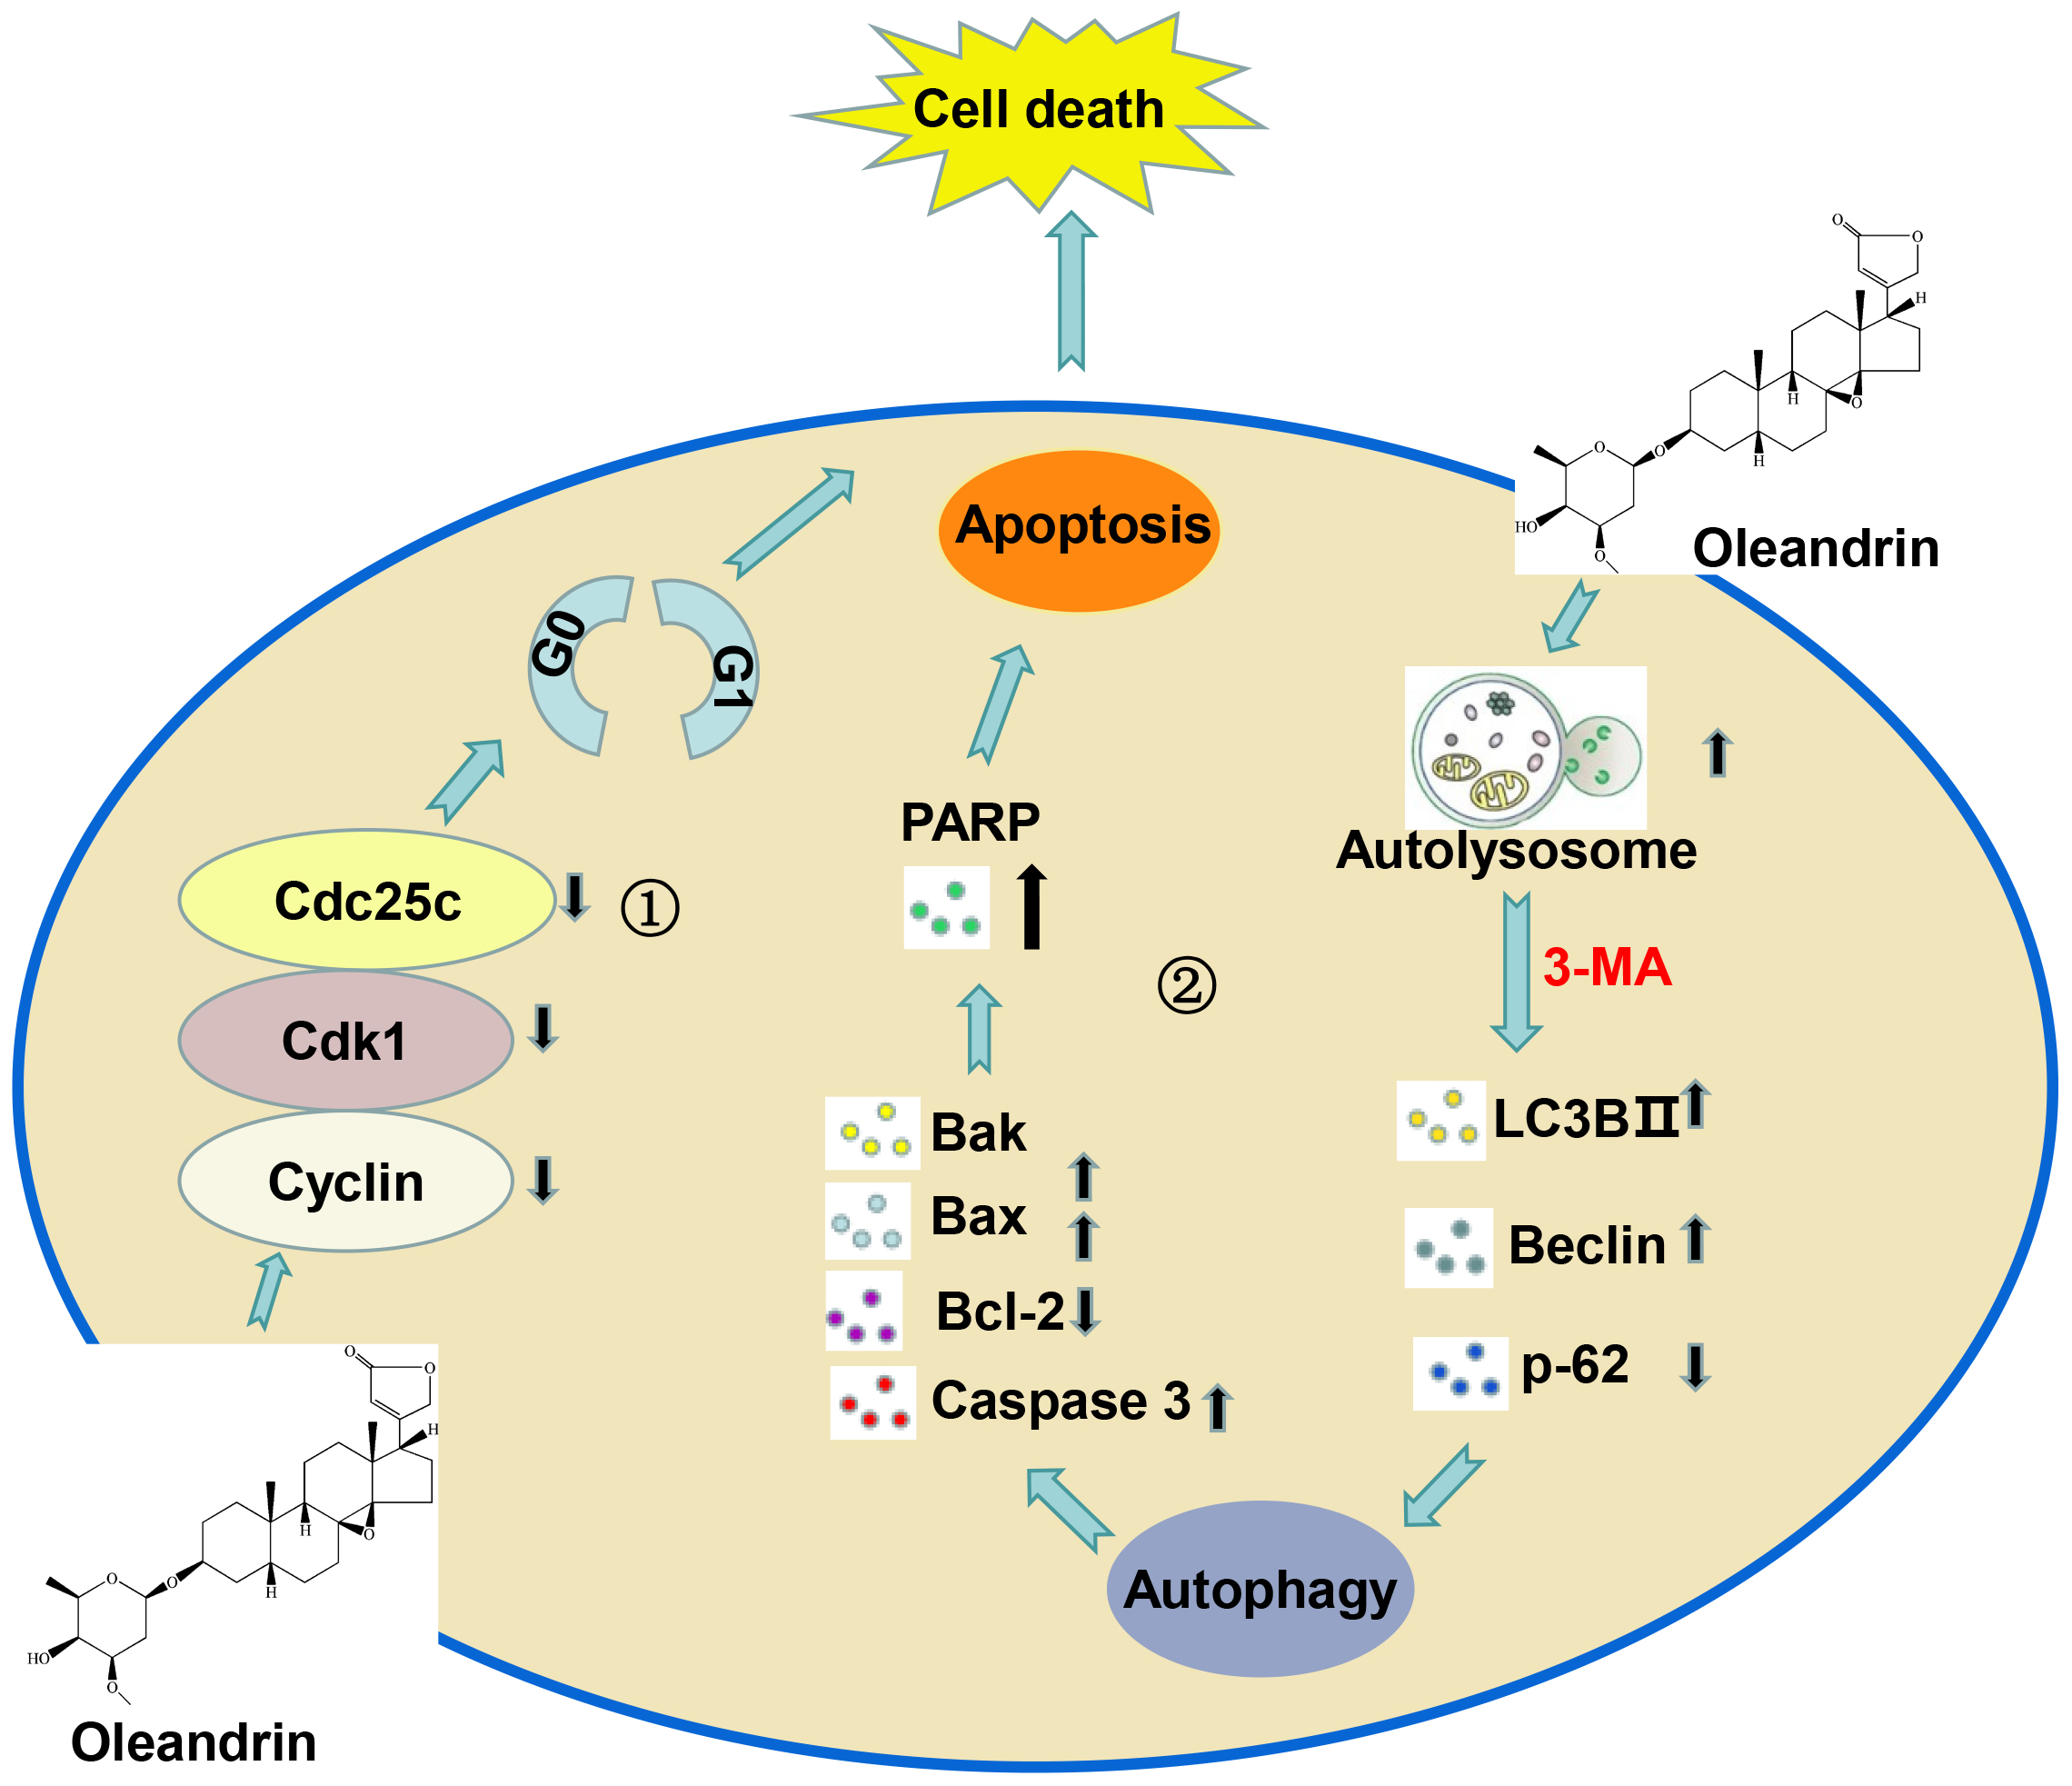 Fig. 8.
Working model of the anti-tumor mechanism of Ole in gastric cancer. ① Ole can limit the proliferation of gastric cancer cells by stopping the cell cycle at the G0/G1 phase. ② Ole trigger apoptosis through the activation of autophagy in gastric cancer. Created by Figdraw software 2.0 (Home for Researchers, Hangzhou, China).
This study revealed that Ole had strong pro-apoptotic capability on gastric carcinoma at low concentrations depending on activation of pre-death autophagy. It may offer a secure and efficacious candidate drug for the treatment of tumors in the digestive system.
The analyzed data presented in the study are included in the article, which will be made available by the corresponding author.
XH, CX and JW were responsible for designing the overall study, processing data analysis, and writing & editing the manuscript. LY, XZ, and YW, were responsible for processing experimental validation. HL, XJ, YF and DO were accountable for analyzing and interpreting the data. All authors viewed and approved the final manuscript for publication. All authors contributed to editorial changes in the manuscript. All authors have participated sufficiently in the work and agreed to be accountable for all aspects of the work.
The procedures and ethics of animal used in this study have been reviewed and approved by the Biomedical Ethics Committee of Medicine School of Xi’an Jiaotong University (No. XJTUAE2023-178). All animal experiments were in accordance with the guide for the care and use of laboratory animals established by United States National Institutes of Health (Bethesda, MD, USA).
Not applicable.
This study was supported by Shaanxi Province Innovation Capability Support Plan (2024RS-CXTD-84), Shaanxi Province health gastrointestinal tumor organ precise diagnosis and treatment research innovation platform, the Science and Technology Program of Xi’an (23YXYJ0186), Science and Technology Talent Support Program of Shaanxi Provincial People’s Hospital (2021LJ-02).
The authors declare no conflict of interest.
References
Publisher’s Note: IMR Press stays neutral with regard to jurisdictional claims in published maps and institutional affiliations.