


 , Jing Yu 2,*
1 Department of General Surgery, Shandong Provincial Third Hospital, Shandong University, 250031 Jinan, Shandong, China
2 Department of Pathology, Shandong Provincial Third Hospital, Shandong University, 250031 Jinan, Shandong, China
Abstract
Tumor-associated telocytes (TATCs) perform a pivotal role in hepatocellular carcinoma (HCC) progression and correlate with poor patient outcomes. This study aims to identify specific markers of TATCs in HCC using single-nucleus RNA sequencing (snRNA-seq) and transcriptomic analyses.
Comprehensive snRNA-seq and transcriptomic profiling were performed on HCC and adjacent non-cancerous tissues to detect differential expressed genes (DEGs) in TATCs. Bioinformatics tools, including STING and Cytoscape software, were employed to analyze protein–protein interactions and hub genes. Immune cell interactions were assessed via ligand-receptor network analysis.
TATCs constituted 0.35% of cells in HCC tissues, with reduced proportions compared to para-cancerous tissues (0.35% vs 8.19%). Hub genes, including TOP2A (DNA topoisomerase Ⅱ alpha), BUB1B (BUB1 mitotic checkpoint serine/threonine kinase B), KIF11 (kinesin family member 11), and CENPF (centromere protein F) were identified in telocytes (TCs). Transcriptomics revealed 622 upregulated and 758 downregulated genes in TATCs versus TCs. TMC5 (transmembrane channel like 5) and SLC35F3 (solute carrier family 35 member F3) emerged as unique TATCs biomarkers, revealing significant associations with poor overall survival (OS) in HCC patients (HR = 1.499 for TMC5; HR = 1.562 for SLC35F3).
TMC5 and SLC35F3 are promising biomarkers for TATCs in HCC, warranting further validation to explore their clinical and therapeutic implications.
Keywords
- hepatocellular carcinoma
- tumor-associated telocytes
- transcriptomics
- single-nucleus RNA-sequence
- hub genes
In China, a significant type of cancer is primary liver cancer, which encompasses three subtypes: hepatocellular carcinoma (HCC), intrahepatic cholangiocarcinoma (ICC), and mixed hepatocellular carcinoma [1]. For roughly 20–40% of patients who are diagnosed with HCC, surgery may be a viable treatment option, which adds significantly to the complexity managing this disease [1, 2, 3]. HCC demonstrates a range of genetic features, with tumor cells showing abnormal alterations in cytogenetics, epigenetics, and transcriptomics. Therefore, investigating the gene sequences can provide fresh perspectives to uncover the molecular mechanisms underlying HCC.
Increasing evidence suggests that advanced techniques such as transcriptomic and proteomic analyses of tissues and organs, along with single-nucleus RNA sequencing (snRNA-seq), can be utilized to unravel the genetic complexities of HCC [4, 5]. The integration of these methodologies for assessing HCC heterogeneity is viewed as the most efficient strategy for confirming specific hub genes, identifying new therapeutic targets, and uncovering distinct biomarkers associated with particular cell types, such as telocytes (TCs), which are recognized for their role in cancer tumorigenesis.
TCs, originally identified as interstitial cells of Cajal, are characterized by irregularly shaped cell bodies and elongated filopodia known as telopodes (Tps), which are thought to be crucial for communication between cells [6, 7, 8]. TCs that are implicated in the progression and maintenance of various tumors, are considered as tumor-associated telocytes (TATCs). TATCs significantly influence the immune microenvironment by modulating immune cell activity via cytokine release and direct cell interactions [9]. Their involvement in immune regulation and tissue healing positions them as potential targets for therapy, highlighting the necessity for additional studies to exploit their distinctive properties in cancer treatment. Nonetheless, the lack of specific biomarkers within HCC tissue complicates the task of defining TATCs’ characteristics. Consequently, our objective was to discover unique markers for TATCs through snRNA-seq, transcriptomic technologies, and in vitro methodologies.
In this study, six pairs of cancerous tissues and para-cancerous tissues were
collected from male patients. The inclusion criteria for patients were as
follows: male patients pathologically diagnosed with HCC, aged between 45 and 65
years, classified as Barcelona Clinic Liver Cancer (BCLC) Stage A [10], with no
history of smoking or alcohol consumption, and who had not received preoperative
radiotherapy or chemotherapy. The exclusion criteria included the presence of
other malignant tumors or severe extrahepatic diseases. Two seasoned pathologists
diagnosed these samples by relying on the rapid freezing pathology results
obtained during the surgical procedure. A sample had a volume of 1 mm3
(
The MHCC97-H cell line was purchased from Zhongqiaoxinzhou Company of China
(ZQ0020, Shanghai, China) and cultured in dulbecco’s modified eagle medium (DMEM,
ZQ-122, Zqxzh-Bio, Suzhou, China) at 37 °C in a 5% CO2 incubator. All cell
lines were validated by short tandem repeat (STR) profiling and tested negative for Mycoplasma
(MycoAlert™ kit; LT07-318; Merck KGaA, Darmstadt, German). The
primary TCs were carefully dissected from fresh liver tumor tissues under sterile
conditions. Minimized the inclusion of fat and cut tissues into tiny pieces
(~1 mm3) by surgical scissors, then digested them by
dissolving collagenase (0.5 mg/mL, 2593923, BioMart, Shanghai, China), dispase II
(2.4 U/mL, 40104ES60, BioMart, Shanghai, China), and DNase I (20
µg/mL, ALH044-DLW, Beijing Baiaoleibo Technology Co., Ltd., Beijing,
China) in sterile PBS for one minute and filtered the suspension through a 55
µm cell strainer to remove undigested debris. Centrifuged the cell
suspension at 300
Samples undergo treatment with a particular enzyme to produce a suspension of cell nuclei. This cell suspension goes through several processing steps: it is initially filtered with a 60 µm filter screen, and then a second filtration is performed using a 40 µm filter screen to improve the removal of cell clusters. Once the reverse transcription step is completed, the emulsions are disrupted, and the barcoded cDNA is extracted, followed by RNA amplification. The amplified cDNA obtained is employed for the creation of a 3′ gene expression library. Within the construction of the library, 50 ng of the amplified cDNA is fragmented, end-repaired, subjected to size selection using SPRIselect beads, and then sequenced on the NovaSeq platform (Berry Genomics Company, Beijing, China) 16 to yield 150 bp paired-end reads. The full-length cDNA is subsequently amplified via PCR to ensure an adequate quantity for library preparation. During the incubation of gel bead in emulsion (GEMs), TruSeq Read 1 (a specific primer sequence for Read 1) is incorporated into the molecules. The following processes of End Repair, A-tailing, Adaptor Ligation, and PCR incorporate P5, P7, a sample index, and TruSeq Read 2 (a specific primer sequence for Read 2) into the mixture. Quality control is performed using Qubit HS quantification and Agilent 2100 Bioanalyzer/Fragment Analyzer 5300, resulting in a final library size of approximately 450 bp. After sequencing and quality assessment, raw reads are demultiplexed and aligned to the reference genome via the 10X Genomics Cell Ranger pipeline [16], utilizing default settings. The Seurat package was used [17, 18]. The CellMarker website (http://xteam.xbio.top/CellMarker/) was utilized to guide the classification of cell-types [19]. All raw data was produced by Berry Genomics Corporation (http://www.berrygenomics.com).
After a 48-hour co-culture with HCC cell lines, the TCs cells and those from the
control group were gathered. Total RNA extraction from both groups was performed
utilizing the R1200 kit from Solarbio, located in Shanghai, China. The RNA
underwent qualification and quantification through the following procedures: (1)
RNA purity and concentration assessments were carried out using a NanoDrop 2000
(Thermo Fisher Scientific, Waltham, MA, USA); (2) RNA integrity and amount were
evaluated with the Agilent 2100/4200 system (Agilent Technologies, Santa Clara,
CA, USA). Following the construction of the library, its concentration was
assessed using the Qubit® fluorometer (Thermo Fisher Scientific,
Waltham, MA, USA). The precise concentration of the cDNA library was further
evaluated through qPCR. The library’s size distribution was examined using
agarose gel electrophoresis. Initial raw data in FASTQ format was processed with
custom Perl scripts. Feature-Count was applied to quantify the reads.
Differential expression analysis was performed using EdgeR (Walter and Eliza Hall
Institute of Medical Research, Parkville, VIC, Australia), with p-values
adjusted via the Benjamini and Hochberg method to control for the false discovery
rate. Genes exhibiting
The HCC tissue sample is collected and immediately fixed using a chemical solution (H910607, Haisen Biology company, Hefei, China), to preserve its cellular structures and prevent degradation. Following fixation (Glutaraldehyde, H910607, Hisen company, Shanghai, China), the sample undergoes a series of dehydration steps in graded concentrations of ethanol or acetone to remove all water content. The dehydrated sample is then subjected to critical point drying, a technique that replaces the dehydrant with a liquid that can be transitioned to gas without surface tension effects, preserving the tissue’s structure. Next, the dried sample is mounted on a suitable stub to make it conductive and improve electron signal quality. Finally, the prepared sample is placed inside the scanning electron microscope (SEM) (HITACHI, SU9000, Sinaida, Shanghai, China) chamber, and the microscope is adjusted to focus on the area of interest. High-energy electrons are scanned over the surface, and the secondary or backscattered electrons emitted from the sample surface are collected to form a detailed image of tissue’s surface morphology, revealing the complex cellular and extracellular structures at high magnification.
The Cancer Genome Atlas (TCGA)-LIHC database
(https://portal.gdc.cancer.gov/projects/TCGA-LIHC), including 424 RNA-seq
samples, was used to assess the prognostic values of overall survival (OS),
different expression levels with TNM stages, and receiver operating
characteristic (ROC) curves of which differential expression genes (DEGs) were
screened from snRNA-seq assay. Xiantaoxueshu website was a data visualization
software and purchased from Jieluoxuan company of China
(https://www.xiantaozi.com/) which could construct heatmap, OS curves, ROC
curves, column diagrams and chord diagrams of relationships between DEGs in our
study. We utilized the Gene Ontology (GO) database
(http://geneontology.org) and the Kyoto
Encyclopedia of Genes and Genomes (KEGG) database (https://www.genome.jp/kegg/)
[22, 23], accessed via Bioconductor (http://www.bioconductor.org/) to explore the
signaling pathways associated with the DEGs. For identifying protein-protein
interactions (PPI), we used the STRING database (http://string-db.org/), applying
an interaction score threshold of
Comparisons among several groups were performed utilizing one-way analysis of variance (ANOVA), and
subsequent post hoc analyses were carried out using Tukey’s method. The findings
are presented as means
The snRNA-seq technique was employed to create an extensive representation of the cell clusters present in the tumor microenvironment (Fig. 1). The Loupe browser software, along with Cell Ranger data, was then employed to define the machine clustering outcomes, which indicated the identification of 13 cell clusters within the cancer tissues and 20 clusters in the para-cancerous tissues. These clusters were additionally classified into seven unique subsets for both HCC and the para-cancerous tissues: activated T cells, cancer cells, dendritic cells, Kupfer cells, TCs, vascular endothelial cells, and hepatocytes (Fig. 2A,B,H,I; Supplementary Fig. 1A). Remarkably, TCs were identified by employing 25 biomarkers derived from prior study [27] (Supplementary Table 1), and the mean frequency of TCs were initially quantified as 0.35% in the HCC tissues (Fig. 2C). The proportion of TCs and Kupfer cells was discerned to be lower in the cancer tissues compared with the para-cancerous tissues (0.35% vs 8.19%; 13.64 vs 18.89%) (Fig. 2C,J). Subsequently, the diverse heatmaps of DEGs in sub-cell populations underscored their heterogeneity in HCC (Fig. 2D–G,K–N; Supplementary Tables 2,3,4), and Uniform Manifold Approximation and Projection (UMAP) diagrams along with violin plots of the top 14 DEGs were created (Supplementary Fig. 1B,C). To elucidate the functional implications of DEGs, gene ontology and pathway enrichment analyses were conducted using the GO/KEGG browser (Supplementary Fig. 2). These analyses revealed that the DEGs were implicated in several signaling pathways including Rap1 (Rap1 orthologs from arthropods), PI3K/AKT, HIF-1 (Hypoxia inducible factor 1), ECM (Multimerin), MAPK, VEGF, and JAK/STAT. These pathways are instrumental in regulating cellular processes such as proliferation, migration, morphogenesis, and angiogenesis. The DEGs in tumor cells were linked to the cell cycle, resistance to platinum-based drugs, the p53 signaling pathway, and the Wnt signaling pathway. These pathways play roles in chromosome segregation, the regulation of the mitotic spindle, and the activity of ATP-dependent microtubule motors.
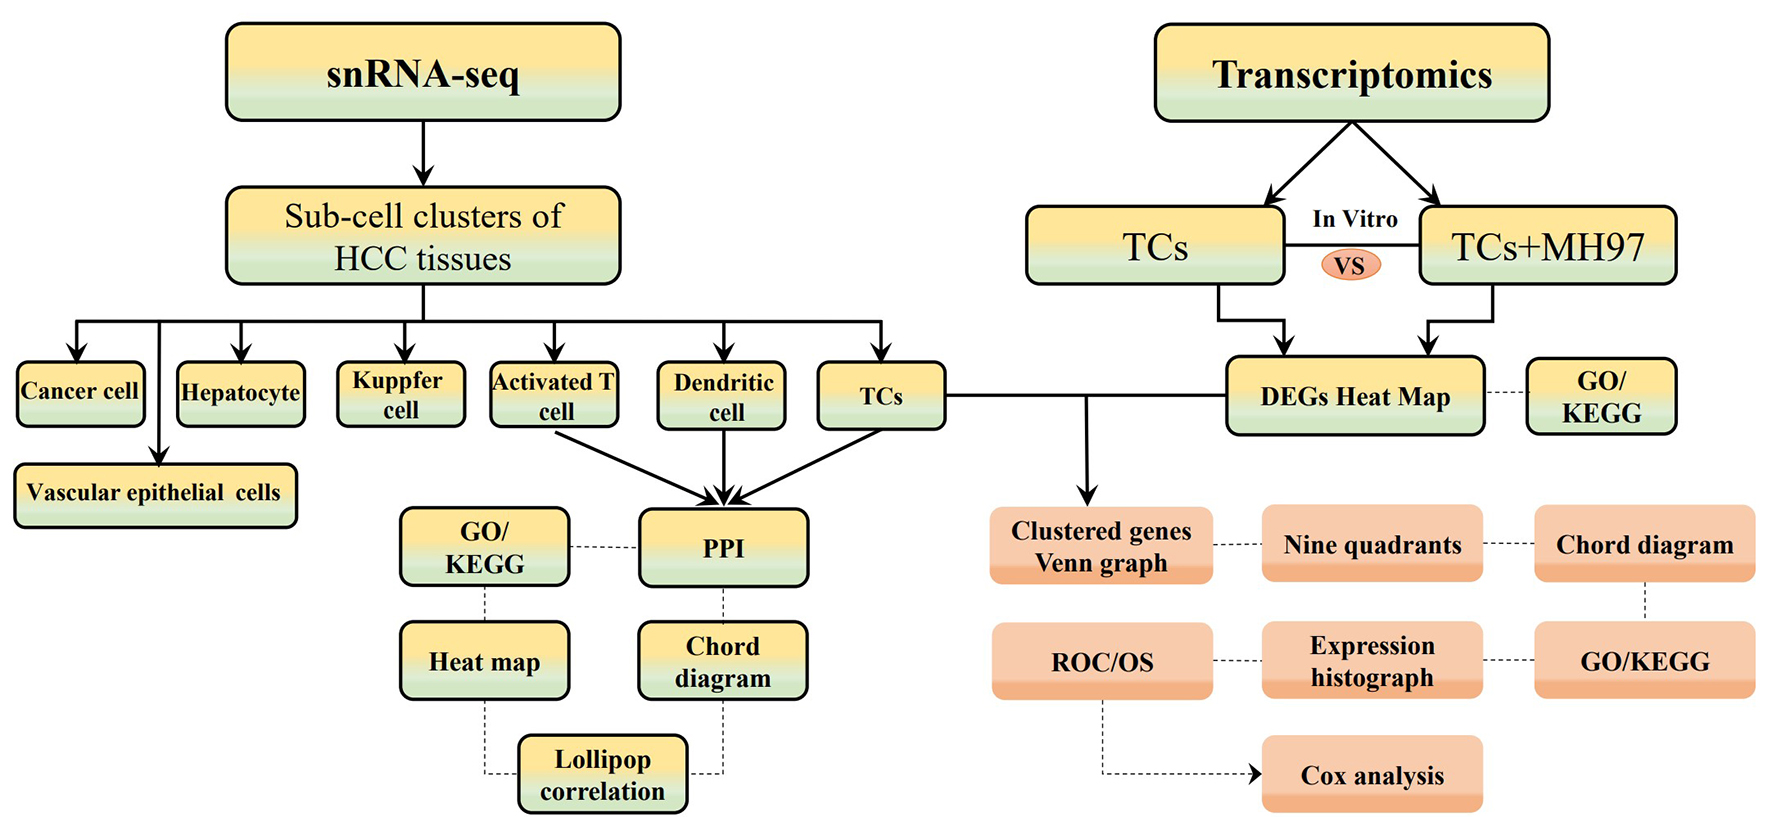
 Fig. 1.
The flow chart of materials and methods. SnRNA-seq, single nucleus RNA sequencing; HCC, hepatocellular carcinoma; TCs, telocytes; MH97, MHCC97 cells; GO/KEGG, Gene Ontology/Kyoto Encyclopedia of Genes and Genomes; PPI, protein-protein interaction; ROC, receiver operation characteristic curve; OS, overall survival.
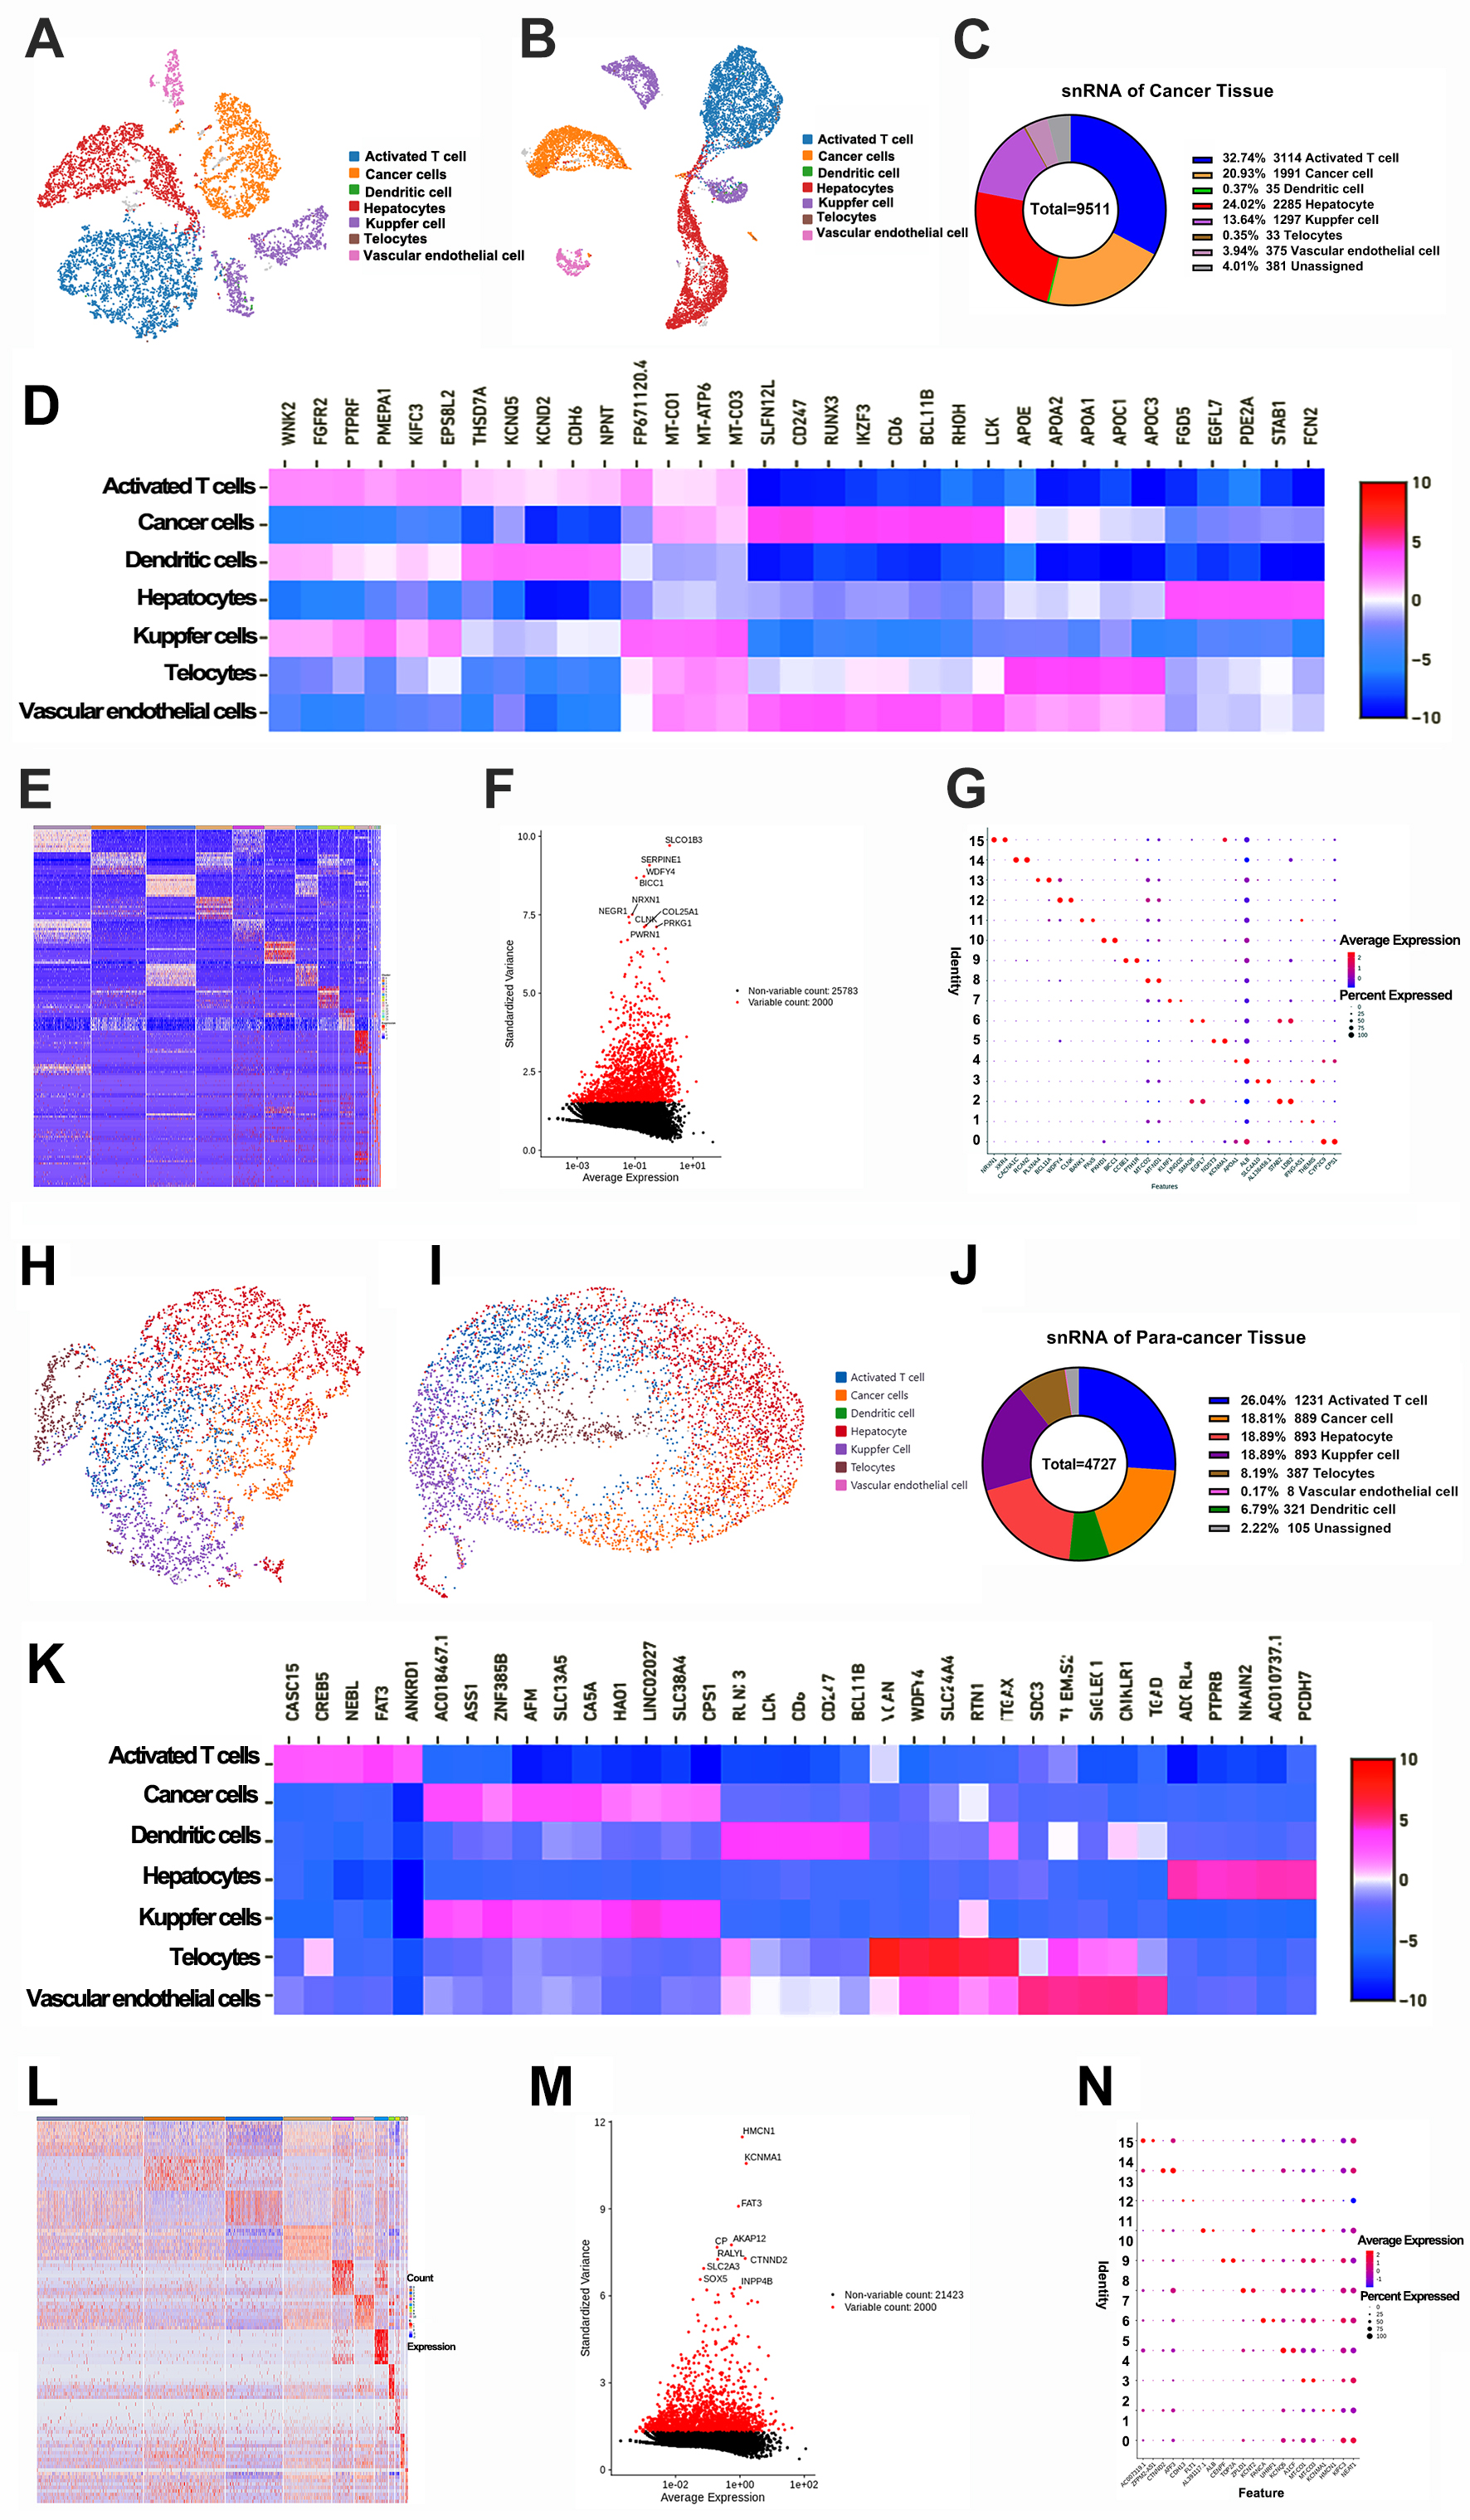 Fig. 2.
Analyses of single nucleus RNA sequencing of HCC tissues. (A,B) The UMAP and t-SNE graphs showed sub-cell clusters in HCC tissues. (C) The proportions of sub-cells in HCC tissues. (D,E) The heatmap of DEGs in different sub-cells (Top 35) with Z-scores. (F) The volcano plot of DEGs was screened. (G) The bubble diagram of parts of DEGs with average levels. (H,I) The UMAP and t-SEN graphs showed sub-cell clusters in para-cancerous tissues. (J) The proportions of sub-cells in para-cancerous tissues. (K,L) The heatmap of DEGs in different sub-cells (Top 35) with Z-scores. (M) The volcano plot of DEGs was screened. (N) The bubble diagram of parts of DEGs with average levels. DEGs, differential expressed genes.
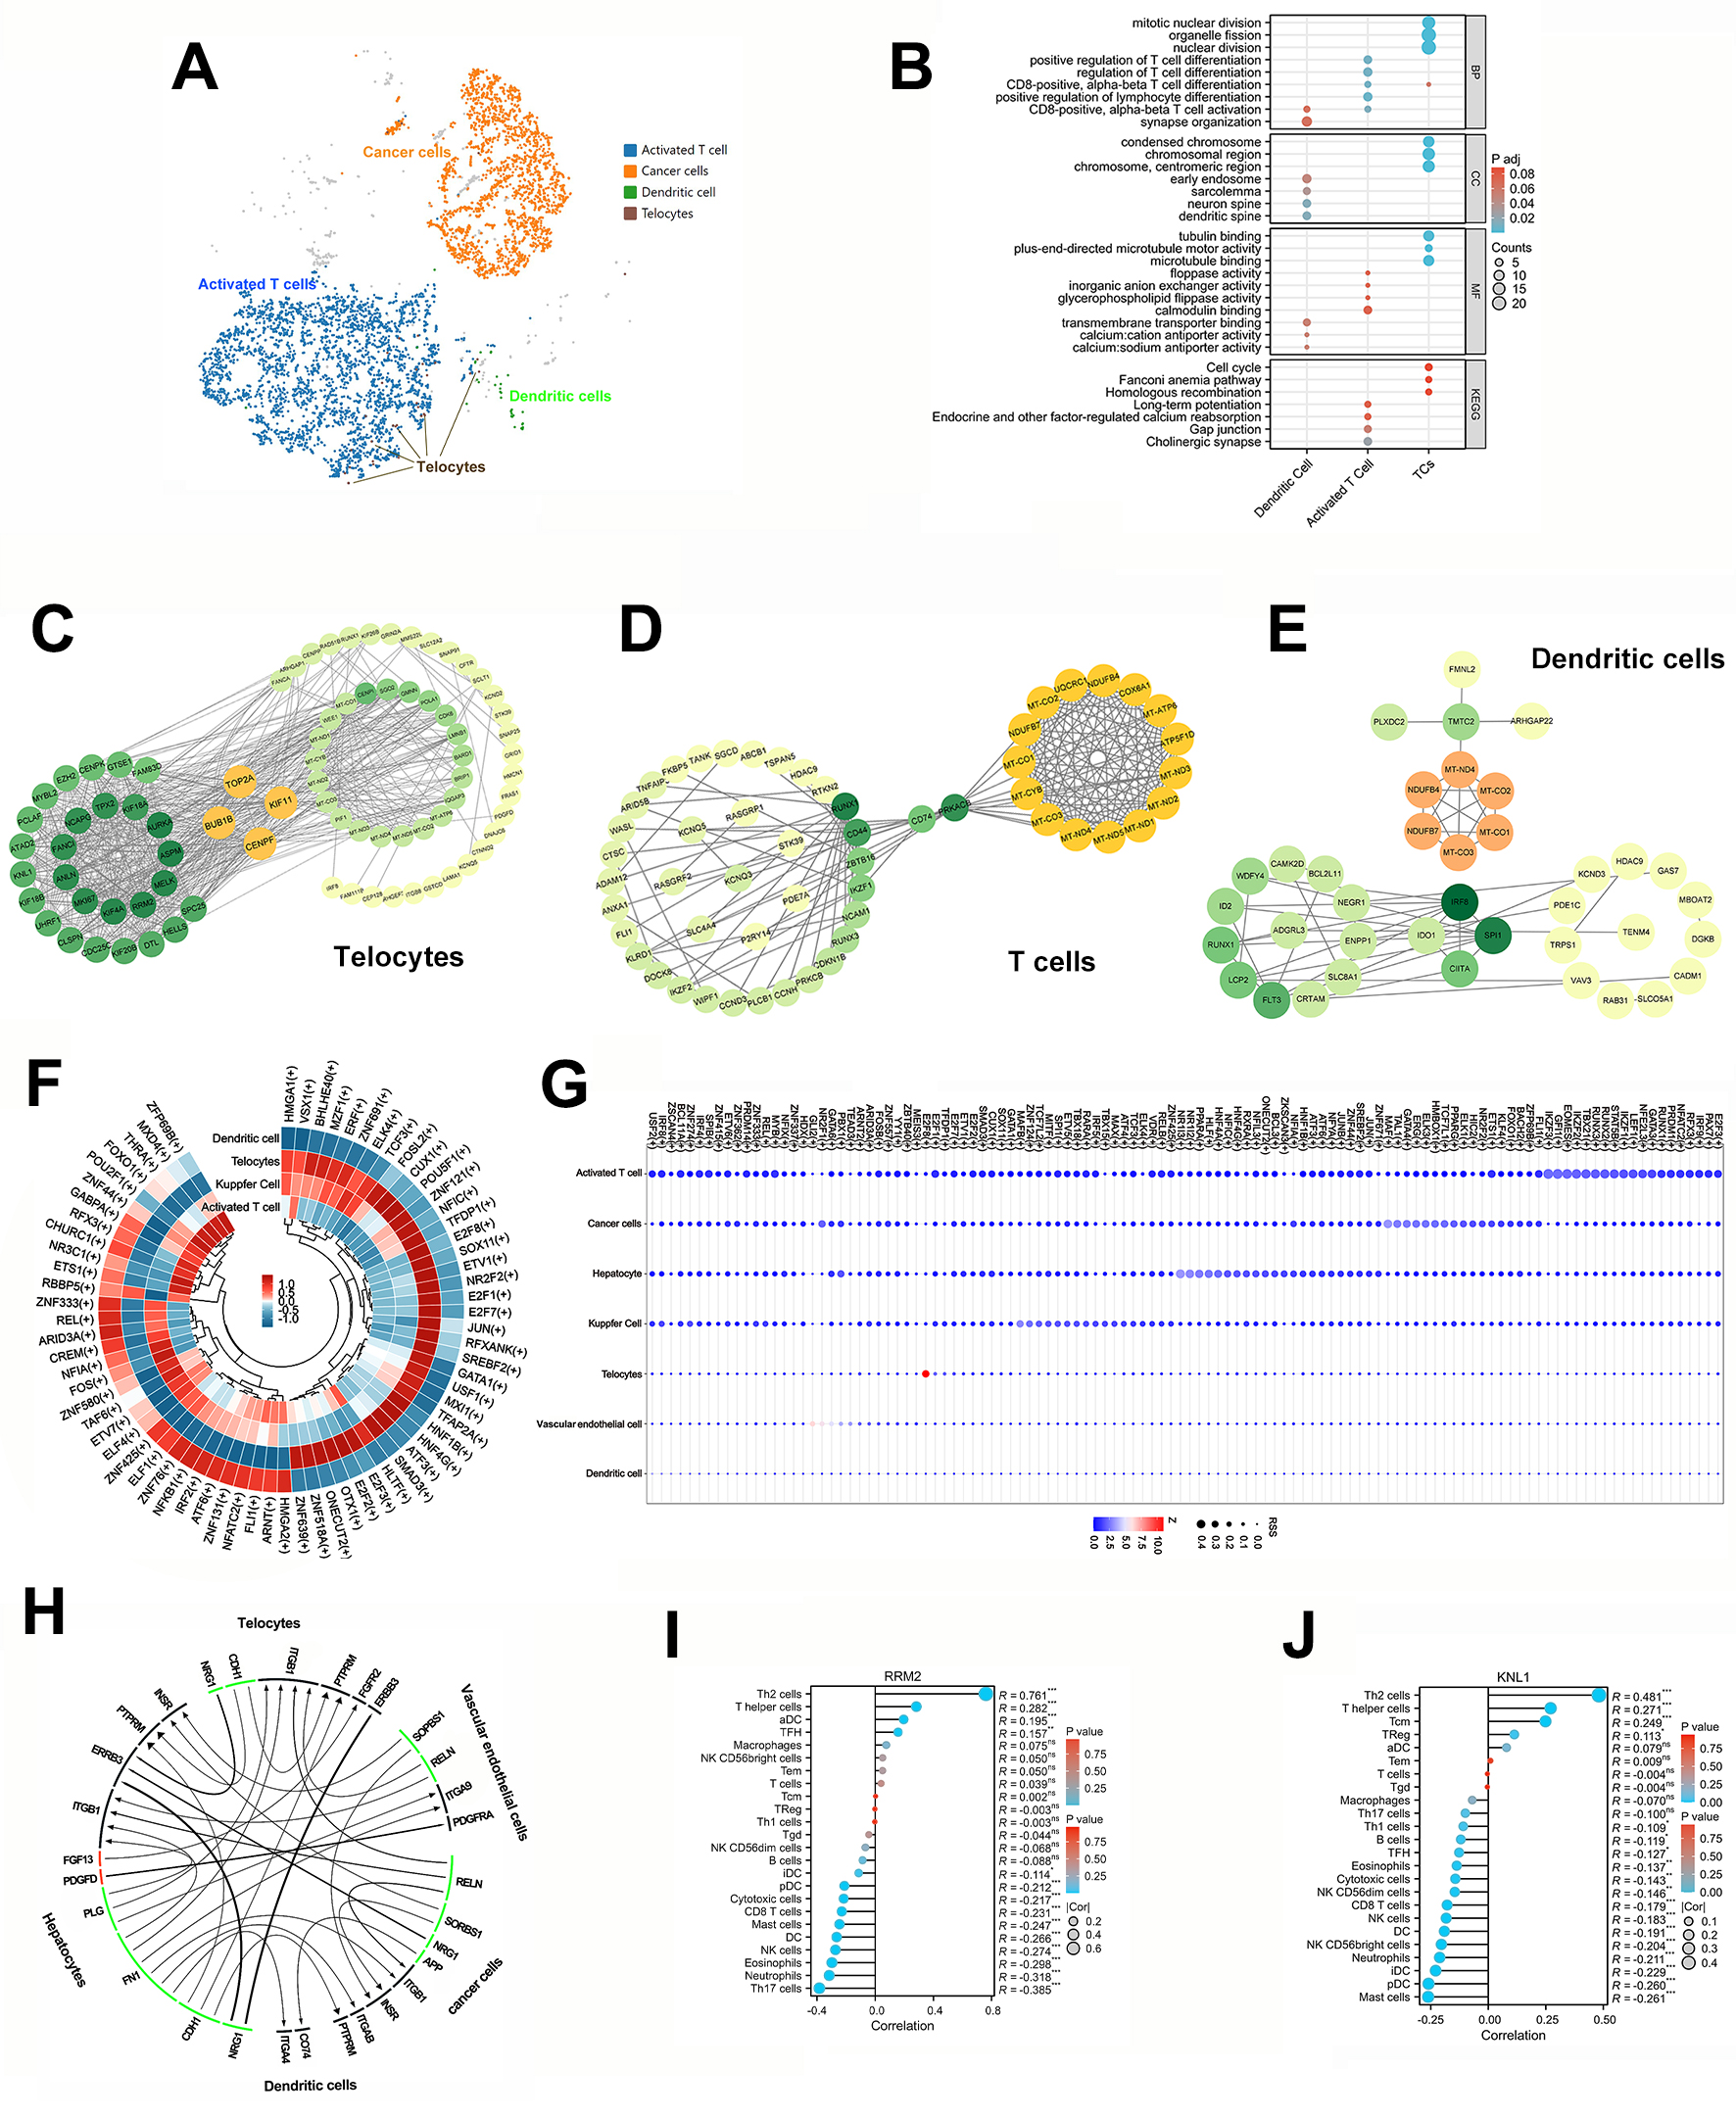
To investigate the intricate interactions between TATCs, immune cells and cancer
cells in HCC, we showcased their cluster UMAP graphs for them using the Loupe
browser. These graphs indicated that activated T cells were predominant in terms
of quantity (Fig. 3A). A comprehensive GO/KEGG analysis showed that the TATCs
were closely related with CD8+ T cell differentiation, but no
clustering information on dendritic cells’ behavior with TATCs was obtained (Fig. 3B). Moreover, TOP2A (DNA topoisomerase Ⅱ alpha), BUB1B (BUB1
mitotic checkpoint serine/threonine kinase B), KIF11 (kinesin family
member 11), and CENPF (centromere protein F) were identified as hub
genes of TCs through the use of the String website and Cytoscape software
(Spearman’s coefficient
 Fig. 3.
Bioinformatic analysis of TATCs and immune cells in HCC. (A)
The UMAP of T cells, cancer cell, dendritic cell and TCs. (B) GO/KEGG analyses of
dendritic cell, activated T cell, and TCs (https://www.kegg.jp/kegg/kegg1.html).
(C–E) The protein-protein interactions and hub gene of dendritic cell, activated
T cell, and TCs by Cytoscape software. (F) The ring heatmap of DEGs in dendritic
cell, activated T cell, Kupfer cell and TCs. (G) The bubble graph of regulons in
seven sub-cell clusters with Z-scores. (H) The correlations among sub-cell
clusters according to snRNA-seq data by iTALK and PySCENIC software. (I,J) The
correlation between TCs and immune cells with top two expression in TCs.
p
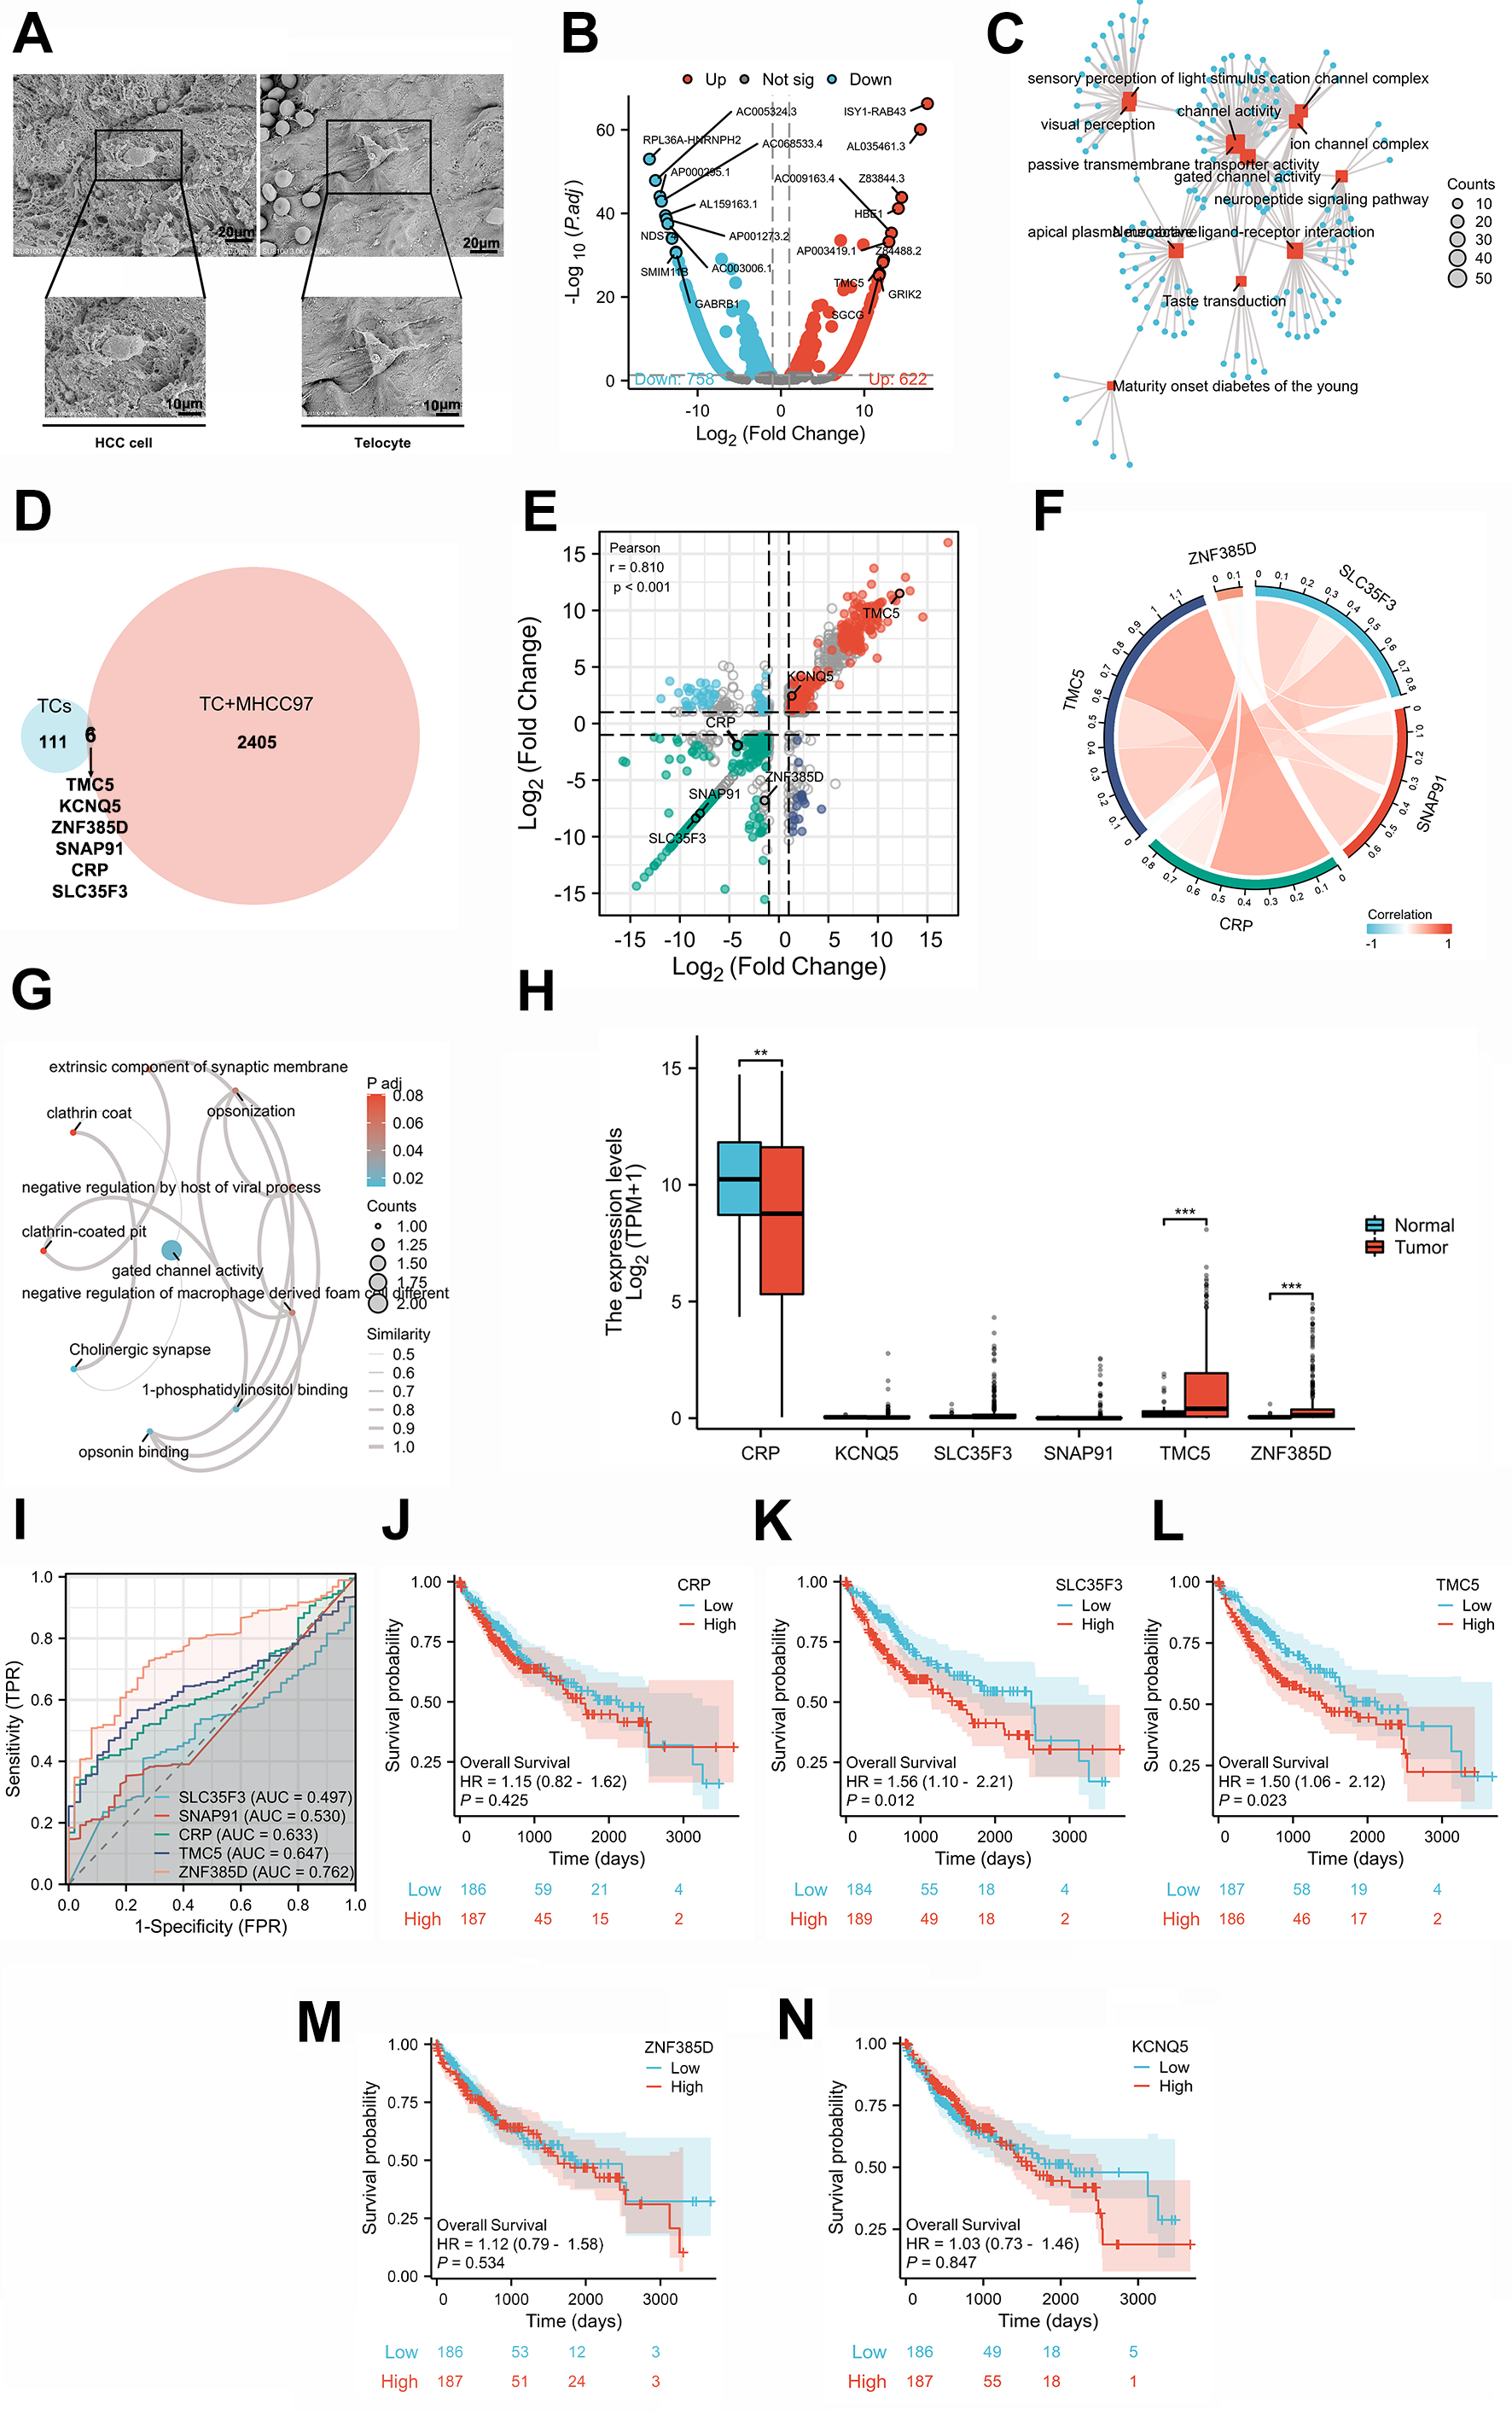
The scanning electron microscope assay, acknowledged as the optimal method for visualizing TCs in cancer tissues [14], enables the identification of the morphology of TCs and HCC cells, thereby substantiating their associative relationship (Fig. 4A). To mimic the presence of TCs in HCC, we executed in vitro experiments employing TCs and the HCC cell line. Following this, we examined the transcriptomics (mRNA) of the TCs and TATCs, uncovering that 622 genes were upregulated while 758 were downregulated in TATCs contrasted to TCs (Fig. 4B; Supplementary Table 6). Furthermore, these DEGs were subjected to a GO/KEGG network analysis, demonstrating their involvement in the mechanisms of channel activity, transmembrane transporter activity, and the sensory perception of the channel complex (Fig. 4C; Supplementary Table 7). This finding illuminates the direct influence of HCC cancer cells on the genetic modulation of TCs.
 Fig. 4.
Transcriptomic changes and clinical significance of TCs after
co-cultured with the MH97 cell line. (A) Graphs of HCC cancer cells and TCs
under the scanning electron microscope. Scale bars = 10 µm, and 20 µm. (B) The
heatmap of DEGs between TCs and TCs co-cultured with MHCC97-H cells. (C) Network
chart of DEGs by the GO/KEGG enrichment. (D) The Venn graph of TCs in HCC tissues
and TCs co-cultured MH97 cells. (E) Nine quadrants graph of TCs’ DEGs from
transcriptomic testing and snRNA-seq technology with six co-expression genes. (F)
The correlation of six co-expression genes. (G) Network chart of co-expression
genes. (H) Expression levels of co-expression genes in HCC tissues and adjacent
cancer tissues by TCGA database. (I–N) ROC curves and OS curves of co-expression
genes in HCC. **p
To identify biomarkers of TATCs in HCC, we combined snRNA-seq with transcriptomics data, focusing on the analysis of shared genes. The Venn diagram displayed six co-clustered genes derived from the raw sequencing data: TMC5 (transmembrane channel-like 5), KCNQ5 (potassium voltage-gated channel subfamily Q member 5), ZNF385D (zinc finger protein 385D), SNAP91 (synaptosome-associated protein 91), CRP (C-reactive protein), and SLC35F3 (solute carrier family 35 member F3) (Fig. 4D,E). It is worth noting that TMC5 showed a strong correlation with CRP, which is potentially involved in opsonin binding, phosphatidylinositol binding, and regulation of macrophage derived foam cell differentiation (Fig. 4F,G). Further analysis revealed that five out of these six biomarkers demonstrated significant alterations between HCC tissues and adjacent cancer tissues according to the TCGA-LIHC database: CRP was expressed at lower levels in tumors, whereas TMC5 and ZNF385D exhibited higher expression levels in tumors, while KCNQ5, SLC35F3, and SNAP91 had no divergency in either tumors or adjacent cancer tissues based on the TCGA database (Fig. 4H). However, these significant biomarkers might be deemed insufficient as diagnostic predictors due to their inadequate an AUC values (ZNF385D = 0.762; TMC5 = 0.647; Fig. 4I). Furthermore, the OS curves showed that high levels of SLC35F3 and TMC5 in HCC patients were associated with a poor prognosis, while CRP and ZNF385D had no statistical significance based on the TCGA database (Fig. 4J–N. The univariate Cox regression analyses of TMC5, CRP, SLC35F3, and ZNF385D based on detailed information showed that high TMC5 expression is significantly associated with a poor prognosis (HR = 1.499; 95% CI: 1.059–2.122; p = 0.023), as is high SLC35F3 expression (HR = 1.562; 95% CI: 1.102–2.214; p = 0.012) (Table 1). Taking together, although TMC5 and SLC35F3 were corelated with OS and considered markers of TCs, TMC5 is more suitable as a biomarker due to its bigger AUC of the ROC curve.
| Characteristics | Total (N) | Univariate analysis | ||
| Hazard ratio (95% CI) | p value | |||
| TMC5 | 373 | |||
| Low | 187 | Reference | ||
| High | 186 | 1.499 (1.059–2.122) | 0.023 | |
| CRP | 373 | |||
| Low | 186 | Reference | ||
| High | 187 | 1.151 (0.815–1.624) | 0.425 | |
| SLC35F3 | 373 | |||
| Low | 184 | Reference | ||
| High | 189 | 1.562 (1.102–2.214) | 0.012 | |
| ZNF385D | 373 | |||
| Low | 186 | Reference | ||
| High | 187 | 1.116 (0.790–1.576) | 0.534 | |
With the progress in model technologies, a variety of methods such as snRNA-seq, scRNA-seq, and transcriptomics have been widely employed to investigate the heterogeneity, tumor formation, and embryonic development of various neoplasms in humans [29]. Notably, we identified distinctions between the DEGs derived from snRNA-seq and transcriptomics data. This indicates that the intricate makeup of diverse cell types within the TME is vital for regulating HCC progression. In contrast to the traditional perspective, which emphasizes cancer cells as the primary component, our findings reveal that activated T cells and cancer cells maintain a comparable ratio within HCC tissues. Significantly, this research seeks to quantify the presence of T cells in HCC tissues via snRNA sequencing. This innovative strategy emphasizes the important role of T cells in the TME and underscores the importance of investigating TATCs in the context of HCC. Additionally, T cells engage in extensive interactions with immune cells, suggesting that they could represent a promising new target for immunotherapy in HCC.
TCs represent a specialized subgroup of interstitial cells of Cajal, exhibiting distinct biological functions and immune responses that set them apart from liver fibroblasts, vascular endothelial cells, and stellate cells. Specific biomarkers have been identified for TCs in various organs [13, 30, 31, 32, 33, 34]. In our previous research, we showed that the expression of MMP9 in TCs was regulated by HCC cells through the secretion of platelet-derived growth factor and exosome-LncRNA SNHG16 [30] to enhance the development and malignant progression of cancer cells. Consequently, we planned an in vitro study to explore the transcriptomic alterations of TATCs, which builds upon our theoretical insights into TCs.
Our research indicates that TMC5 and SLC35F3 could function as innovative biomarkers of TCs. Recent research has underscored the clinical significance of the TMC5 gene in various diseases, particularly cancer and metabolic disorders. TMC5 has been shown to perform a crucial role in modulating the tumor microenvironment and may serve as a prognostic biomarker in HCC by influencing cell proliferation and apoptosis pathways [31]. In colorectal cancer, alterations in TMC5 expression levels have been correlated with patient outcomes, indicating its potential utility in cancer diagnostics [32]. Additionally, TMC5 has been implicated in neurodegenerative diseases, where its role in cellular mechanisms related to neuroprotection and neuronal viability is vital [33]. Collectively, these studies highlight the multifunctional nature of TMC5, emphasizing its potential as a therapeutic target and biomarker in both cancerous and non-cancerous diseases, thereby paving the way for further investigations into its clinical applications. On the other hand, SLC35F3, which is part of the solute carrier family, displays a pivotal role in tumor regulation mainly by facilitating the transport of various molecules through cellular membranes. It is essential in promoting the uptake and metabolism of nutrients, such as sugars or nucleotides, helping to satisfy the increased metabolic requirements of rapidly dividing cancer cells. Furthermore, SLC35F3 potentially influences cell signaling pathways that govern cell growth, survival, and differentiation, thereby impacting pathways that are commonly dysregulated in cancer, such as growth factor signaling [34]. Although the specific functions of SLC35F3 in cancer are still under investigation, its involvement in nutrient transport, cellular signaling, modulation of the tumor microenvironment, and possibly in drug resistance underscores its importance within the complex framework of tumor biology [35, 36].
Addressing these intricate interactions opens promising avenues for therapy. Possible strategies include interfering with the supportive functions of TATCs, inhibiting immunosuppressive cytokines, and restructuring the extracellular matrix to improve immune cell infiltration. By disrupting the supportive connections between stromal and immune cells within the TME, this strategy aims to boost the effectiveness of cancer immunotherapies. Although our study broadens the understanding of HCC cell clusters and the locations of TCs, it also has certain limitations. Prognostic indicators, such as transcription factors, proto-oncogenes, and oncogenes, require further validation through additional in vivo and in vitro studies. Moreover, the confirmation of novel biomarkers for TCs in HCC necessitates the examination of a larger cohort of clinical samples.
In conclusion, we have identified TMC5 as a significant marker for TCs, detectable in both cancerous and adjacent healthy tissues via the snRNA sequence technology. This work enhances our understanding of the TME and the heterogeneity of HCC. The current absence of well-defined biological markers for TCs poses challenges in distinguishing them from other stromal cell types. Thus, there is a critical need for innovative strategies to investigate the biology of TATCs.
The raw sequence data reported in this paper have been released at https://ngdc.cncb.ac.cn/gsa-human (GSA-Human: HRA006088). The datasets used and/or analyzed during the current study are available from the corresponding author on reasonable request.
YX, as the first-corresponding author and first author, takes charge of the whole conception and writing of the article. JY, as the second-corresponding author, takes charge of formal analysis, methodology, software, writing-editing. Both authors read and approved the final manuscript. Both authors have participated sufficiently in the work and agreed to be accountable for all aspects of the work.
The study was carried out in accordance with the guidelines of the Declaration of Helsinki. The study was approved by the ethics committee of Shandong University affiliated Shandong Provincial Third Hospital and could be inquired in Medical Research Registration Information system of China (KYLL-2024044; https://www.medicalresearch.org.cn/), and the written informed consent were signed.
We would like to thank Weiwei Meng for the help in revising the English language errors in the manuscript.
Natural Science Foundation of Shandong Province (ZR2022QH066).
The authors declare no conflict of interest.
Supplementary material associated with this article can be found, in the online version, at https://doi.org/10.31083/FBL36583.
References
Publisher’s Note: IMR Press stays neutral with regard to jurisdictional claims in published maps and institutional affiliations.