


 , Haotian Qin 1,2,3,†, Fei Yu 4, Zimeng Zhou 1,2,3, Yingqi Chen 1,2,3, Peng Liu 1,2,3, Hui Zeng 1,2,3,5,*
 , Jian Weng 1,2,3,*
1 Department of Bone & Joint Surgery, Peking University Shenzhen Hospital, Shenzhen Peking University-The Hong Kong University of Science and Technology Medical Center, 518036 Shenzhen, Guangdong, China
2 National & Local Joint Engineering Research Center of Orthopaedic Biomaterials, 518036 Shenzhen, Guangdong, China
3 Shenzhen Key Laboratory of Orthopaedic Diseases and Biomaterials Research, 518036 Shenzhen, Guangdong, China
4 Department of Spine Surgery, Shenzhen Second People’s Hospital, The First Affiliated Hospital of Shenzhen University, 518035 Shenzhen, Guangdong, China
5 Department of Orthopedic Trauma, Shenzhen Second People’s Hospital, The First Affiliated Hospital of Shenzhen University, 518035 Shenzhen, Guangdong, China
†These authors contributed equally.
Abstract
Skeletal muscle atrophy is a common musculoskeletal disorder that significantly reduces patient quality of life. Long non-coding RNA (lncRNA) XLOC_015548 has been identified as a pivotal regulator of C2C12 myoblast proliferation and differentiation. However, its role in mitigating denervation-induced muscle atrophy and the underlying mechanisms remain unclear.
We employed lentiviral-mediated stable expression of XLOC_015548 in C2C12 myoblasts and skeletal muscle-specific XLOC_015548-edited mouse models to investigate the function of this lncRNA. Muscle atrophy models were established in vitro by glucocorticoid-induced atrophy with dexamethasone (DEX) and in vivo by sciatic nerve transection-induced denervation. The MEK inhibitor U0126 was used to assess the role of the growth arrest and DNA damage-inducible 45 gamma/mitogen-activated protein kinase kinase/extracellular signal-regulated kinase (Gadd45g/MEK/ERK) signaling pathway.
Overexpression of XLOC_015548 significantly activated the MEK/ERK signaling pathway (p < 0.05) by downregulating Gadd45g expression (p < 0.05) and promoting its cytoplasmic localization, thereby enhancing cell proliferation and myotube formation. Furthermore, XLOC_015548 reduced the level of reactive oxygen species (ROS) (p < 0.01), stabilized the mitochondrial membrane potential, and alleviated DEX-induced oxidative stress. These protective effects were partially reversed by U0126, confirming the involvement of the MEK/ERK pathway. Skeletal muscle-specific overexpression of XLOC_015548 in vivo significantly reduced denervation-induced muscle atrophy (q < 0.05) and increased the muscle fiber cross-sectional area.
XLOC_015548 plays a critical role in promoting myogenic differentiation and protecting against muscle atrophy by regulating Gadd45g expression, activating the MEK/ERK signaling pathway, and reducing oxidative stress. These findings underscore the therapeutic potential of XLOC_015548 in skeletal muscle atrophy, and provide a foundation for lncRNA-based treatment strategies.
Keywords
- XLOC_015548
- skeletal muscle atrophy
- myogenic differentiation
- oxidative stress
- long non-coding RNA
Skeletal muscle atrophy is a degenerative condition triggered by various physiological and pathological factors. This condition can have significant negative impacts on patient mobility and quality of life. It is characterized by an imbalance between protein synthesis and degradation in skeletal muscles, ultimately leading to declines in muscle mass and function [1]. Common physiological causes include postoperative immobilization, aging, and weightlessness, while pathological factors encompass peripheral nerve injury, stroke, inflammation, chemotherapy, cancer cachexia, and glucocorticoid treatments [2, 3, 4, 5, 6, 7]. Exercise remains the only clinically effective prevention strategy, while pharmacological approaches involving anabolic androgenic steroids (AAS), growth hormone (GH), and insulin-like growth factor-1 (IGF-1) have limited application due to severe side effects [8, 9, 10, 11, 12]. Hence, the discovery of safer and more effective therapeutic targets and strategies is urgently needed.
In recent years, long non-coding RNAs (lncRNAs) have emerged as a research hotspot due to their critical roles in regulating gene expression [13, 14, 15, 16]. Several studies have identified lncRNAs as therapeutic targets in muscle atrophy, thus highlighting their importance in skeletal muscle differentiation and regeneration. In 2017, d’Ydewalle et al. [17] first reported that Lnc-SMN-AS1 alleviates muscle atrophy in a C57BL/6 mouse model of spinal muscular atrophy via the PRC2/SMN axis. Zhang et al. [18] identified Lnc-MAR1, a miR-487b sponge, through microarray analysis of aged and mechanical unloading-induced atrophic muscles, demonstrating its role in promoting skeletal muscle differentiation and regeneration. Similarly, Alessio et al. [19] reported a protective role for Lnc-Pvt1 in denervation-induced atrophy and amyotrophic lateral sclerosis (ALS) models via regulation of the c-Myc/Bcl-2 signaling axis. In a 2011 study of Duchenne muscular dystrophy (DMD) using Mdx mice, Cesana et al. [13] identified Linc-MD1, which was found to promote myogenic differentiation. Another study identified Lnc-31, which interacts with Rock1 mRNA and facilitates myoblast proliferation and differentiation via YB-1-dependent translation to mitigate muscle atrophy [20]. In addition to murine models, a study in chickens have identified muscle atrophy-associated lncRNAs such as LncIRS1 that regulate muscle development [21].
Gene knock-out and knock-in technologies further expand the potential applications of lncRNAs for the treatment of muscle atrophy [22, 23, 24, 25, 26]. Using the C57BL/6J mouse model, Yu et al. [27] demonstrated in 2017 that Linc-RAM enhances myogenic differentiation via MyoD interaction, and that its knock-out impairs satellite cell differentiation and muscle regeneration. In the same year, Chen et al. [28] found that Malat1 promotes skeletal muscle differentiation by regulating MyoD transcriptional activity in Malat1-KO mice. Additionally, Geng et al. [29] reported that H19 enhances insulin sensitivity by targeting AMPK, a function that was validated in H19-KO mice. Jin et al. [30] further elucidated the role of Lnc-SYISL in regulating myogenesis via PRC2 interactions, with knock-out mice showing increased muscle fiber density and mass. Chen et al. [31] used FoxM1 conditional knock-out mice to investigate the role of the FoxM1-Lnc-Snhg8/Gm26917 axis in satellite cell proliferation and survival. A unique knock-in mouse model developed by Zhang et al. in 2018 [32] demonstrated that lncMUMA reverses hindlimb suspension-induced atrophy by targeting miR-762 and hence significantly improving muscle mass and function. Despite these promising findings, the functional mechanisms involving lncRNAs in muscle atrophy remain underexplored, thereby limiting possible clinical translation.
Our preliminary RNA-seq analysis of denervation-induced gastrocnemius atrophy revealed significant downregulation of XLOC_015548 and a negative correlation with Growth arrest and DNA damage-inducible protein 45 gamma (Gadd45g) [33, 34, 35]. The Gadd45 family of proteins are crucial in regulating the cell cycle, DNA repair, and apoptosis [36, 37, 38]. Several studies have demonstrated their involvement in muscle differentiation and atrophy [39, 40]. Additionally, Gadd45 proteins activate the mitogen-activated protein kinase (MAPK) pathway to promote myogenic differentiation [41], with extracellular signal-regulated kinase (ERK) signaling playing a central role in maintaining muscle mass and differentiation [42, 43, 44, 45]. However, the role of XLOC_015548 in regulating the Gadd45g/mitogen-activated protein kinase/extracellular signal-regulated kinase (MEK/ERK) signaling pathway during muscle atrophy remains unexplored. This represents a significant gap in our understanding of the molecular mechanisms and therapeutic potential of lncRNAs in the context of muscle atrophy.
To address this, we systematically analyzed the protective role of XLOC_015548 in myogenic differentiation and muscle atrophy using both in vitro and in vivo models. For the first time, we employed skeletal muscle-specific conditional knock-out and overexpression models to investigate the therapeutic potential of XLOC_015548 and to elucidate the functional mechanisms involving Gadd45g/MEK/ERK signaling and redox homeostasis. Our findings provide essential background knowledge for the development of lncRNA-based therapies that target muscle atrophy.
C2C12 myoblasts (Cat# ZQ0092, Zhong Qiao Xin Zhou Biotechnology, Shanghai, China) were cultured in high-glucose DMEM (Cat# 610502, Biopico, San Diego, CA, USA) supplemented with 10% fetal bovine serum (Cat# 086-150, Wisent, Saint-Jean-Baptiste, QC, Canada). All cell lines were authenticated by short tandem repeat (STR) profiling and tested negative for mycoplasma contamination prior to use. Cells were maintained at 37 °C in a humidified incubator with 5% CO₂ until they reached approximately 80% confluence. The culture medium was then replaced with differentiation medium comprising high-glucose DMEM and 2% horse serum (Cat# 16050130, Gibco, Grand Island, NY, USA), with media changes every 24 h. Overexpression or knock-down of XLOC_015548 was achieved via lentiviral vectors targeting mouse LncRNA XLOC_015548 (Hanbio, Shanghai, China). The full-length transcript for overexpression was cloned into the pHBLV-CMV-MCS-EF1-puro lentiviral vector under the control of the CMV promoter for constitutive expression. The shRNA sequence for XLOC_015548 knock-down (sense strand: 5′-GATCCGCAGGGAGCTGTTGTCACCTTTGAAACTCGAGTTTCAAAGGTGACAACAGCTCCCTGTTTTTTG-3′; antisense strand: 5′-AATTCAAAAAACAGGGAGCTGTTGTCACCTTTGAAACTCGAGTTTCAAAGGTGACAACAGCTCCCTGCG-3′) was subcloned into the pHBLV-U6-MCS-PGK-PURO interference vector (Hanbio, Shanghai, China). Overexpression of full-length Gadd45g was achieved using the PCDH-CMV-EF1-Puro lentiviral vector (ShuTong Biotech, Shanghai, China). In dual lentiviral infection experiments, C2C12 cells were subjected to four distinct conditions: the control cohort was co-infected with lentiviruses carrying the XLOC overexpression control (OE-Ctrl) and the Gadd45g overexpression control (OE-Ctrl); single-gene overexpression was achieved by infecting cells with OE-XLOC_015548 in combination with the Gadd45g OE-Ctrl; dual-gene co-overexpression involved simultaneous infection with OE-XLOC_015548 (MOI = 20) and OE-Gadd45g (MOI = 10); and for mechanistic validation, cells dually infected with OE-XLOC_015548 and OE-Gadd45g were treated with 10 µM MEK inhibitor U0126 for 48 hours prior to analysis. Stable cell lines were established through selection with 2 µg/mL puromycin (Cat# A1113803, Thermo Fisher Scientific, Waltham, MA, USA), following lentiviral transduction, which was enhanced using 8 µg/mL polybrene (Cat# TR-1003, Sigma-Aldrich, St. Louis, MO, USA). Infection efficiency was confirmed via real-time RT-PCR and Western blotting. For inhibitor experiments, the MEK inhibitor U0126 (Cat# U0126-EtO, Selleck, Shanghai, China) was dissolved in DMSO to prepare a 10 mM stock solution, then diluted in medium to a final concentration of 10 µM. The cells were treated with U0126 for 48 h prior to analysis. In therapeutic experiments involving XLOC_015548, the control and Dexamethasone (DEX) groups used OE-Ctrl lentiviral cell lines, while the DEX+OE-XLOC and DEX+OE-XLOC+U0126 groups used OE-XLOC cell lines. DEX and treatment groups were cultured in differentiation medium containing 10 µM dexamethasone (Dex, Cat# ST1254, Beyotime, Shanghai, China) or 10 µM U0126, while the control group was cultured in medium containing equivalent volumes of ethanol and DMSO.
Fluorescence in situ hybridization (FISH) was performed using biotin-labeled RNA probes specifically targeting XLOC_015548 mRNA. The probe sequence (5′-GCTTCTTAATCTTCTGCTTAGGTGATGTATCCAGGATGGACCAATGGTACCCAAGGGATCAACTCTGCAAACAATCAGGTGGGCAGCGTCTTGTCATTATGGACCATGCTTTAAACTTTCTCAT-3′) was synthesized and biotin-labeled by SaiCheng Biotech (Guangzhou, China). Hybridization was conducted at 42 °C for 2 h, followed by washes with 5X SSC and 1X SSC at room temperature. Fluorescent detection was performed with a Leica STELLARIS 5 laser scanning confocal microscope (Leica, Wetzlar, Germany). DAPI (Cat# D9542, Sigma, St. Louis, MO, USA) was used for nuclear staining (blue, Ex/Em = 405/420–566 nm), while FISH signals for XLOC_015548 were visualized as red fluorescence (Ex/Em = 561/566–716 nm). Three-dimensional (3D) imaging was captured over a 20 µm range, and 10 consecutive 2 µm slices were compiled into a composite 3D image. Co-localization analysis was performed using the Co-localization Finder plugin (version 1.8) in ImageJ (version 1.53k, National Institutes of Health, Bethesda, MD, USA). Three rounds of gating were performed for different groups, with consistent gating strategies across groups to obtain Pearson’s correlation coefficients for co-localized signals. In scatter plots and fluorescence merge images, co-localized signals from each replicate were marked in red, green, and blue, respectively. Further analysis was conducted using the Plot Profile function in ImageJ to examine pixel intensity distribution along characteristic lines, enabling the evaluation of FISH signal localization and intensity relative to DAPI staining.
During differentiation, images of myotubes were captured on days 1, 3, 5, and 7 using confocal immunofluorescence microscopy (STELLARIS 5, Leica, Wetzlar, Germany) and phase-contrast microscopy (AXIO Observer 3, Carl Zeiss, Oberkochen, Germany). The average myotube width was calculated from randomly selected fields within each group of cells. To ensure representative data, at least five fields per sample were analyzed to capture variations across the sample and minimize potential bias.
Cell cycle analysis was performed using the DNA Content Quantitation Assay Kit
(Cell Cycle) (Cat# CA1510, Solarbio, Wuhan, China). After treatment, cells were
collected, washed once with PBS (Cat# G4202, Servicebio, Wuhan, China), and centrifuged at 1500 rpm for 5 minutes. The
cell concentration was adjusted to 1
Apoptosis was detected using an APC Annexin V Apoptosis Detection Kit with Propidium Iodide (PI)
(Cat# 640932, BioLegend, San Diego, CA, USA). Cells were washed twice with cell
staining buffer (Cat# 420201, BioLegend), resuspended in Annexin V binding
buffer (Cat# 422201, BioLegend) at a concentration of 0.25–1.0
Total RNA was extracted from C2C12 cells using TRIzol reagent (Cat# R0016, Beyotime, Shanghai, China) following the manufacturer’s protocol. RNA integrity and concentration were assessed using a NanoDrop Spectrophotometer (Thermo Fisher Scientific, Waltham, MA, USA). cDNA synthesis was performed using the PrimeScript RT reagent kit with gDNA Eraser (Cat# RR047A, TaKaRa, Shiga, Japan). Quantitative real-time PCR (qPCR) was conducted using the TB Green Premix DimerEraser (Cat# RR091A, TaKaRa, Kyoto, Japan) on a LightCycler 480 qPCR system (Roche, Basel, Switzerland). Gene expression was normalized to GAPDH, and relative expression levels were calculated using the 2-ΔΔCt method. Primer sequences used were: XLOC_015548: Forward, 5′-CCTCAGCAGACCCTGACTGTAG-3′; Reverse, 5′-CAGTGGCTGTCTTAGTCCATCTCA-3′. For GAPDH: Forward, 5′-AGGTCGGTGTGAACGGATTTG-3′; Reverse, 5′-TGTAGACCATGTAGTTGAGGTCA-3′. The 20 µL qPCR reaction included 2 µL diluted cDNA, 10 µL TB Green Premix DimerEraser, 0.4 µL of each primer (10 µM), and 7.2 µL nuclease-free water. Reactions were conducted as follows: 95 °C for 30 seconds (initial denaturation), followed by 40 cycles of 95 °C for 5 seconds (denaturation) and 60 °C for 34 seconds (annealing/extension). All reactions were performed in triplicate.
Proteins were extracted using RIPA lysis buffer (Cat# P0013B, Beyotime, Shanghai, China) supplemented with protease and phosphatase inhibitors (Cat# P1045, Beyotime, Shanghai, China). Protein concentrations were determined using a BCA Protein Assay Kit (Cat# P0398S, Beyotime, Shanghai, China). Equal amounts of protein were mixed with 6X SDS-PAGE sample loading buffer (Cat# P0015F, Beyotime, Shanghai, China) and separated via 10% SDS-PAGE (Cat# WB2102, Biotyscience, Shanghai, China). Proteins were transferred onto PVDF membranes (Cat# 0000191584, Millipore, Burlington, MA, USA) using a BIO-RAD wet transfer system. Membranes were blocked with QuickBlock™ Blocking Buffer (Cat# P0240, Beyotime, Shanghai, China) for 1 h at room temperature and then incubated overnight at 4 °C with the following primary antibodies: GADD45g (Cat# FNab03295, 1:500, FineTest, Wuhan, China); Phospho-MEK1/2 (Ser218/Ser222) (Cat#bsm-52176R, 1:500, Bioss, Beijing, China); MEK1 + MEK2 (Cat# ab178876, 1:20,000, Abcam, Cambridge, UK); Phospho-ERK1/2 (Thr202/Tyr204) (Cat# bs-3016R, 1:2000, Bioss, Beijing, China); ERK1 + ERK2 (Cat# bs-0022R, 1:1000, Bioss, Beijing, China); Myosin Heavy Chain (MHC) (Cat# MF20, 1:500, DSHB, Iowa City, IA, USA); Anti-iNOS Rabbit pAb (Cat# GB115703, 1:1000, Servicebio, Wuhan, China); Beta-tubulin (Cat# GB11017, 1:2000, Servicebio, Wuhan, China); Lamin B1 Antibody (Cat# FNab04682, 1:1000, Wuhan, China). Blots were washed with TBST and incubated with HRP-conjugated goat anti-rabbit IgG (Cat# GB23303, 1:10,000, Servicebio, Wuhan, China) or goat anti-mouse IgG (Cat# GB23301, 1:10,000, Servicebio, Wuhan, China) at room temperature for 1 h. Chemiluminescent detection was performed using the BeyoECL Moon Kit (Cat# P0018FM, Beyotime, Shanghai, China). Band intensities were quantified using ImageJ and normalized to beta-tubulin.
To investigate the regulatory effect of XLOC_015548 on the subcellular
localization of Gadd45g, we employed nuclear-cytoplasmic fractionation combined
with Western blotting for quantitative analysis. Nuclear and cytoplasmic proteins
were extracted from C2C12 cells using a nuclear-cytoplasmic extraction kit (Cat#
P0097, Beyotime, Shanghai, China). First, the mock-virus groups were verified to
have no interference effect, with the following groupings: Untransfected group
(Untransfected): normal cultured C2C12 cells; Mock-KD group: transfected with
pHBLV-U6 empty vector (KD-NC); Mock-OE group: transfected with pHBLV-CMV empty
vector (OE-Ctrl).To investigate the effect of XLOC_015548 on the
subcellular localization of Gadd45g, the cell groups were as follows: Control
group (Mock-KD, KD-NC): transfected with pHBLV-U6 empty vector (KD-NC);
XLOC_015548 knockdown group (KD-XLOC) and overexpression group
(OE-XLOC). Each group was performed in triplicate biological repeats.Western blot
analysis was performed, and nuclear Gadd45g was normalized to Lamin B1,
cytoplasmic Gadd45g was normalized to
Cells were cultured on glass-bottom culture dishes (Cat#801001, NEST, Wuxi, China) until they adhered and proliferated normally. At the designated time points, cells were fixed with cell fixation solution (Cat# P0098, Beyotime, Shanghai, China) and washed three times with wash buffer (Cat# P0106, Beyotime, Shanghai, China) for 5 minutes each. Cells were permeabilized with permeabilization buffer (Cat# P0097, Beyotime, Shanghai, China) for 40 minutes and blocked with blocking solution (Cat# P0102, Beyotime, Shanghai, China) for 100 minutes to minimize nonspecific binding. Primary antibodies were diluted in primary antibody dilution buffer (Cat# P0103, Beyotime, Shanghai, China) and included rabbit anti-phospho-MEK1/2 (Ser218 + Ser222) (bsm-52176R, 1:100, Bioss, Beijing, China), rabbit anti-phospho-ERK1/2 (Thr202 + Tyr204) (Cat# bs-3016R, 1:100, Bioss, Beijing, China), rabbit anti-GADD45G (Cat# bs-7069R, 1:200, Bioss, Beijing, China), myosin heavy chain, sarcomere (MHC) (Cat# MF 20, 1:150, DSHB, Iowa City, IA, USA), MyoD (Cat# sc-71629, 1:50, Santa Cruz Biotechnology, Dallas, TX, USA), MYOD1 polyclonal antibody (Cat# 18943-1-AP, 1:150, Proteintech, Rosemont, IL, USA), and Mki67 rabbit polyclonal antibody (Cat# A25399, 1:150, ABclonal, Woburn, MA, USA). After overnight incubation at 4 °C with gentle shaking, the primary antibodies were recovered and the cells washed three times with wash buffer for 5 minutes each. Secondary antibodies, including Alexa Fluor® 647-conjugated goat anti-mouse IgG H&L (Cat# ab150115, 1:400, Abcam, Cambridge, UK) and Alexa Fluor® 488-conjugated goat anti-rabbit IgG H&L (Cat# ab150077, 1:400, Abcam, Cambridge, UK) were diluted in secondary antibody dilution buffer (Cat# P0108, Beyotime, Shanghai, China) and added to the samples. After 1 h incubation at room temperature, the secondary antibodies were recovered and the cells washed three times. Actin-Tracker Red-Rhodamine (Cat# C2207S, 1:2000, Beyotime, Shanghai, China) was then added for F-actin staining. Finally, after three washes with wash buffer, cells were mounted using anti-fluorescence quenching mounting medium with DAPI (Cat# P0131, Beyotime, Shanghai, China). Fluorescence detection was performed with a laser scanning confocal microscope (Leica, STELLARIS 5, Germany). DAPI staining was used to label nuclei in blue fluorescence (Ex/Em = 405/493–558 nm). P-MEK1/2, P-ERK1/2, GADD45G, Ki-67, and MYOD1 were labeled with rabbit primary antibodies and detected with green fluorescence (Ex/Em = 488/493–558 nm). F-actin, representing the structural remodeling of the cytoskeleton during C2C12 differentiation, was labeled in yellow fluorescence (Ex/Em = 561/566–643 nm). MHC and MyoD were detected with mouse primary antibodies and labeled with red fluorescence (Ex/Em = 638/644–818 nm). Co-localization analysis was conducted using the Co-localization Finder plugin (version 1.8) in ImageJ. Three rounds of gating were performed to obtain three Pearson correlation coefficients for co-localized signals. These coefficients were visualized in scatter plots and fluorescence dual-color merge images, with the co-localized signals from the three replicates marked in red, green, and blue, respectively.
TUNEL staining combined with dual immunofluorescence for Gadd45g and muscle markers (Myog or MHC) was performed to assess the expression level of Gadd45g during myotube maturation. Cells cultured on glass-bottom dishes were fixed with cell fixation solution (Cat# P0098, Beyotime, Shanghai, China) and washed twice with wash buffer for 5 minutes each. They were then permeabilized with permeabilization buffer (Cat# P0097, Beyotime, Shanghai, China) for 5 minutes and washed twice. A TUNEL reaction mixture (5 µL TdT enzyme + 45 µL fluorescent labeling solution) was prepared using the One-Step TUNEL Cell Apoptosis Detection Kit (Cat# KGA1408-50, KeyGEN, Nanjing, China) and incubated at 37 °C for 60 minutes in the dark. After TUNEL staining, cells were washed three times with PBS for 5 minutes each. Primary antibodies were diluted in primary antibody dilution buffer and two staining schemes were used: Scheme 1 with rabbit anti-GADD45G (Cat# bs-7069R, 1:200, Bioss, Beijing, China) and mouse anti-Myogenin (Cat# ab1835, 1:800, Abcam, Cambridge, UK), and Scheme 2 with rabbit anti-GADD45G and mouse anti-MHC (Cat# MF 20, 1:150, DSHB, Iowa City, IA, USA). After overnight incubation at 4 °C, cells were washed and stained with secondary antibodies (Alexa Fluor® 647 and Alexa Fluor® 488) for 1 h at room temperature. Finally, cells were washed and mounted with DAPI-containing mounting medium. Fluorescent signals were visualized with a confocal microscope (Leica, Germany). TUNEL-positive cells were marked as yellow (Ex/Em = 561/566–643 nm), Gadd45g as green (Ex/Em = 488/494–588 nm), and the markers Myogenin and MHC as red (Ex/Em = 638/643–817 nm).
Giemsa staining was used to observe myotube morphology. Cells cultured on glass-bottom dishes were fixed with methanol for 5 minutes at room temperature. A working solution was prepared by mixing 1 mL Giemsa concentrate with 9 mL Giemsa diluent (Cat# CU0001, Solarbio, Wuhan, China). The working solution was applied to cover the cells for 30 minutes at room temperature. After staining, cells were gently rinsed with distilled water to remove excess stain and then observed under an inverted light microscope (DMi8, Leica, Germany).
Cellular senescence was assessed using the Senescence
Cell proliferation was analyzed using the BeyoClick™ EdU-488 Cell Proliferation Assay Kit (Cat# C0078S, Beyotime, Shanghai, China). Cells were cultured on glass-bottom culture dishes (Cat# 801001, NEST, Wuxi, China) until fully adhered and proliferating. At the designated time points, 500 µL of 20 µM EdU working solution prewarmed to 37 °C was added to each well and incubated for 5 h to label proliferating cells. After incubation, the medium was discarded and cells were fixed with 1 mL of fixation solution (Cat# P0098, Beyotime, Shanghai, China) for 15 minutes at room temperature. Cells were then washed three times with 1 mL of wash buffer for 5 minutes each. Permeabilization was performed with 1 mL of strong permeabilization solution (Cat# P0097, Beyotime, Shanghai, China) at room temperature for 20 minutes, followed by three additional washes. Staining solution (1 µL Azide 488 + 20 µL CuSO₄ + 50 µL Click Additive Solution + 430 µL Click Reaction Buffer) prepared according to the manufacturer’s protocol was added to each well (500 µL per well) and incubated at room temperature in the dark for 30 minutes. After staining, the solution was removed and the cells washed three times with wash buffer, mounted with DAPI-containing antifade mounting medium (Cat# P0131, Beyotime, Shanghai, China), and observed using a laser scanning confocal microscope (STELLARIS 5, Leica, Wetzlar, Germany). Fluorescence signals were detected as blue for DAPI (Ex/Detectors = 405/420–503 nm) and green for EdU-positive nuclei (Ex/Em = 488/503–709 nm).
Intracellular ROS levels were detected using the Reactive Oxygen Species Assay Kit (Cat# C13000-2, Applygen, Beijing, China). C2C12 cells were cultured on glass-bottom dishes (Cat# 801001, NEST, Wuxi, China). After removing the medium, 500 µL of serum-free DMEM containing 10 µM dihydroethidium (DHE) probe was added and the cells were incubated at 37 °C for 60 minutes. They were then washed thoroughly with serum-free medium to remove excess probe, and Hoechst 33342 live-cell staining solution (Cat# C1027, Beyotime, Shanghai, China) was applied for 30 minutes, followed by three PBS washes. Fluorescence signals were observed using a laser scanning confocal microscope (STELLARIS 5, Leica, Wetzlar, Germany). Hoechst 33342 emitted blue fluorescence (Ex/Detectors = 405/420–566 nm), while oxidized DHE resulting from intracellular ROS activity emitted bright red fluorescence (Ex/Em = 561/566–716 nm).
Lipid peroxidation was assessed using the Lipid Peroxidation Probe BDP 581/591 C11 (Cat#L267, Tocris, Tokyo, Japan). C2C12 cells were cultured on glass-bottom dishes (Cat# 801001, NEST, Wuxi, China) until fully adhered. After removing the medium, cells were washed three times with serum-free DMEM and incubated with 500 µL of BDP 581/591 C11 working solution for 30 minutes at 37 °C in a 5% CO₂ incubator. Cells were washed three times with serum-free medium and then stained for 30 minutes with Hoechst 33342 live-cell staining solution (Cat#C1027, Beyotime, Shanghai, China). After three washes with PBS, fluorescence was detected with a laser scanning confocal microscope (STELLARIS 5, Leica, Wetzlar, Germany). Lipid peroxidation-associated radicals converted the probe’s fluorescence to green (Ex/Em = 488/493–553 nm), while unreacted probe emitted red fluorescence (Ex/Em = 561/566–712 nm).
Mitochondrial membrane potential (MMP) was assessed using the Rhodamine 123-based MMP Assay Kit (Cat# C2008S, Beyotime, Shanghai, China). C2C12 cells were cultured on glass-bottom dishes (Cat# 801001, NEST, Wuxi, China). After removing the medium, cells were washed three times with serum-free DMEM. Subsequently, 500 µL of Rhodamine 123 staining working solution (0.5 µL Rhodamine 123 + 500 µL detection buffer) was added and the cells were incubated at 37 °C for 60 minutes. After staining, cells were washed three times with prewarmed DMEM and stained with Hoechst 33342 (Cat# C1027, Beyotime, Shanghai, China) for 30 minutes. Cells were then washed three times with PBS and fluorescence detected with a laser scanning confocal microscope (STELLARIS 5, Leica, Wetzlar, Germany). Hoechst 33342 emitted blue fluorescence (Ex/Detectors = 405/420–503 nm), and Rhodamine 123 emitted green fluorescence dependent on the MMP (Ex/Detectors = 488/503–709 nm).
Cell viability and cytotoxicity were evaluated using the Calcein/PI Cell
Viability and Cytotoxicity Assay Kit (Cat# C2015, Beyotime, Shanghai, China).
Both adherent and trypsinized cells were assessed. For adherent cells, C2C12
cells were cultured on glass-bottom dishes (Cat# 801001, NEST, Wuxi, China)
until fully adhered. After removing the medium, 500 µL of Calcein
AM/PI working solution was added and the cells incubated at 37 °C in the
dark for 30 minutes. After three washes with prewarmed PBS, fluorescence was
observed with a laser scanning confocal microscope (STELLARIS 5, Leica, Wetzlar,
Germany). For trypsinized cells, the cells were first detached using trypsin,
centrifuged at 250–1000
XLOC_015548 is located on chromosome 16 and spans the region 86,044,931–86,047,144. CRISPR/Cas9 gene editing technology was employed to generate XLOC_015548 mutant mouse models. Myf5 is a well-established mouse-specific promoter widely used in skeletal muscle-specific conditional knockout mouse studies [46, 47, 48, 49]. The present study utilized conditionally overexpressed XLOC_015548 mice (XLOC_015548cKI/+; iCre⁺), overexpression control mice (XLOC_015548cKI/+; iCre⁻), conditionally deleted XLOC_015548 mice (XLOC_015548fl/fl; Cre⁺), and knock-out control mice (XLOC_015548fl/fl; Cre⁻). The F₀ and breeding mice were obtained from Jiangsu GemPharmatech Co., Ltd. (Nanjing, China).
Conditional Knockout Mouse Model: To generate the conditional knockout mice for XLOC_015548, we used CRISPR/Cas9 technology. The target CRISPR site was located in the XLOC_015548 gene on chromosome 16 (Chr16:86044931-86047144), with LoxP sites inserted approximately 5 kb upstream and 2 kb downstream of the coding region. Cas9 mRNA, sgRNA, and a donor vector with LoxP sequences were co-injected into C57BL/6J zygotes, producing chimeric F0 mice. These were then bred with Myf5-Cre mice for skeletal muscle-specific knockout (genotype: XLOC_015548fl/fl; Cre⁺), confirmed by PCR and sequencing.
Overexpression Mouse Model: For the overexpression model, we targeted the Myf5 gene, specifically the Myf5-201 transcript (ENSMUST00000000445.1). We inserted the iCre-P2A sequence upstream of the ATG start codon of Myf5, using the Myf5 promoter to drive expression. Cas9 and sgRNA were used to create a double-strand break, and homologous recombination facilitated the insertion. The insertion was confirmed by PCR and sequencing. The iCre expression was specific to skeletal muscle due to the Myf5 promoter.
Genotypes were confirmed using PCR and agarose gel electrophoresis. All animal-related procedures were approved by the Ethics Committee of Shenzhen Top-Biotech Co., Ltd., and carried out in accordance with the Guide for the Care and Use of Laboratory Animals established by the National Research Council.
Ten-week-old C57BL/6 mice of four genotypes (22–25 g): XLOC_015548cKI/+; iCre⁺, XLOC_015548cKI/+; iCre⁻, XLOC_015548fl/fl; iCre⁺, and XLOC_015548fl/fl; iCre⁻ (n = 12 per genotype). Each genotype group was equally divided into sciatic nerve transection-induced atrophy (n = 6) and sham-operated (n = 6) subgroups under standardized isoflurane anesthesia (3% induction, 1.5%–2% maintenance). Each group of 6 mice included 3 reserve mice to mitigate the risk of attrition due to potential mortality or loss during the experiment.Post-surgery, the mice were housed individually with free access to food and water. At two weeks post-denervation, the success of the sciatic nerve transection model was confirmed under isoflurane anesthesia. Mice were euthanized with excess isoflurane, and the sciatic nerve transection site was inspected to ensure successful establishment of the model. The right gastrocnemius muscle was harvested and weighed to evaluate muscle wet weight. Samples were processed for paraffin and frozen embedding for subsequent histological analyses, including measurement of the cross-sectional area (CSA) and dihydroethidium (DHE) staining to assess oxidative stress. Molecular-level studies were also performed by immunohistochemistry (IHC). Additionally, tissues from the heart, liver, spleen, lungs, and kidneys were collected for hematoxylin and eosin (HE) staining and analysis.
Gastrocnemius muscle samples (~0.5 cm
Paraffin sections were deparaffinized with xylene and rehydrated through graded ethanol to distilled water. Sections were stained with hematoxylin for 3 minutes, differentiated with 1% acid alcohol, washed, and counterstained with eosin for 30 seconds. After dehydration, clearing in xylene, and mounting with neutral resin, the sections were examined by light microscopy. The muscle cross-sectional area (CSA) was measured using Image-Pro Plus software (version 6.0, Media Cybernetics, Rockville, MD, USA). The polygon tool was used to outline typical muscle fibers in HE-stained sections. Measurements were performed using ImageJ . For each section, at least five randomly selected fields were analyzed to calculate the average myotube area. The selection of fields was randomized to minimize bias, and the final average was calculated from all fields across each experimental group.
Paraffin sections were deparaffinized, rehydrated, and subjected to antigen retrieval using pepsin-based antigen retrieval solution (Cat# DIG-3009, Maixin, Fuzhou, China). Endogenous peroxidase was blocked with peroxidase blocking solution (Cat# KIT-9710, MXB, Fuzhou, China). After blocking non-specific binding sites, sections were incubated overnight at 4 °C with the following primary antibodies: rabbit anti-MEK1/2 (Cat# bs-1041R, 1:100, Bioss, Beijing, China), rabbit anti-phospho-MEK1/2 (Ser218 + Ser222) (Cat# bsm-52176R, 1:200, Bioss, Beijing, China), rabbit anti-ERK1/2 (Cat# bs-0022R, 1:200, Bioss, Beijing, China), rabbit anti-phospho-ERK1/2 (Thr202 + Tyr204) (Cat# bs-3016R, 1:200, Bioss, Beijing, China), rabbit anti-MyoD1 (Cat# 18943-1-AP, 1:150, Proteintech, Rosemont, IL, USA), and rabbit anti-GADD45G (Cat# GB113573, 1:1000, Servicebio, Wuhan, China). After three washes with PBS, sections were incubated with biotinylated secondary antibodies and streptavidin-HRP complex (Cat# KIT-9710, MXB, Fuzhou, China). DAB substrate (Cat# G1212, Servicebio, Wuhan, China) was applied for color development. Sections were counterstained with hematoxylin, dehydrated, cleared, and mounted with neutral resin. DAB-positive signals appeared brown, while nuclei were stained blue.
Frozen sections were warmed to room temperature and treated with autofluorescence quencher (Cat# G1221, Servicebio, Wuhan, China) for 5 minutes, followed by washing. Sections were stained with dihydroethidium (DHE) solution (Cat# D7008, Sigma-Aldrich, Shanghai, China) at 37 °C for 40 minutes in the dark. After washing with PBS, sections were mounted with antifade medium (Cat# 1401, Servicebio, Wuhan, China). DHE-positive signals were visualized under a fluorescence microscope (DMi8, Leica, Germany) as red fluorescence (Ex/Em = 535/550 nm).
Quantification of fluorescence intensity and Western blot band density was
performed using ImageJ software. The
remaining image analyses, including histological evaluations were performed using
Image-Pro Plus software (version 6.0, Media Cybernetics, Rockville, MD, USA).
Statistical analyses were performed using GraphPad Prism (version 10.1.1,
GraphPad Software, San Diego, CA, USA). Data were obtained from at least three
independent experiments. Time-course comparisons were conducted using two-way
analysis of variance (two-way ANOVA) with Šídák’s multiple
comparisons test, while multi-group comparisons were evaluated using one-way
analysis of variance (one-way ANOVA) followed by Tukey’s post hoc test. Pairwise
comparisons were performed using Student’s t-test. For experiments involving the
comparison of means across different genotypes, statistical analysis was
performed using multiple unpaired t-tests. The False Discovery Rate
(FDR) correction was applied using the two-stage, step-up method proposed by
Benjamini, Krieger, and Yekutieli to ensure reliability in multiple comparisons.
Results are presented as the mean
This study explored the protective role of XLOC_015548 in promoting myogenic differentiation and mitigating muscle atrophy by regulating Gadd45g, activating the MEK/ERK signaling pathway, and alleviating oxidative stress (Fig. 1A). Confocal microscopy-based Fluorescence In Situ Hybridization (FISH) 3D imaging revealed that XLOC_015548 was predominantly localized in the cytoplasm. Stably transfected C2C12 cell lines were prepared using lentiviral constructs for XLOC_015548 knock-down (KD-XLOC) and its control (KD-NC), or XLOC_015548 overexpression (OE-XLOC) and its control (OE-Ctrl). Analysis with Co-localization Finder revealed negative Pearson correlation coefficients, further confirming the cytoplasmic localization of XLOC_015548. Moreover, Plot Profile analysis revealed there was no overlap between nuclear DAPI signals and FISH signals, thus confirming the cytoplasmic localization of XLOC_015548. Both 3D imaging and Plot Profile analysis showed that overexpression or knock-down of XLOC_015548 altered its expression level in cells (Fig. 1B, Supplementary Fig. 1A). Additionally, RT-qPCR analysis revealed that XLOC_015548 mRNA levels were decreased in the knock-down group, and increased in the overexpression group compared to their respective controls (Supplementary Fig. 1B). These results confirm successful transfection of the target gene into C2C12 myogenic cells and its correct localization in the cytoplasm (Fig. 1B, Supplementary Fig. 1B).
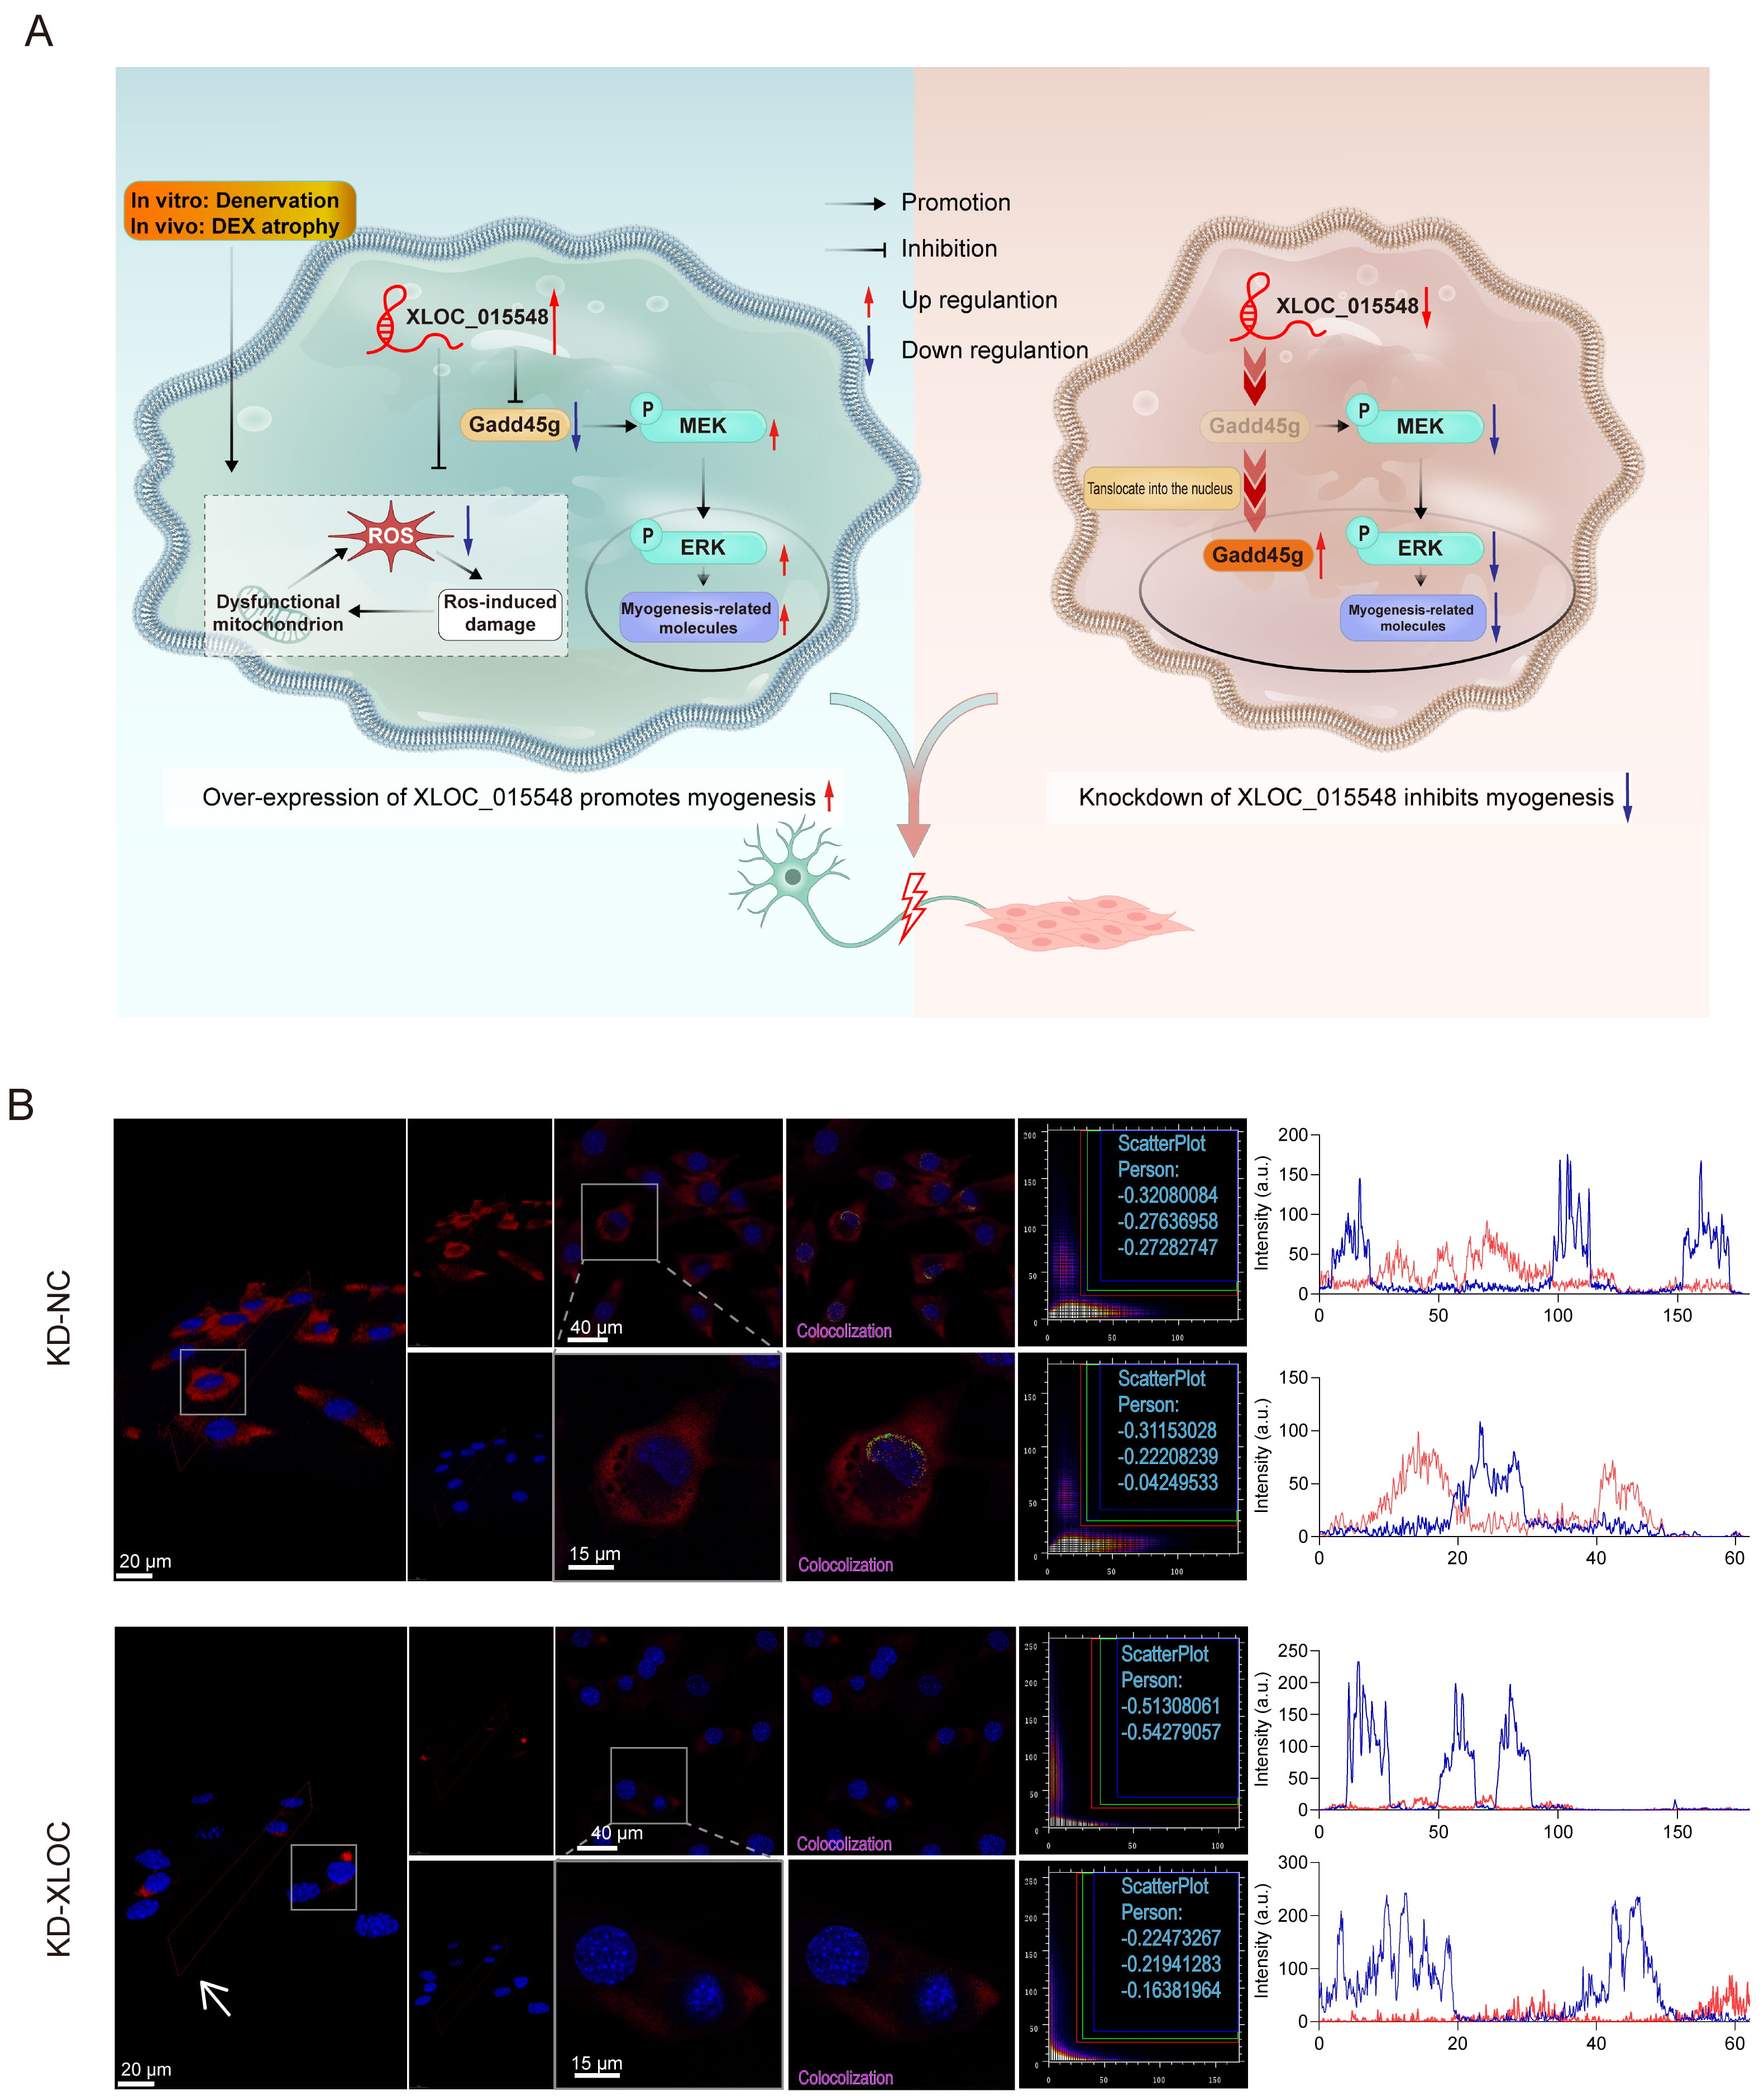 Fig. 1.
Mechanism of XLOC_015548 in promoting myogenic differentiation and alleviating muscle atrophy through its regulation of Gadd45g expression, activation of the MEK/ERK pathway, and mitigation of oxidative stress, along with analysis of its cellular localization and co-localization. (A) Schematic diagram illustrating the regulatory mechanism of XLOC_015548 in promoting myogenesis under denervation-induced or dexamethasone (DEX)-induced muscle atrophy conditions. Overexpression of XLOC_015548 inhibited mitochondrial dysfunction caused by reactive oxygen species (ROS), activated the MEK/ERK signaling pathway, and increased the expression of myogenesis-related molecules. Solid arrows indicate promotion or inhibition effects, while red and blue arrows represent upregulation and downregulation, respectively. (B) FISH images showing the localization and co-localization of XLOC_015548 in control cells (KD-NC) and XLOC_015548 in knockdown cells (KD-XLOC_015548). FISH signals are shown in red, and nuclei are labeled in blue. White arrows indicate the decreased XLOC_015548 expression in KD-XLOC_015548 cells. Pearson co-localization coefficients for three independent measurements were recorded in scatter plots, with merged fluorescent signals annotated in red, green, and blue. Line plots represent pixel intensity distributions for DAPI (blue fluorescence) and FISH (red fluorescence) signals. Scale bars: 20 µm (3D image), 40 µm (full image), and 15 µm (zoomed image).
To investigate the effects of XLOC_015548 on cell proliferation and survival, stable lentivirus-transfected C2C12 cells were analyzed on differentiation day 0 and day 7 under control conditions, or after 48 h treatment with the MEK/ERK inhibitor U0126. The EdU assay was used to quantify cell proliferation under various experimental conditions (Supplementary Fig. 2A). XLOC_015548 overexpression (OE-XLOC) significantly increased cell proliferation compared to the control group (OE-Ctrl), while knock-down (KD-XLOC) markedly suppressed proliferation (Supplementary Fig. 2B,C). Notably, the addition of U0126 completely abolished the pro-proliferative effects of OE-XLOC, indicating its dependence on the MEK/ERK pathway.
Calcein-AM/PI staining was used to evaluate cell survival under different conditions (Supplementary Fig. 2B,D; Supplementary Fig. 3A,B). Knockdown of XLOC_015548 showed a trend toward increased PI-positive (dead) cells, whereas OE-XLOC exhibited a trend toward reduced cell death, suggesting a potential protective role in undifferentiated states. This protective effect was partially reversed by U0126 treatment, further confirming its reliance on the MEK/ERK pathway. This phenomenon was not observed in differentiated cells.
Stable KD-XLOC and OE-XLOC cell lines were established to investigate the role of XLOC_015548 in C2C12 myogenic differentiation, with or without intervention from the MEK inhibitor U0126. Immunofluorescence (IF) and Western blot analyses were performed to evaluate the expression of related proteins and myotube formation during differentiation (Fig. 2A). On day 1, U0126 treatment significantly increased the proportion of Myosin heavy chain (MHC)-positive nuclei, as well as the myotube diameter (Fig. 2B,C). However, from day 3 onward, KD-XLOC showed significant inhibition of myotube formation and disorganization, whereas OE-XLOC promoted myotube formation and enhanced cytoplasmic MyoD distribution. These effects were evident on days 3, 5, and 7. Addition of U0126 reversed these effects, impairing myotube morphology in both the KD-XLOC and OE-XLOC groups (Fig. 2B). Further analysis on days 3, 5, and 7 revealed that KD-XLOC significantly reduced MHC-positive nuclei and myotube diameter, whereas OE-XLOC significantly increased these metrics. U0126 intervention suppressed the pro-differentiation effects of OE-XLOC, further demonstrating the dependence of XLOC on the MEK/ERK pathway (Fig. 2C). Western blot analysis corroborated these findings for day 7. KD-XLOC significantly reduced MHC expression and MEK activation, while OE-XLOC showed an promoting trend in these metrics. U0126 treatment suppressed OE-XLOC-induced pathway activation and protein expression. Furthermore, Gadd45g, a key regulatory protein, was negatively regulated by XLOC (Fig. 2D–F). These findings suggest that XLOC_015548 promotes myotube formation and regulates myogenic protein expression by modulating Gadd45g or activating the MEK/ERK signaling pathway, thus providing critical insights into the mechanisms underlying XLOC_015548-mediated myogenic differentiation.
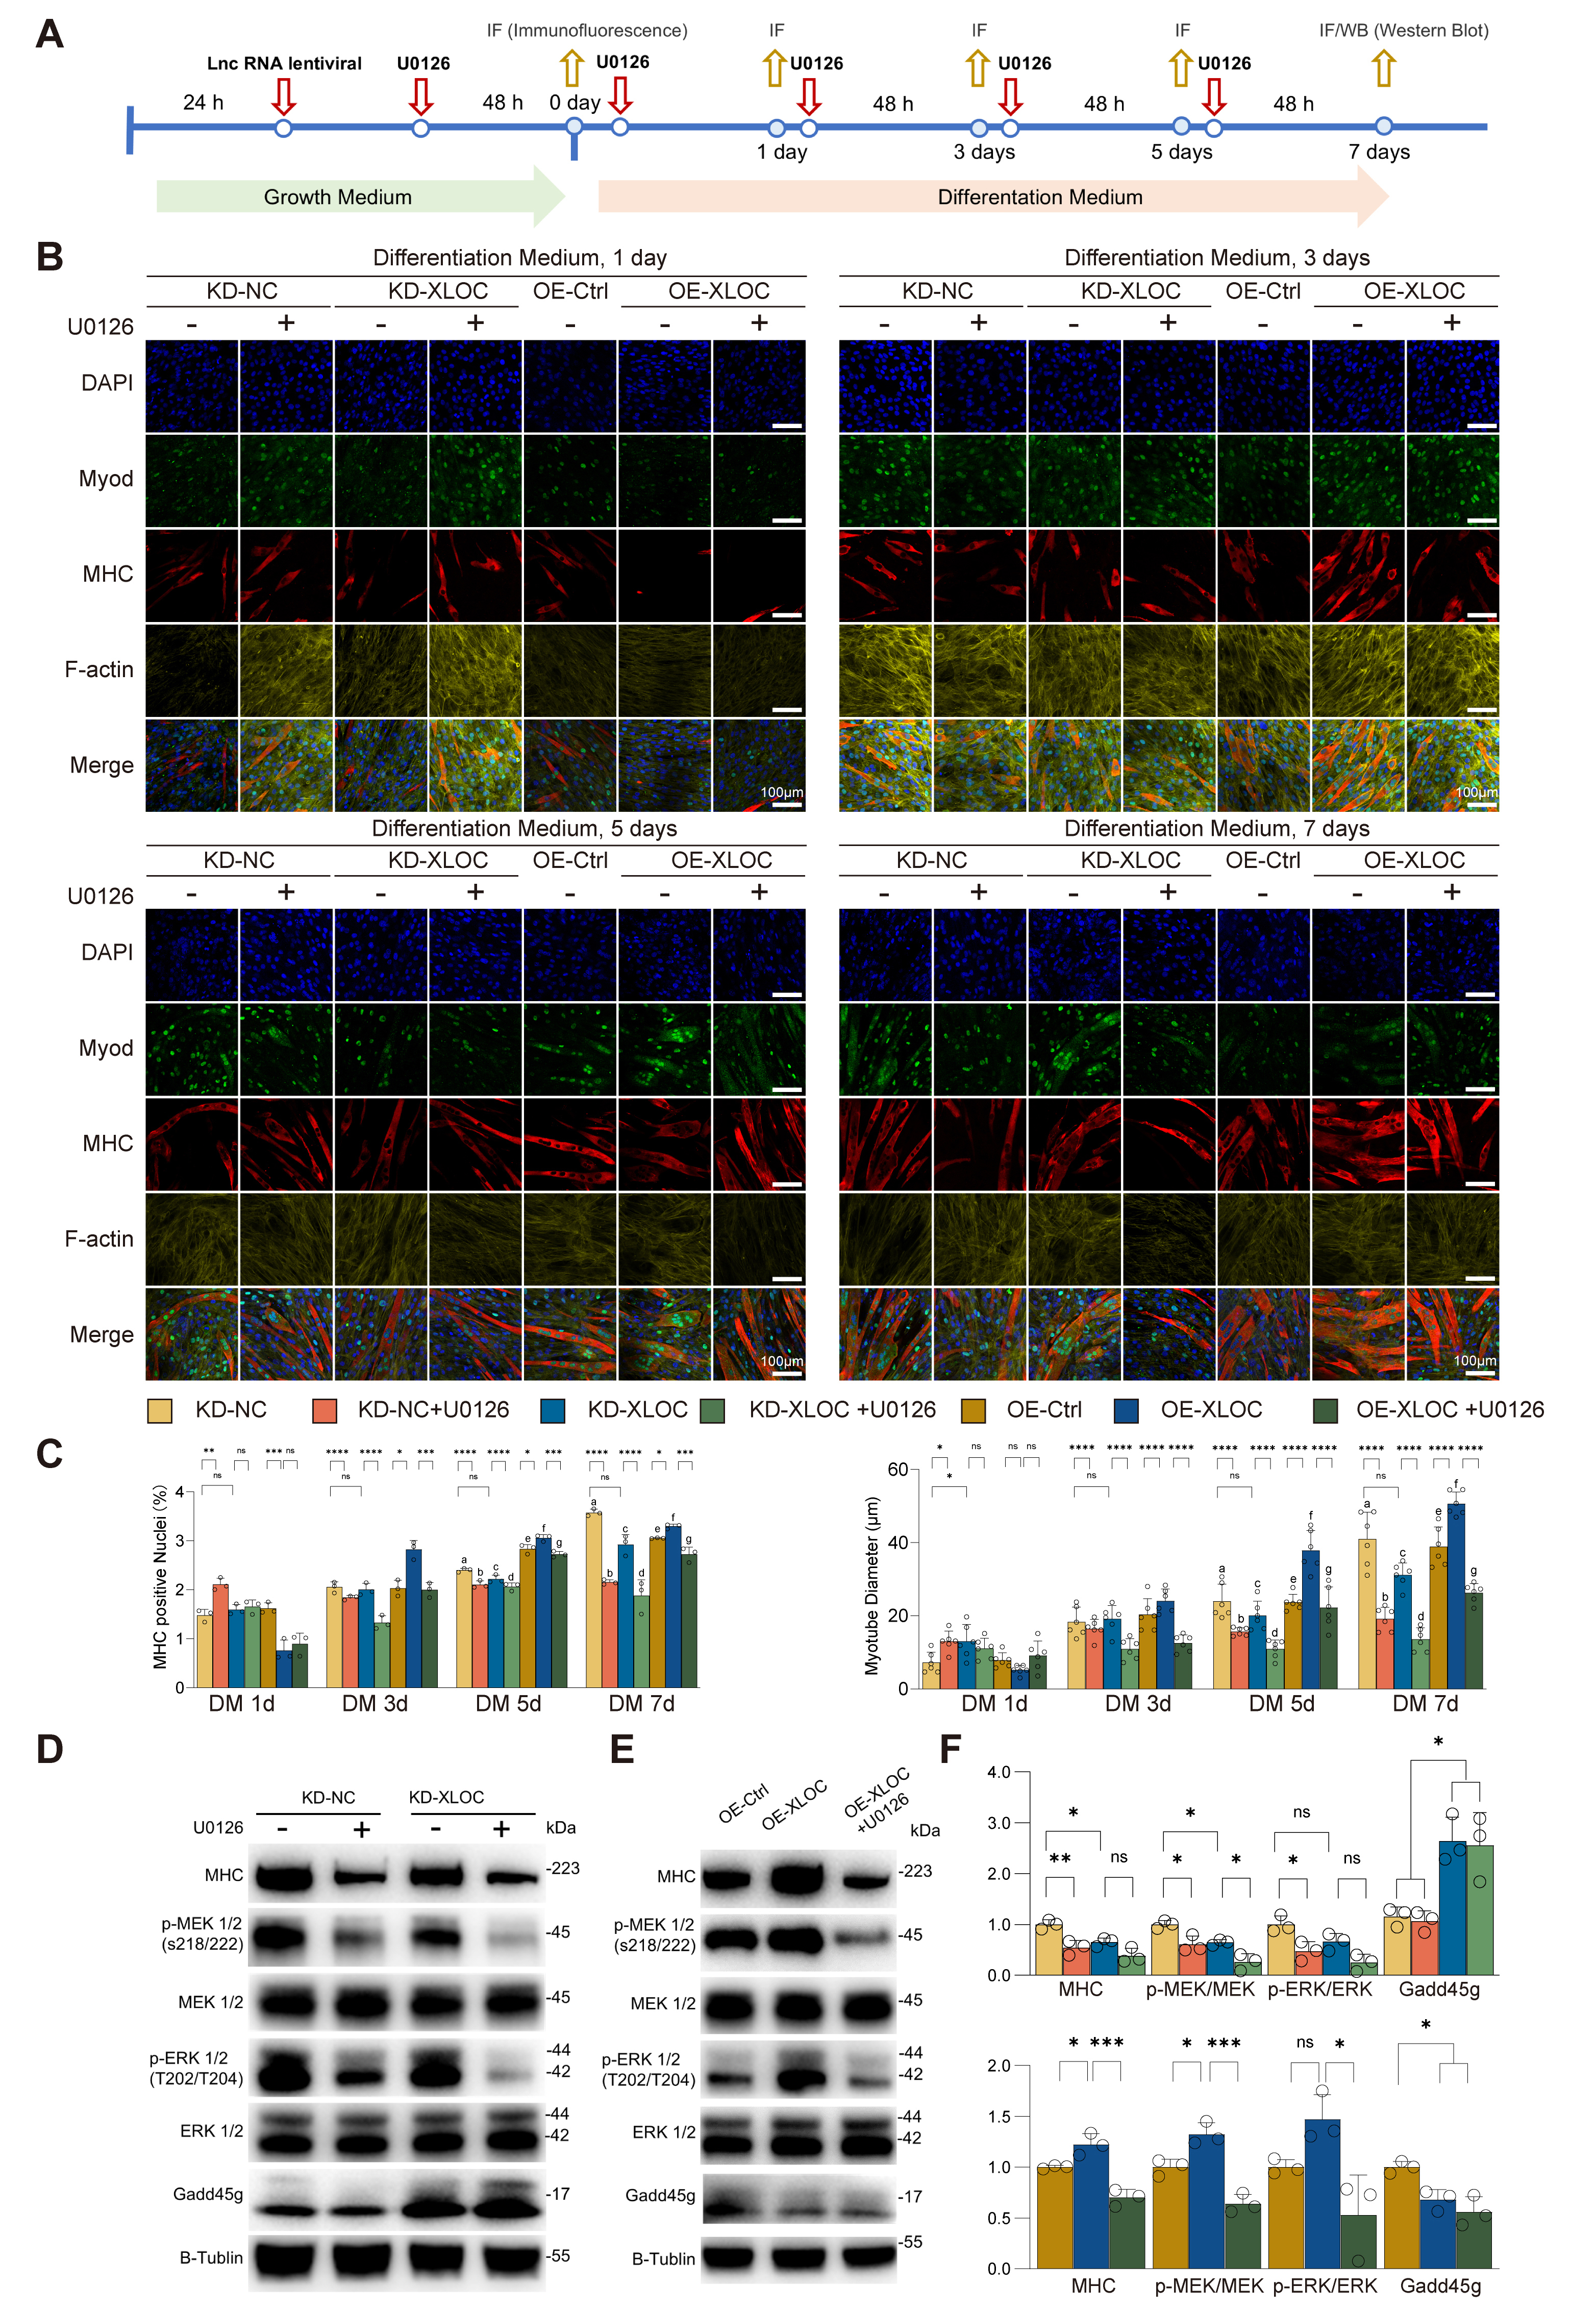 Fig. 2.
Regulation of myotube formation and myogenic protein expression
by XLOC via the MEK/ERK pathway. (A) Experimental timeline showing the
differentiation of C2C12 myoblasts under conditions of XLOC knock-down (KD) or
overexpression (OE), and with or without the MEK inhibitor U0126. (B)
Representative immunofluorescence images at days 1, 3, 5, and 7 of
differentiation. Green: MyoD; Red: MHC; Yellow: F-actin; Blue: nuclei (DAPI).
Scale bar = 100 µm. (C) Quantification of the proportion of
Myosin heavy chain (MHC)-positive nuclei and myotube diameter under different
experimental conditions. Data are presented as the mean
During the proliferation phase (DM 0d), XLOC_015548 increased cell proliferation primarily by activating the MEK/ERK pathway. KD-XLOC reduced the proportion of Ki67-positive nuclei, whereas OE-XLOC increased the proportion of Ki67-positive nuclei (Supplementary Fig. 4A–D). Treatment with U0126 reversed the pro-proliferative effects of OE-XLOC, confirming the critical role of the MEK/ERK pathway in XLOC_015548-mediated regulation of proliferation.
At the mid-differentiation phase (DM 3d), XLOC_015548 optimized the differentiation microenvironment by modulating the cell cycle and early apoptosis (Fig. 3A). Cell cycle analysis showed that OE-XLOC significantly increased the proportion of G1-phase cells while reducing the proportion of S-phase cells, suggesting that XLOC_015548 facilitates transition of C2C12 cells from the proliferation phase to the differentiation phase by regulating the cell cycle at the intracellular level (Fig. 3B,C). Additionally, Annexin V/PI staining revealed that OE-XLOC significantly increased the proportion of early apoptotic cells (Fig. 3D,E), indicating that it may clear undifferentiated cells, thereby creating a more favorable microenvironment for differentiation.
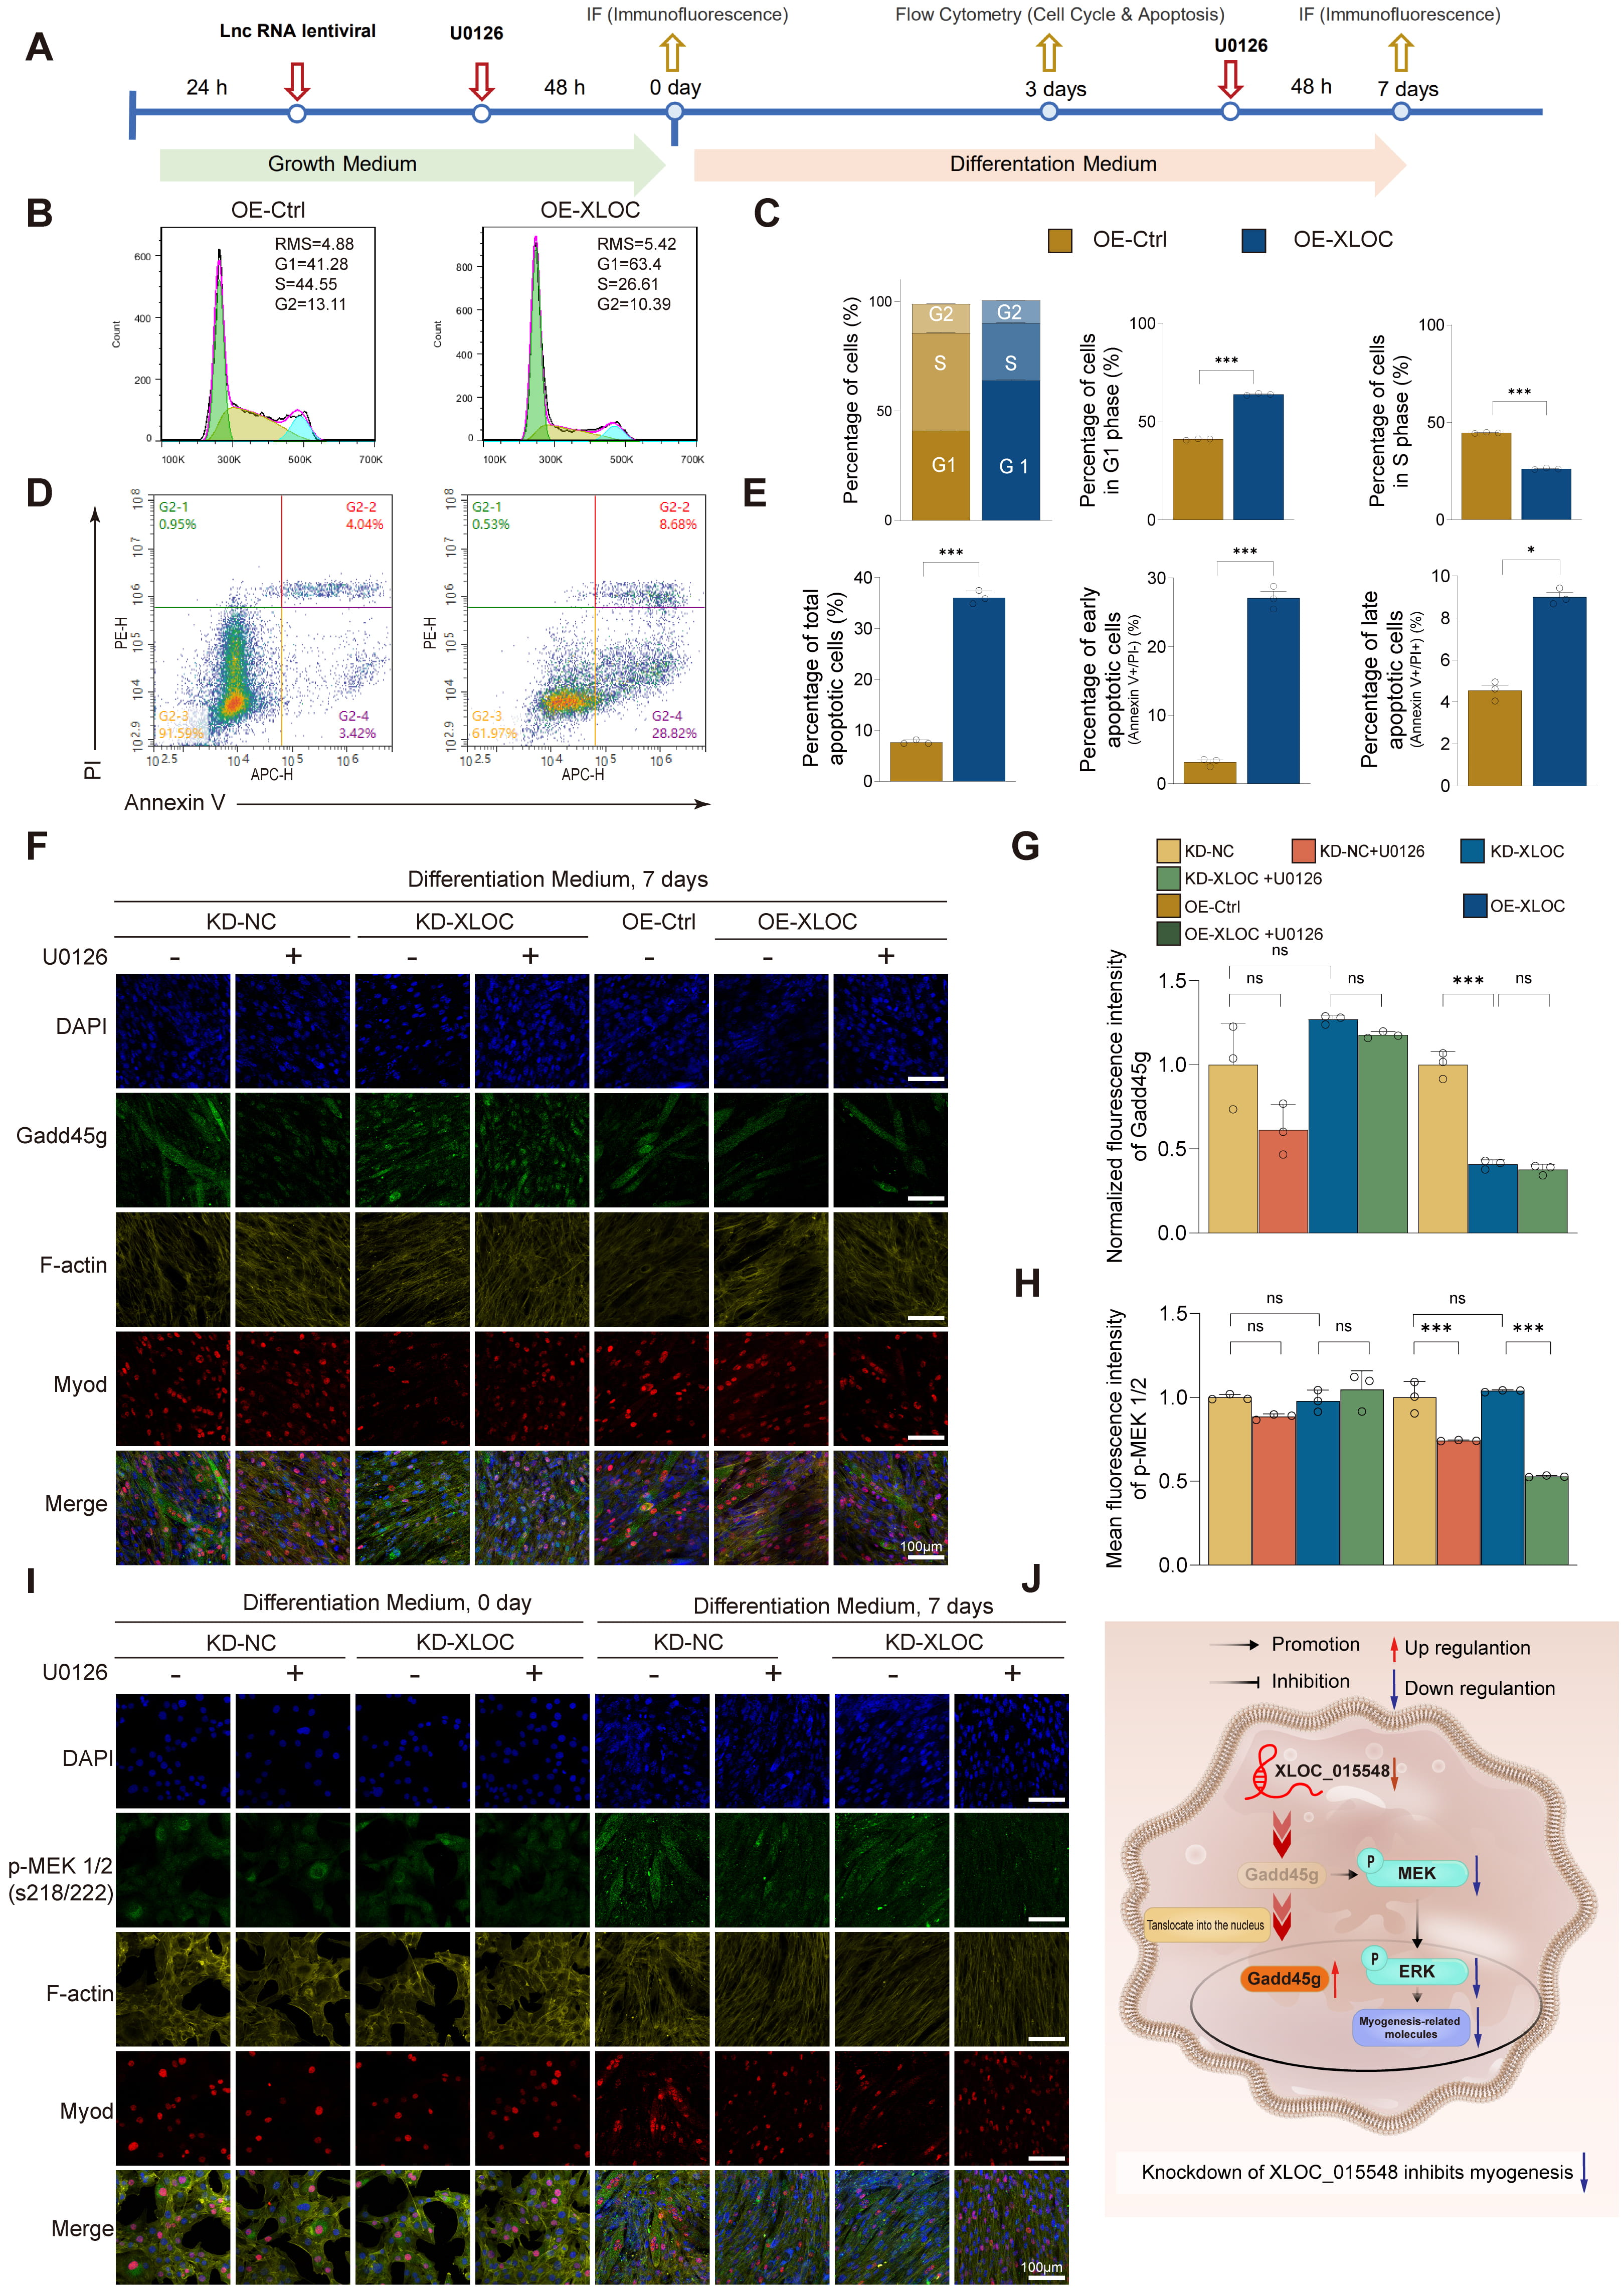 Fig. 3.
Regulation of myogenic differentiation by XLOC through
activation of the MEK/ERK pathway and inhibition of Gadd45g nuclear
translocation. (A) Experimental timeline for differentiation experiments under
KD or OE conditions, with or without the MEK inhibitor U0126. (B) Flow cytometry
analysis of cell cycle distribution on day 3 of differentiation, comparing the
OE-Ctrl and OE-XLOC groups. (C) Quantification of G1, S, and G2 phase cell cycle
distributions, comparing the OE-Ctrl and OE-XLOC groups. Statistical analysis:
Student’s t-test (***p
During the late differentiation phase (DM 7d), XLOC_015548 maintained myotube formation by regulating the cytoplasmic localization of Gadd45g and the activity of the MEK/ERK pathway. IF analysis showed that KD-XLOC increased Gadd45g expression and nuclear translocation, leading to disorganized myotube alignment and impaired differentiation. In contrast, OE-XLOC reduced Gadd45g expression and nuclear localization while improving myotube structure (Fig. 3F,G). Nuclear-cytoplasmic fractionation combined with Western blot analysis demonstrated that XLOC_015548 bidirectionally regulates both protein stability and subcellular distribution of Gadd45g during myogenic differentiation (Fig. 2D–F, Supplementary Fig. 5A–C). Control experiments with empty vectors (OE-Control and KD-NC) showed no significant differences in total Gadd45g levels or nuclear-cytoplasmic partitioning compared to untransfected cells (Supplementary Fig. 5A), ruling out nonspecific vector effects. Specifically, XLOC_015548 overexpression (OE-XLOC) significantly reduced total Gadd45g levels (vs. OE-Ctrl), whereas knockdown (KD-XLOC) induced its accumulation (vs. KD-NC) (Fig. 2D–F). Subcellular localization analysis further revealed that OE-XLOC markedly decreased nuclear Gadd45g with a concomitant cytoplasmic reduction trend, while KD-XLOC enhanced nuclear enrichment alongside cytoplasmic elevation (Supplementary Fig. 5B,C). Notably, dynamic changes in nuclear-to-cytoplasmic ratios correlated strongly with functional outcomes: reduced ratios in OE-XLOC group coincided with MEK/ERK pathway activation and enhanced myotube fusion, whereas elevated ratios in KD-XLOC group were associated with differentiation blockade (Fig. 3F). These findings collectively indicate that XLOC_015548 orchestrates the pro-differentiation function of Gadd45g primarily through its dominant regulatory role in subcellular partitioning. Notably, these differences in Gadd45g distribution were not observed in undifferentiated cells (DM 0d), suggesting that Gadd45g localization plays a functional role primarily during differentiation (Supplementary Fig. 5D,E). Furthermore, p-MEK1 was predominantly localized in mature myotubes (Fig. 3I), while KD-XLOC decreased p-MEK1/2 expression (Fig. 3H). Although the positive nuclear rate for p-ERK1/2 was not significantly different in the KD-XLOC group, the co-localization of p-ERK1/2 with MyoD-positive nuclei in partially differentiated cells was reduced (Supplementary Fig. 5F,G). This indicates that XLOC_015548 optimizes myogenic differentiation by regulating the nuclear localization of p-ERK.
Histological analysis of major organs from gene-edited mice revealed no structural abnormalities (Supplementary Fig. 6A,B). However, conditional knockout mice (XLOC_015548fl/fl; Cre⁺) exhibited significantly elevated Gadd45g expression, predominantly in the nucleus. Additionally, the Pearson correlation coefficients for nuclear localization of p-ERK1/2 were reduced, indicating impaired ERK nuclear translocation (Supplementary Fig. 7E–G). After two weeks of denervation, Cre⁺ mice displayed disorganized muscle fiber structure, reduced muscle cross-sectional area (CSA), increased oxidative stress (Supplementary Fig. 7A–D), and significantly decreased MyoD expression (Supplementary Fig. 7E,G). These findings suggest that XLOC_015548 alleviates denervation-induced muscle atrophy by inhibiting the nuclear translocation of Gadd45g.
In summary, XLOC_015548 plays a crucial role in regulating cell proliferation, differentiation, and myotube formation during different stages of myogenesis. In the early phase (DM 0d), it enhances proliferation through the MEK/ERK pathway. In the mid-differentiation phase (DM 3d), it optimizes the differentiation microenvironment by regulating the cell cycle and early apoptosis. In the late phase (DM 7d), it maintains myotube formation by modulating the cytoplasmic localization of Gadd45g and the activity of the MEK/ERK pathway. These findings highlight the importance of cytoplasmic localization of Gadd45g and nuclear distribution of p-ERK in myogenic differentiation, with Gadd45g serving as a key upstream regulator of the MEK/ERK pathway in myogenesis and stress regulation (Fig. 3J).
To further investigate the regulatory role of Gadd45g in myogenic differentiation, we established C2C12 stable cell lines that overexpress Gadd45g (OE-Gadd45g) and then systematically analyzed the impact on the MEK/ERK signaling pathway, myotube formation, and functional development (Fig. 4B). Western blot analysis revealed that OE-Gadd45g significantly upregulated Gadd45g protein expression, activated the MEK/ERK signaling pathway, and increased the expression of the myogenic marker myosin heavy chain (MHC) (Fig. 4A,C). On the basis of OE-XLOC_015548 cells, further overexpression of Gadd45g (OE-Gadd45g) reversed the downregulation of Gadd45g caused by XLOC_015548 overexpression and enhanced p-MEK and MEK/ERK activation, as well as MHC expression (Supplementary Fig. 8A,B). Upon treatment with the MEK inhibitor U0126, these effects were suppressed, accompanied by a reduction in MHC expression (Fig. 4A,C; Supplementary Fig. 8A,B).
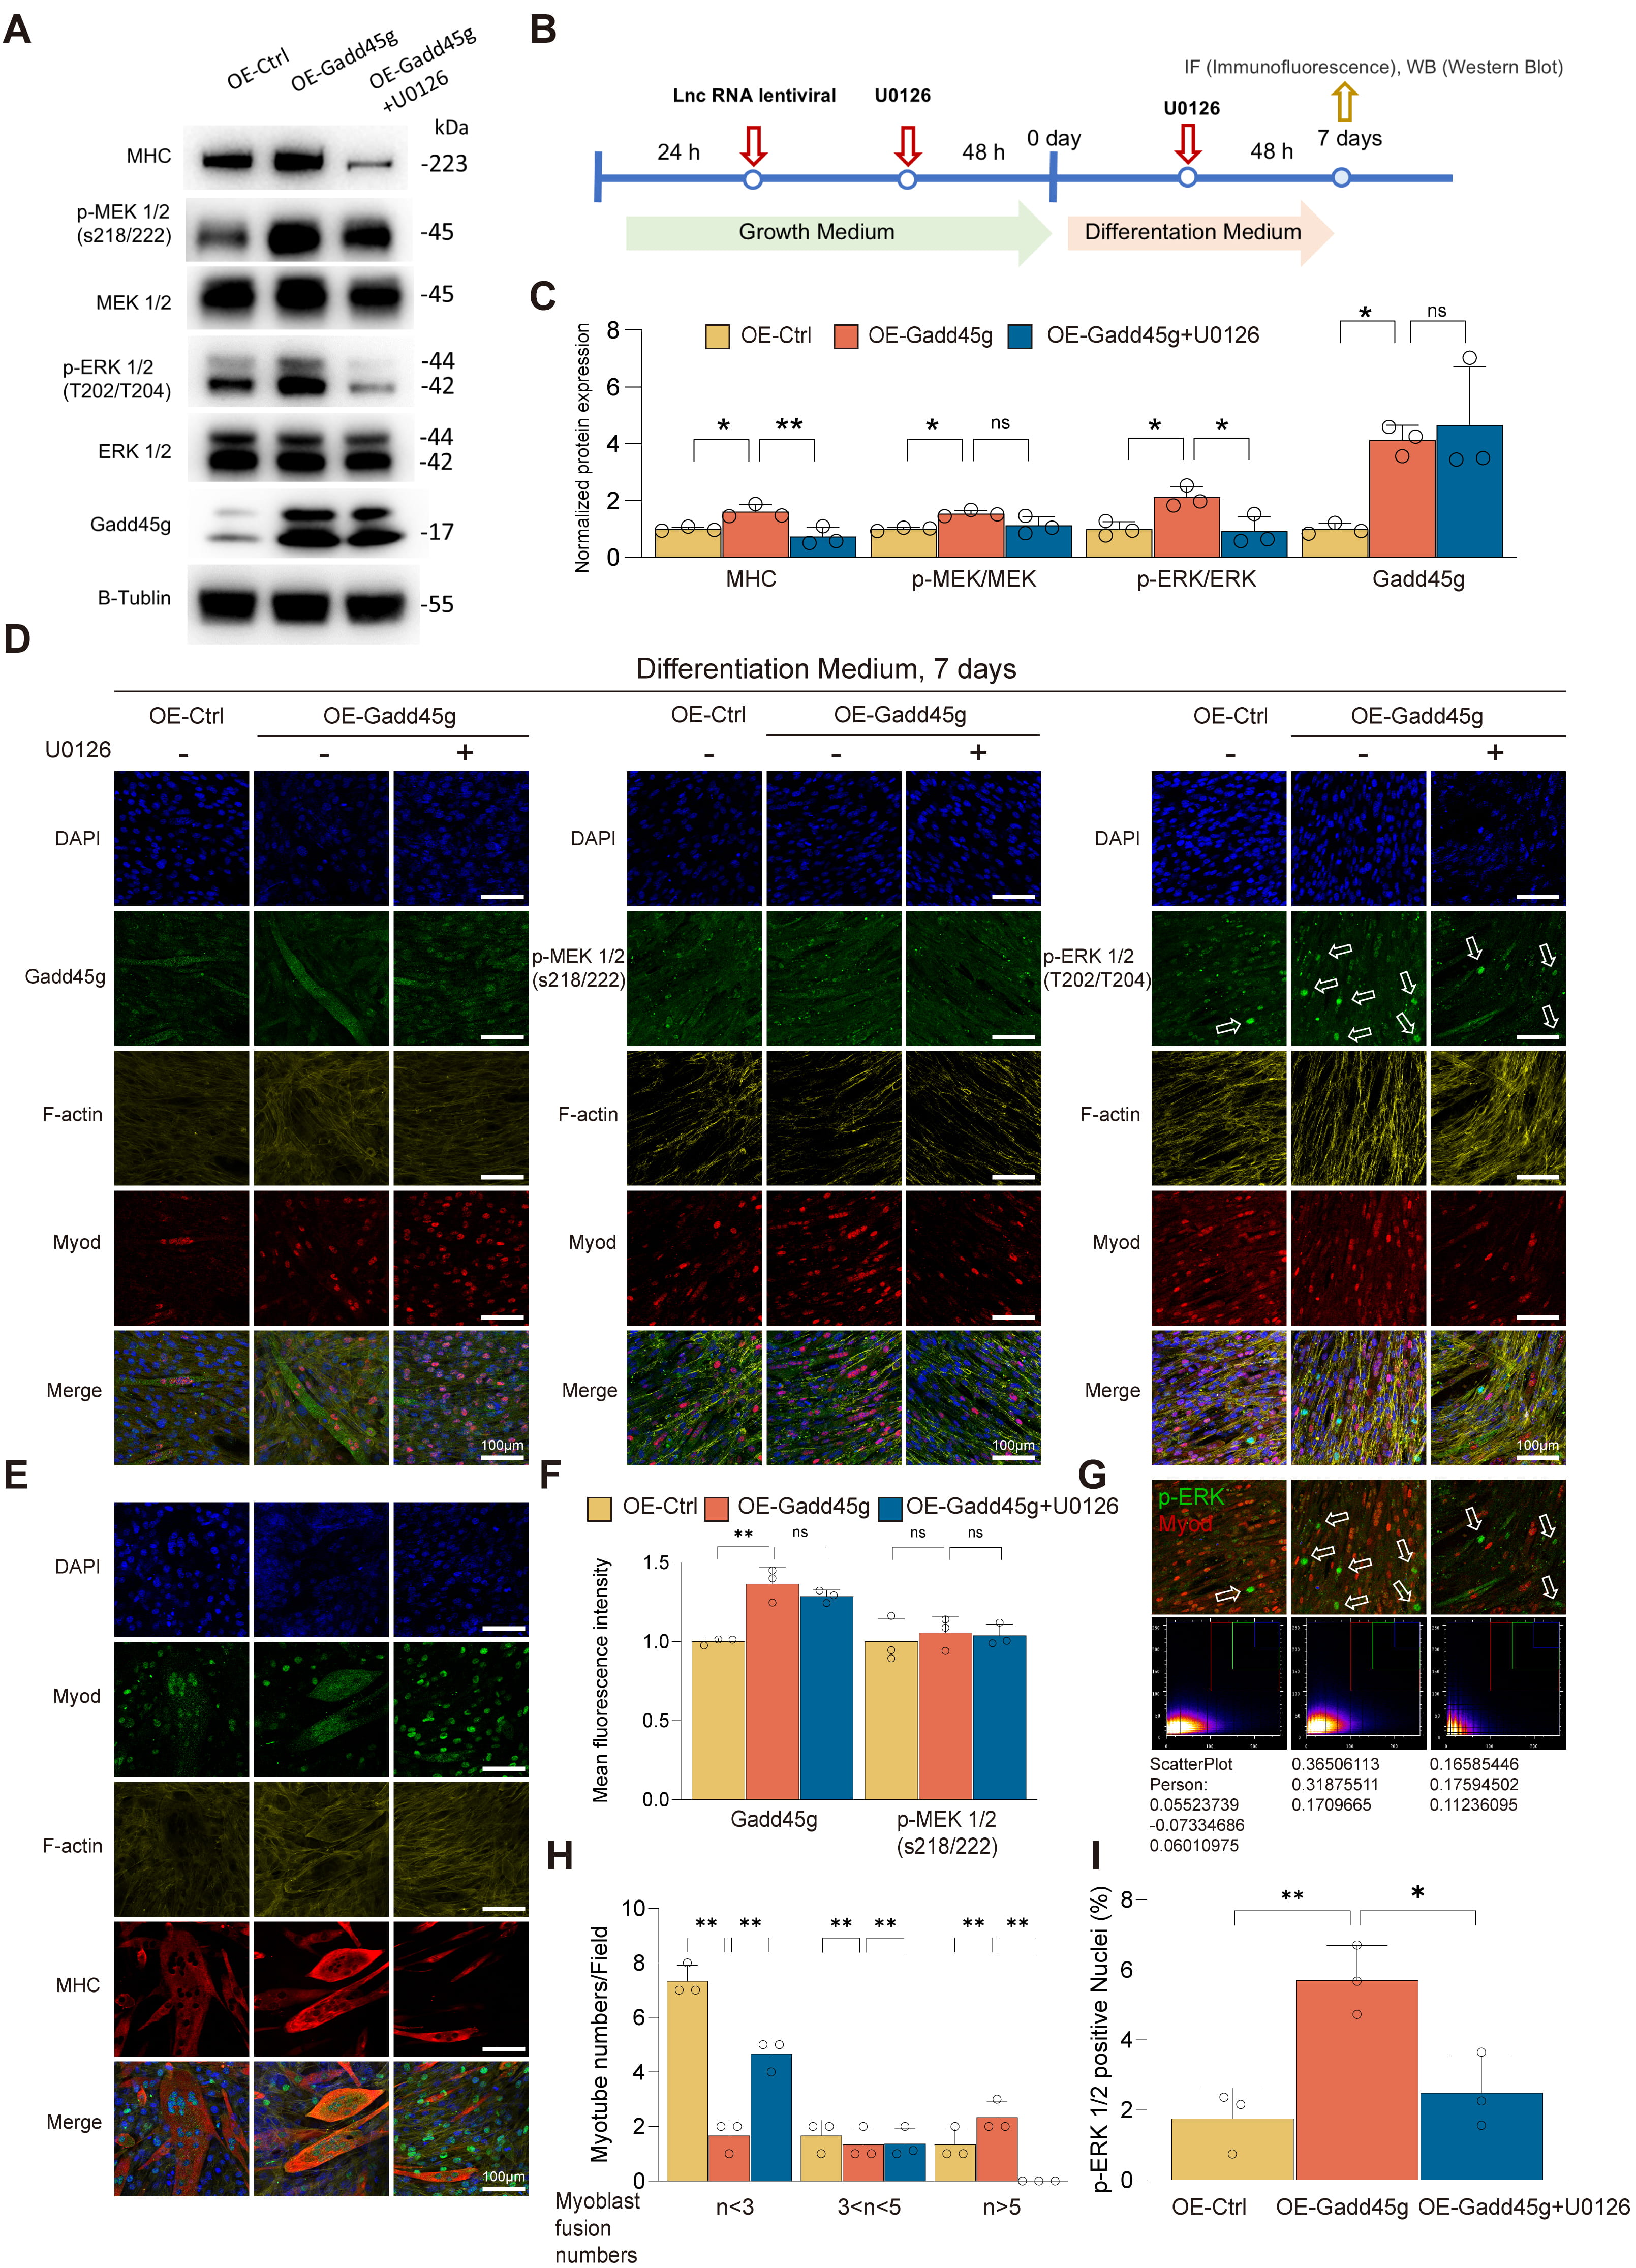 Fig. 4.
Gadd45g regulates myogenic differentiation and functionality of
C2C12 myoblasts through the MEK/ERK pathway. (A) Western blot analysis of
Gadd45g, p-MEK1/2, p-ERK1/2, and the myogenic differentiation marker MHC in
OE-Ctrl, OE-Gadd45g, and OE-Gadd45g + U0126 groups. Overexpression of Gadd45g
(OE-Gadd45g) significantly upregulated Gadd45g and MHC levels, while U0126
treatment reduced p-MEK/MEK, p-ERK/ERK, and MHC expression. (B) Experimental
design outlining the infection of C2C12 cells with OE-Gadd45g or OE-Ctrl
lentivirus and subsequent differentiation with or without U0126 treatment. (C)
Quantification of Western blot results normalized to
Treatment with the MEK inhibitor U0126 resulted in decreased p-MEK/MEK and
p-ERK/ERK ratios, and reduced MHC expression (Fig. 4C). These results highlight
the critical role of the MEK/ERK signaling pathway in Gadd45g-mediated regulation
of myogenic differentiation. IF analysis further confirmed the role of Gadd45g in
myogenesis. On differentiation day 7 (DM 7d), OE-Gadd45g promoted the
localization of Gadd45g to the cytoplasm and distribution in mature myotubes
(Fig. 4D,F). Notably, although XLOC_015548 overexpression decreased
total Gadd45g protein levels, its cytoplasmic localization was largely
maintained. Similarly, OE-Gadd45g enhanced Gadd45g distribution in the cytoplasm
and its enrichment in mature myotubes (Fig. 4D,F). These findings further support
the notion that cytoplasmic Gadd45g helps activate MEK/ERK signaling and promotes
the expression of the myogenic marker MHC. Although p-MEK levels remained
unchanged (Fig. 4F), the nuclear localization of p-ERK1/2 and its co-localization
with MyoD-marked nuclei (indicative of undifferentiated cells) were significantly
increased in the OE-Gadd45g group. This effect was reversed by U0126 treatment
(Fig. 4D,G,I). Together, these findings suggest that Gadd45g optimizes the
myogenic differentiation environment by facilitating nuclear p-ERK signaling. In
addition, the OE-Gadd45g group had an increased number of multinucleated myotubes
(
Of note, in a DEX-induced muscle atrophy model, the key oxidative stress marker iNOS was suppressed under both OE-Gadd45g and OE-XLOC_015548 overexpression conditions (Supplementary Fig. 8A,B). This observation suggests that XLOC_015548 may play a significant role in alleviating DEX-induced oxidative stress. However, in the absence of DEX treatment, no significant differences in iNOS expression were observed.
In conclusion, this study revealed that cytoplasmic Gadd45g positively regulates myogenic differentiation, myotube formation, and modulates oxidative stress through activation of the MEK/ERK signaling pathway and nuclear translocation of p-ERK (Supplementary Fig. 8E). These findings provide critical insights into the mechanistic role of Gadd45g in myogenic regulation and highlight its potential as a target for enhancing muscle differentiation and function.
This study used XLOC_015548-stable transfected C2C12 cell lines (OE-Ctrl and OE-XLOC), combined with DEX treatment and MEK inhibitor U0126 intervention, to systematically investigate the role of XLOC_015548 in cell viability, senescence, proliferation, and myogenic differentiation (Fig. 5A). OE-XLOC significantly reversed DEX-induced inhibition of myotube formation and improved myotube morphology and function by activating the MEK/ERK signaling pathway, suppressing cellular senescence, and promoting cell proliferation. Brightfield microscopy revealed that DEX treatment markedly reduced the number and diameter of myotubes, while OE-XLOC restored these parameters. However, the restorative effects were partially inhibited by U0126 treatment (Fig. 5B,C).
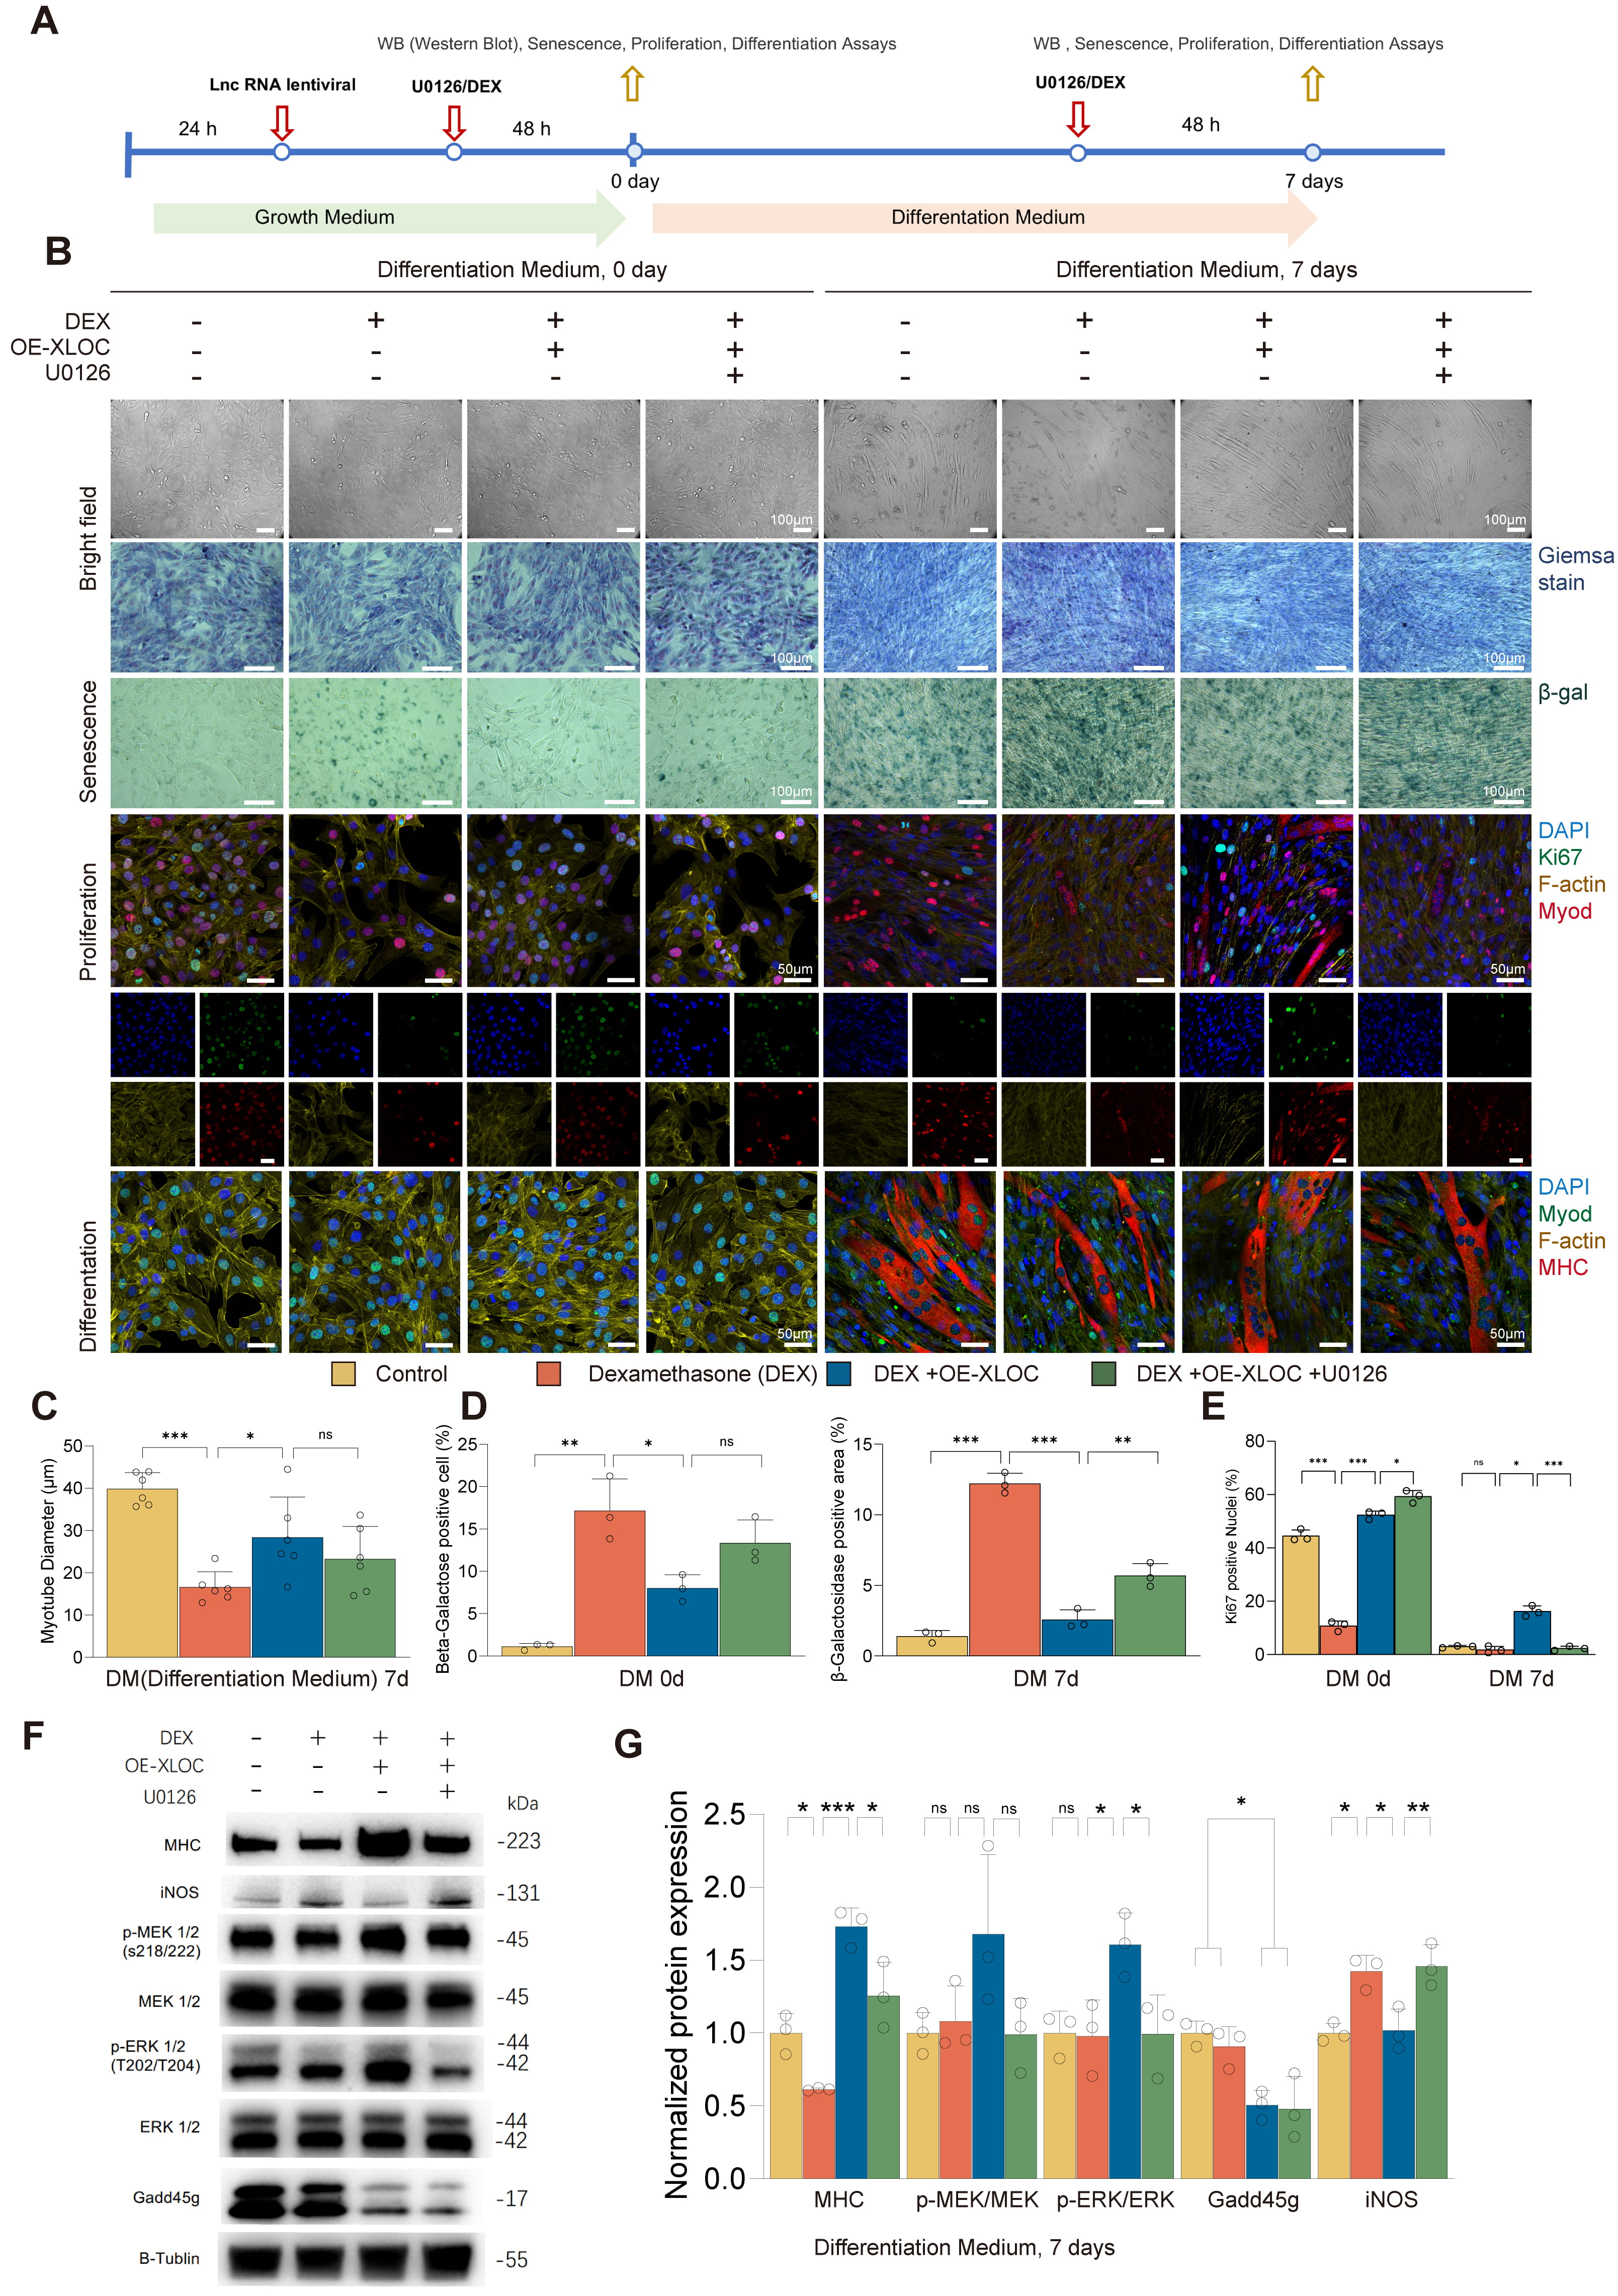 Fig. 5.
XLOC_015548 reverses DEX-induced muscle atrophy by
regulating myogenic differentiation. (A) Schematic showing the design of
experiments involving OE-XLOC and control C2C12 stable lines treated with or
without DEX, and with the MEK inhibitor U0126. (B) Top: Bright-field images of
myotube morphology on differentiation day 0 (DM 0d) and day 7 (DM 7d) under
different conditions (scale bar = 100 µm). Middle:
TUNEL staining and multiplex fluorescence analysis were used to further elucidate the role of Gadd45g in DEX-induced myogenic inhibition. DEX was shown to significantly increase the apoptosis rate on day 7 of differentiation, while OE-XLOC markedly reduced the proportion of TUNEL-positive cells and restored the proportions of MHC- and Myog-positive nuclei in myotubes (Supplementary Fig. 10A–G), thereby promoting myotube formation. These effects were partially reversed by U0126 treatment. Mechanistically, OE-XLOC may function by suppressing Gadd45g expression and enhancing its cytoplasmic localization, leading to the activation of MEK/ERK signaling and optimization of the differentiation environment (Supplementary Fig. 10H). Residual apoptosis observed on day 3 in the DEX + OE-XLOC group may reflect the natural process of selective apoptosis during myogenesis.
In conclusion, XLOC_015548 exerts significant protective effects against DEX-induced inhibition of myogenesis through multiple mechanisms, including the suppression of senescence, promotion of proliferation, regulation of Gadd45g localization, modulation of oxidative stress via iNOS downregulation, and activation of the MEK/ERK signaling pathway. This study provides new insights into the molecular mechanisms underlying DEX-induced muscle atrophy, and establishes a theoretical foundation for therapeutic interventions that target muscle wasting.
We next investigated the role of XLOC_015548 in regulating oxidative stress and mitochondrial function during myogenic differentiation by utilizing XLOC_015548-stably transfected C2C12 cell lines (OE-Ctrl and OE-XLOC) in combination with dexamethasone (DEX) treatment and intervention with the MEK inhibitor U0126 (Fig. 6A). Analysis of redox homeostasis, mitochondrial function, and cell viability revealed that DEX treatment significantly increased the green fluorescence intensity of the oxidative probe (BDP 581/591 C11), indicating an increase in oxidative stress. In contrast, OE-XLOC cells exhibited a marked reduction in oxidative signals and increased red fluorescence intensity of unreacted probe, which was partially reversed by U0126 treatment (Fig. 6B,D). These findings suggest that XLOC_015548 may regulate redox balance through activation of the MEK/ERK signaling pathway.
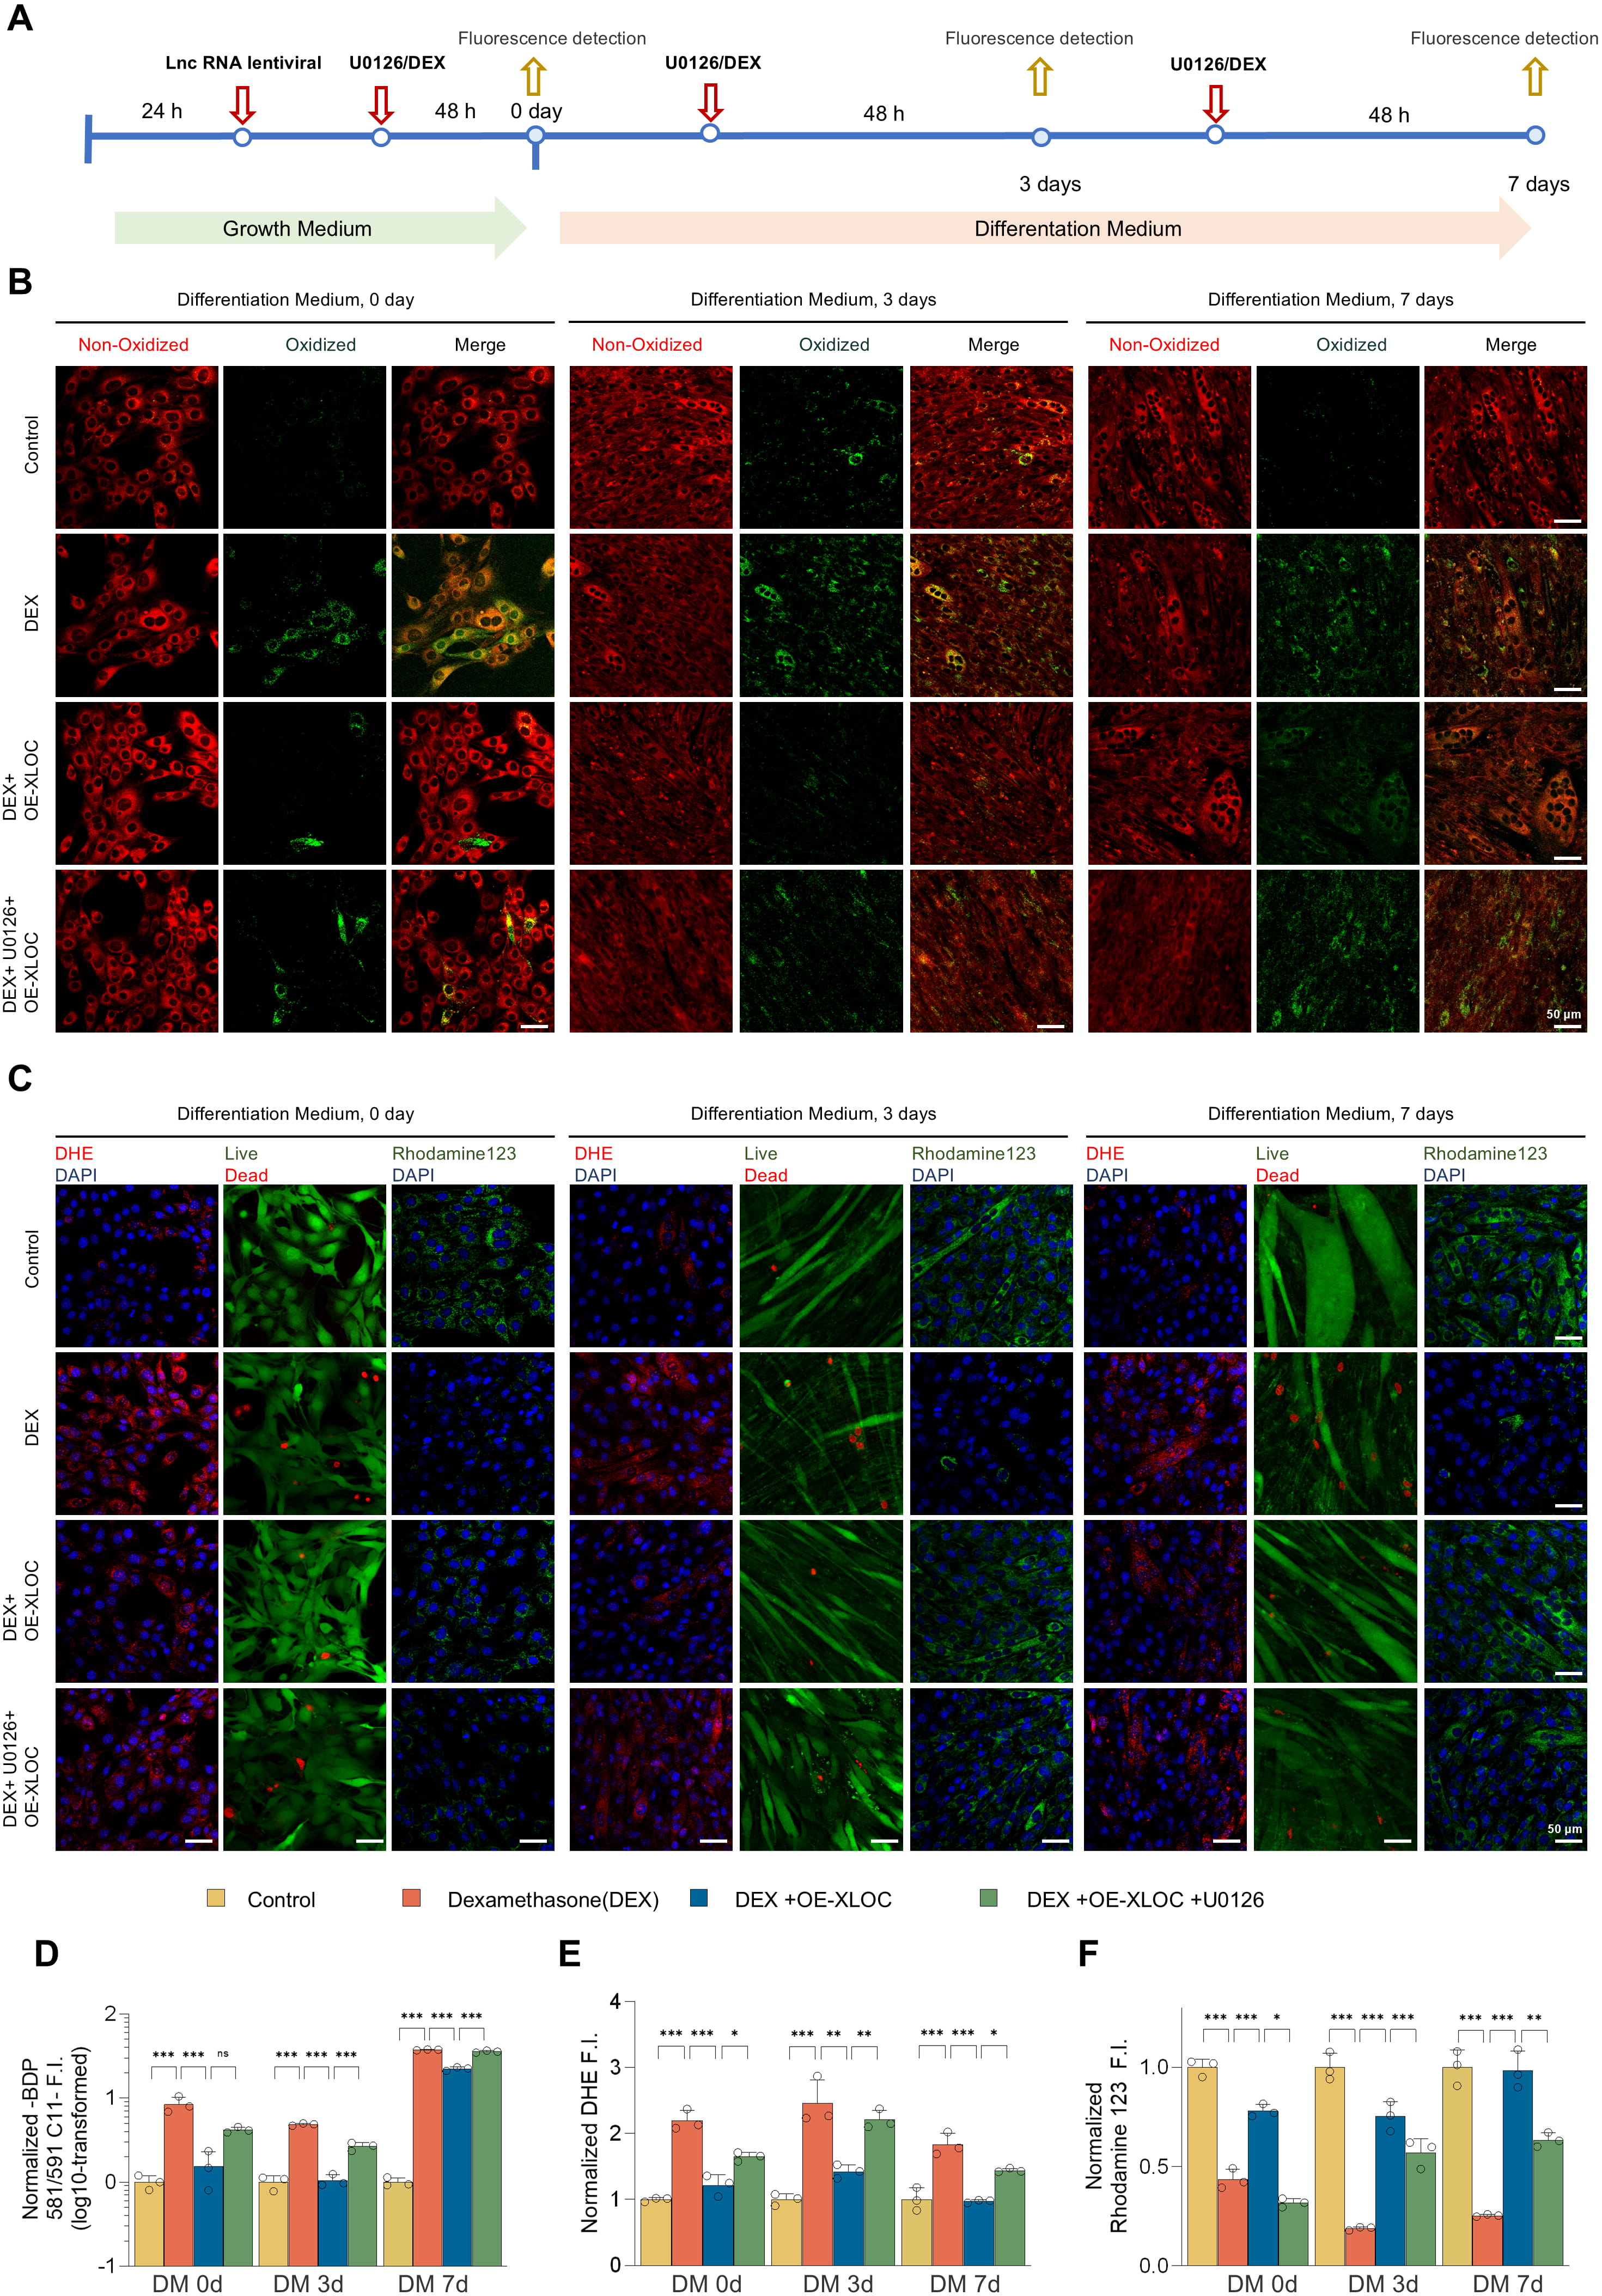 Fig. 6.
XLOC protects myogenic cells by regulating oxidative stress and
mitochondrial function, reversing DEX-induced oxidative damage. (A) Experimental
schematic for the oxidative stress and mitochondrial function assays in OE-XLOC
and control C2C12 stable lines with or without dexamethasone (DEX) and MEK
inhibitor U0126 treatments and at days 0, 3 and 7 of differentiation. (B)
Oxidative-reductive fluorescent marker (BDP 581/591 C11) images showing the
distribution of oxidized probe (green) and unreacted probe (red) within cells.
DEX significantly increased oxidative signals, while OE-XLOC enhanced reductive
signals. U0126 partially reversed the protective effects of OE-XLOC (scale bar =
50 µm). (C) Fluorescent images of DHE staining (red indicates reactive
oxygen species), live/dead cell staining (Calcein-AM/PI; green for live cells,
red for dead cells), and Rhodamine 123 (green indicates MMP). DEX significantly
increased DHE signals, impaired MMP, and enhanced cell death. OE-XLOC reduced the
DHE signal, partially restored Rhodamine 123 fluorescence, and improved
viability. U0126 partially reversed these effects (scale bar = 50 µm). (D)
Quantification of the redox fluorescence intensity ratios (green-to-red) shows
DEX-induced oxidative signals. OE-XLOC reduced oxidative signals and enhanced
reductive signals, which was partially counteracted by U0126. (E) Quantification
of DHE-positive fluorescence intensity indicates that DEX increased oxidative
stress levels, while OE-XLOC significantly reduced DHE signals. U0126 treatment
partially reversed the antioxidant effects of OE-XLOC. (F) Quantification of
Rhodamine 123 fluorescence intensity showed that DEX impaired mitochondrial
function, while OE-XLOC improved the stability of MMP. U0126 partially inhibited
the protective effects of OE-XLOC. Data are presented as the mean
Further analysis using DHE staining, Calcein-AM/PI double staining, and MMP (Rhodamine 123) assays allowed in-depth evaluation of the mechanisms by which XLOC_015548 modulates myogenic differentiation. DEX treatment was found to significantly increase DHE fluorescence intensity, impair MMP, and increase the cell death rate. In contrast, OE-XLOC cells showed a marked reduction in DHE-positive signals, partial recovery of MMP, and decreased cell death. However, the protective effects of OE-XLOC were attenuated by U0126 treatment, further confirming the critical role of the MEK/ERK signaling pathway in XLOC_015548-mediated regulation of oxidative stress and mitochondrial function (Fig. 6C,E,F; Supplementary Fig. 11A,B).
In summary, XLOC_015548 mitigates oxidative stress and maintains the stability of MMP, thus exerting significant protective effects during myogenic differentiation. It effectively counteracts DEX-induced oxidative damage, providing strong theoretical support for the therapeutic potential of XLOC_015548 in muscle atrophy-related diseases and highlighting its potential as a novel therapeutic target.
This study found that XLOC_015548 mitigates denervation-induced skeletal muscle atrophy through multiple mechanisms, including regulation of Gadd45g expression, enhancement of p-ERK nuclear localization, reduction of oxidative stress, and promotion of myogenic differentiation. A skeletal muscle-specific conditional overexpression mouse model (XLOC_015548cKI/+; iCre⁺) was observed to retain muscle mass and CSA compared to control mice (XLOC_015548cKI/+; iCre⁻) on day 14 post-sciatic nerve transection (Fig. 7A–D). IHC analysis confirmed that XLOC_015548 significantly downregulated Gadd45g expression under denervation conditions. Although the overall levels of p-MEK/MEK and p-ERK/ERK remained the same on day 14 post-denervation (Fig. 7E,G), p-ERK nuclear localization was enhanced in XLOC_015548cKI/+; iCre⁺ mice, suggesting a role in optimizing the myogenic environment during later stages of denervation (Fig. 7F). Additionally, XLOC_015548 overexpression upregulated the expression of the myogenic regulator MyoD in denervated skeletal muscle (Fig. 7E,G), further highlighting its critical role in promoting myogenic differentiation. Collectively, these findings indicate that XLOC_015548 can alleviate denervation-induced muscle atrophy through regulation of Gadd45g/ERK signaling, and promotion of myogenic differentiation.
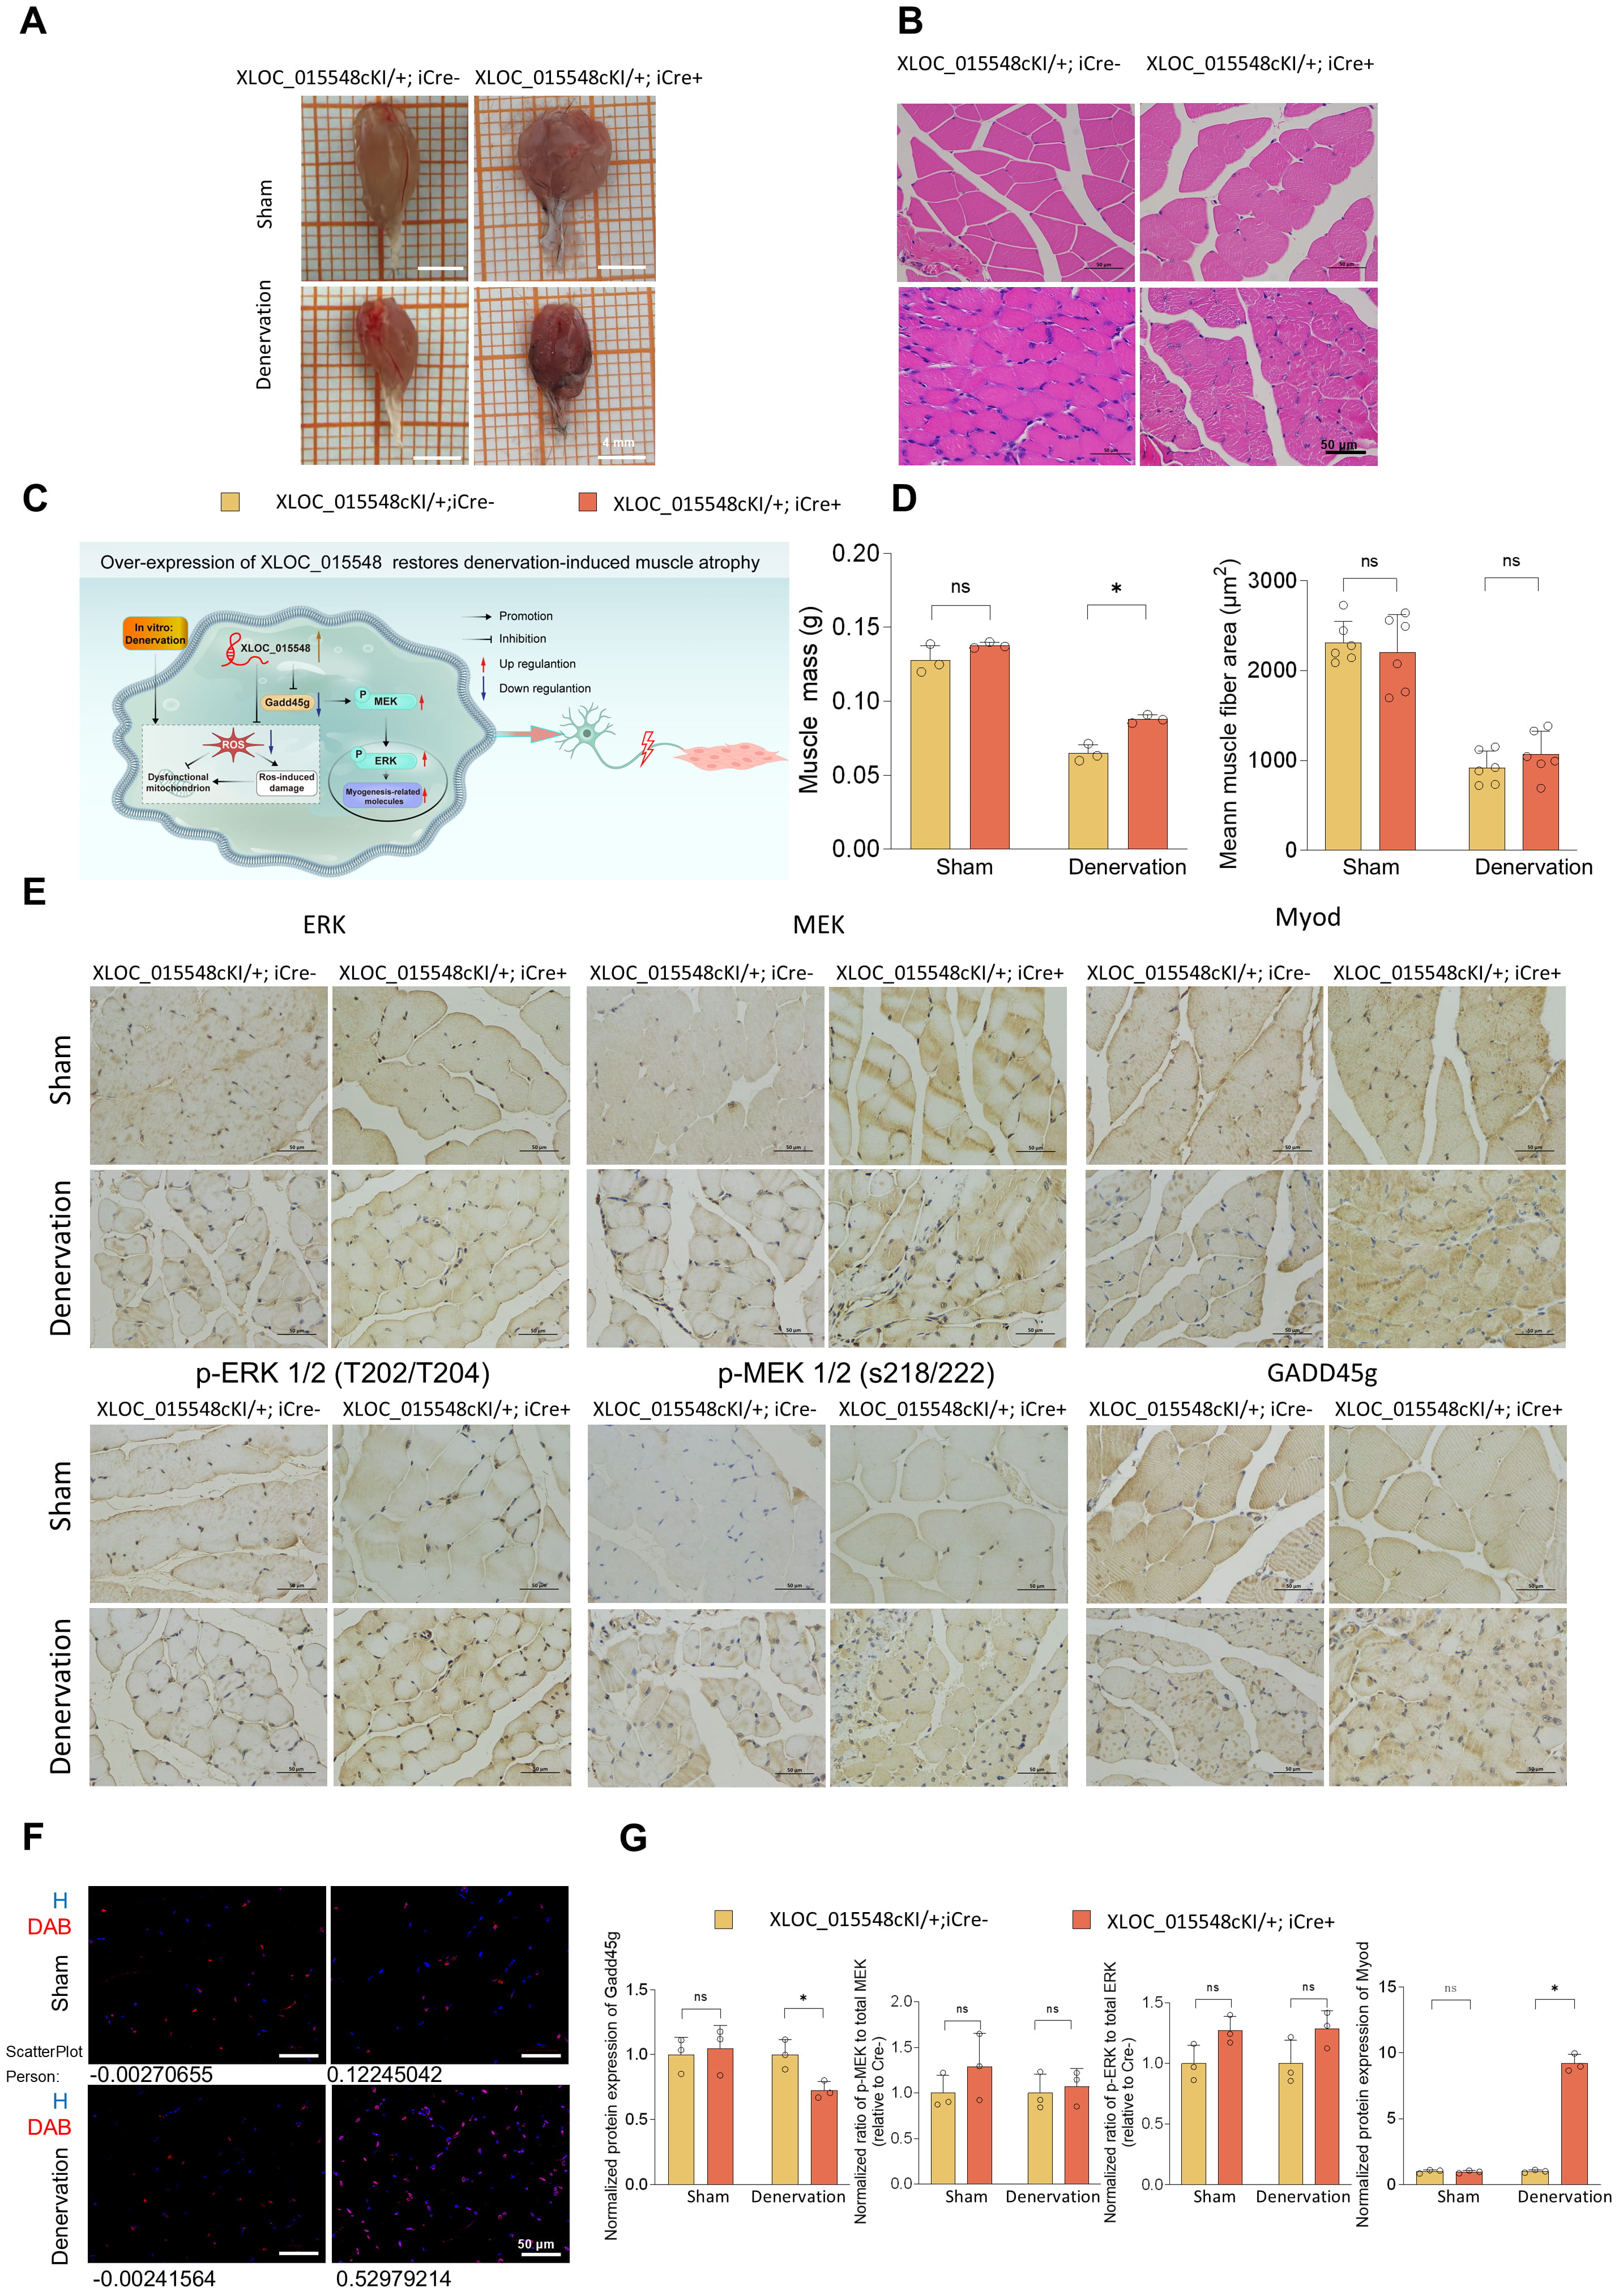 Fig. 7.
XLOC_015548 overexpression alleviates
denervation-induced muscle atrophy in conditional overexpression mice. (A)
Representative images of gastrocnemius muscles from conditional
XLOC_015548 overexpression mice (XLOC_015548cKI/+; iCre⁺ ) and
control mice (XLOC_015548cKI/+; iCre⁻) under sham and denervation
conditions (scale bar = 4 mm). (B) H&E staining highlights muscle fiber
morphology and structural differences. Denervated mice in the Cre⁻ group exhibit
fiber atrophy, whereas the Cre⁺ group demonstrate tighter fiber alignment and
larger cross-sectional areas (CSA) (scale bar = 50 µm). (C) Schematic
illustration of the potential mechanism for XLOC_015548 in mitigating
denervation-induced muscle atrophy and promoting regeneration by regulating
Gadd45g expression and MEK/ERK pathway activity. (D) Quantitative analyses of
muscle mass (g) and average muscle fiber CSA (µm2) show that Cre⁺ mice
exhibit recovery of gastrocnemius muscle mass and CSA under denervation
conditions. Data are presented as the mean
In our previous study, RNA-seq analysis of differentially expressed gene profiles in denervated gastrocnemius muscles of mice revealed significant downregulation of the lncRNA XLOC_015548. Among the potential target genes of this lncRNA, the strongest correlation was found with Gadd45g [33]. Preliminary findings demonstrated that XLOC_015548 promotes C2C12 myogenic differentiation through the MEK/ERK pathway [35]. Building on this foundation, the present study systematically investigated the protective role and underlying mechanism of XLOC_015548 in regulating the Gadd45g/MEK/ERK signaling pathway to promote myogenic differentiation and alleviate muscle atrophy.
Non-coding RNAs were once regarded as “junk sequences” with no functional significance. However, recent research has shown they play crucial roles in regulating gene expression at both the DNA and RNA level [50]. This has sparked growing interest in their potential therapeutic application for skeletal muscle atrophy. Current studies on lncRNA therapies for muscle atrophy are still limited, but several strategies, including LncRNA-Dum-siRNA [22], AAV1-shAtrolnc-1 [24], Linc-smad7 plasmids [25], and Lnc-Myopar plasmids [26], have been validated through intramuscular injection in murine models of denervation, cachexia, and cardiotoxin (CTX)-induced muscle atrophy. Additionally, several studies have utilized gene-edited mouse models [51], such as MDX mice and lncMUMA knock-in mice, to explore lncRNA applications in CTX-induced and hindlimb suspension models [23, 32]. Advances in conditional gene-editing technologies have expanded the tools available for studying lncRNAs. However, only the study by Chen et al. [31] has used conditional knockout animal models to explore the therapeutic potential of lncRNAs. These authors deleted FoxM1 in satellite cells using Pax7-driven Cre recombinase to generate FoxM1-Lnc Snhg8/Gm26917 conditional knockout mice. In this context, the current study is the first to employ skeletal muscle-specific conditional knockout and overexpression mouse models to examine the therapeutic potential of lncRNA XLOC_015548 in muscle atrophy, thus laying the foundation for future lncRNA-targeted therapeutic strategies. While existing studies on lncRNAs primarily focus on transcriptional regulation via chromatin interaction or RNA-protein binding [22, 25], XLOC_015548 exhibits a novel mechanism by spatially regulating its target protein. Specifically, XLOC_015548 shifts the nuclear-to-cytoplasmic distribution of Gadd45g, allowing the same protein to exert opposing roles: cytoplasmic Gadd45g activates MEK/ERK to promote differentiation, whereas nuclear Gadd45g induces differentiation arrest. This spatial control of protein localization represents a previously unrecognized regulatory strategy among lncRNAs in muscle biology.
To elucidate the mechanisms by which XLOC_015548 regulates the Gadd45g/MEK/ERK pathway, we utilized a DEX-induced in vitro model, and an in vivo sciatic nerve transection-induced denervation model. DEX significantly activates protein degradation pathways by upregulating E3 ubiquitin ligases, increasing ROS, and inducing oxidative stress and mitochondrial dysfunction, all of which are pathological hallmarks of muscle atrophy [52]. Additionally, DEX suppresses the expression of myogenic genes such as MyoD, reducing myotube formation [53]. Consequently, DEX is widely used in vitro studies to induce denervation-like muscle atrophy. In the present study, DEX-treated C2C12 cells were used as an in vitro model, and the MEK inhibitor U0126 was used to investigate the regulatory effects of XLOC_015548 on the Gadd45g/MEK/ERK pathway. These experiments provide key insights into the mechanisms that underlie the protective effects of XLOC_015548 against muscle atrophy.
Our findings demonstrate a critical role for XLOC_015548 in promoting myogenic differentiation and alleviating muscle atrophy via the Gadd45g/MEK/ERK pathway. By increasing the cytoplasmic localization of Gadd45g, XLOC_015548 activates the MEK/ERK pathway, thereby exerting multi-layered myogenic regulatory effects at different stages of differentiation. Notably, XLOC_015548 diverges from canonical lncRNA mechanisms in two key aspects: First, its regulation of Gadd45g subcellular localization—rather than transcriptional control—represents an innovative paradigm for lncRNA function, as most reported lncRNAs directly modulate gene expression [26]. Second, the conditional mouse models used here overcome limitations of traditional approaches [24], enabling tissue-specific validation of lncRNA therapeutic effects with minimal off-target interference. These advances position XLOC_015548 as both a mechanistic outlier and a translational benchmark in the lncRNA field.
Gadd45g has a dual role in muscle protection and differentiation depending on its subcellular localization. Specifically, in the OE-XLOC group, the nuclear-to-cytoplasmic ratio of Gadd45g decreased, and the relative content in the cytoplasm increased, further promoting myotube formation and myogenic differentiation by activating the Raf/MEK/ERK pathway [54]. In contrast, in the D-XLOC group, the nuclear-to-cytoplasmic ratio of Gadd45g increased, and Gadd45g in the nucleus may impede differentiation through mechanisms such as DNA repair [55], oxidative stress [44, 56], and apoptosis regulation [57, 58] that hinder the differentiation process and exacerbate muscle atrophy [59, 60]. These findings are consistent with previous studies on the roles of Gadd45a and Gadd45b in muscle development and atrophy [41, 61, 62]. The use of IF in the present study further confirmed that XLOC_015548 effectively modulates myogenic differentiation by altering the distribution of Gadd45g between the cytoplasm and nucleus. These results suggest that nuclear Gadd45g regulates apoptosis and differentiation arrest under stress conditions to exacerbate muscle atrophy [57, 58, 59, 60].
Overexpression of XLOC_015548 significantly reduced total Gadd45g protein levels, whereas knockdown of XLOC_015548 led to Gadd45g accumulation. Despite the significant changes in total protein levels, the functional phenotype changes were primarily driven by the redistribution of Gadd45g between the nucleus and cytoplasm. Specifically, although overexpression of XLOC_015548 lowered total Gadd45g levels, the localization of Gadd45g in the cytoplasm still activated the MEK/ERK pathway and promoted myotube differentiation. In contrast, knockdown of XLOC_015548 resulted in elevated total Gadd45g levels; however, the enhanced nuclear localization of Gadd45g likely hindered the differentiation process. Thus, the regulation of subcellular localization emerges as the primary determinant of function. To further validate this, Western blot analysis of nuclear-cytoplasmic fractionation confirmed the effect of XLOC_015548 on the nuclear localization of Gadd45g. Taken together, XLOC_015548 cooperatively regulates both the total protein levels and subcellular localization of Gadd45g, with localization changes serving as the main determinant of the differentiation phenotype.
Additionally, the dynamic regulation of p-ERK plays a central role during different stages of differentiation. In the early stage (DM d0), p-ERK nuclear translocation enhances C2C12 cell proliferation and activity. During the intermediate stage (DM d3), G1 phase arrest facilitates cell cycle exit and entry into differentiation, while early apoptosis of unfused cells optimizes the myogenic environment. In the late stage (DM d7), sustained MEK/ERK activity drives differentiation to completion. Interestingly, during the initial phase of myotube synthesis (DM d1), MEK inhibition by U0126 alleviated the suppression of myogenesis initiation mediated by MEK/ERK and activated muscle-specific gene expression. This aligns with previous findings that p-ERK exerts inhibitory effects on myogenic differentiation during the early stage (DM d0–d1) [63, 64]; however, during myotube formation (DM d2–d3), endogenous MEK/ERK activation is essential for both myogenesis and cell fusion [64]. Sustained ERK activity plays a critical role in supporting normal myotube formation and cell fusion [42, 65, 66, 67].
Both in vitro and in vivo experiments validated the critical role of dynamic p-ERK regulation in mitigating muscle atrophy. In the DEX-induced model, XLOC_015548 overexpression increased myotube diameter and reduced oxidative stress markers, with p-ERK nuclear translocation promoting cell repair. The nuclear localization of p-ERK further confirmed its role in promoting cell repair. Cells with nuclear p-ERK may temporarily exit the differentiation process but optimize the differentiation microenvironment by activating DNA repair and autophagy pathways to clear damaged organelles [68, 69]. In denervation models, XLOC_015548 overexpression improved fiber diameter, potentially through DNA repair and organelle clearance mechanisms induced by nuclear p-ERK [70, 71].
Finally, this study highlighted the protective roles of XLOC_015548 against oxidative stress and mitochondrial dysfunction during myogenic differentiation. XLOC_015548 overexpression reduced ROS levels and lipid peroxidation, while preserving mitochondrial function in vitro. These protective effects may be mediated through the regulation of Gadd45g and the nuclear distribution of ERK. While ERK signaling is a well-established pathway for mitigating oxidative damage [72]. These findings highlight the essential role of XLOC_015548 in regulating Gadd45g and MEK/ERK signaling to counteract oxidative stress and muscle dysfunction.
Although this study elucidated the protective roles of XLOC_015548, its interactions with other MAPK pathways remain unclear. The precise molecular mechanisms underlying the regulation of Gadd45g expression by XLOC_015548 warrant further investigation. Future studies that leverage gene-editing and high-throughput omics technologies may reveal the upstream and downstream regulatory networks of XLOC_015548, providing novel directions and targets for treating muscle atrophy. Notably, XLOC_015548 demonstrates promising clinical translational potential as an RNA therapeutic target. Its muscle-specific effects, validated in conditional models, suggest that RNA-based strategies—such as antisense oligonucleotides (ASOs) or small activating RNAs (saRNAs)—could therapeutically augment XLOC_015548 expression to combat atrophy [73]. Importantly, muscle-targeted delivery systems, including adeno-associated virus (AAV) vectors with tissue-specific promoters or lipid nanoparticles [74, 75], may address current challenges in lncRNA delivery. Compared to conventional kinase inhibitors with broad activity, the stage-specific regulation of MEK/ERK by XLOC_015548 may minimize off-target effects, thereby offering a safer therapeutic approach. Additionally, lncRNA-based therapies face challenges such as specific delivery, long-term safety, and off-target effects. Advances in CRISPR technology could facilitate further exploration of delivery methods, as well as validation in other atrophy models, such as age-related muscle wasting and cancer cachexia.
XLOC_015548 exerts significant protective effects by regulating the cytoplasmic localization of Gadd45g, activating the MEK/ERK pathway, and maintaining redox homeostasis and mitochondrial function. By employing skeletal muscle-specific conditional knockout and overexpression models, this study systematically validated the therapeutic potential of XLOC_015548 in both in vitro and in vivo models of muscle atrophy. These findings deepen our understanding of muscle atrophy mechanisms, and provide a foundation for lncRNA-based therapeutic strategies that can target muscle disorders.
Gadd45g, DNA damage-inducible protein 45 gamma; MEK, Mitogen-activated protein kinase kinase; ERK, Extracellular signal-regulated kinase; p-MEK, Phosphorylated mitogen-activated protein kinase kinase; p-ERK, Phosphorylated extracellular signal-regulated kinase; MHC, Myosin heavy chain; DEX, Dexamethasone; ROS, Reactive oxygen species; EdU, 5-Ethynyl-2′-deoxyuridine; DM, Differentiation medium; IHC, Immunohistochemistry; DAB, Diaminobenzidine; H, Hematoxylin; WB, Western blot.
All data reported in this paper will be shared by the corresponding author upon reasonable request.
JW and HZ conceptualized and designed the study. TTQ and YQC conducted the research and performed data analysis. HTQ, ZMZ, PL, and FY provided critical assistance and guidance for the animal experiments. TTQ drafted the manuscript, and FY critically revised it for significant intellectual content. All authors contributed to editorial changes in the manuscript. All authors read and approved the final manuscript. All authors have participated sufficiently in the work and agreed to be accountable for all aspects of the work.
All animal-related experiments in this study were conducted in compliance with ethical standards. The experimental protocols were reviewed and approved by the Ethics Committee of Shenzhen Top-Biotech Co., Ltd. under the approval number TOP-IACUC-2024-0060. All procedures adhered to the Guide for the Care and Use of Laboratory Animals established by the National Research Council, ensuring the humane treatment and welfare of the animals used in the research.
Not applicable.
This research was supported by grants from National Natural Science Foundation of China (No. 82001319; No. 82102568; No. 82172432), Shenzhen Key Medical Discipline Construction Fund (No. SZXK023), Sanming Project of Medicine in Shenzhen (No. SZSM202211038), Shenzhen Science and Technology Program (No. JCYJ20220531094406015), Guangdong Basic and Applied Basic Research Foundation (No. 2022A1515220111) and The Scientific Research Foundation of PEKING UNIVERSITY SHENZHEN HOSPITAL (No. KYQD2021099).
The authors declare no conflict of interest.
Supplementary material associated with this article can be found, in the online version, at https://doi.org/10.31083/FBL36233.
References
Publisher’s Note: IMR Press stays neutral with regard to jurisdictional claims in published maps and institutional affiliations.