


1 Hepatobiliary Surgery Department, Nantong First People’s Hospital, 226000 Nantong, Jiangsu, China
Abstract
To identify potential prognostic biomarkers and uncover new mechanisms underlying hepatocellular carcinoma (HCC).
HCC is a prevalent and fatal malignancy originating from hepatic cells, with a consistently rising incidence in recent decades. Objective: To identify potential prognostic biomarkers, specifically focusing on the role of PAK1-interacting protein 1 (PAK1IP1), and to uncover novel mechanistic insights in HCC.
HCC-related datasets (GSE45267 and GSE49515) and data from The Cancer Genome Atlas (TCGA) were retrieved for the analysis of differentially expressed genes (DEGs). The common DEGs were subsequently subjected to weighted gene co-expression network analysis (WGCNA), protein-protein interaction network (PPI), risk model, expression, survival, and prognostic nomogram to determine key genes associated with HCC. Further, the key gene was analyzed using clinical feature analysis, immunoassay, and cell experiments to investigate its exact role in HCC.
Based on the above comprehensive analysis, we targeted the key gene PAK1IP1 with a good prognostic value in HCC. PAK1IP1 showed a remarkably higher increase in tumor samples than in normal samples, which might be related to immune cell infiltration in liver cancer. It was up-regulated in HCC cells, and its knockdown could suppress HCC proliferation and migration. Besides, enzyme-linked immunosorbent assay (ELISA) showed that PAK1IP1 could regulate lipopolysaccharide (LPS)—induced pyroptosis of HCC cells. Knocking down PAK1IP1 could lead to increased expression of caspase 3 (CASP-3), gasdermin E (GSDME)-N, cleaved caspase-1, and gasdermin-D (GSDMD)-N in HCC cells, inducing pyroptosis, thereby inhibiting the development of HCC.
To summarize, PAK1IP1 was identified as a promising prognostic biomarker, and the knockdown of PAK1IP1 can induce pyroptosis to suppress HCC development, which sheds new light on HCC tumorigenesis.
Keywords
- hepatocellular carcinoma
- pyroptosis
- PAK1IP1
- CASP-3
- Z-DEVD-FMK
- prognostic biomarkers
Liver cancer, or hepatocellular carcinoma (HCC), is a prevalent and fatal malignancy originating from hepatic cells [1]. Its incidence has shown a consistent rise in recent decades, making it one of the most common malignancies to be diagnosed globally [2]. The current treatment options for HCC encompass surgical intervention, chemotherapy, radiation therapy, targeted therapy, and immunotherapy [3]. The appropriate treatment modality is up to the cancer stage, overall health status, liver function, and other factors [4]. Despite the availability of several therapeutic options, the 5-year survival rate for individuals with HCC is still poor, at about 18%. Thus, developing a reliable prognostic model that integrates clinical, laboratory, and molecular biomarkers is crucial for guiding the clinical management of HCC patients [5]. Prognostic factors commonly employed in HCC encompass clinical parameters, laboratory data, radiological findings, and molecular biomarkers [6]. With the advancement of artificial intelligence and machine learning, numerous studies have focused on constructing predictive models to enhance the accuracy of prognostic predictions, which holds great promise in providing valuable insights for the customized therapy of HCC patients.
Pyroptosis was initially discovered in the 1970s [7]. It is a form of programmed
cell death (PCD) characterized by cellular swelling, culminating in cell membrane
rupture and the release of cellular contents, thereby inciting a robust
inflammatory response [8]. This process of inflammatory cell death, also known as
cellular inflammatory necrosis, plays a pivotal role in tumor suppression by
stimulating anti-tumor immune responses. Pyroptosis is orchestrated by activating
the inflammasome upon sensing endogenous danger signals or environmental stimuli,
which recruits and activates caspase (CASP) [9]. Activated caspase has a dual role; it
not only cleaves and activates inflammatory factors such as interleukin (IL)-18
and IL-1
In this comprehensive study, we employed a combination of computational and experimental approaches to investigate HCC. Initially, we curated and analyzed datasets from Gene Expression Omnibus (GEO) and the cancer genome atlas (TCGA), utilizing bioinformatics tools to determine key prognostic genes related to HCC. Subsequently, we developed a prognostic risk model and prognostic nomogram to evaluate gene clinical significance. In addition, we employed thorough analyses of clinical features and immune profiles to explore a comprehensive knowledge of these key genes in liver cancer. Subsequently, we conducted cell experiments to investigate the mechanisms by which these key genes, as well as pyroptosis-related genes, regulate the development of HCC. Overall, this research contributed to a new understanding of HCC and offered potential targets for clinical applications, offering promising avenues for improved diagnosis and treatment strategies in the field of HCC.
We obtained 371 Liver hepatocellular carcinoma (LIHC) samples and 50 normal samples from TCGA. Additionally, we downloaded two publicly available datasets GSE45267 and GSE49515 from GEO (https://www.ncbi.nlm.nih.gov/geo/). Raw data from TCGA and GEO were preprocessed using the “affy” and “limma” packages in R software. Patients’ Clinical information, including age, sex, stage, and survival data, was extracted from the TCGA database (https://portal.gdc.cancer.gov/).
Differentially expressed genes (DEGs) identification was screened on three datasets: GSE45267, GSE49515 and TCGA. Venn diagrams were used to identify overlapping up-and-down-regulated genes. WGCNA is a powerful bioinformatics tool that can identify groups of highly related genes and their relationship to phenotypic traits. We utilized WGCNA to analyze the overlapping genes to determine key module for the following analysis.
Next, Gene Ontology (GO) and Kyoto Encyclopedia of Genes and Genomes (KEGG)
analysis were conducted. p
Least Absolute Shrinkage and Selection Operator (LASSO) regression analysis was
conducted on the 75 node genes screened out by the MCODE algorithm, and the
minimum lambda value (lambda. min = 0.0166) was selected in this study. A risk
score was determined for each TCGA-HCC tumor sample to create a prognostic risk
model. We created scatterplots and heatmaps of gene expression for the risk model
and identified 26 significant genes. The TCGA samples were split into high- (n =
185) and low-risk (n = 185) groups according to the average risk score, and the
Kaplan-Meier database performed the overall survival (OS) analyses. The risk
score formula was as follows: Riskscore = (–0.0199)
First, we obtained gene data from TCGA, GSE45267 and GSE49515 datasets, respectively. Then, univariate Cox regression analysis was employed to determine the most critical prognostic genes. Following the identification of potential prognostic genes, we employed a batch survival analysis to evaluate their collective impact on patient survival. For this purpose, we utilized the Kaplan-Meier estimator, a non-parametric statistic, to estimate the survival function from lifetime data. The patient cohort was divided into high and low-expression groups based on the median expression level of each gene.
The Cox proportional hazards model is a widely applied statistical method for survival analysis, which considers the influence of multiple variables on the survival time of patients. Herein, we applied univariate/multivariate Cox analyses to investigate the prognostic value of 19 genes with significant expression in survival analysis. Multivariate Cox analysis was used to assess the individual prognostic potential of each gene after adjusting for other covariates. Finally, we selected genes substantially related to survival outcomes in univariate and multivariate Cox analyses to construct prognostic nomograms. The nomogram was further validated using a calibration curve.
In this study, we utilized the University of Alabama at Birmingham Cancer (UALCAN) (http://ualcan.path.uab.edu/index.html) database to study the levels and trends of key genes in the clinical characteristics of liver cancer, including age, gender, individual cancer, TP53 mutation and tumor grade. UALCAN is an interactive portal that provides easy access to TCGA data. The immune scores were then further evaluated using immuneDeconv (version 2.0.2; https://github.com/grst/immunedeconv), which uses gene expression data to evaluate the comparative abundance of immune cell types in tumor samples.
American type culture collection (ATCC) provided HCC cell lines (Huh7, Hep3B, HepG2, MHCC97H) and normal liver cells (LO2). HepG2 and MHCC97H were put in RPMI-1640 media with 10% FBS, whereas Huh7 and Hep3B were in Dulbecco’s Modified Eagle Medium/Nutrient Mixture F-12 (DMEM/F12) conditions. 10% FBS was added to DMEM to boost the culture of LO2 cells. Experiments were conducted on cells between passages 3 and 8, and cells were subcultured every three to four days. All cell lines were validated by short tandem repeat (STR) profiling and tested negative for mycoplasma.
We conducted siRNA transfection using Lipofectamine RNAiMAX Transfection Reagent (13778150; Thermo Fisher Scientific, Waltham, MA, USA). Total RNA was collected from the cells 48 hours after transfection by TRIzol reagent (15596018; Invitrogen, Carlsbad, CA, USA). Utilizing the StepOnePlus Real-Time PCR System (4376357; Thermo Fisher Scientific, Waltham, MA, USA) and SYBR Green PCR Master Mix (4309155; Thermo Fisher Scientific, Waltham, MA, USA), qRT-PCR analysis was carried out. The primers for PAK1IP1 were as follows: Forward 5′-AGTTATGCTCAGTTCCAATCCAGT-3′ and Reverse 5′-CAAGGAGGCAGTGTGAGCAT-3′; for GAPDH: Forward 5′-ACAGTCAGCCGCATCTTCTT-3′ and Reverse 5′-GTTAAAAGCAGCCCTGGTGA-3′.
Using RIPA buffer enhanced with protease and phosphatase inhibitors (78430;
Thermo Fisher Scientific, Waltham, MA, USA), total protein was recovered from
cells. The BCA protein assay kit (23225; Thermo Fisher Scientific, Waltham, MA,
USA) was applied to calculate the protein concentration. Electrophoresis was used
to separate equal quantities of protein (20–40 µg) put onto
10–12% SDS-PAGE gels. A wet transfer technique was then employed to transfer
the isolated proteins onto nitrocellulose or PVDF membranes. Membranes were kept
with primary antibodies at 4 °C overnight after being blocked with 3%
BSA in TBST for an hour. Primary antibodies include: PAK1IP1 (Cat No. 16071-1-AP,
1:2000; Proteintech, Wuhan, China), gasdermin E (GSDME) (ab215191, 1:1000; Abcam, Shanghai,
China), Pro-CASP3 (ab32150, 1:1000, Abcam, Shanghai, China), Cleaved-CASP3 (Cat no.
82707-13-RR, 1:5000; Proteintech, Wuhan, China), GSDMD (Cat No. 20770-1-AP,
1:2000; Proteintech, Wuhan, China), GSDMD-N (FNab10690, 1:1000; Wuhan Fine
Biotech Co., Ltd., Wuhan, China), Cleaved-caspase-1 (Cat no. 4199, 1:1000; Cell
signaling Technology, Danvers, MA, USA), GAPDH (ab8245, 1:10000; Abcam, Shanghai,
China) The membranes were TBST-washed before incubation for an hour with
secondary antibodies (ab9482, 1:5000; Abcam, Shanghai, China) that were
HRP-conjugated. An excellent chemiluminescent substrate (ECL) substrate was used to see the protein bands, and imaging
equipment (Model Gel Doc XR+, Hercules, CA, USA) was used to take pictures of
them. To balance the amounts of protein expression, we employed either
5
Cells were put into the upper chamber of a Transwell insert with an 8 µm hole size for the migration test after being suspended in serum-free DMEM. 10% FBS-containing media was put into the bottom chamber. The upper chamber of the Transwell insert had Matrigel (BD Biosciences, San Jose, CA, USA) precoated for use in the invasion experiment. Cells were suspended in serum-free media to seed the upper chamber. 10% FBS-containing media was put into the bottom chamber. The migrating and invading cells were fixed and stained with DAPI. The amount of invading or migrating cells was counted after microscopically (BX51; Olympus, Tokyo, Japan) captured images.
To assess the amounts of IL-1
Various bioinformatics and statistical analysis packages of R language (version
4.1.3; R Foundation for Statistical Computing, Vienna, Austria;
https://www.r-project.org/) were employed, such as edgeR (version 3.9;
http://bioconductor.org/packages/edgeR/), limma (version 4.1;
http://bioconductor.org/packages/limma/), survival (version 3.2.11;
http://CRAN.R-project.org/package=survival), ggplot2 (version 3.5.1;
https://ggplot2.tidyverse.org/), etc. We preprocessed each dataset, including
normalization of gene expression levels and correction for batch effects. For the
screening of DEGs, we applied the edgeR and limma packages to screen for
differentially expressed genes, and set the significance level as FDR
We performed a comprehensive analysis of liver cancer using a multi-database integration. We found 8977 up- and 1001 down-regulated DEGs from the TCGA dataset (Fig. 1A), 4717 up- and 2343 down-regulated DEGs from the GSE45267 dataset (Fig. 1B), and 3442 up and 1682 down-regulated DEGs (Fig. 1C). The Venn diagram revealed 1163 upregulated and 76 downregulated genes at the intersection (Fig. 1D,E). By using WGCNA analysis, we determined a soft threshold power of 1 (Fig. 1F). Two modules were identified based on the clustering dendrogram (Fig. 1G) and measured the relation between module eigengenes (ME) and clinical characteristics; the turquoise module was the key module for subsequent analysis (Fig. 1H).
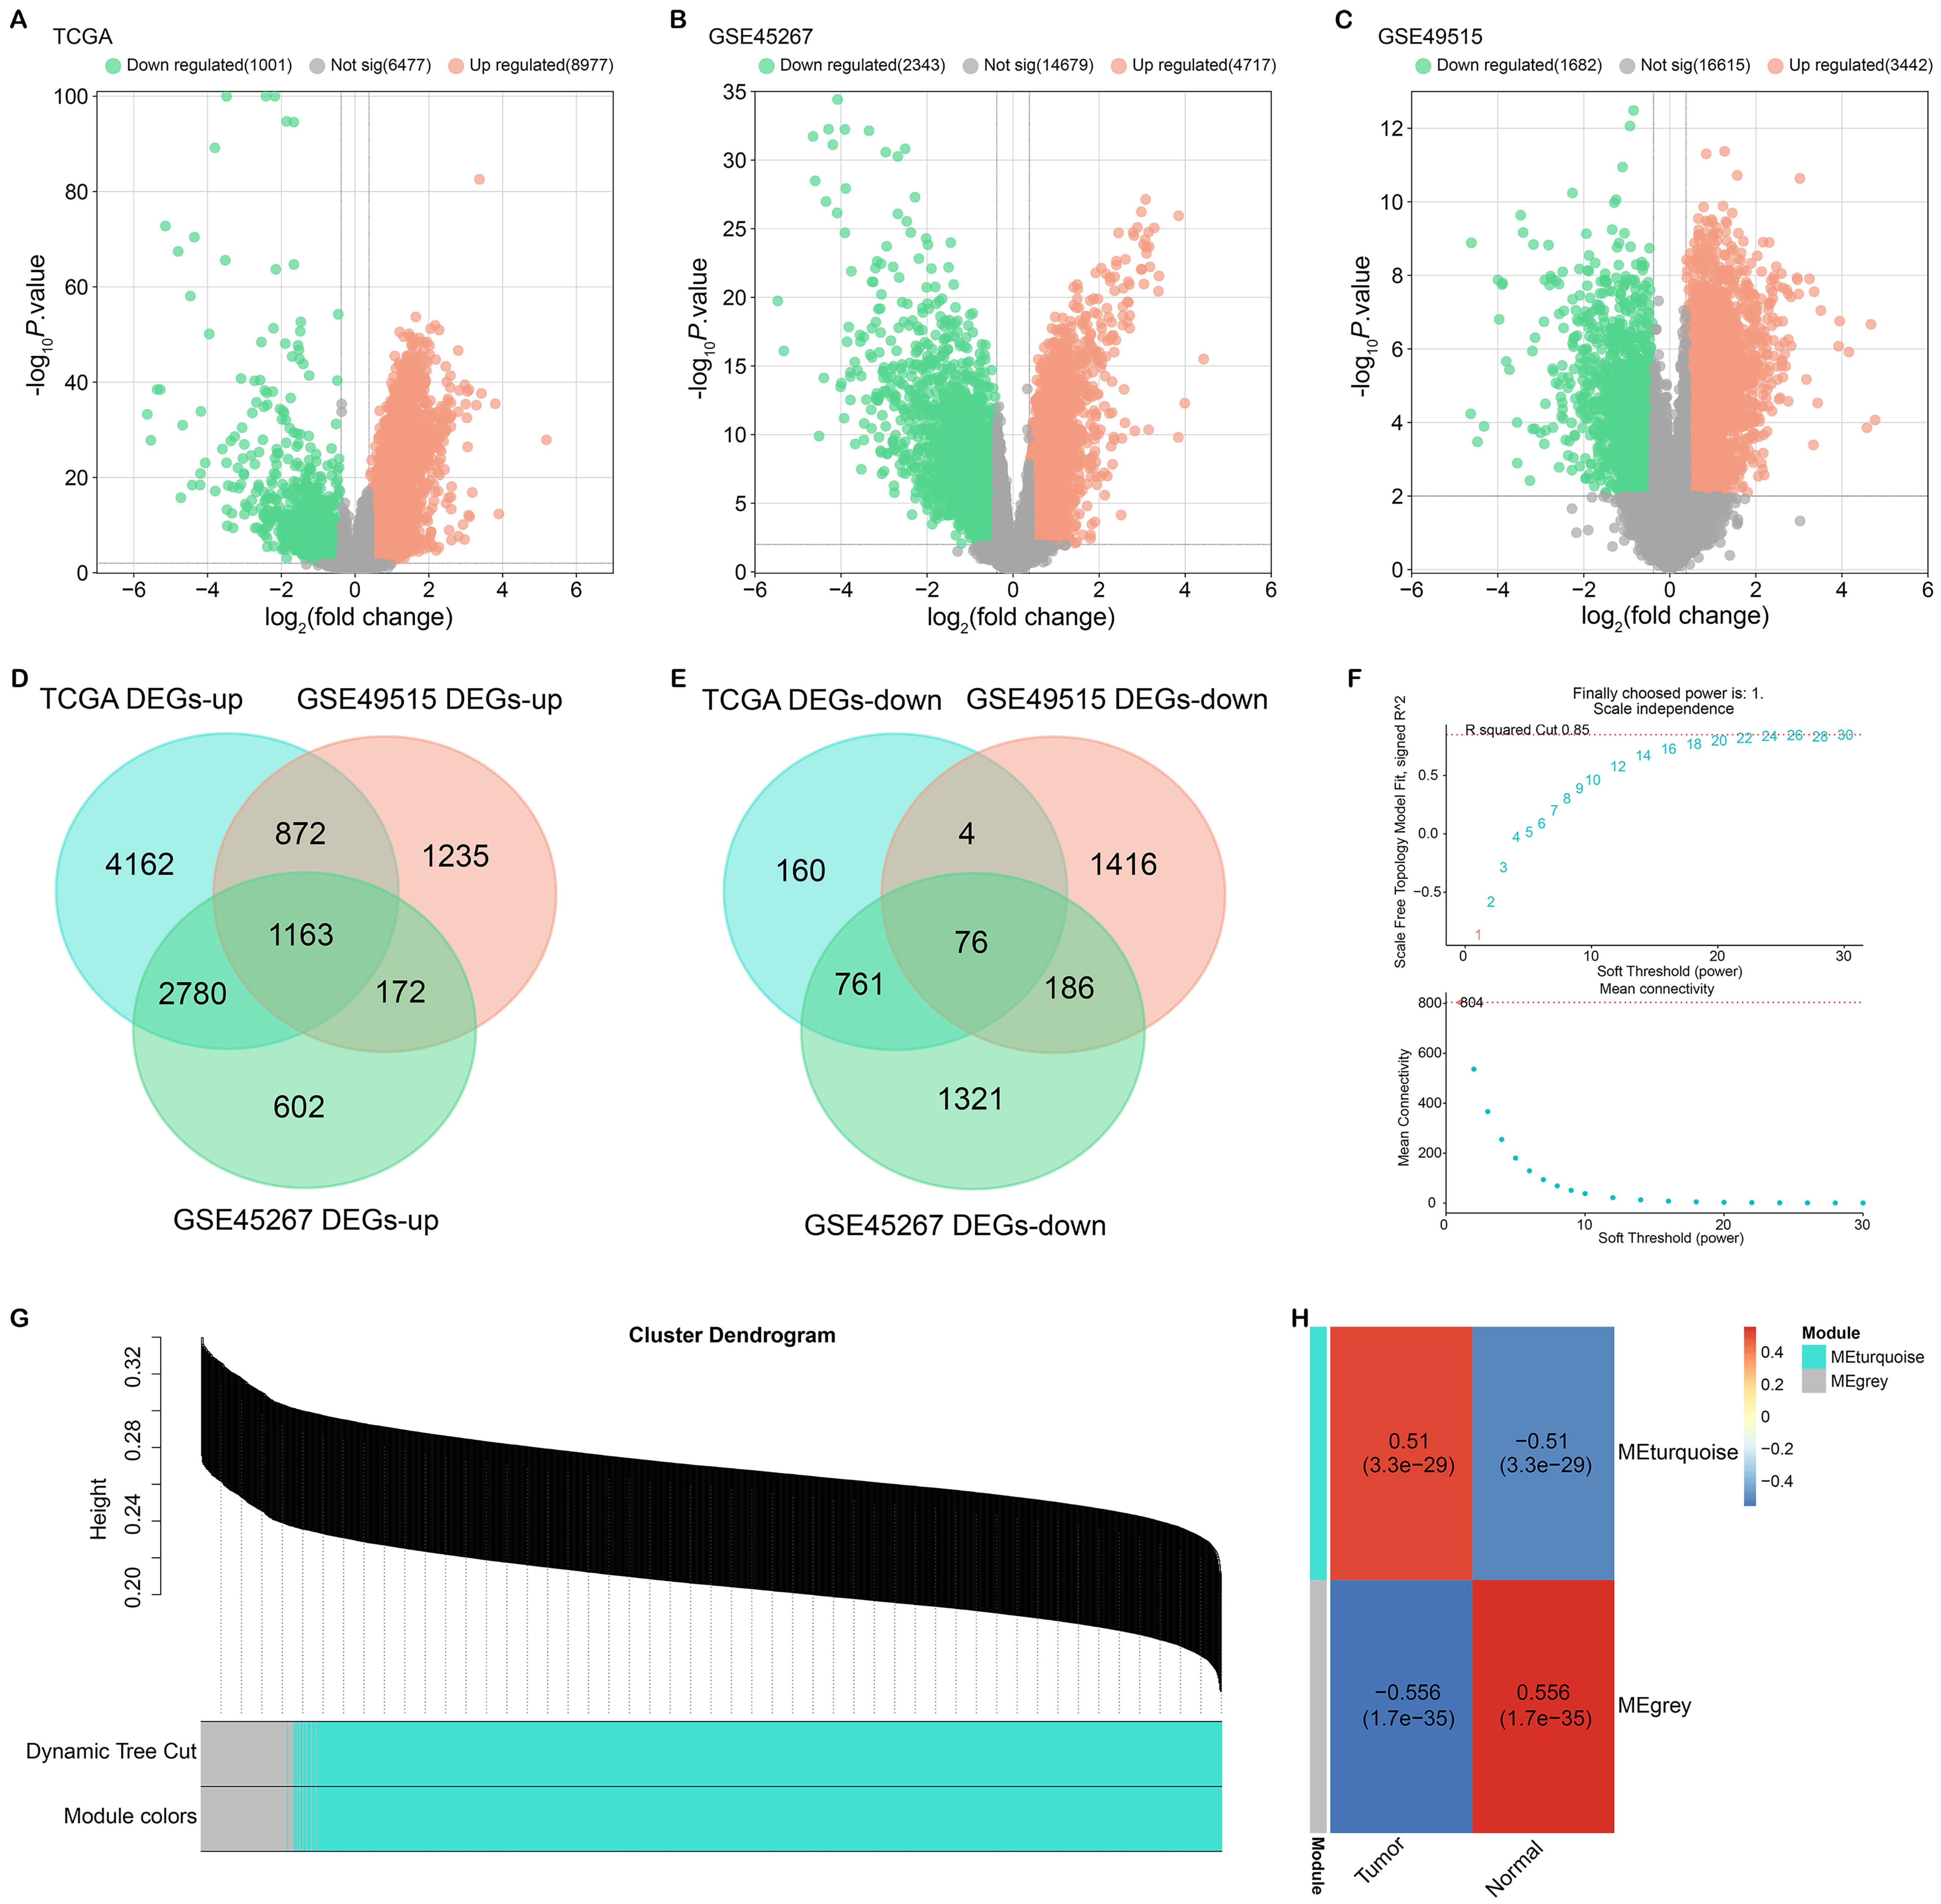 Fig. 1.
Identification and WGCNA analysis of DEGs in liver cancer. (A–C) Volcano plots showing identified DEGs from the TCGA dataset (A), GSE45267 dataset (B) and GSE49515 dataset (C). Orange and green dots represent up-regulated and down-regulated genes, respectively. (D) Venn diagram showing the intersection of upregulated DEGs from the three datasets. (E) Venn diagram showing the intersection of downregulated DEGs from the three datasets. (F) Determination of soft threshold power using WGCNA analysis. (G) Dendrogram of gene clustering in WGCNA analysis, with modules indicated by color. (H) Correlation heatmap showing correlations between modular eigengenes (MEs) and clinical features. The Turquoise module was identified as a key module related to clinical features. WGCNA, weighted gene co-expression network analysis; DEGs, differentially expressed genes.
The genes in the turquoise module were related to the DNA metabolic process, Mitotic spindle organization, and DNA repair (Fig. 2A). Furthermore, enriched pathways included RNA transport, Herpes simplex virus 1 infection, Cell cycle, and DNA replication (Fig. 2B). Additionally, we utilized the MCODE algorithm to analyze the protein-protein interaction (PPI) network of the turquoise module genes. Fig. 2C,D present the PPI networks of the turquoise module genes, highlighting two significant clusters, MCODE Cluster 1 and MCODE Cluster 2, with 30 and 45 nodes and 379 and 247 edges, respectively. These clusters indicate densely interconnected groups of genes within the turquoise module, suggesting their involvement in significant biological pathways or processes crucial to HCC tumorigenesis. The nodes symbolize individual genes, and the edges denote their interactions, with larger nodes reflecting higher connectivity. The distinct structures of these clusters may imply different sub-pathways or mechanisms within HCC-related biological processes, potentially linked to tumor progression or treatment resistance. These figures collectively underscore the complex interplay among the genes in the turquoise module and their probable role in HCC development.
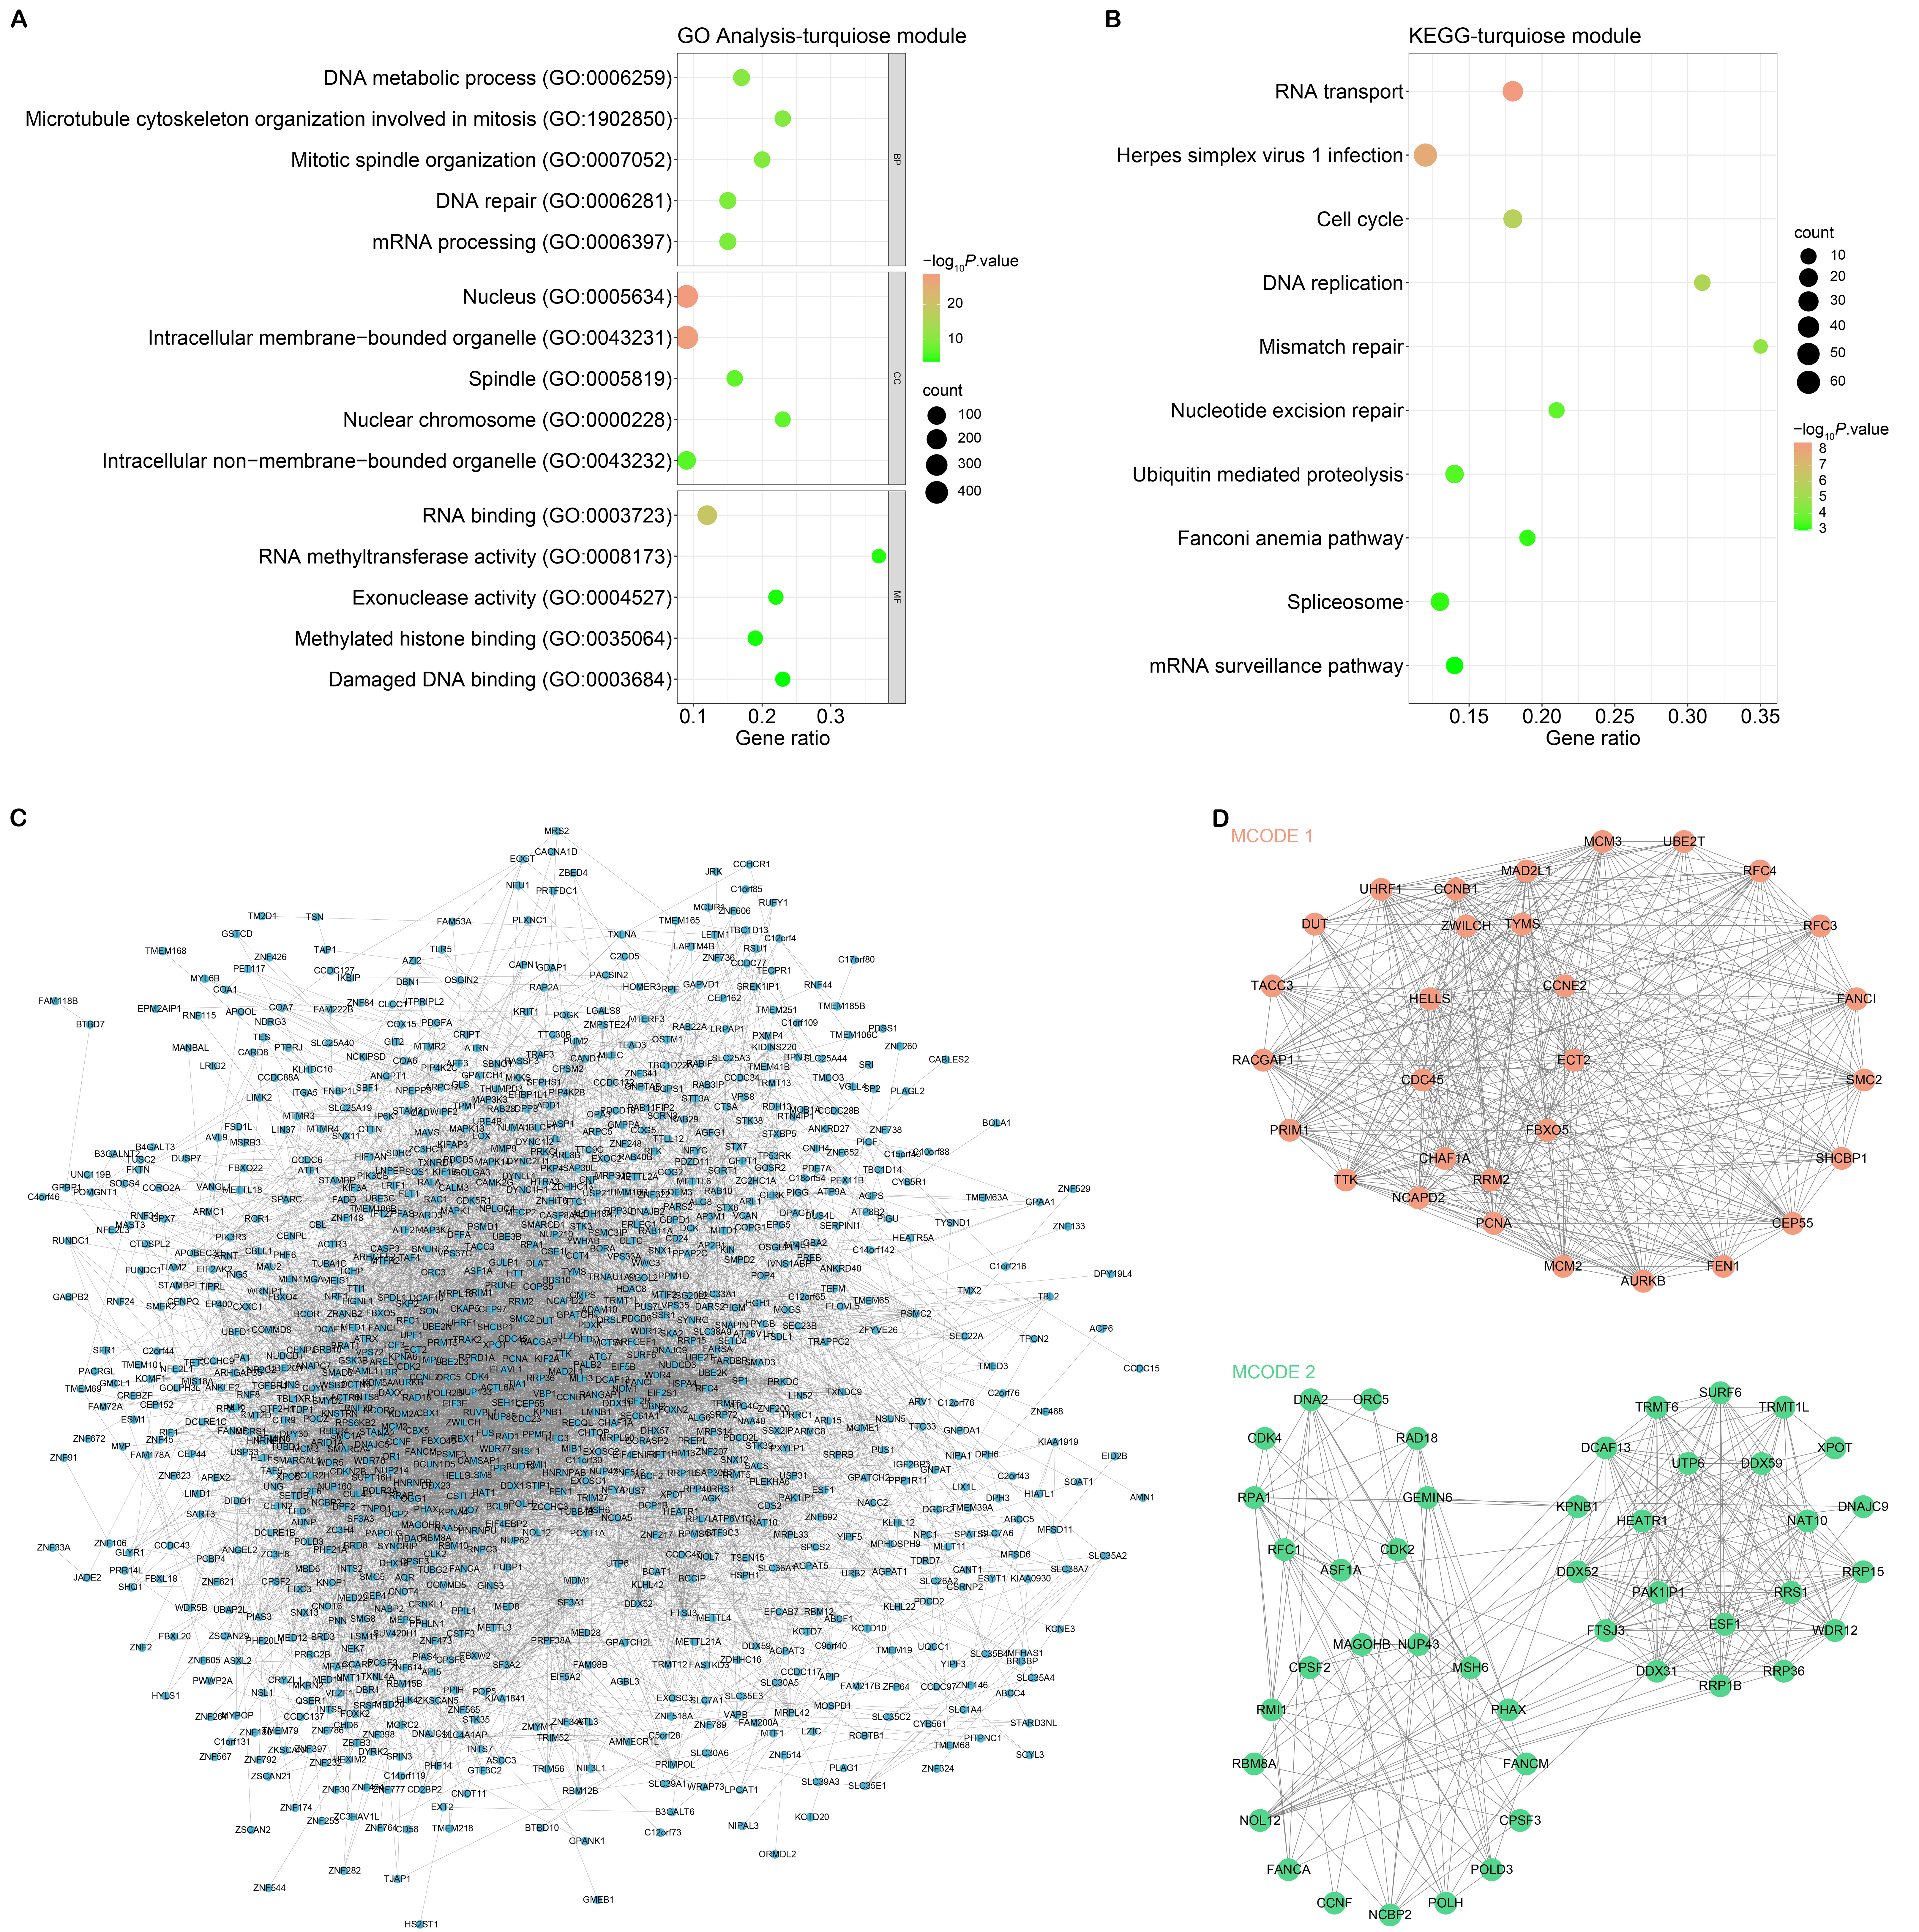 Fig. 2.
GO, KEGG pathway enrichment analysis and MCODE networks of turquoise module genes. (A) GO analysis of turquoise module gene enrichment. The abscissa is the Gene ratio, and the ordinate is the enriched term. (B) KEGG pathway enrichment analysis of turquoise module genes. The abscissa is the Gene ratio, and the ordinate is the enriched pathway. (C) PPI network of turquoise module genes. (D) PPI network of MCODE 1 cluster (orange nodes) and MCODE 2 cluster (green nodes) in turquoise module genes. Nodes in the network represent genes and edges represent protein-protein interactions. The size of the nodes reflects the degree of connectivity of the corresponding genes. GO, gene ontology; KEGG, Kyoto Encyclopedia of Genes and Genomes; MCODE, molecular complex detection; PPI, protein-protein interaction.
Fig. 3A–C collectively illustrate the process of developing a prognostic risk model and the identification of key genes that can predict survival outcomes in liver cancer. Fig. 3A presents the LASSO regression analysis on nodal genes, showing the distribution of coefficients across a range of lambda values, which is a tuning parameter that controls the regularization strength (Fig. 3A). Fig. 3B identifies the optimal lambda.min value through cross-validation, which is 0.0166, minimizing the mean cross-validated prediction error (Fig. 3B). Fig. 3C depicts the risk score distribution and gene expression levels for the 26 prognostic genes, indicating a correlation between gene expression (z-scores) and patient survival status, with higher risk scores being associated with higher mortality rates. The selection of these 26 genes is based on their statistical significance and strong association with patient survival, as determined by the LASSO regression analysis, aiming to provide a more accurate risk assessment for liver cancer patients. In addition, the OS analysis revealed the high-risk group’s survival prognosis was poorer (Fig. 3D). Besides, ROC analysis showed AUC values of 0.858, 0.79, and 0.749 for the first, third, and fifth years, respectively (Fig. 3E). These findings provided valuable insights into HCC prognosis and highlighted the potential clinical utility of the identified prognostic genes and risk models.
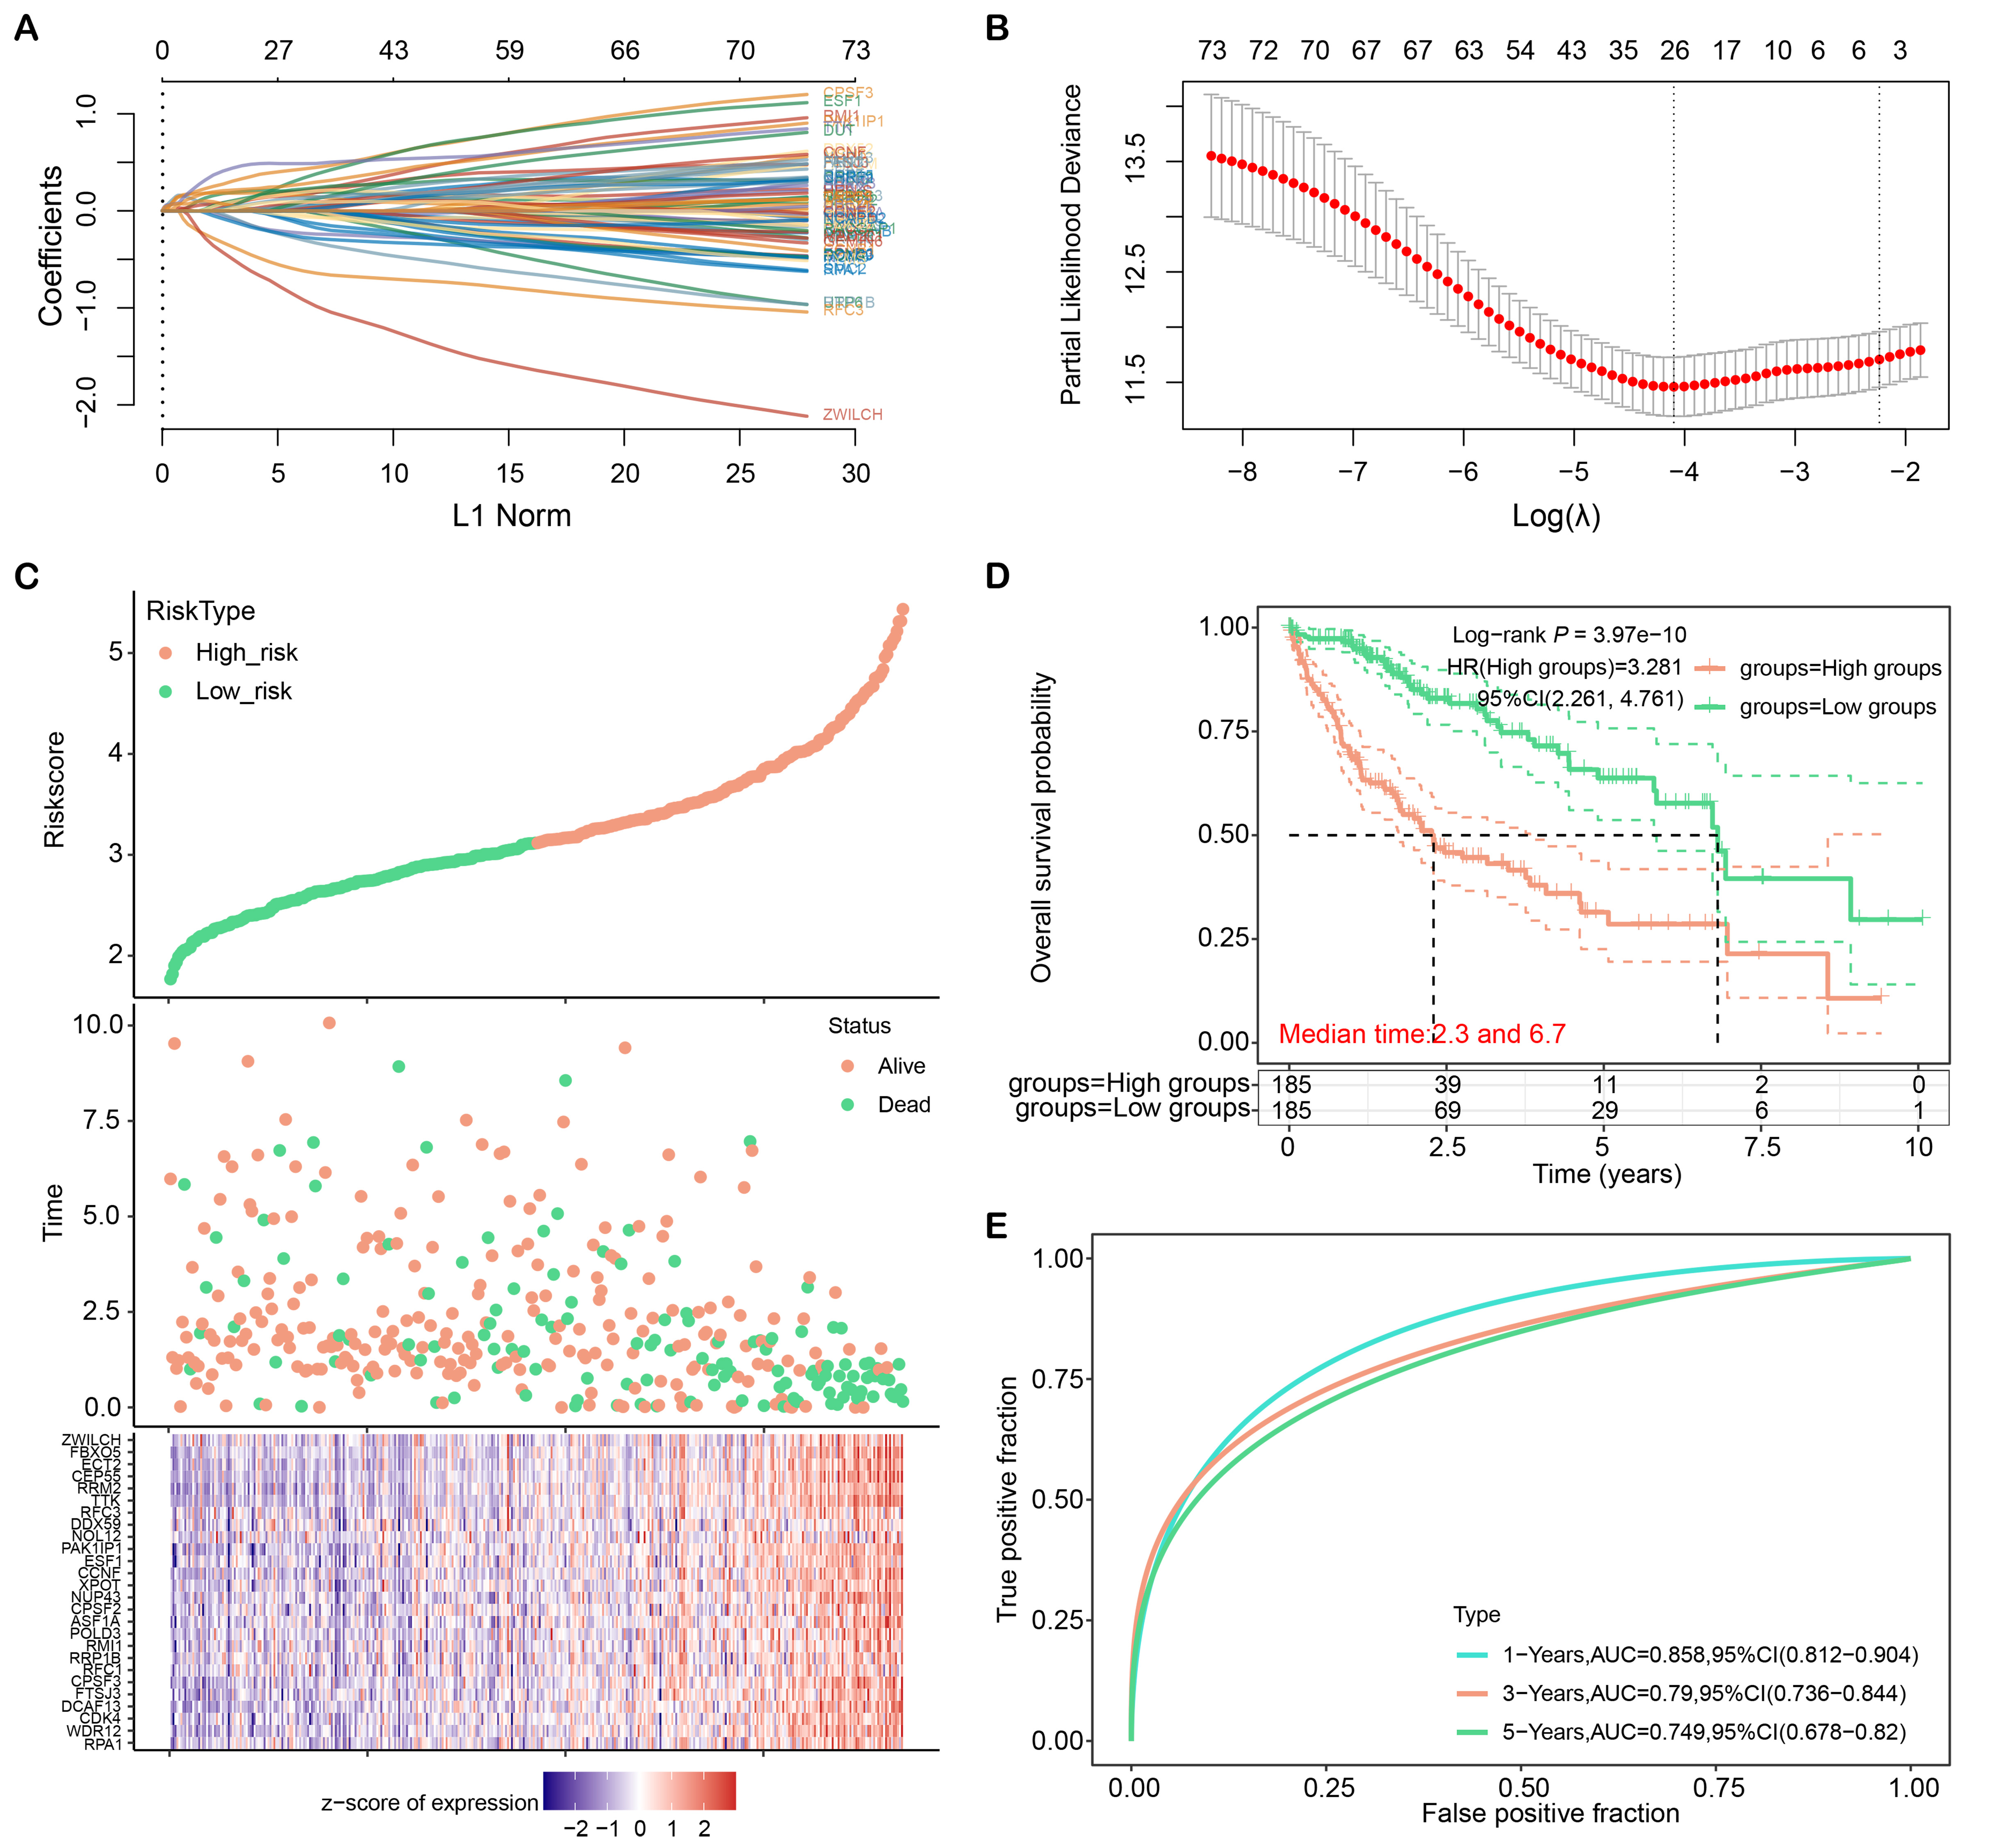 Fig. 3.
LASSO regression analysis and construction of liver cancer risk model. (A) Distribution plot of LASSO coefficients for nodal genes. (B) Optimal lambda. min value selected by 10-fold cross-validation. (C) Patient characteristics ordered by their risk score. From top to bottom are the risk scores of 26 genes, the distribution of patient survival status, and the heat map of patients in the low-risk group and high-risk group. (D) Kaplan-Meier curves of overall survival in high-risk and low-risk groups. (E) ROC curves of the liver cancer risk model at 1, 3, and 5 years. ROC, receiver operating characteristic; CI, confidence interval; AUC, area under the curve; LASSO, least absolute shrinkage and selection operator.
We investigated the expressions of 26 prognostic genes in TCGA, GSE45267, and GSE49515 datasets (Fig. 4A–C). Our results demonstrated these genes were upregulated in tumor samples. Kaplan-Meier survival analysis indicated that 19 genes were significantly linked to poor prognosis, and high expressions demonstrated lower survival (Fig. 4D–V). Together, these 19 genes have potential as prognostic biomarkers for cancer patients and can be used to develop personalized treatment strategies.
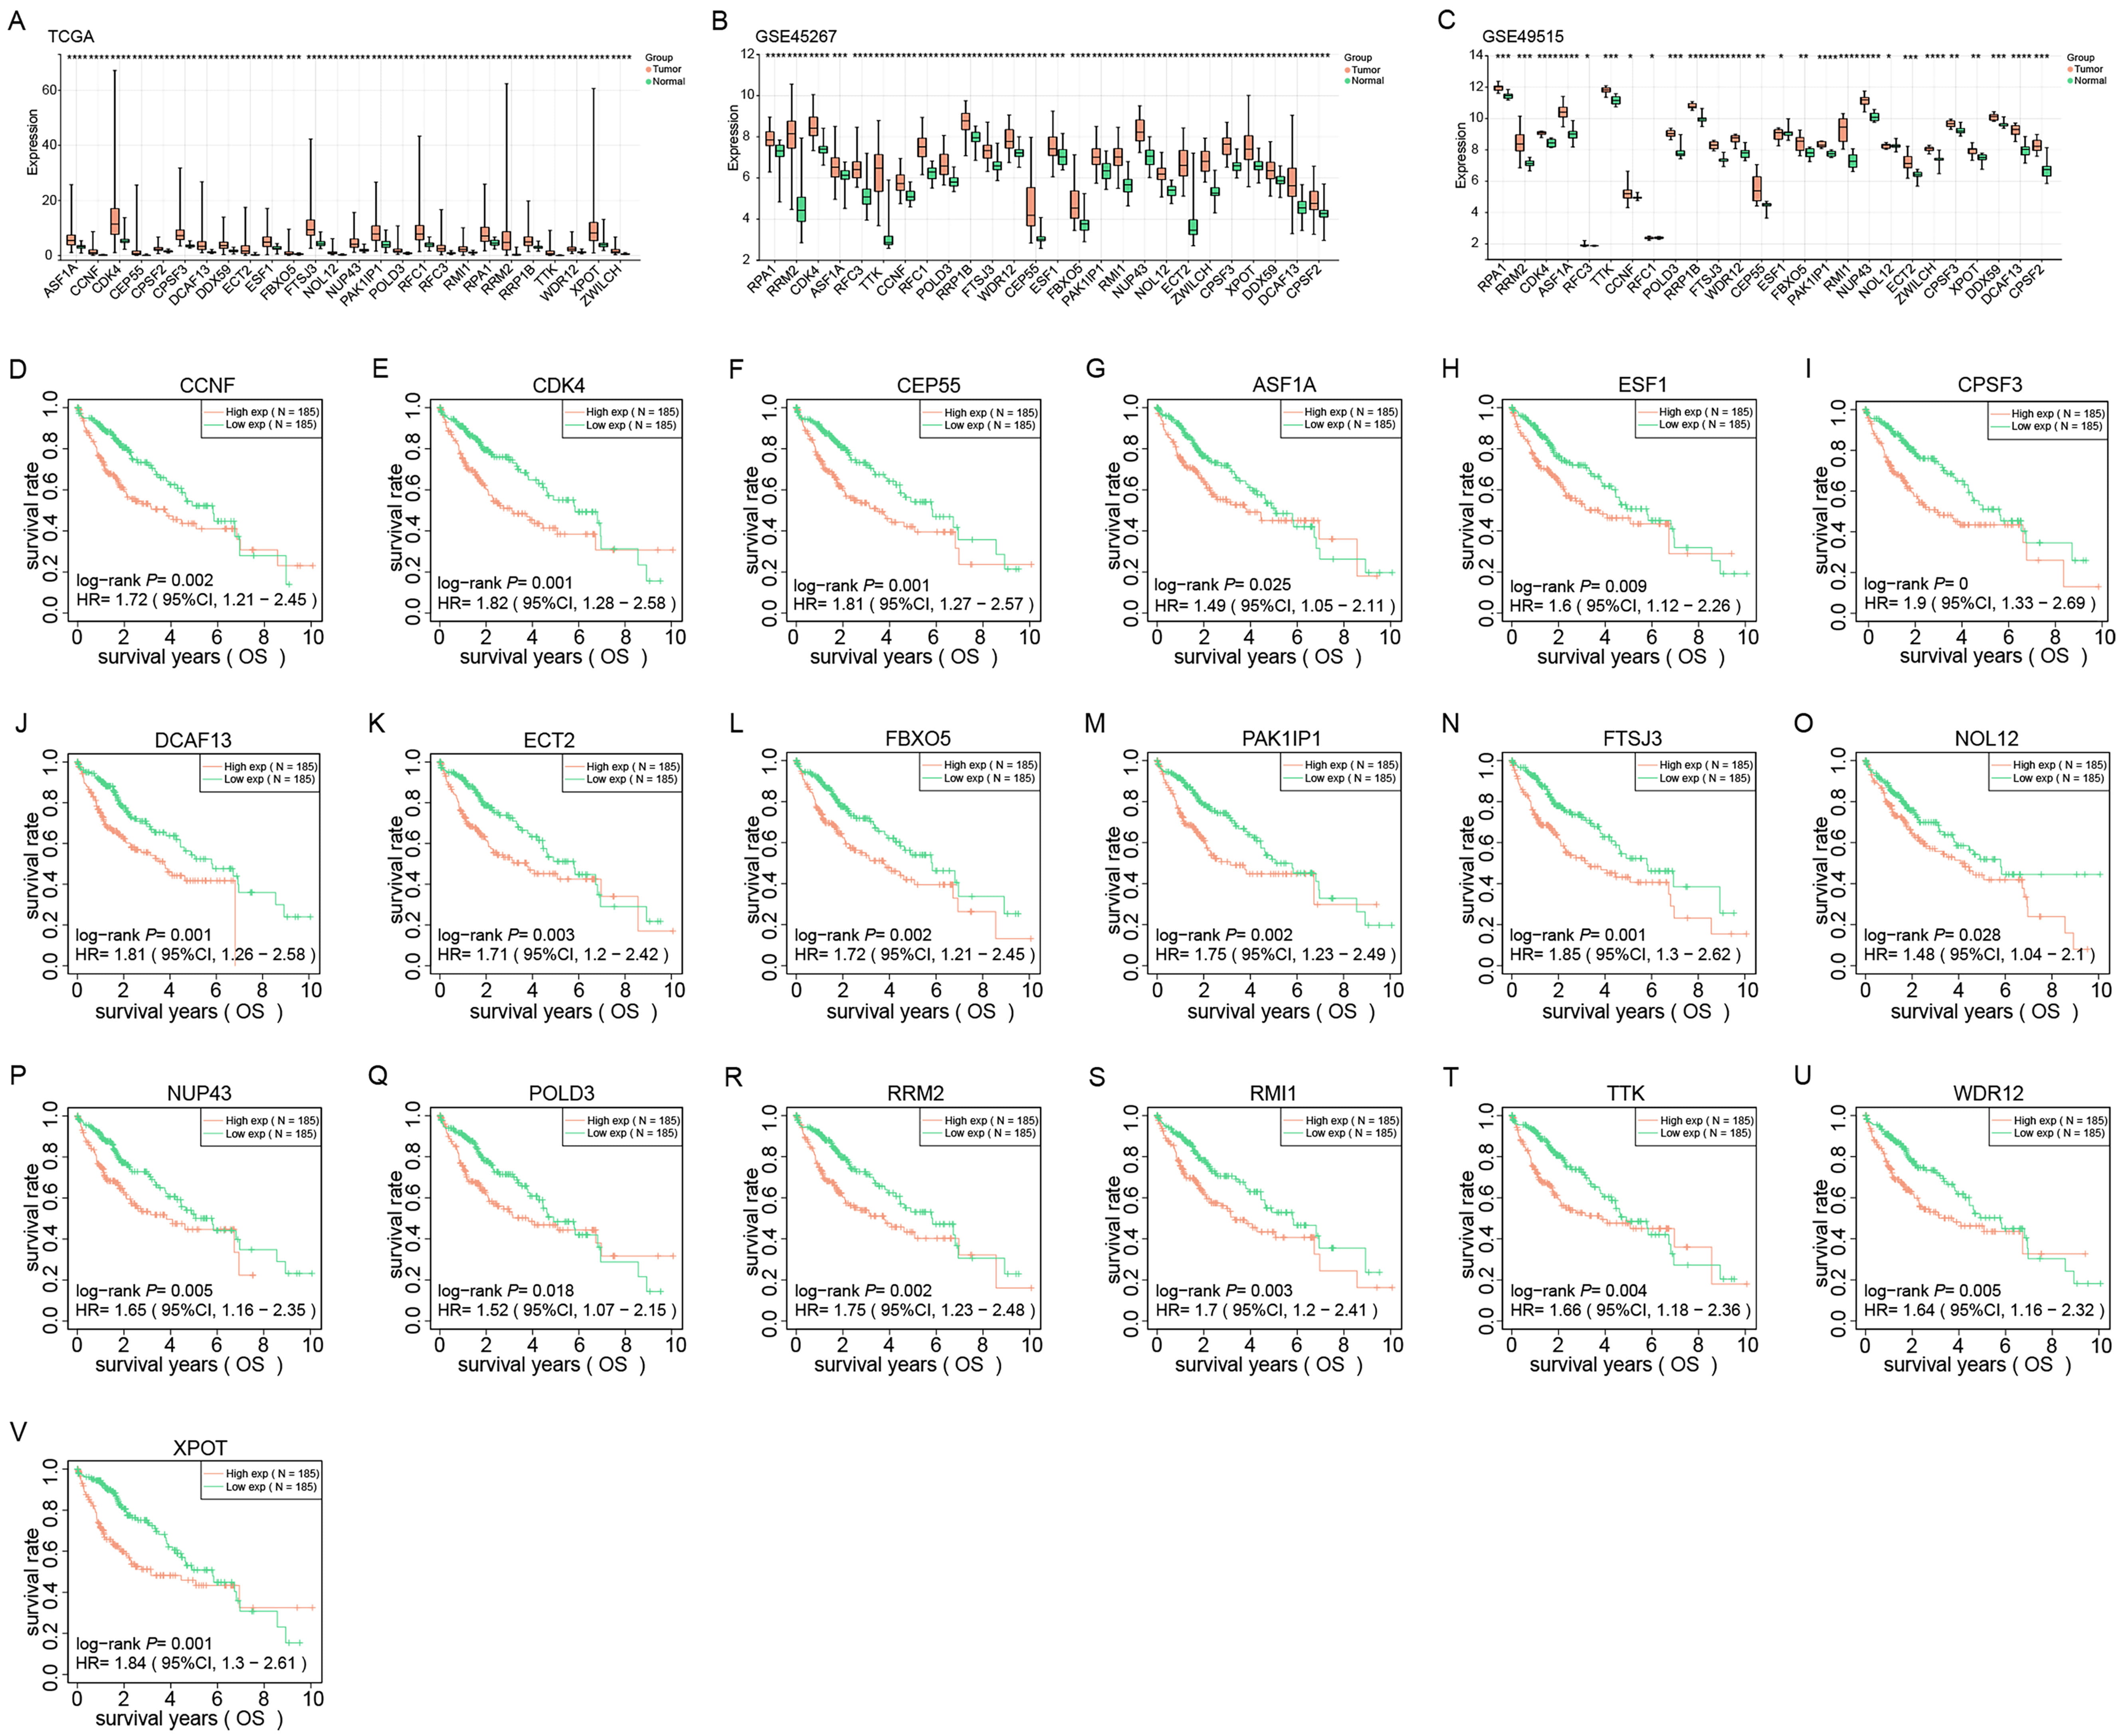 Fig. 4.
Expression and prognostic analysis of 26 identified genes in
liver cancer. (A–C) Expression levels of 26 genes from TCGA, GSE45267 and
GSE49515 datasets in normal and tumor tissues. Red and green represent tumor and
normal samples, respectively. (D–V) Kaplan-Meier survival analysis of 19 genes
in HCC patients in the TCGA dataset. The X-axis represents the survival time, and
the Y-axis represents the survival rate. Red and green curves represent high and
low expression groups, respectively. p-values and hazard ratios (HR)
with 95% confidence intervals (CI) are shown. *p
In this study, we utilized univariate and multivariate Cox regression analysis to discover that PAK1IP1 and pathological Tumor-Node-Metastasis (pTNM) stage were individual predictive variables for HCC (Fig. 5A,B). Subsequently, we developed a nomogram by integrating pAK1IP1 and pTNM stage to enhance the precision of prognosis prediction for HCC patients (Fig. 5C). The calibration plot demonstrated a strong concordance between the projected and observed survival rates (Fig. 5D). These emphasized the value of these two factors in HCC prognosis and the potential of integrating them in a nomogram for clinical use.
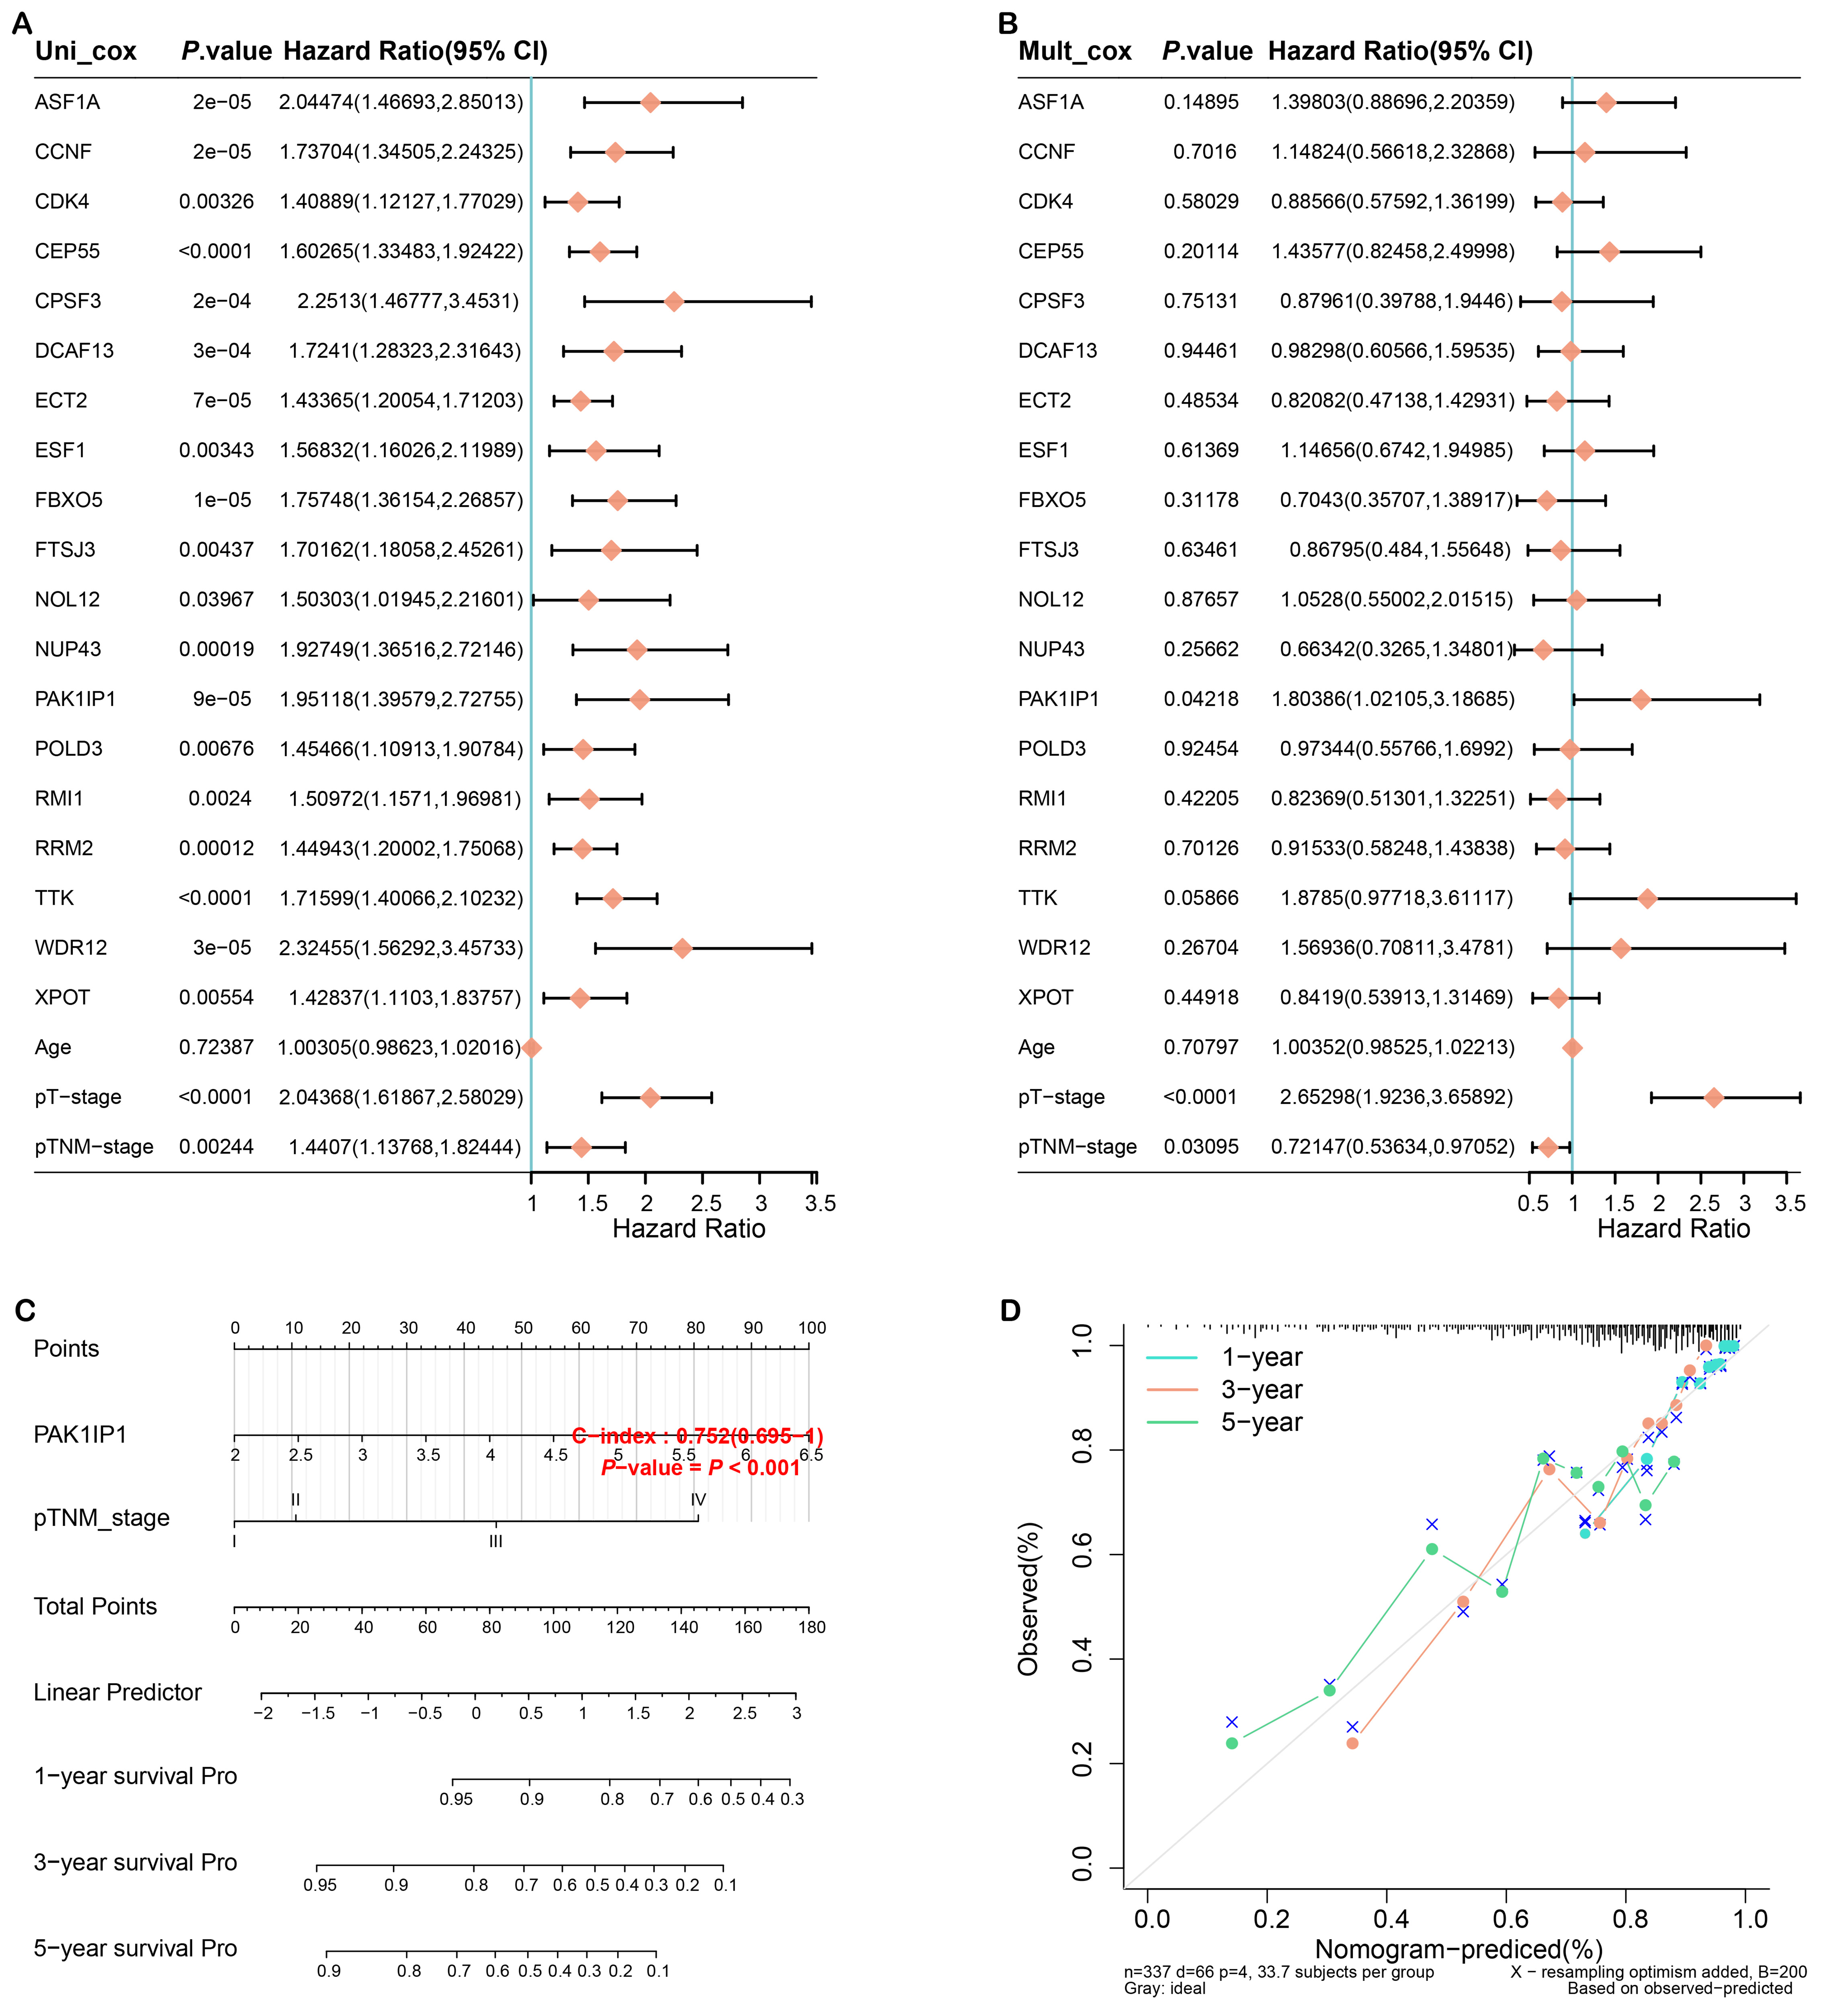 Fig. 5.
Construction of the prognostic nomogram. (A) Forest plot of univariate Cox regression analysis of PAK1 interacting protein 1 (PAK1IP1) and clinicopathological variables. (B) Forest plot of multivariate Cox regression analysis of PAK1IP1 and clinicopathological variables. (C) Nomogram for HCC prognosis prediction constructed by integrating PAK1IP1 and pTNM staging. (D) The calibration plot of the nomogram shows the agreement between predicted and observed survival. The x-axis represents predicted survival probabilities and the y-axis represents actual survival probabilities. Diagonal lines represent perfect predictions. HCC, hepatocellular carcinoma; pTNM, pathological Tumor-Node-Metastasis; 95% CI, 95% confidence interval; pT, pathological tumor; Uni, univariate; Muit, multivariate; Pro, probability.
Next, we studied the level and clinical significance of PAK1IP1 in LIHC. According to data from the UALCAN database, PAK1IP1 level was considerably greater in tumor samples (Fig. 6A). Furthermore, PAK1IP1 level was higher in HCC patients with older age, male gender, and TP53 mutation (Fig. 6B,C,E). In addition, as tumor stage and grade increased, PAK1IP1 expression also increased (Fig. 6D,F). Next, we identified most immune cells were downregulated in the low PAK1IP1 expression group, and Myeloid dendritic cells had the highest infiltration percentage in tumor samples (Fig. 6G,H). Our findings suggested that PAK1IP1 may be a predictive biomarker and be connected to immune cell infiltration.
 Fig. 6.
Clinical feature and immune analysis of PAK1IP1 in
liver cancer. (A) PAK1IP1 expression levels in normal and tumor samples
according to the UALCAN database. (B–F) Boxplot displaying PAK1IP1
expression levels in individuals with liver cancer, stratified by (B) age, (C)
sex, (D) tumor stage, (E) TP53 mutation status, and (F) tumor grade. (G) Heat map
of immune cell scores, where different colors represent expression trends in
different samples. (H) The percentage abundance of tumor-infiltrating immune
cells in each sample. Different colors represent different immune cell types, the
abscissa represents the sample, and the ordinate represents the percentage of
immune cell content in a single sample. *p
We discovered through qRT-PCR analysis that HCC cells (especially Hep3B and HepG2) have higher levels of PAK1IP1 expression than normal liver cells (Fig. 7A). Our results demonstrated that si-PAK1IP1#1 and si-PAK1IP1#2 more efficiently reduce PAK1IP1 expression in HCC cells (Fig. 7B). Moreover, western blotting analysis validated the efficacy of si-PAK1IP1#1 and si-PAK1IP1#2 in significantly downregulating PAK1IP1 protein levels in HCC cells (Fig. 7C). We then applied CCK-8 assays to assess the impact of PAK1IP1 knockdown on the proliferation of HCC cells. As expected, PAK1IP1 knockdown inhibited HCC cell growth (Fig. 7D,E). Additionally, Transwell assays demonstrated that PAK1IP1 knockdown markedly impeded the invasive and migratory capabilities of HCC cells (Fig. 7F–I).
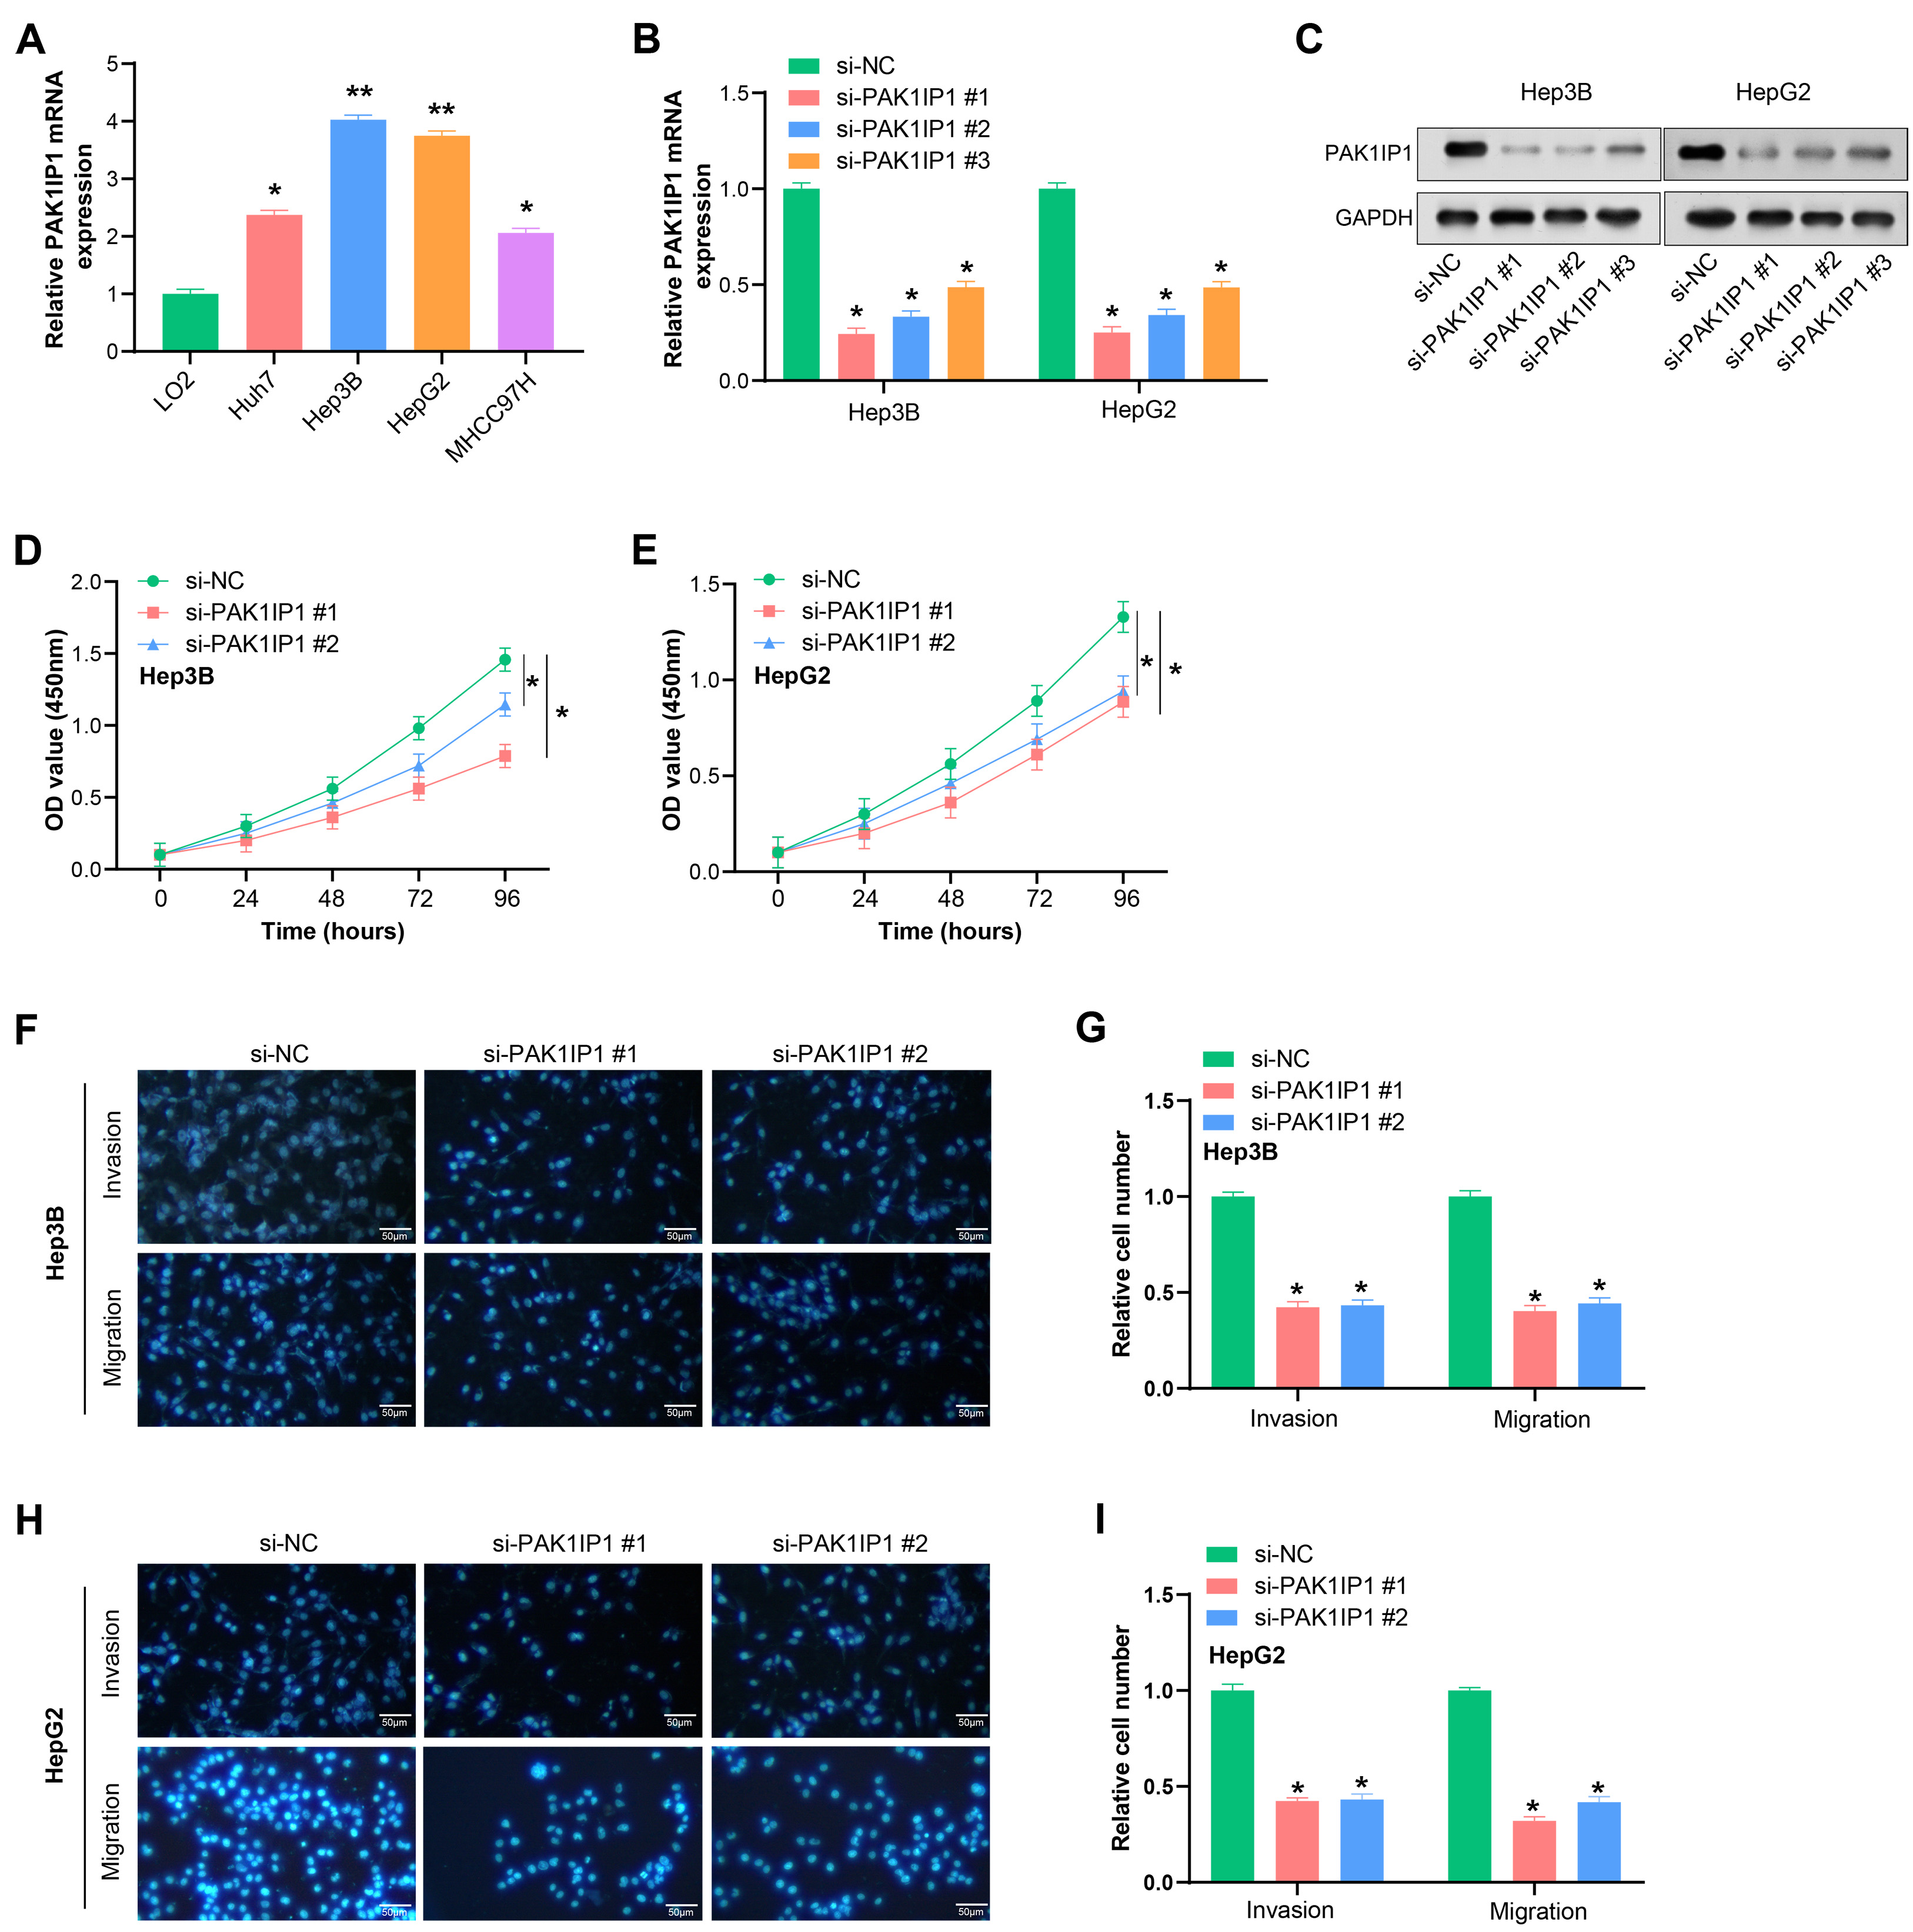 Fig. 7.
Knockdown of PAK1IP1 inhibits growth, invasion and
migration of HCC cells. (A) qRT-PCR analysis of PAK1IP1 expression in
normal hepatocytes and HCC cells. (B,C) Efficiency of si-PAK1IP1 #1,
#2 and #3 in HCC cells detected by qRT-PCR and WB in HCC cells. GAPDH was used
as a loading control. (D,E) CCK-8 assay showed the effect of PAK1IP1
knockdown on the proliferation of HCC cells. (F–I) Transwell assay for the
effect of PAK1IP1 knockdown on the invasion and migration of HCC cells.
Scale: 50 µm. *p
We constructed a physical interaction network linking PAK1IP1 and 33
pyroptosis-related genes, as identified in a prior study [15] (Fig. 8A). To
investigate whether PAK1IP1 was related to the regulation of pyroptosis,
we measured the production of IL-1
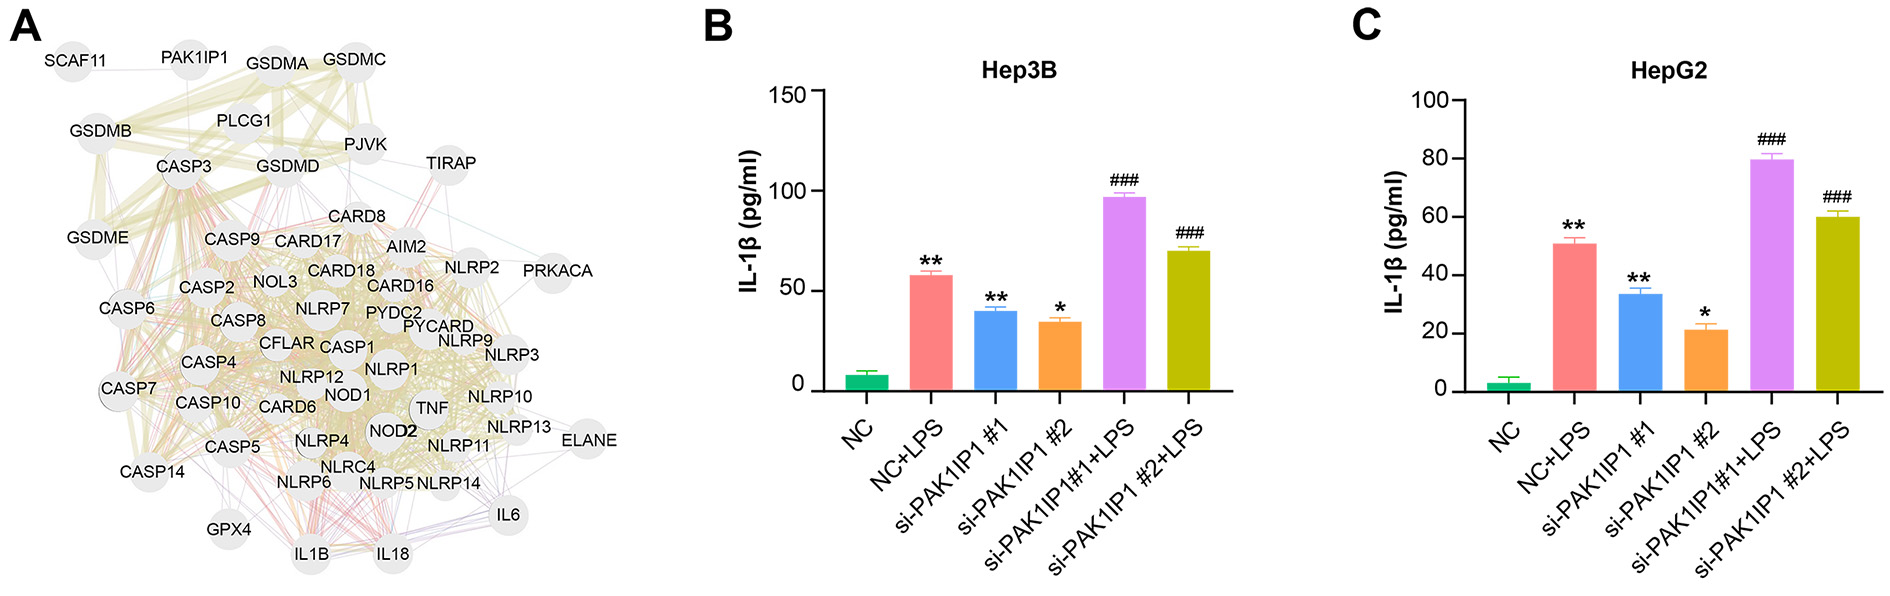 Fig. 8.
PAK1IP1 regulates gene expression associated with
pyroptosis in HCC cells. (A) Physical interaction network between
PAK1IP1 and 33 pyroptosis-related genes. Nodes represent genes, and
edges represent connectivity between genes. (B,C) ELISA assay to detect the
effect of LPS treatment and knockdown of PAK1IP1 hepatocellular
carcinoma cells on pyroptosis-related markers (IL-1
Moreover, we found that PAK1IP1 inhibition significantly increased the protein levels of CASP-3, GSDME-N, cleaved caspase-1, and GSDMD-N, as detected by WB (Fig. 9A). We subsequently assessed the effects of si-PAK1IP1 #1 and N-benzyloxycarbonyl-Asp (OMe)-Glu (OMe)-Val-Asp (OMe)-fluoromethyl-ketone (Z-DEVD-FMK) treatment, a CASP-3 inhibitor, on the proliferation of liver cancer cells. The data showed that PAK1IP1 knockdown significantly reduced HCC cell proliferation, while treatment with Z-DEVD-FMK increased cell proliferation (Fig. 9B,C). Transwell assays further revealed that PAK1IP1 knockdown suppressed liver cancer cell invasion and migration after LPS treatment, while Z-DEVD-FMK treatment promoted cellular invasion and migration (Fig. 9D–G). These findings indicate that PAK1IP1 promotes the proliferation, migration, and invasion of HCC cells by inhibiting pyroptosis.
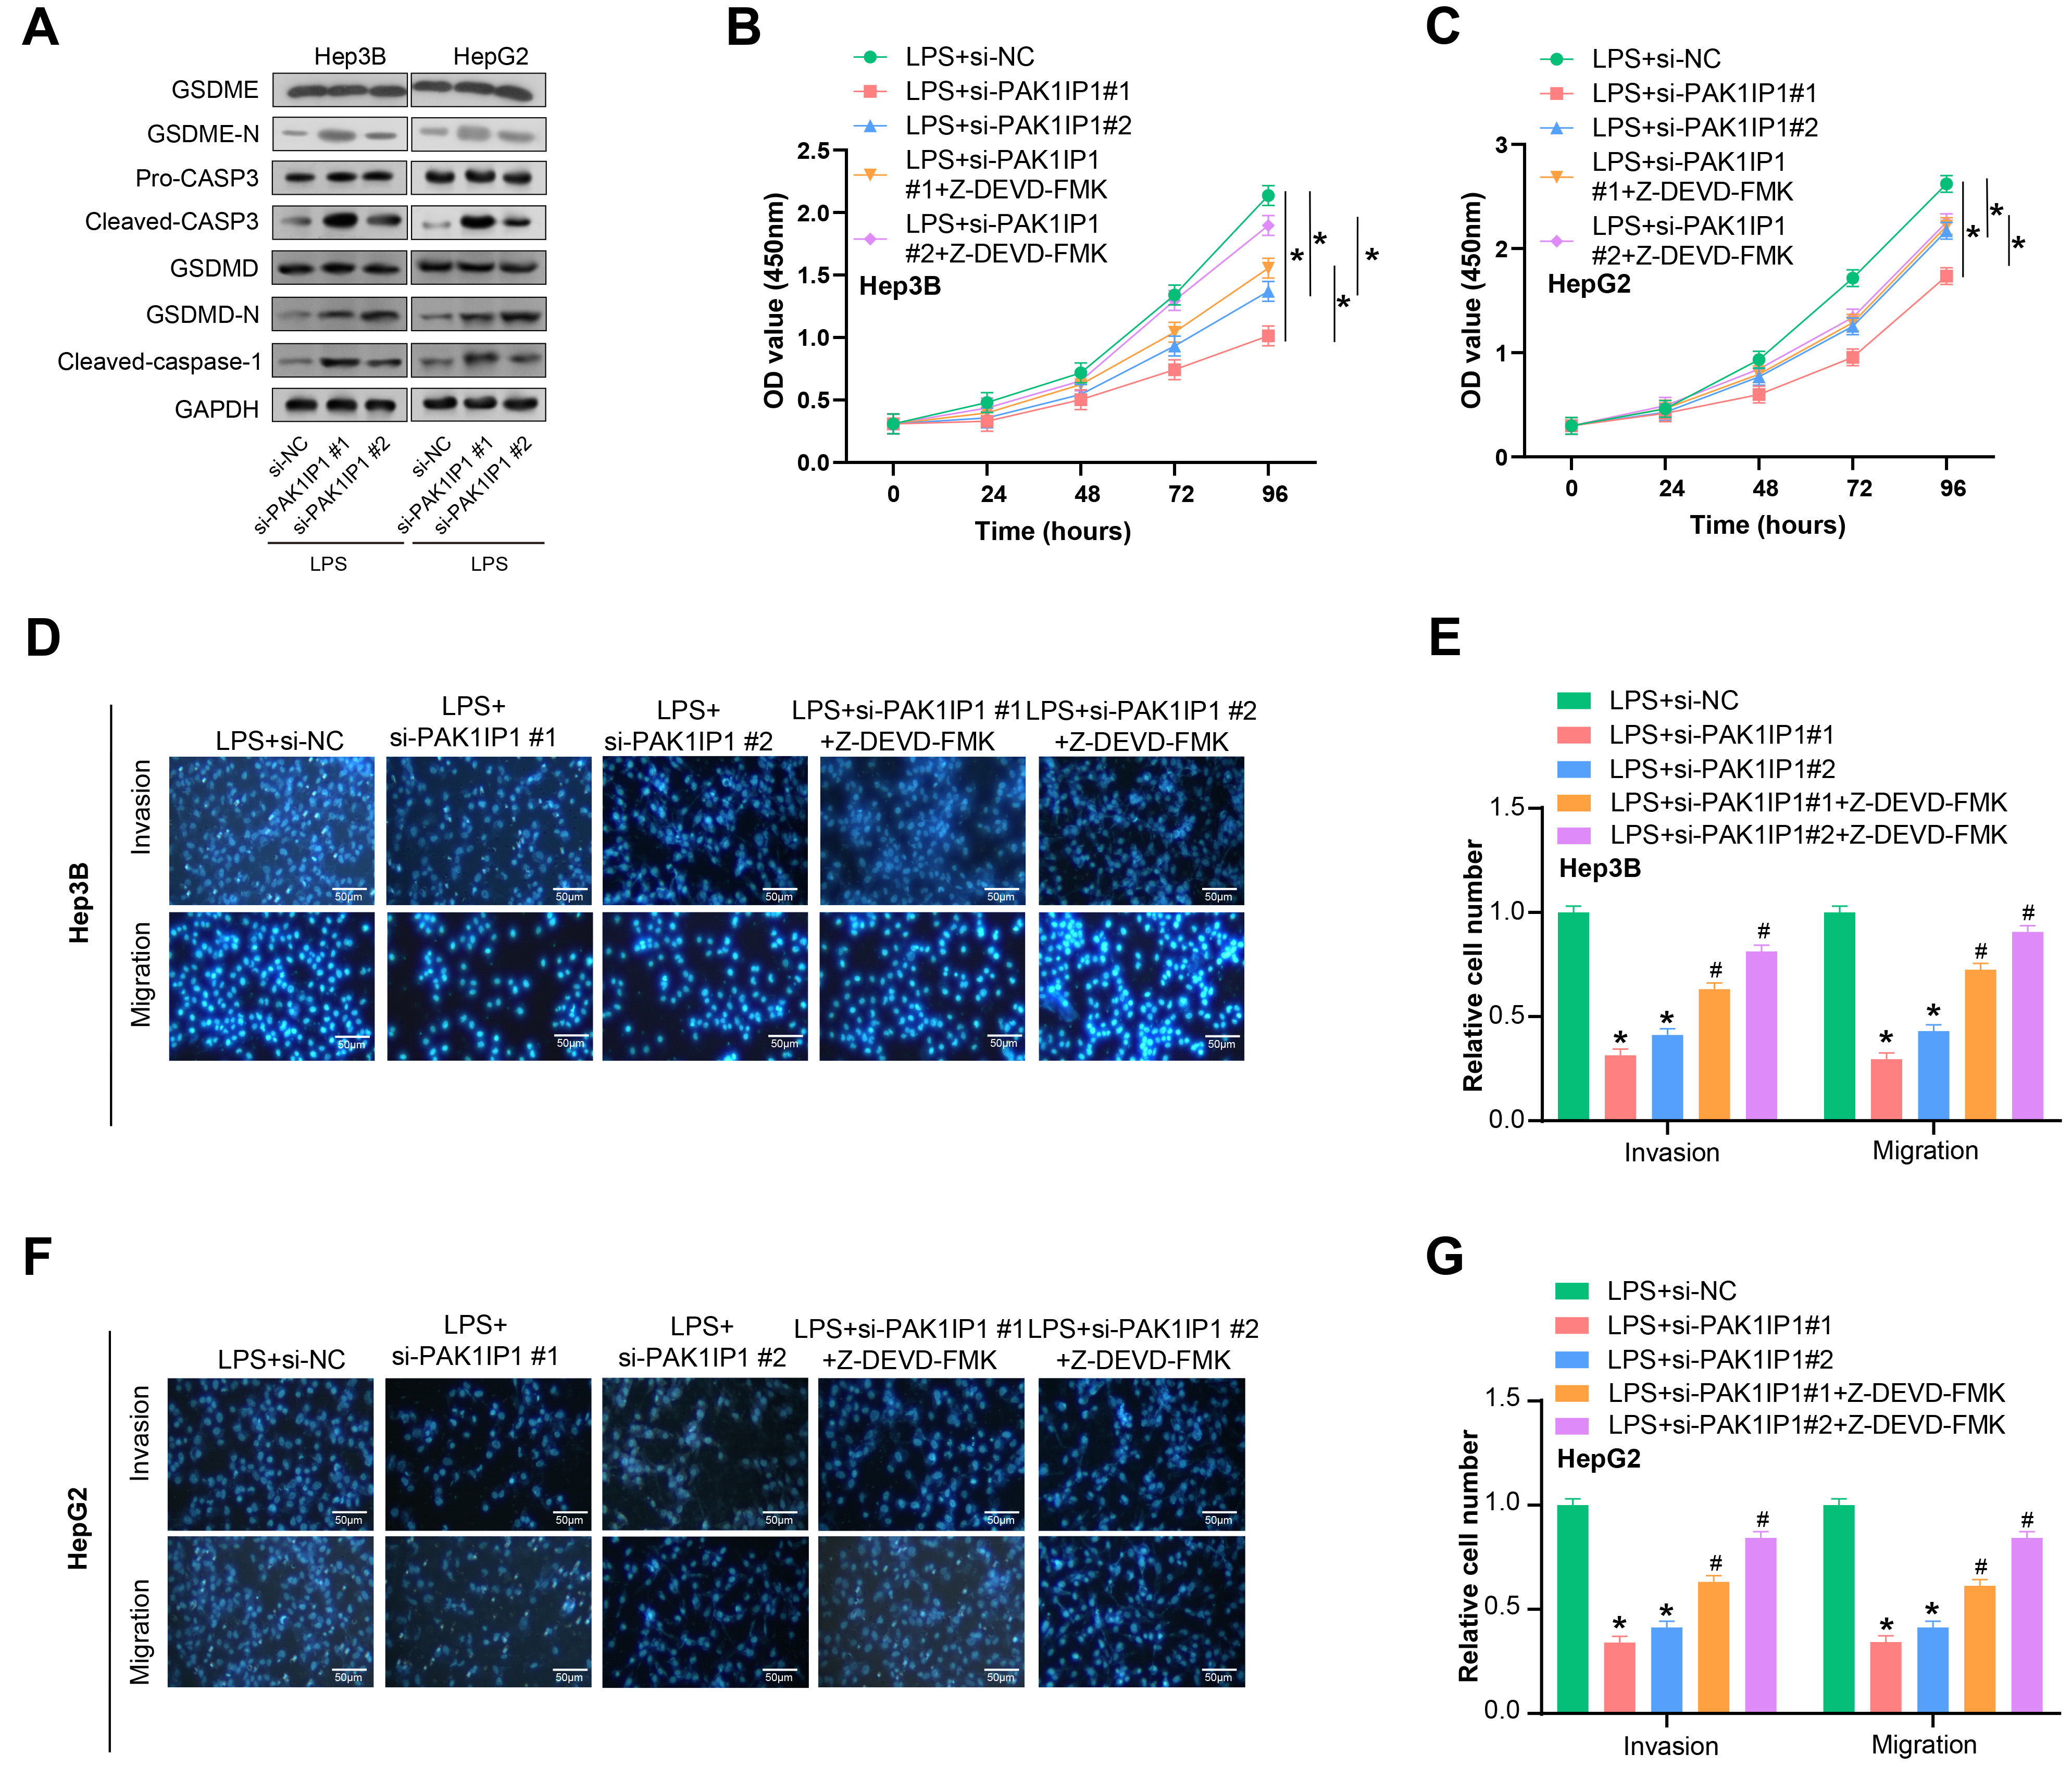 Fig. 9.
PAK1IP1 knockdown suppresses proliferation, invasion
and migration of HCC cells through the CASP-3 pathway. (A) WB analysis of
caspase 3 (CASP-3), gasdermin E (GSDME)-N, cleaved caspase-1, and gasdermin-D
(GSDMD)-N protein expression in HCC cells after PAK1IP1 knockdown. (B,C)
CCK-8 assay showing the effect of si-PAK1IP1 knockdown and
N-benzyloxycarbonyl-Asp (OMe)-Glu (OMe)-Val-Asp (OMe)-fluoromethyl-ketone
(Z-DEVD-FMK) treatment on the proliferation of HCC cells. (D,E) Transwell assay
showing the effect of PAK1IP1 knockdown on the invasion and migration of
HCC cells after LPS treatment. Scale: 50 µm. (F,G) Transwell analysis showing the effect of
Z-DEVD-FMK treatment on the invasion and migration of HCC cells. Scale: 50
µm. *p
Biomarkers are a crucial part in the diagnosis, therapy, and prognosis of cancer [16]. Currently, the diagnosis of liver cancer heavily relies on Computed Tomography (CT), Magnetic Resonance Imaging (MRI), and others [17, 18]. However, these methods have limitations in detecting early-stage tumors. To address this challenge, targeted gene therapy has become a new therapy for HCC [19]. Nevertheless, its efficiency is hindered by tumor heterogeneity and the development of acquired resistance [20]. Furthermore, the five-year survival rate for liver cancer remains low because of high recurrence and metastasis. Consequently, exploring new efficient biomarkers for the detection, management, and prognosis of liver cancer is urgently needed. These biomarkers could facilitate early detection, guide personalized treatment strategies, and predict patient outcomes. Ultimately, identifying such biomarkers would significantly improve the survival of HCC patients.
Our study identified the turquoise module as an important module associated with liver cancer. The genes in the turquoise module were primarily related to DNA metabolic processes, mRNA processing, nuclear chromosome function, RNA methyltransferase activity, methylated histone binding, Fanconi Anemia pathway, and mRNA Surveillance pathway. These enriched pathways and terms have been extensively studied in HCC and have shown promising results in improving our understanding of the disease. One of the pathways enriched in the turquoise module is the DNA metabolic process, which plays a crucial role in DNA replication, recombination, and repair [21]. Dysregulation of this pathway has been linked to various cancers, including liver cancer [22]. For example, a study found that the DNA polymerase kappa (POLK) gene’s expression in DNA metabolism was upregulated in liver cancer tissues [23]. Another enriched pathway in the turquoise module is the cell cycle. A study reported that compared to nearby normal tissues, the cell cycle pathway gene cyclin dependent kinase inhibitor 2A (CDKN2A) was considerably downregulated in liver cancer tissues [24]. Furthermore, low CDKN2A level is linked with a poor prognosis in HCC patients [25]. The mismatch repair pathway, involved in correcting errors during DNA replication, is also enriched in the turquoise module. Defects in this pathway have been related to the progression of various cancers. For instance, a study reported that the MutS homolog 2 (MSH2) gene’s expression in the mismatch repair pathway was downregulated in liver cancer tissues [26]. Moreover, our 26-gene risk model offers several distinct advantages over existing models. Firstly, it incorporates a novel selection of genes that have shown significant associations with HCC outcomes, as identified through rigorous bioinformatics analysis. Secondly, our model is underpinned by a comprehensive analytical framework that includes WGCNA, PPI network analysis, and survival analysis, providing a more holistic understanding of the prognostic landscape. Thirdly, our preliminary findings suggest that this model may enhance the accuracy of survival predictions, which is currently under further statistical scrutiny. Additionally, the genes in our model are aligned with the current biological understanding of HCC and may have therapeutic implications, thus offering clinical utility beyond prognosis. Additionally, patients with HCC who have low MSH2 expression have a bad prognosis [27]. Overall, the enriched pathways and terms in the HCC turquoise module give insightful information on the molecular pathways underlying the genesis and progression of diseases. Further research on these pathways may help identify potential targets for new therapies in HCC. The integration of our 26-gene risk model with these pathways could provide a more precise and personalized approach to HCC management and treatment.
Based on the above results and a series of bioinformatics analyses, the key gene
PAK1IP1 was determined in this study. PAK1IP1 is a protein closely
related to PAK1 and plays a key regulatory role in various biological processes
[28]. P21 (RAC1) activated kinase 1 (PAK1) is a serine/threonine protein kinase
belonging to the PAK family, and its abnormal activation is closely related to
the development of various tumors. A study has shown that the activation of
PAK1 promotes the proliferation, migration, and invasion of liver cancer
cells, as well as the formation of breast cancer stem cells, revealing its
essential role in tumor development [29]. Aberrant expression of PAK1IP1
has been implicated in human diseases [30]. PAK1IP1 interacts with
Myeloid dendritic cells (mDCs) have been identified as crucial players in the immune response against cancer [34]. Herein, we found a significant increase in mDC infiltration in HCC patients. These mDCs function as antigen-presenting cells, initiating the activation of T cells to recognize and eliminate cancer cells [35]. Additionally, they contribute to the activation of natural killer (NK) cells, which are essential for tumor surveillance [36]. Moreover, mDCs can generate cytokines that facilitate the recruitment and activation of other immune cells like macrophages and neutrophils, further bolstering the antitumor immune response [37]. In liver cancer, mDCs have been found to be a critical part of initiating and enhancing antitumor immune responses [38]. Notably, mDCs promote the differentiation and activation of CD8+ T cells, which are instrumental in eliminating tumor cells [39]. Furthermore, mDCs produce interleukin 12 (IL-12), which augments the antitumor activity of NK cells [40]. Targeting mDCs has shown promising outcomes in preclinical studies and clinical trials, either as a standalone treatment or in combination with other anticancer therapies. By understanding the role of PAK1IP1 in mDCs infiltration, we can potentially develop strategies to modulate mDCs activity, thereby enhancing the effectiveness of immunotherapies. For instance, the tandem action of CD39 and CD73 ectonucleotidases expressed on mDCs can convert ATP to adenosine, which is an important mediator of immunosuppression in the tumor microenvironment (TME) [41]. Targeting these enzymes could reduce the immunosuppressive effects of mDCs and improve the TME, thus enhancing the efficacy of immunotherapies. Additionally, myeloid cell receptor tyrosine kinases (RTKs) such as TYRO3 protein tyrosine kinase (TYRO3), AXL receptor tyrosine kinase (AXL), and MER proto-oncogene, tyrosine kinase (MERTK), and their ligands, have been shown to suppress immune responses, and their inhibition can reduce the immune suppression function of mDCs, increase CD8+ T cell infiltration, and enhance the treatment efficacy of anti-Programmed Cell Death Protein 1 (PD-1) therapy on melanoma [42]. These findings suggest that targeting mDCs and their associated immunosuppressive factors could be a promising approach to improve immunotherapy outcomes. However, it should be noted that the role of mDCs in tumor growth promotion and immune evasion has also been reported in certain types of cancer, necessitating further investigations to comprehend their intricate and multifaceted functions in cancer biology fully. In conclusion, our study underscores the potential significance of mDCs in liver cancer and indicates targeting mDCs could be a promising method to enhance antitumor immune responses. Subsequent studies are imperative to unravel the mechanisms underlying mDC function in cancer and to develop novel immunotherapeutic approaches aimed at harnessing the potential of these cells.
Furthermore, we performed experiments to elucidate the mechanism by which
PAK1IP1 and pyroptosis-related genes contribute to liver cancer. To
assess pyroptosis, we utilized ELISA to measure the production of IL-1
In this study, we have hypothesized a novel role for PAK1IP1 in HCC and explored its correlation with prognosis and immune cell infiltration. However, it is imperative to acknowledge the limitations inherent in our research. First, although we validated the function of PAK1IP1 through qRT-PCR, WB, and a suite of cellular experiments, these experiments were mainly limited to cell lines. We have not yet assessed the relevance of these findings in the in vivo tumor microenvironment, which may limit the clinical applicability of our conclusions. Second, while our bioinformatics analysis suggests that PAK1IP1 expression may be related to immune cell infiltration in HCC, we have not yet experimentally validated this relationship. Furthermore, although our study proposed a risk model containing 26 prognostic genes, external validation in an independent dataset is needed to assess the generalizability and reliability of the model. Regarding functional enrichment analysis and pathway identification, we recognized that only limited experimental validation has been performed on the turquoise module. Moreover, biological experiments have a certain degree of inherent variability, which can influence various factors, such as cell passage number, batch-to-batch differences in reagents, and minor variations in experimental conditions. Future research will necessitate a more comprehensive experimental validation of the functional roles of these genes in cancer biology. When considering future research directions, a broader range of in vivo studies, including other markers of pyroptosis, repeated experimental validations, and external validation of our prognostic models, will be valuable next steps. Moreover, an in-depth investigation of the immune infiltration and broader roles of PAK1IP1 in hepatocellular carcinoma biology is crucial. This study reveals the potential significant roles of PAK1IP1 and other factors in the progression of hepatocellular carcinoma and patient prognosis. However, further experimental and clinical research is required to deepen our understanding and confirm these preliminary findings.
To sum up, PAK1IP1 has been identified as an oncogenic driver in HCC. The increased infiltration of myeloid dendritic cells in HCC samples highlights their potential as therapeutic immunological targets. Furthermore, our in vitro experiments elucidated the mechanism of PAK1IP1, revealing that PAK1IP1 knockdown induced pyroptosis in HCC cells to inhibit HCC progression. These findings laid the groundwork for future research endeavors to develop new clinical biomarkers.
The datasets used and/or analyzed during the current study are available from the corresponding author on reasonable request.
Conception and design of the study, or acquisition of data, or analysis and interpretation of data: XL, ZL, HZ and JC. Drafting the article or revising it critically for important intellectual content: JC, XL, ZL and HZ. Final approval of the version to be submitted: ZL and XL. All authors contributed to editorial changes in the manuscript. All authors read and approved the final manuscript. All authors have participated sufficiently in the work and agreed to be accountable for all aspects of the work.
Not applicable.
We express our deepest gratitude to all those who have made this study possible. Our heartfelt thanks go to the team members for their collaboration and diligent work, and to them who provided insight and expertise that greatly assisted the research. All authors have read and confirmed the acknowledgment.
This project is funded by the Nantong Health Commission General Program (MS2022020).
The authors declare no conflict of interest.
References
Publisher’s Note: IMR Press stays neutral with regard to jurisdictional claims in published maps and institutional affiliations.