


 , Xueyan Liu 1, Hua Wang 1,*
1 Department of Pediatrics, Shengjing Hospital of China Medical University, 110004 Shenyang, Liaoning, China
Abstract
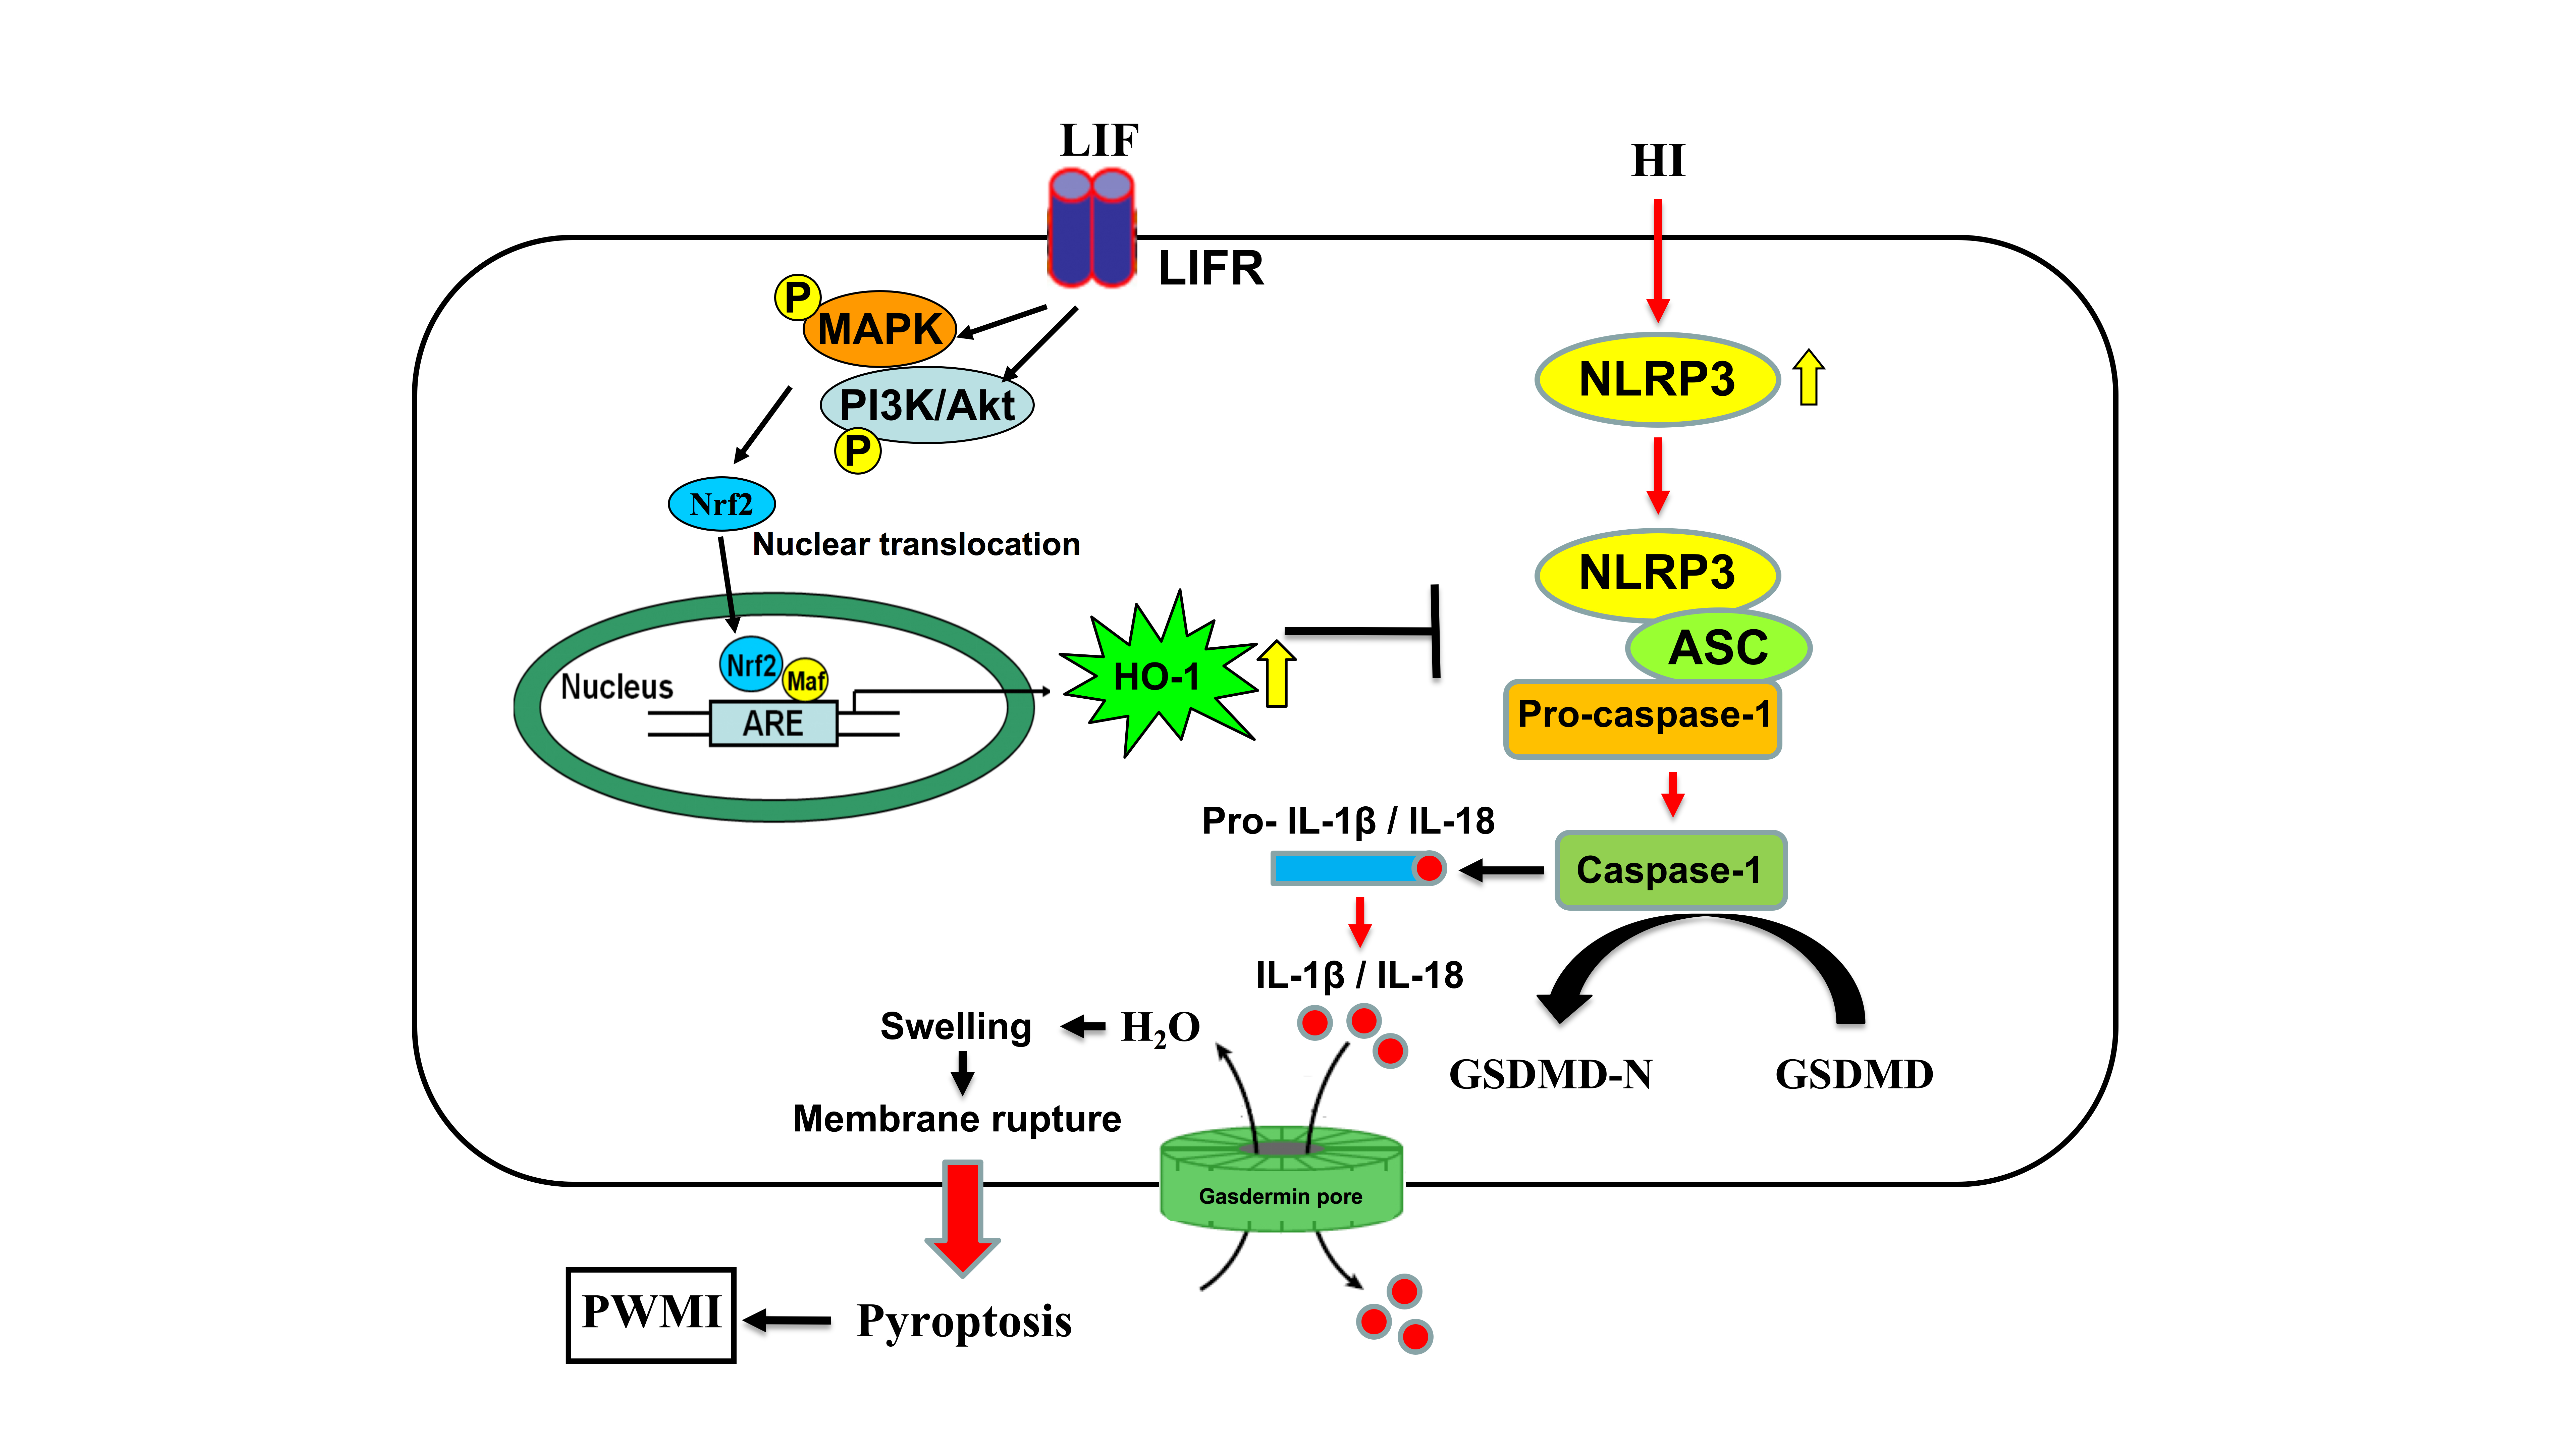
Inhibiting neuroinflammatory damage is an effective strategy for treating preterm white matter injury (PWMI). Leukemia inhibitory factor (LIF) can ameliorate (HI) induced white matter injury; however, the neuroprotective effects and mechanisms of LIF remain unclear. This study aimed to determine whether NOD-like receptor thermal protein domain associated protein (NLRP3)-dependent pyroptosis is involved in PWMI pathogenesis.
We established an in vitro oxygen–glucose deprivation (OGD) cell model and an in vivo HI induced brain white matter injury neonatal mouse model. RNA sequencing (RNA-seq) and Kyoto Encyclopedia of Genes and Genomes (KEGG) analyses examined differentially expressed genes in oxygen–glucose deprivation/reoxygenation (OGD/R) challenged CTX TNA2 rat astrocytes. The changes and effects of proteins were confirmed in neonatal rats in vitro and in vivo. Cell viability assays, reactive oxygen species (ROS) assays, apoptosis assays, and immunoblot were used to confirm LIF-mediated its neuroprotective effect against HI-induced white matter injury in vitro.
RNA-seq and KEGG analyses indicated OGD/R enriched NLRP3 inflammasome-related genes (validated by in vitro and in vivo models), showing that NLRP3-dependent pyroptosis proteins (apoptosis-associated speck-like protein contain a CARD (ASC), NLRP3, active caspase 1, IL-1β, IL-18, and N-terminal fragment of gasdermin D (GSDMD-N)) were all increased by HI or OGD/R. LIF upregulated HO-1 expression by activating Nrf2 via the MAPK and Akt kinase pathways and significantly decreased OGD/R-induced ROS production. NLRP3-dependent pyroptosis proteins were suppressed in the LIF group compared with those in the OGD/R and HI groups. Zinc protophyrin, an HO-1 inhibitor, partially abolished LIF-mediated viability enhancement in rat astrocytes.
NLRP3-dependent pyroptosis plays a role in PWMI pathogenesis; moreover, LIF mitigates OGD/R-induced pyroptosis-dependent neurotoxicity by upregulating HO-1 expression in rat astrocytes.
Graphical Abstract
Keywords
- preterm white matter injury
- leukemia inhibitory factor
- oxygen-glucose deprivation
- Nrf2
- HO-1
Preterm white matter injury (PWMI), including periventricular leukomalacia, is the main cause of cerebral white matter injury due to hypoxia-ischemia (HI) and inflammation in premature infants at 23–32 weeks of gestation [1, 2]. It is one of the main causes of cognitive impairment, audiovisual dysfunction, epilepsy, and cerebral palsy in premature infants [2, 3]. Although advances in perinatal medicine have notably improved the survival rate of premature infants, PWMI incidence has gradually increased and become a global public health and social problem [2, 4, 5, 6].
Recent studies suggest that HI and inflammation, in the developing brain, are the two main PWMI pathogenesis [2, 3]. The inflammatory response caused by HI injury in brain tissue is characterized by microglia and astrocyte activation. Over-activated microglia and astrocytes produce excessive levels of reactive oxygen species (ROS) and inflammatory cytokines. Inflammation, which is mediated by inflammatory cytokines through the inflammatory signaling pathway, can damage premyelinating oligodendrocytes and disrupt myelin formation. Inflammation and abnormal astrocyte and microglia regulation have been demonstrated in PWMI [7]; however, the specific underlying molecular mechanisms remain unclear; importantly, oligodendrocyte maturation is a tightly regulated process during perinatal white matter formation, and its impairment is central to PWMI pathology [8]. While inflammation and aberrant glial activation are established features of PWMI, the underlying molecular mechanisms remain unclear, and no effective therapy currently exists [9]. Emerging evidence suggests that astrocytes, which are vulnerable to HI, exacerbate injury by releasing ROS and inflammatory factors [10], highlighting the need for interventions targeting glial-mediated damage.
Astrocytes play a significant role in regulating myelination in central nervous system diseases, and their influence on oligodendrocyte lineage varies with different response conditions [11]. Therefore, inhibiting harmful signaling pathways in astrocytes while preserving their beneficial functions may represent a new approach to improving white matter injury in the brain. Study has shown that astrocytes can secrete neurotrophic factors such as leukemia inhibitory factor (LIF) in an autocrine manner, maintaining the survival of neurons and oligodendrocytes by regulating their own cellular functions [11]. LIF, first cloned as a differentiation inducer and proliferation inhibitor in a myeloid leukemic cell line (M1) [12], is the most pleiotropic member of the interleukin (IL)-6 family of neurocytokines [13]. LIF possesses various pharmacological effects, including anti-inflammatory [14], antidiabetic [15], and antioxidative [16]. In the research on demyelinating diseases of the central nervous system, it was found that stimulating the secretion of endogenous LIF can promote myelin regeneration [17, 18, 19]. Recently, the study has investigated the neuroprotective effects of LIF. The actions of LIF include regulation of the development of both astrocytes and oligodendrocytes [20]. A recent study showed that LIF exerts neuroprotective effects against stroke via signal transduction of the transcription factor myeloid zinc finger-1 [21]. In addition, LIF protects neurons from ischemic damage in vivo and in vitro by upregulating superoxide dismutase 3 [22]. In stroke conditions, LIF protects oligodendrocytes via the Akt signaling pathway and peroxiredoxin 4-mediated antioxidation in rats following permanent middle cerebral artery occlusion (MCAO) [23]. Davis et al. [24] demonstrated that LIF exerts neuroprotective effects by regulating LIF receptor (LIFR) expression in young rats after MCAO. Collectively, these studies suggested that LIF promotes recovery after stroke by upregulating antioxidant enzymes. Recent studies have revealed that LIF has a neuroprotective effect on PWMI [25, 26]. However, the mechanisms through which LIF mediates its neuroprotective effects are largely unclear. Although LIF exhibited neuroprotective activity in many diseases, its potential as a PWMI therapeutic agent and the precise underlying protective mechanisms have not been reported and determined.
Therefore, this study aimed to investigate the therapeutic effect of LIF on PWMI and the underlying mechanisms by which it exerts its neuroprotective effects. We showed, for the first time, that oxygen glucose deprivation/reoxygenation (OGD/R) decreases astrocyte viability and increases oxidative stress in CTX TNA2 rat astrocytes induced by OGD/R. RNA sequencing (RNA-seq) and Kyoto Encyclopedia of Genes and Genomes (KEGG) analyses indicated that NLRP3-mediated pyroptosis was enriched by OGD/R, which was validated by in vitro and in vivo PWMI models, showing that NLRP3 inflammasome-related genes were upregulated. LIF activates Nrf2 via the MAPK and Akt kinase pathways, leading to HO-1 upregulation, and significantly decreases OGD/R-induced cell injury by inhibiting NLRP3 inflammasome-related gene expression. Zinc protoporphyrin (ZnPP), a heme oxygenase-1 (HO-1) inhibitor, partially abolished LIF-induced viability enhancement in CTX TNA2 rat astrocytes. Altogether, this study is the first to demonstrate that NLRP3-mediated pyroptosis is involved in PWMI genesis, and that LIF mitigates OGD/R-induced pyroptosis-dependent neurotoxicity by upregulating HO-1 expression in CTX TNA2 rat astrocytes, providing a new insight for interpreting the underlying mechanisms of the neuroprotective effect of LIF and highlighting LIF as an effective pharmacological candidate agent for treating PWMI.
Recombinant rat LIF (NBP2-35263) was purchased from Novus Biologicals (Littleton, CO, USA) and dissolved in sterile distilled water to a concentration of 0.1 mg/mL. Dulbecco’s modified eagle medium (DMEM)/Low Glucose (11885084) was purchased from Gibco (Carlsbad, CA, USA). Chicken polyclonal glial fibrillary acidic protein (GFAP, ab4674), rabbit polyclonal GFAP (GFAP, ab7260), anti-associated speck-like protein (ASC, ab180799), and anti-gasdermin D (GSDMD, ab219800) antibodies were acquired from Abcam (Cambridge, UK). HO-1 antibody (#SPA895) was purchased from Stressgen (London, Ontario, Canada). Nrf2 (PA5-27882), NLRP3 (PA5-115661), Caspase 1 (MA5-16215), IL-1 beta (PA5-46956), IL-18 (PA5-76082) antibodies, and MitoSOXTM red mitochondrial superoxide indicator (MP36008) were purchased from InvitrogenTM (Carlsbad, CA, USA). Various antibodies, including rabbit anti-Phospho-Akt (#4060), anti-Akt (#4691), anti-Phospho-p44/42 MAPK (ERK1/2) (#4370), anti-p44/42 MAPK (ERK1/2) (#9102), anti-Phospho-SAPK/JNK (#4668), rabbit anti-SAPK/JNK (#9252), rabbit anti-Phospho-p38 MAPK (#4511), and rabbit anti-p38 MAPK (#9092), along with SB203580 (#5633), SP600125 (#8177), PD98059 (#9900), and LY294002 (#9901) were bought from Cell Signaling Technology (Boston, MA, USA). ZnPP was purchased from MedChen Express (Madison, WI, USA). Abcam (London, Cambridge, UK) provided Goat Anti-Chicken IgY H&L (Alexa Fluor® 488, ab150169), Donkey Anti-Rabbit IgG H&L (Alexa Fluor® 594, ab150076), and Donkey Antibody to Goat IgG - H&L (Alexa Fluor® 594, ab150136). Proteintech (Wuhan, Hubei, China) provided the Beta Actin Mouse Monoclonal antibody (66009-1-ig), horseradish peroxidase (HRP)-conjugated Affinipure Goat Anti-Mouse IgG (H+L) (SA00001-1), HRP-conjugated Affinipure Anti-Rabbit IgG (H+L) (SA00001-2), and Hoechst (No.33342). Protease inhibitors were purchased from Roche Diagnostics GmbH (Basel, Switzerland). The Cell Counting Kit-8 (CCK-8) (No.96992), TdT-mediated dUTP nick end labeling Kit (11684795910), Hoechst 33342/PI Double Staining Kit (orb219888), and TRizol (B511311) reagents were acquired from Sigma (St. Louis, MO, USA), Roche (Basel, Switzerland), Biorbyt (Cambridge, UK), and Shenggong (Shanghai, China), respectively. The Reactive Oxygen Species Assay Kit (S0033S) and Nuclear and Cytoplasmic Protein Extraction Kit (P0027) were bought from Beyotime (Haimen, China). The PrimeScript RT Reagent Kit and SYBR Premix Ex TaqTM were purchased from TaKaRa (Tokyo, Japan). The remaining chemicals were of the best quality that could be purchased from stores.
In vivo internationally recognized animal models of PWMI. Healthy Sprague Dawley (SD) rat pups at post-natal day 3 (PND3) were randomly assigned to either the control (Ctrl) or PWMI group, obtained from the Center of Experimental Animals at Shengjing Hospital of China Medical University. The animals were kept in a room with controlled temperature (22–25 °C) and a 12-hour light/dark cycle and were given food and water ad libitum. All animal procedures were approved by the Experimental Animal Ethics Committee of Shengjing Hospital of China Medical University (2021PS075K), and adhered to Animal Research: Reporting of In Vivo Experiments (ARRIVE) guidelines. All PWMI categories were created as previously outlined [27, 28]. Briefly, PND3 pups were placed in a refrigerator at –20 °C for 7–10 min. After administering cold anesthesia, the surgeon meticulously separated the right common carotid artery from the nearby tissue and tied it off, after which the injury was stitched with an 8-0 suture. The procedure was completed within 5 min. After surgery, the puppies were transferred to a warm area with a heat lamp for 10 min, reunited with their mother, and allowed to recuperate for 1 h. They were then exposed to 6% oxygen (94% nitrogen saturation) at 37 °C for 90 min in a humidified chamber. Following recovery, they were placed back in their cages to resume eating. The control group comprised rats that underwent sham surgery without hypoxic exposure. During PND6 (HI3d), damage severity (ranging from mild to severe) was assessed based on the overall animal health, neurobehavioral assessments, and histopathological examinations. Rats with moderate-to-severe injuries were used in future experiments.
The mice were euthanized by Inhalant Anesthesia Overdose (5% isoflurane mixed with oxygen). Brain tissue was extracted from rats sacrificed every 3 days following PWMI induction and immersed in 4% paraformaldehyde for 24 h. Subsequently, the brains underwent several alcohol and xylene treatments before being encased in paraffin blocks. Brain samples were sliced with a rotary microtome (Leica RM 2135, Leica Instruments, Nussloch, Germany) to produce consecutive 4 µm thick sections in a coronal orientation from the paraffin-embedded tissue block for GFAP/NLRP3 dual immunofluorescence labeling or ASC/Caspase-1 immunohistochemical analysis. The posterior two-thirds of the brain tissue was used for western-blot analysis.
CTX TNA2 rat astrocytes were acquired from ACTT (Rockefeller, MD, USA), and all cell lines were validated by short tandem repeat (STR) profiling and tested negative for mycoplasma. The cell was grown in low glucose DMEM with 10% fetal bovine serum, 50 U/mL penicillin, 50 µg/mL streptomycin, and 1% L-glutamine, after which the culture medium was discarded. Briefly, the cell layer was rinsed with phosphate-buffered saline (PBS) to remove all traces of serum containing the trypsin inhibitor. Subsequently, 0.25% Trypsin-0.53 millimolar EDTA solution (1 mL) was transferred into the flask, and the cells were monitored using an inverted microscope (TS2, Nikon Corporation, Tokyo, Japan) until the cell layer was evenly spread out, typically within 3 to 5 min. Full growth solution (6–8 mL) was added, and the cells were carefully removed using a pipette. Appropriate portions of the cell mixture were then transferred into fresh culture containers, which were maintained at 37 °C.
Cells were stained with Hoechst 33342/PI using the Double Staining Kit per manufacturer instructions. Hoechst 33342/PI Chromogen (10 µL) were equally added to 2 mL Dilution Buffer and mixed (final density, 5 µg/mL). Subsequently, the staining solution was applied to the cells and incubated in the dark for 5 min at 30 °C. The cells were then rinsed three times with PBS and observed under a fluorescence microscope (M40D, Wanheng Precision Instrument Co. LTD., Shanghai, China).
Following the standard removal of wax and water from the brain tissue sections, they were treated with 10% serum for 20 min at 37 °C, and incubated overnight at 4 °C with Chicken polyclonal GFAP and Rabbit polyclonal NLRP3 antibodies (both 1:500). Tissue slices were rinsed three times with PBS-TritonX-100. Alexa Flour@488 (green fluorescence) and Alexa Flour@594 (red fluorescence) secondary antibodies were used at a 1:200 dilution for 2 h at 37 °C. Rat astrocytes were seeded into 6-well plates, fixed in 4% paraformaldehyde for 15 min, and washed thrice with PBS (5 min each). The cells were then treated with 0.1% TritonX-100, left at room temperature for 30 min, subjected to three 5-minute PBS washes, blocked with 10% goat serum for 15 minutes at 37 °C, and incubated overnight at 4 °C with either HO-1 or Nrf2 antibody (both 1:200). After three PBS washes, cells were incubated with Alexa Flour@594 secondary antibodies (1:200) 1 h at 37 °C. Next, the tissue sections and cells were rinsed thrice with PBS, stained with DAPI (1:2000) for 2 min, rinsed again, and imaged using a confocal laser scanning microscope (LSM880, Zeiss, Germany).
Following deparaffinization and rehydration, brain samples were exposed to 50 µL of 0.1% TritonX-100 (diluted with 0.1% sodium citrate) and preserved at room temperature for 10 min, rinsed thrice with PBS (5 min each), treated with 3% H2O2 at room temperature for 10 min to inhibit peroxidase activity, and washed three more times with PBS for (5 min each). Subsequently, tissues were blocked using 10% goat serum diluted for 20 min at 37 °C, followed by overnight incubation at 4 °C with either Anti-ASC or Caspase 1 antibody (both 1:500). After cleaning, sections were incubated with biotinylated secondary antibodies (diluted to 1:200) for 1 h at 37 °C, followed by treatment with avidin-biotin-peroxidase (1:200) for 45 min at 37 °C. Staining was performed using 0.05% 3,3’-diaminobenzidine with 0.03% H2O2, followed by counterstaining with Mayer’s hematoxylin. Experiments were conducted without primary antibodies, showing no positive staining. Sections were finally analyzed using a light microscope (E100, Nikon Corporation, Tokyo, Japan).
An in vitro OGD/R model was established as previously described [25, 29]. After a brief wash with glucose-free culture medium, primary astrocyte cultures were replenished with fresh glucose-free medium without serum. To induce OGD, cells were incubated in a humidified Tri-gas chamber (Thermo Scientific, Waltham, MA, USA) under hypoxic conditions for 24 h, with a gas mixture of 94% N2, 5% CO2, and 1% O2. After 24 h, OGD exposure was stopped by changing the medium to serum-free 80% DMEM (containing 7.5 mM glucose) and adding LIF stock solution to the culture medium at concentrations of 1, 3, 10, 30, and 60 ng/mL. The cells were then incubated at 37 °C with 5% CO2 for another 24 hours under normal oxygen conditions. Control cells, which were included in all experiments, underwent the same treatment except for OGD exposure. For inhibitor experiments, cells were pretreated with/without OGD/R and then treated with various concentrations of PD98059, SP600125, SB203580, and LY294002 for 1 h, followed by treatment with LIF (60 ng/mL) for another hour. Cell lysates were immunoblotted and pretreated with the indicated inhibitors for 2 h, followed by treatment with LIF (60 ng/mL) for another 24 h, after which cell lysates were immunoblotted to assess HO-1 expression.
RNA was isolated from Ctrl and OGD/R groups of CTX TNA2 cells using the Ribo-Zero™ rRNA Removal Kit (Epicenter, New Zealand), with three parallel replicates per group. Next, six samples (three per group) were shipped to Novogene Corporation (Beijing, China) for RNA-seq analysis using the Illumina Nova-Seq 6000 platform. Differentially expressed genes (DEGs) between the two groups were identified using DEG-seq and analyzed using the KEGG database for pathway analysis. The Novo-gene network platform was used to analyze the data (https://www.novogene.com).
A diacetyl dichloro fluorescein (DCFH-DA) probe was used to detect intercellular ROS. In summary, cells were seeded in 6-well dishes and treated with OGD/R and/or LIF. After removing the medium, 1 mL of medium containing the DCFH-DA (diluted 1:1000 in serum-free medium) was added to each well. Following a 40-minute incubation period, the medium was removed, and the cells were rinsed thrice with PBS. A fluorescence microscope was used to observe the cells, and absorbance was measured using a fluorescence spectrophotometer (NanoVne, GE Healthcare, Chicago, IL, USA).
Cells were loaded with 5 µM MitoSOX™Red (Thermo Scientific, MP36008) in Hank’s Balanced Salt Solution (HBSS) for 10 min at 37 °C, washed twice with PBS, and imaged using a confocal microscope (LSM880, Zeiss, Oberkochen, Germany) (excitation/emission: 510/580 nm). Fluorescence intensity was quantified using ImageJ v1.53 (National Institute of MentalHealth, Bethesda, MD, USA).
CTX TNA2 rat astrocytes were stained using the in situ cell death detection kit per manufacturer instructions, as previously described [25].
Cell viability was assessed using the Cell Counting Kit-8 (CCK-8, Sigma,
#96992). Cells were seeded in 96-well plates (5
Cellular RNA was extracted using the TRizol reagent, and reverse transcription
was conducted as previously described. Real-time PCR was conducted using a
multicolor detection system (Light Cycler 480Ⅱ, Roche, Basel, Switzerland),
followed by melting curve analysis to examine the melting temperature of the
product. The RNA underwent reverse transcription to produce cDNA utilizing the
Prime Script RT Reagent Kit under reaction conditions of 37 °C for 15 min followed
by 85 °C for 5 s. The resulting cDNA was diluted in water by a factor of 10 and
stored at –20 °C. Quantitative PCR (qPCR) was performed to measure LIFR and
NLRP3 F: 5′-GCCTTGAAGAGGAGTGGATAG-3′;
NLRP3 R: 5′-TGGGTGTAGCGTCTGTTGAG-3′;
ASC F: 5′-CTCAGGGCACAGCCAGAACAG-3′;
ASC R: 5′-GCCATACAGAGCATCCAGCAA-3′;
GSDMD F: 5′-TGCGGGAGTGGTCAAGAA-3′;
GSDMD R: 5′-TGCTCAGGAGGCAGTAGGG-3′;
caspase1 F: 5′-TGGATTGCTGGATGAACTT-3′;
caspase1 R: 5′-GCTGATGGACCTGACTGA-3′;
IL-1
IL-1
IL-18 F: 5′-GCAGTAATACGGAGCATAAA-3′;
IL-18 R: 5′-ATCCTTCACAGATAGGGTCA-3′;
Cytoplasmic and nuclear proteins were extracted and isolated using a Nuclear and
Cytoplasmic Protein Extraction Kit (WLA020a, WanleiBio, Shenyang, Liaoning,
China), transferred to a microcentrifuge tube, and centrifuged at 500
Rat astrocytes from the CTX TNA2 cell line were processed for western blotting following a previously outlined protocol [25]. After separation on a 10% sodium dodecyl sulfate-polyacrylamide gel electrophoresis gel, proteins (30 µg) were transferred to a polyvinylidene difluoride membrane using electro-blotting. The proteins were examined using primary antibodies and then treated with HRP-conjugated secondary anti-rabbit IgG antibodies to prevent possible errors in loading and transfer between samples in various lanes. Bands for phospho-ERK, Akt, JNK, and p38 MAPK were removed and retested using antibodies against total ERK, Akt, JNK, and p38 MAPK, and the blots were developed using an electrochemiluminescence western blotting detection reagent.
Data are presented as the mean
We used an OGD/R model to mimic the pathological processes in CTX TNA2 rat astrocytes during PWMI. CTX TNA2 cells were treated with OGD for 0–48 h, followed by 24-h reoxygenation to construct an in vitro ischemia-reperfusion (I/R) model. OGD/R-induced cytotoxicity was first tested by the CCK-8 assay. CTX TNA2 cells exhibited substantial damage after 12–48 h of OGD, followed by 24-h reoxygenation. Cell death after OGD exposure for 12, 24, and 48 h increased in a time-dependent manner (Fig. 1A). Therefore, OGD24 h/R24 h was used for further studies, and the results of phase-contrast microscopy were consistent with those of the CCK-8 assay (Fig. 1B). Hoechst 33342/PI double staining was used to further evaluate the effects of OGD/R-induced cell injury in CTX TNA2 cells. As shown in Fig. 1C, most cells had normal nuclear morphology with uniform blue nuclei in the control group. After exposure to OGD/R, more cells with bright red nuclei were observed. To further validate the effect of OGD/R, TUNEL was used to measure the effect of OGD/R, showing that the OGD/R group had elevated apoptosis levels (Fig. 1D). We investigated intracellular ROS production by monitoring DCFH2-DA conversion into DCF. Cell exposure to OGD/R significantly increased DCF fluorescence (Fig. 1E). Next, we assessed the ROS levels using MitoSOX staining. Consistent with our DCFH2-DA staining results, ROS levels increased in CTX TNA2 cells exposed to OGD/R (Fig. 1F). Altogether, these data suggest that OGD/R induces oxidative stress-dependent cell injury in CTX TNA2 cells.
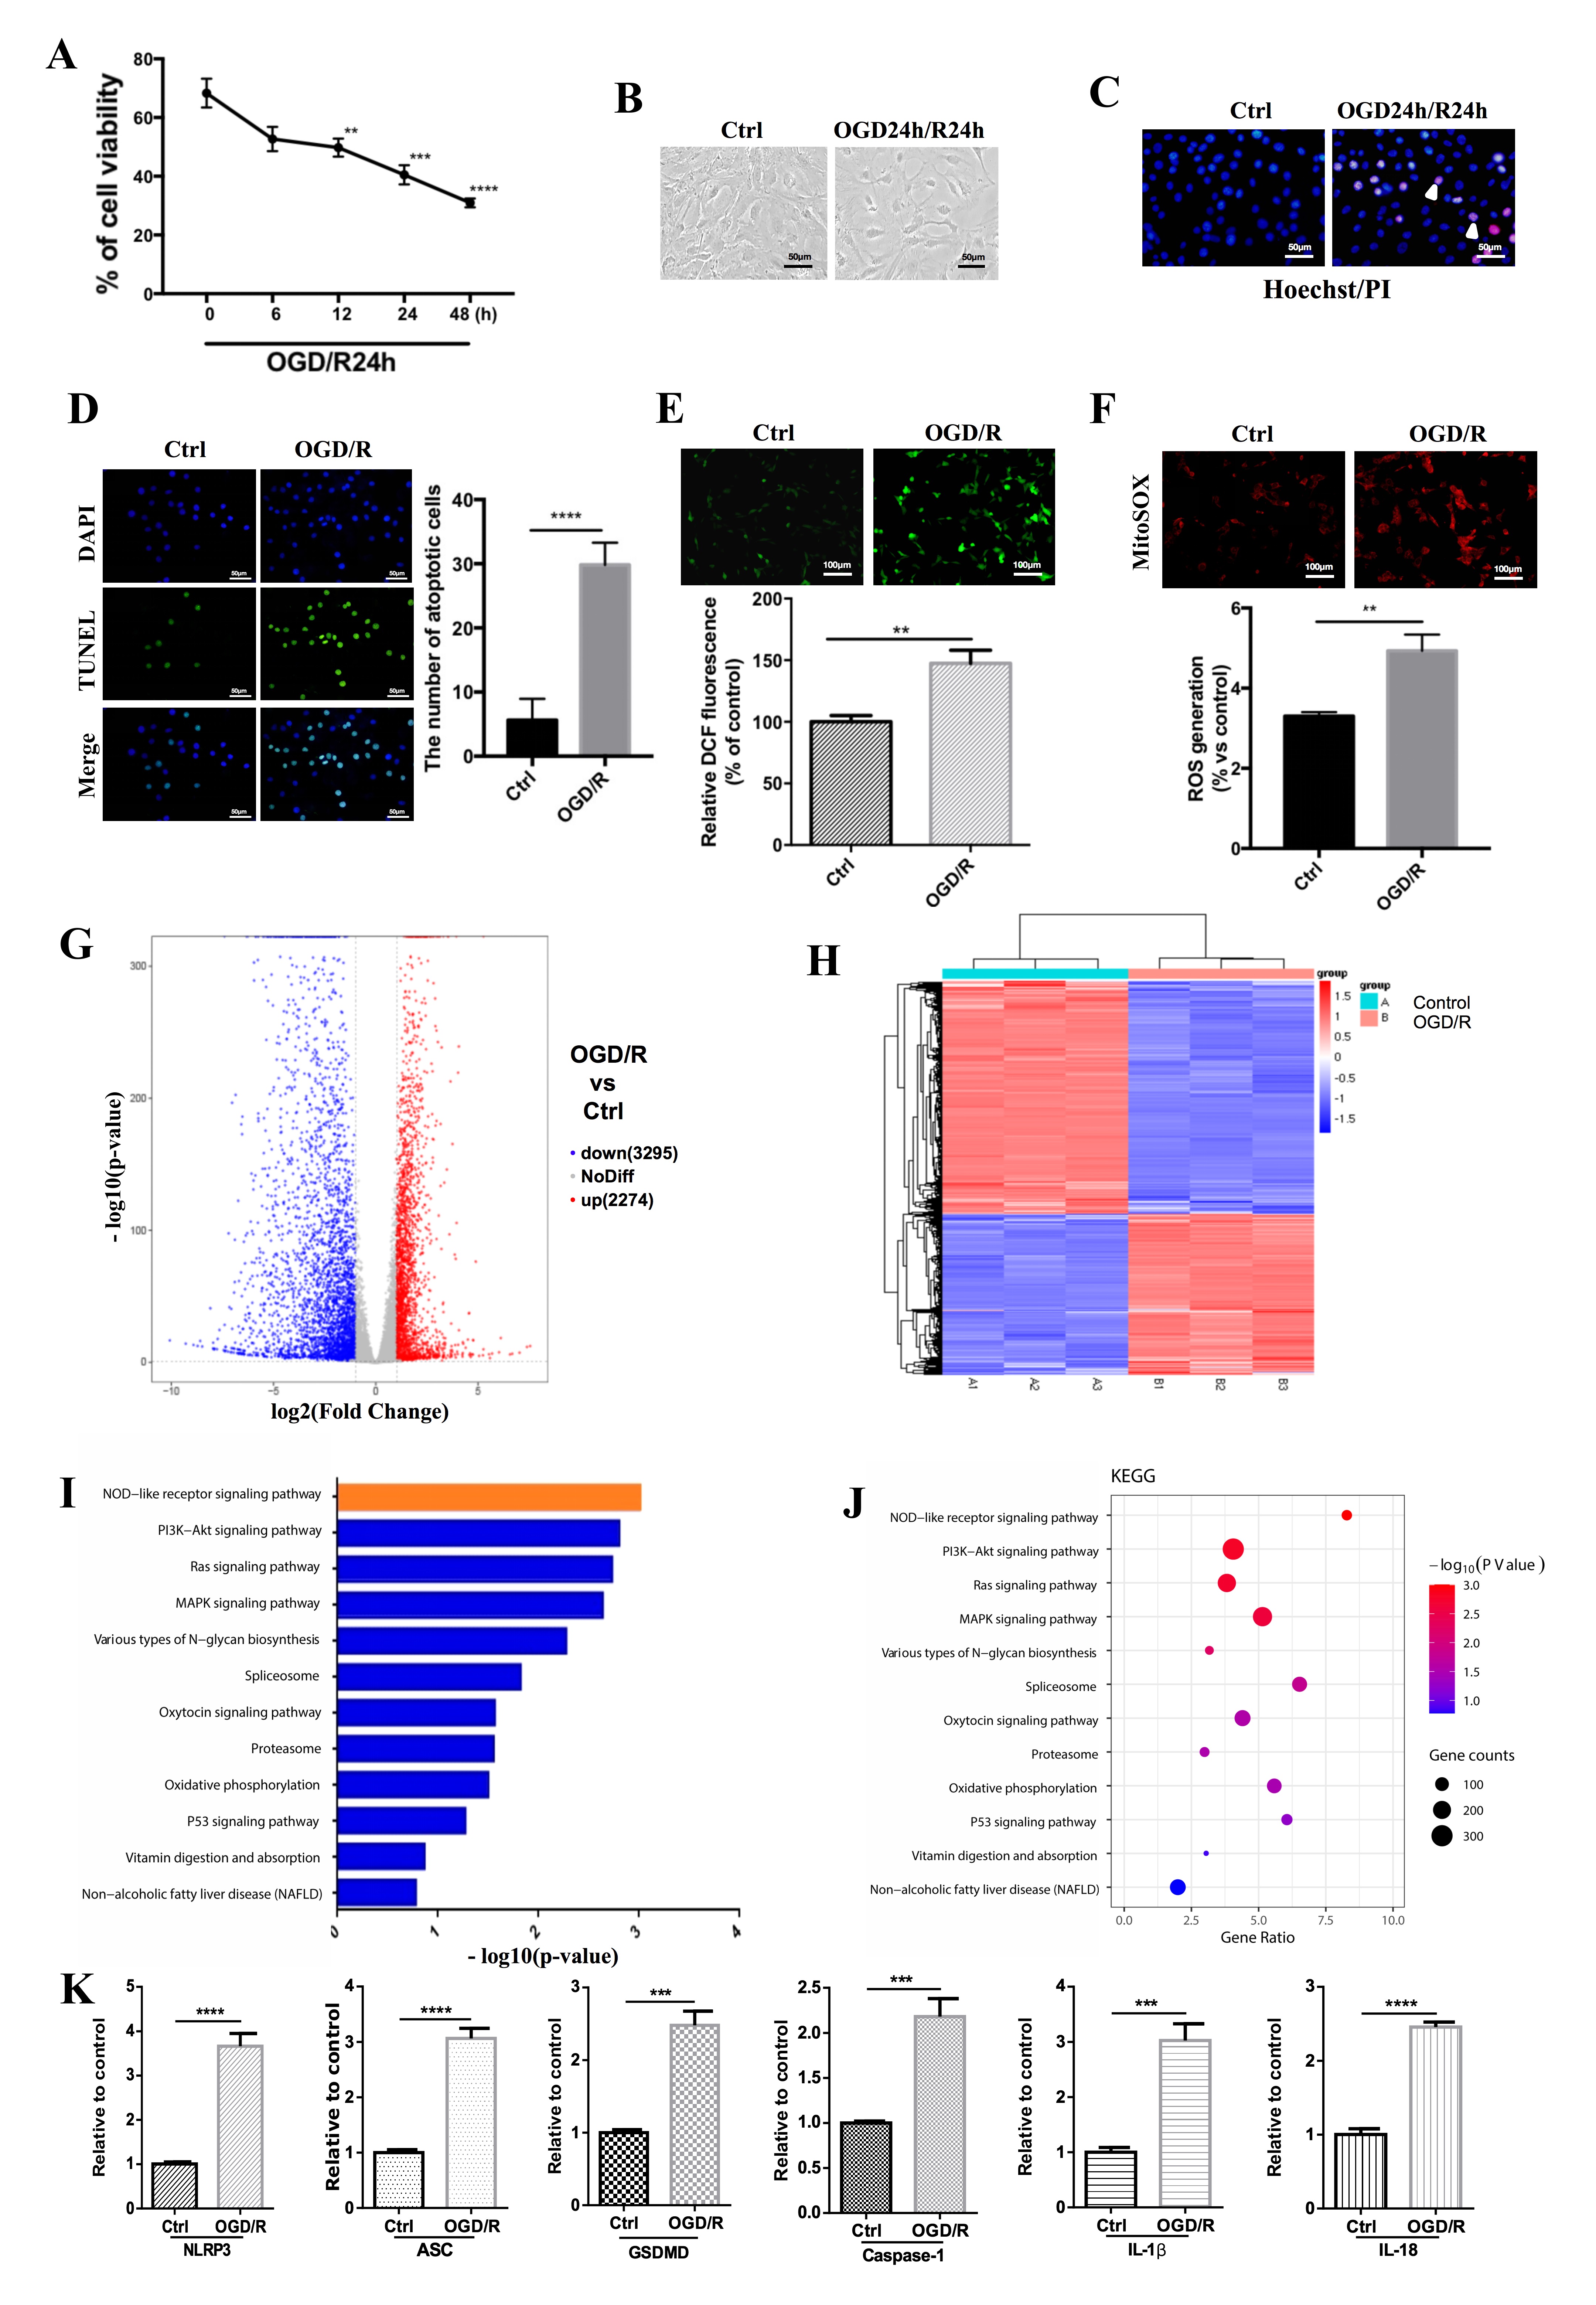 Fig. 1.
OGD/R decreased CTX TNA2 rat astrocytes cell viability and
increased pyroptosis and cell oxidative. (A) CTX TNA2 rat astrocytes cells were
subjected to oxygen and glucose deprivation for 0–48 h, and then reoxygenated
for 24 h. CCK-8 assay was used to detect cell viability. OD values were presented
as means
We conducted a genome-wide RNA-seq to examine how OGD/R affects CTX TNA2 cell
viability and injury. Total RNAs were isolated from the TNA2 cells exposed to
OGD/R and sequenced. A total of 5569 genes were differentially expressed upon
OGD/R exposure (fold change
We further confirmed that OGD/R induced pyroptosis in CTX TNA2 rat astrocytes
using western blotting and immunofluorescence. Consistent with our qRT-PCR
results, western blot results showed OGD/R increased pyroptosis-related protein
expression, including NLRP3, ASC, GSDMD, caspase-1, IL-1
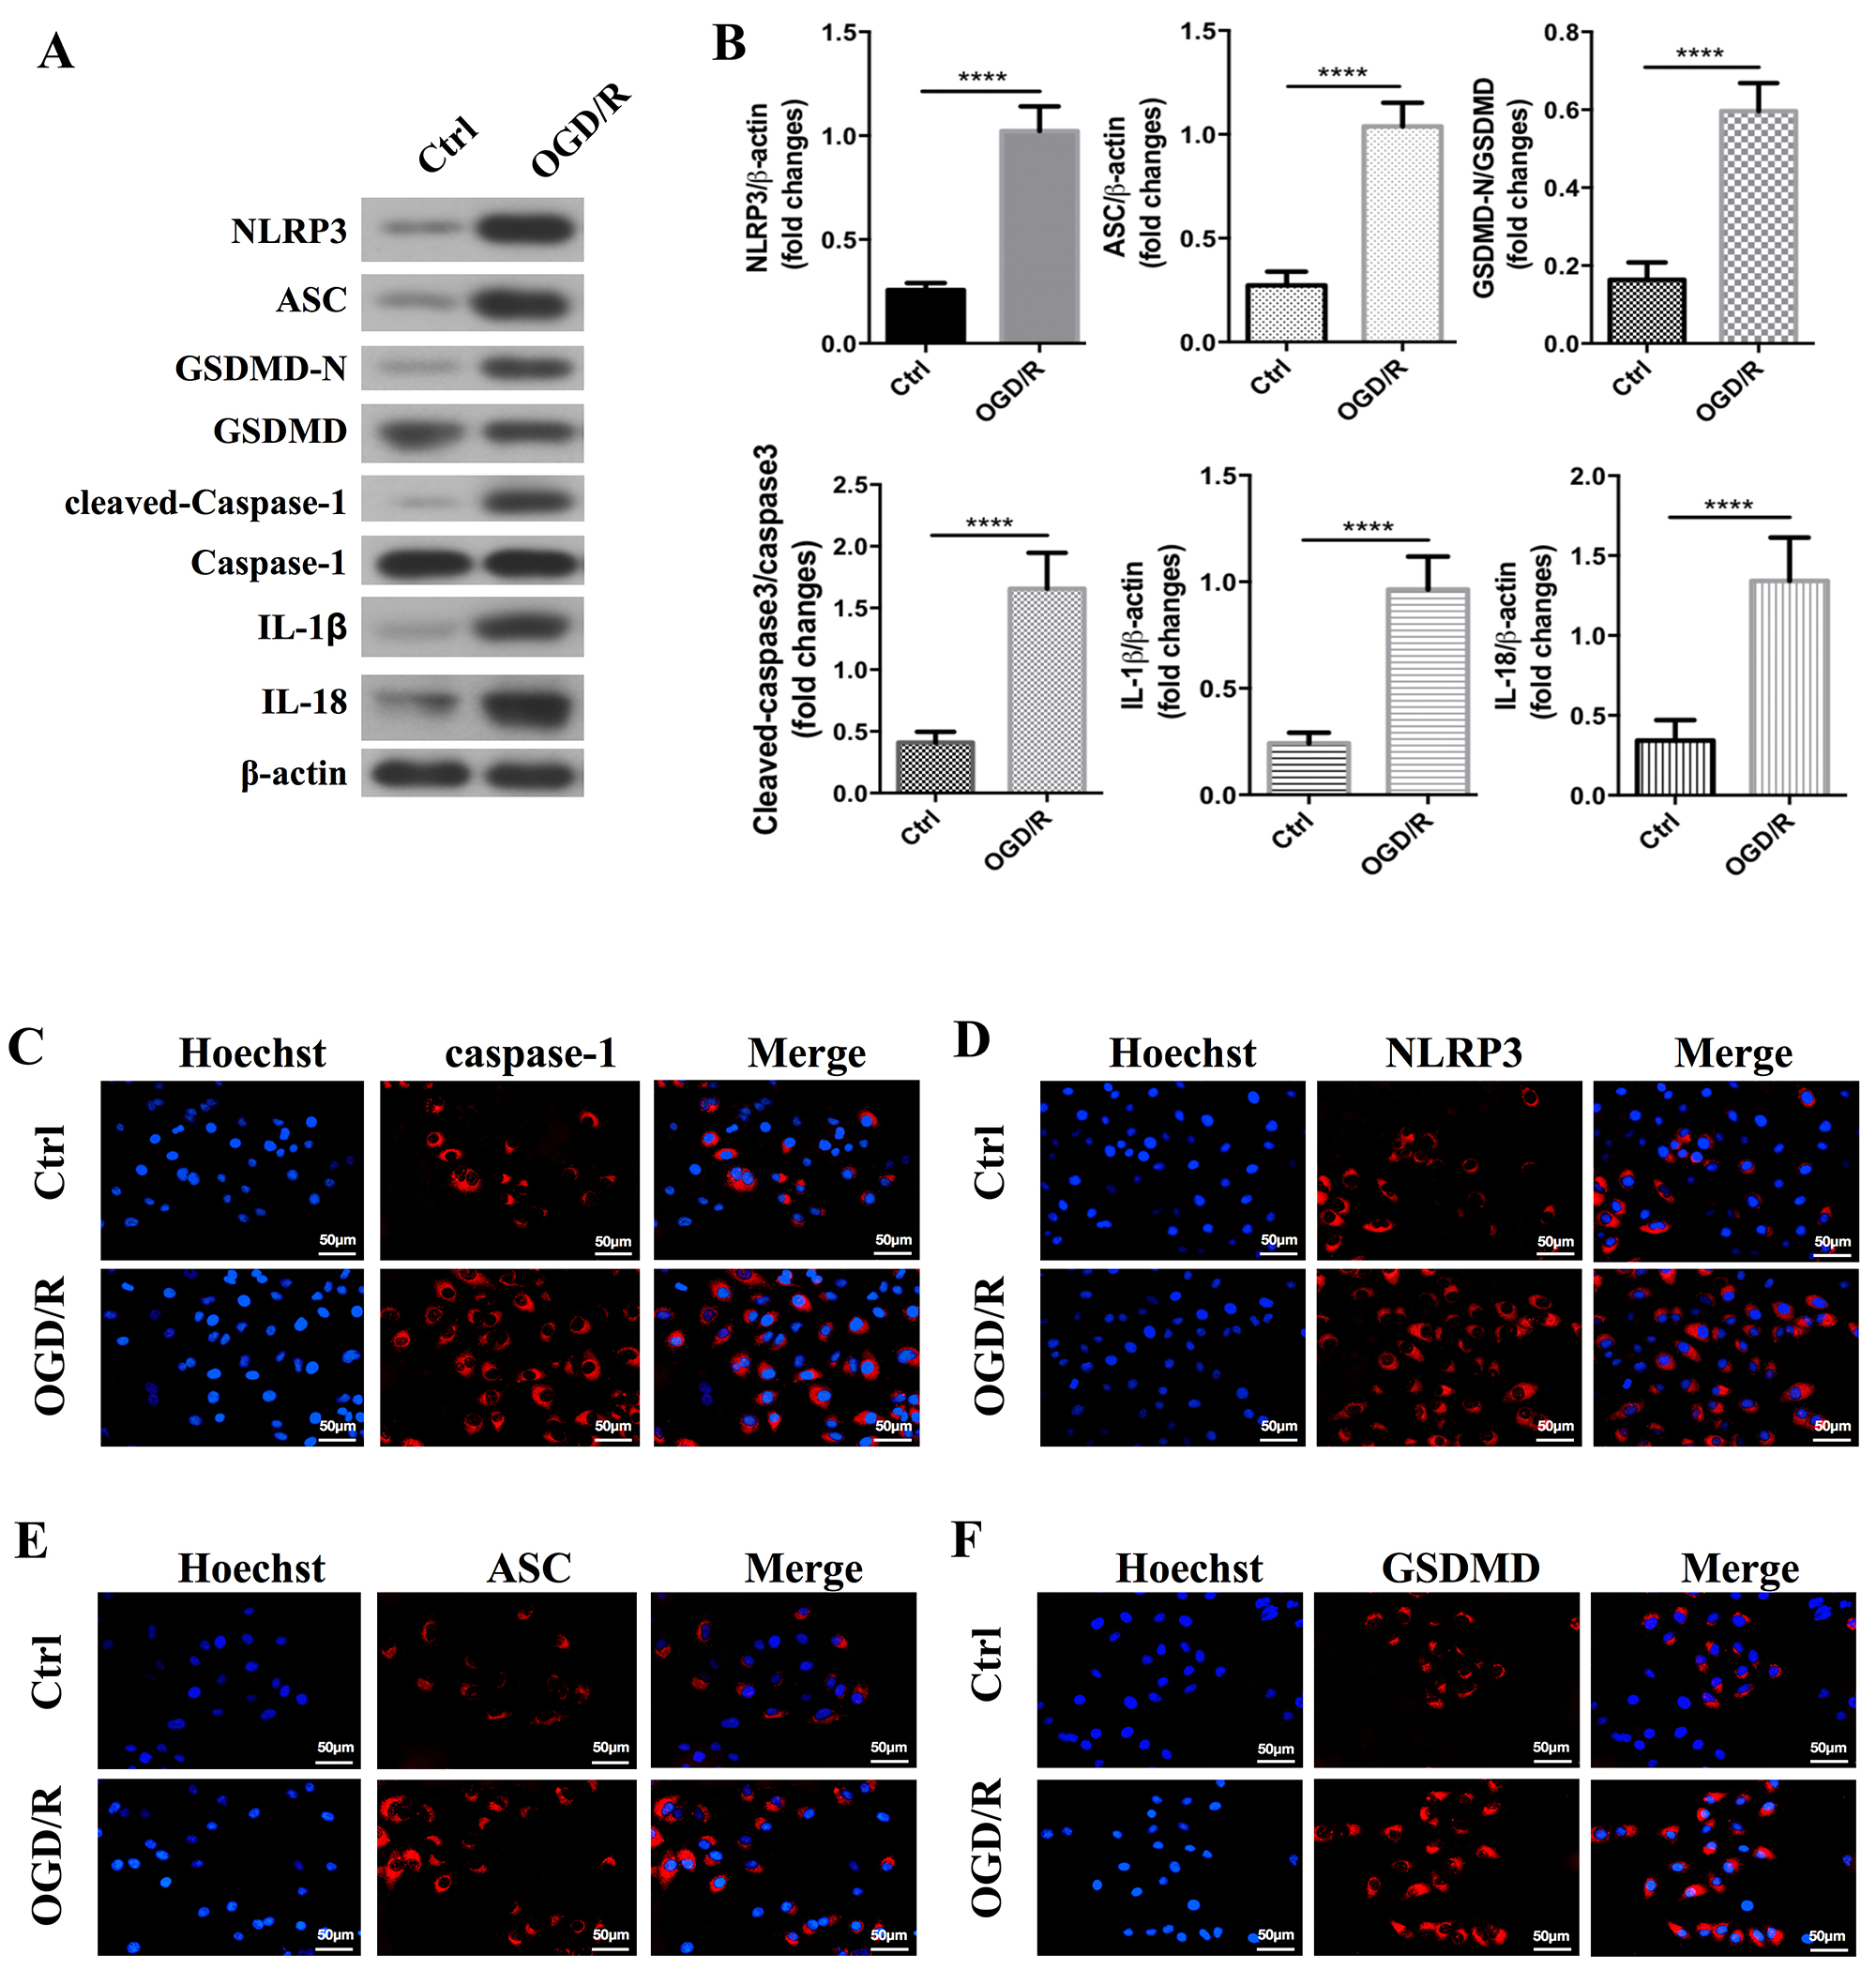 Fig. 2.
OGD/R increased the activation of pyroptosis in CTX TNA2 rat
astrocytes. (A) Western blot and (B) densitometric analysis for NLRP3,
GSDMD, ASC, caspase-1, IL-1
We performed further analyses using in vivo models of HI-induced PWMI
in PND3 rats. We validated that HI induces pyroptosis in PWMI rat models, showing
that pyroptosis-related protein levels, including NLRP3, GSDMD, ASC, caspase-1,
IL-1
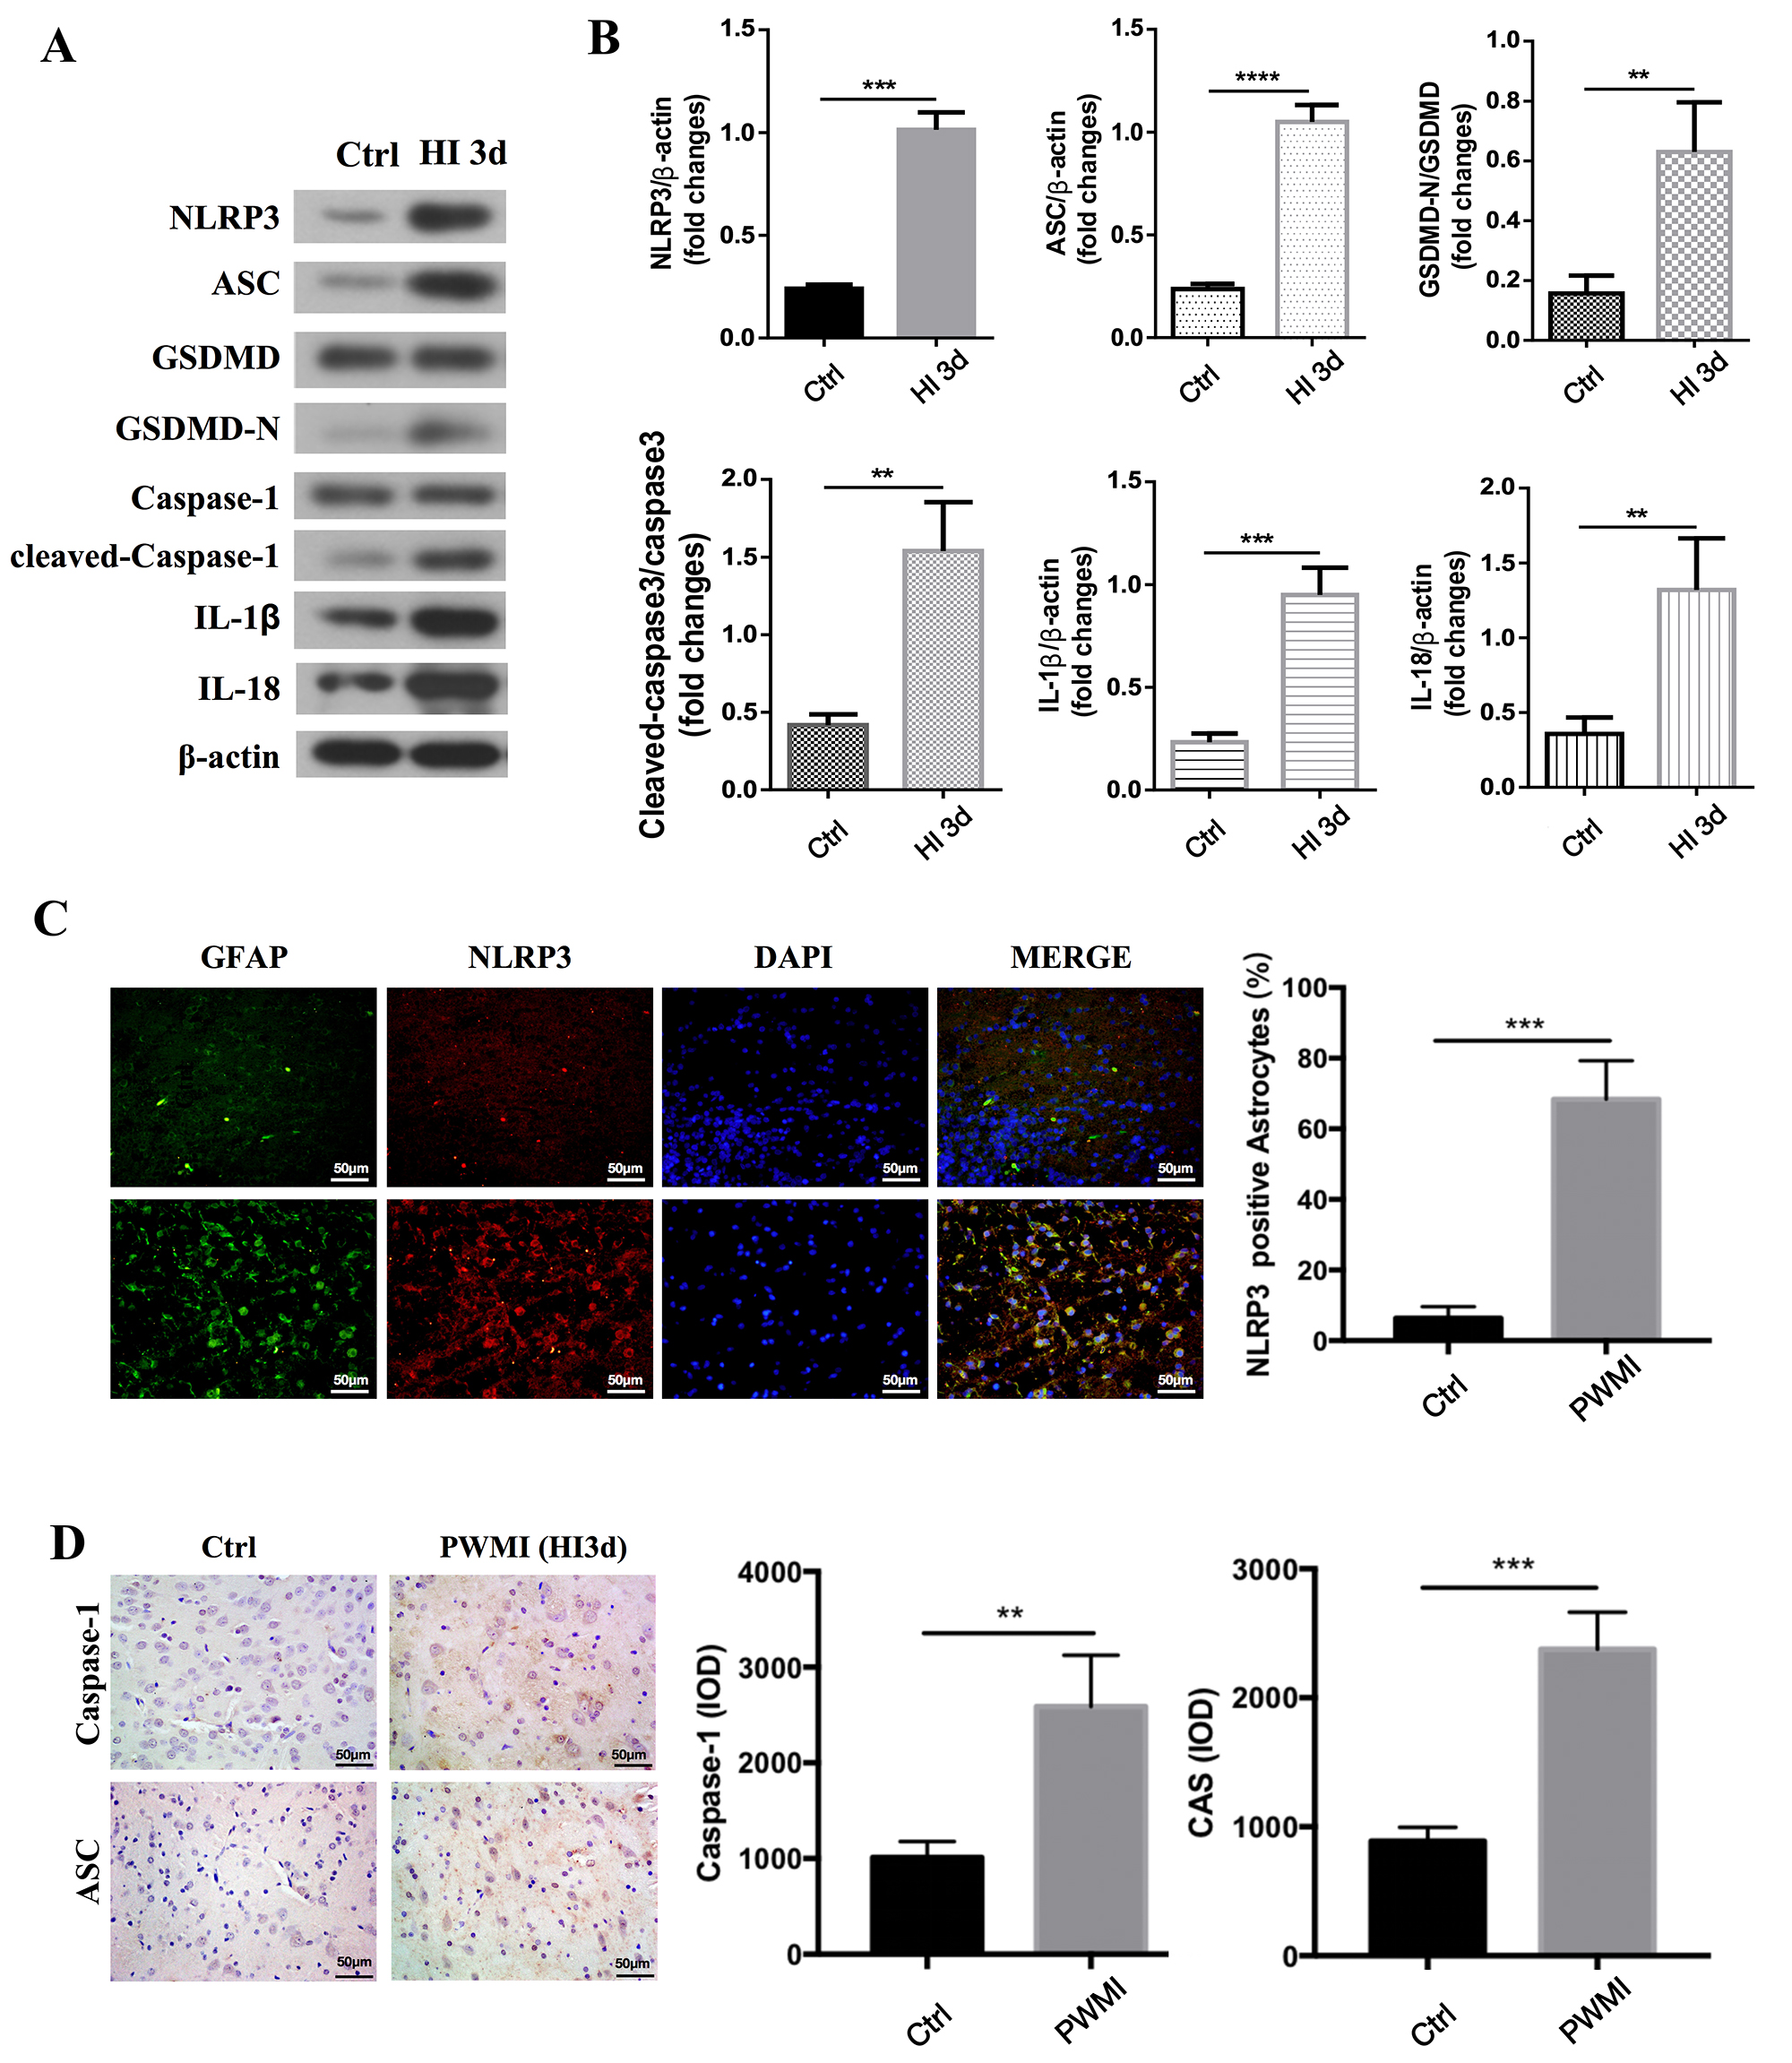 Fig. 3.
OGD/R increased the activation of pyroptosis in PND3 rat. PND3
rat was modeled by 3 days hypoxia-ischemia (HI). At 3 days post-surgery (PWMI
induction), the animals were sacrificed and the brain tissues of experimental
rats were collected for analysis. The brain samples were obtained, lysed
andprotein was extracted. (A) Western blot and (B) densitometric analysis for
NLRP3, ASC, GSDMD, caspase-1, IL-1
Previous studies revealed that LIF has neuroprotective effects against PWMI [25, 26]. However, the mechanisms through which LIF mediates its therapeutic effects remain unclear. Nrf2/HO-1 is important for protecting neurons against OGD/R and HI-induced injury [29, 30, 31]. We first investigated the possibility that LIF activates the Nrf2/HO-1 pathway by treating CTX TNA2 rat astrocytes with various LIF concentrations for 24 h. As shown in Fig. 4A, LIF (1–60 ng/mL) induced HO-1 expression in a concentration-dependent manner. Treatment of CTX TNA2 rat astrocytes with LIF resulted in a time-dependent increase in HO-1 protein expression (Fig. 4A). Consistent with the western blot findings, confocal immunofluorescence analysis revealed that LIF induced HO-1 upregulation (Fig. 4B).
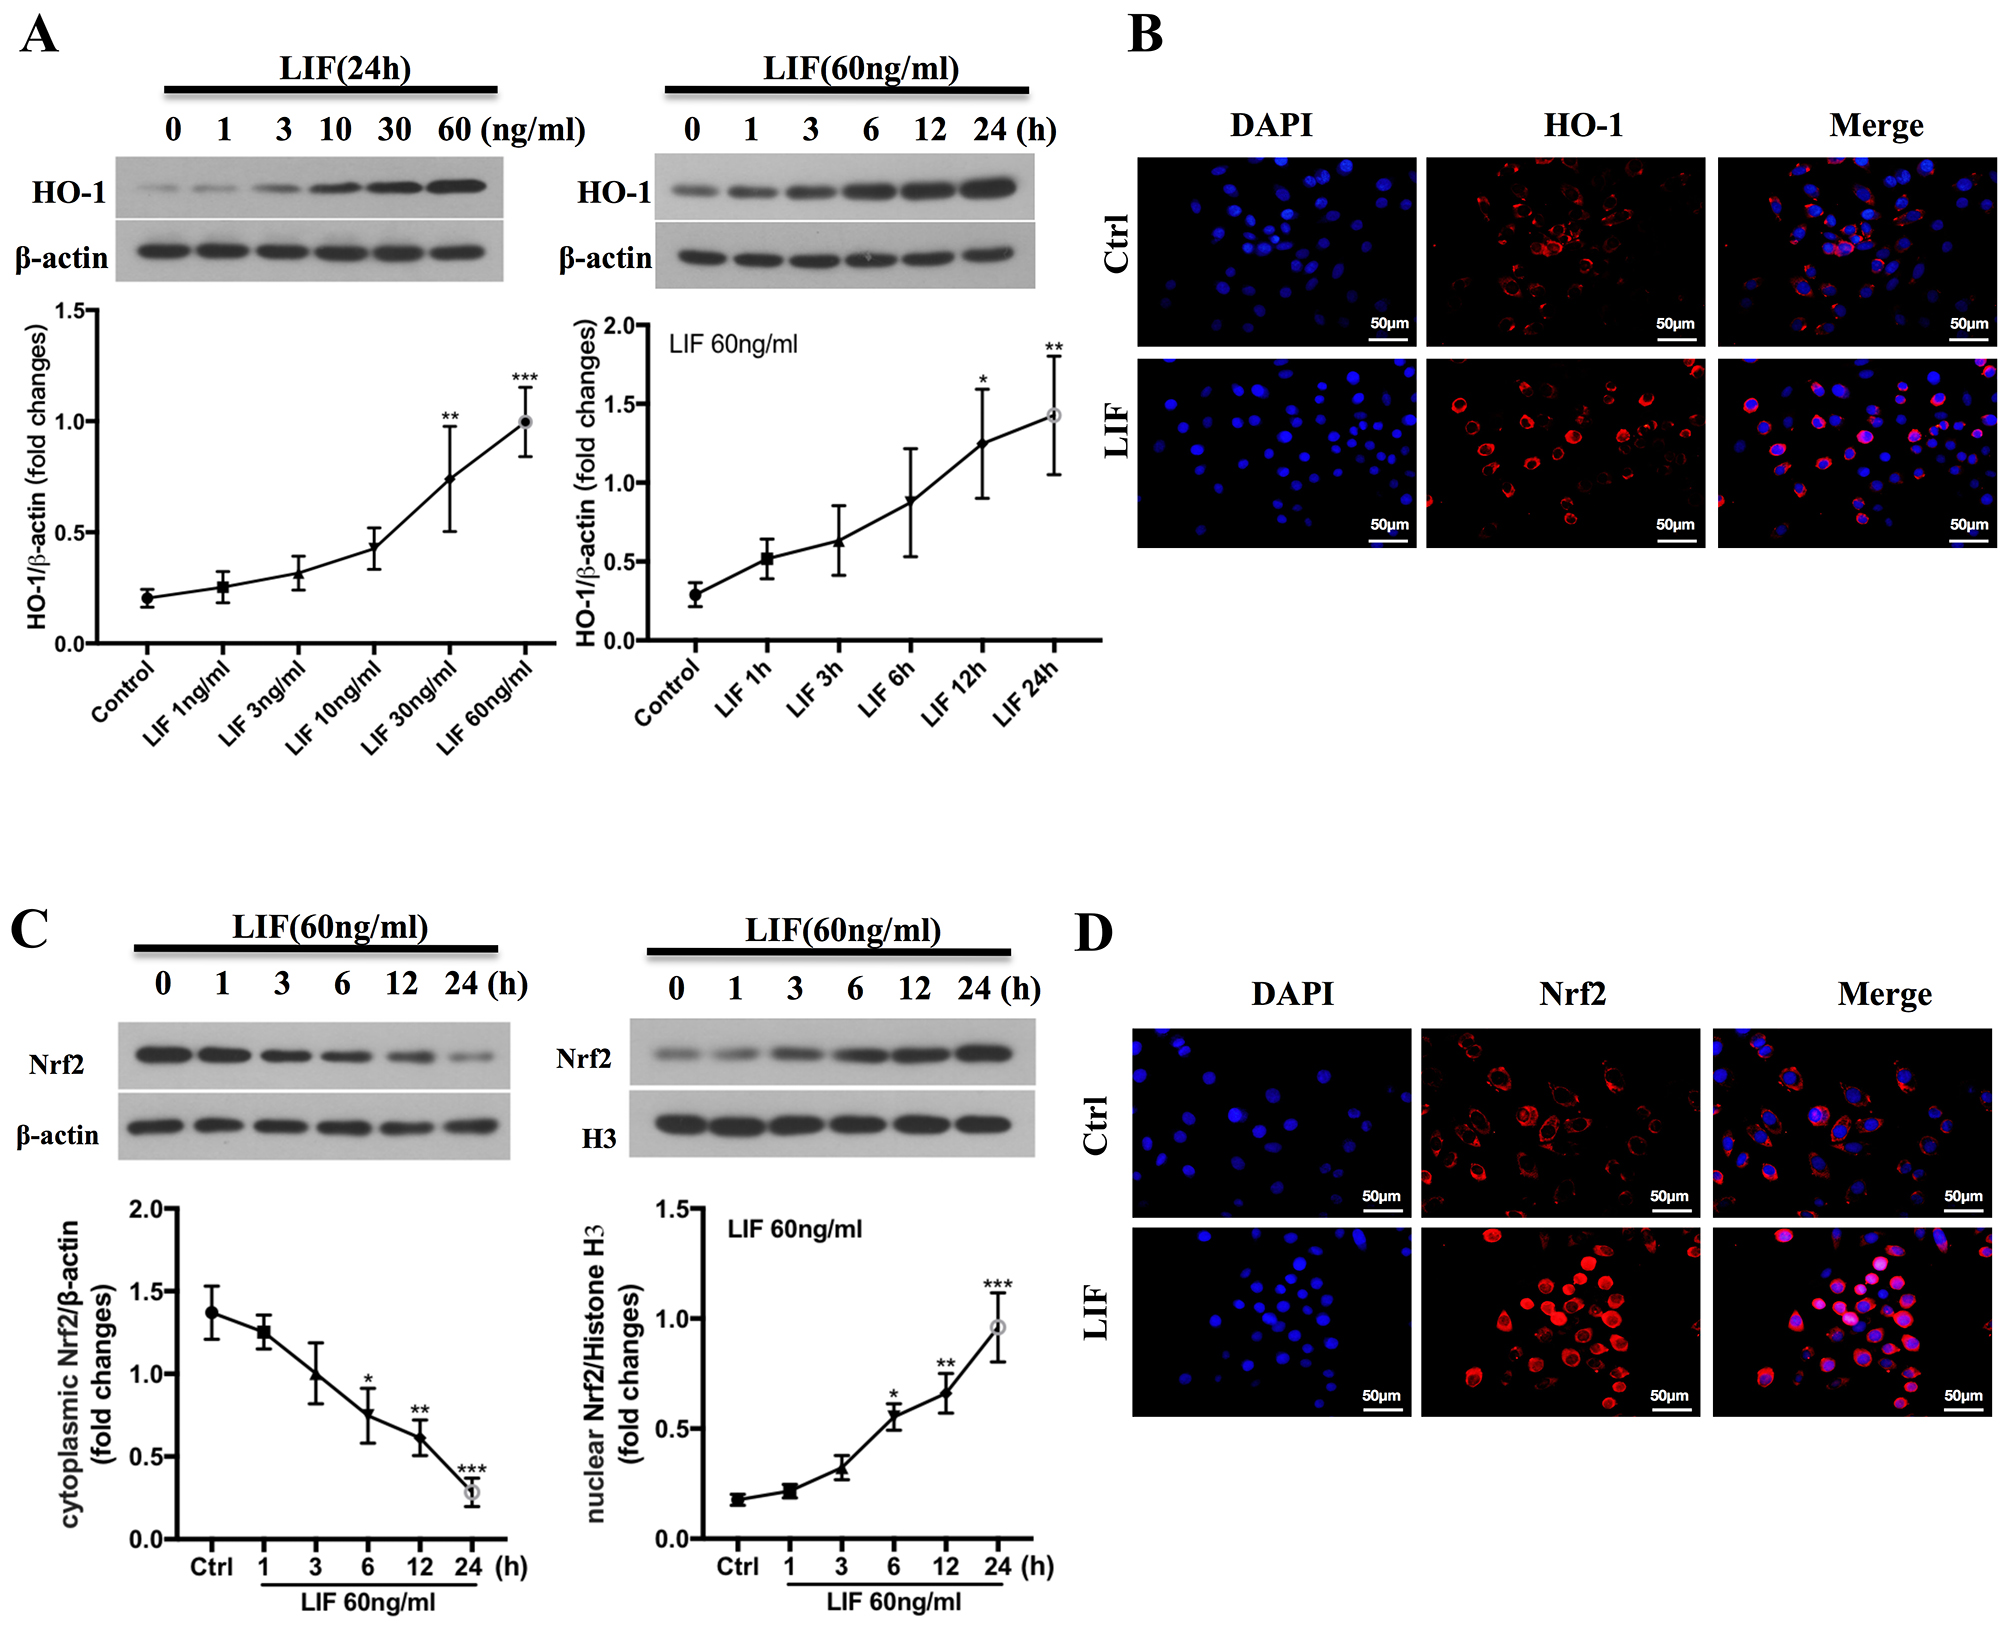 Fig. 4.
LIF activates Nrf2/HO-1 pathway. (A) CTX TNA2 rat astrocytes
were treated with indicated concentrations of LIF for 24 h (left panel), or with
60 ng/mL LIF for indicated time points (right panel). Western blot was used to
determine levels of HO-1 proteins (B) Cells were treated with 60 ng/mL LIF for 24
h. Cells were stained with an anti-HO-1 antibody (left) and nuclei with DAPI
(middle). HO-1 was examined using immunochemical staining and confocal
microscopic analysis. The scale bars = 50
µm. (C) CTX TNA2 rat astrocytes were treated with indicated
concentrations of LIF for 24 h (left panel), or with 60 ng/mL LIF for different
time points (right panel). Levels of Nrf2 proteins in cytosol and nucleus were
determined by Western blot. (D) Cells were treated with 60 ng/mL LIF for 24 h,
and immunofluorescence assay was used to detect Nrf2 nuclear translocation. The
scale bars = 50 µm. (*p
Nrf2 is an important transcription factor that regulates antioxidant response element (ARE)-driven HO-1 expression. We then determined whether LIF could activate Nrf2. CTX TNA2 rat astrocytes were treated with LIF (60 ng/mL), and Nrf2 protein levels in the cytosol and nucleus were determined by western blotting. As shown in Fig. 4C, LIF promotes Nrf2 accumulation in the nucleus compared to control cells. Confocal immunofluorescence analysis confirmed the western blotting results, as indicated by the increased nuclear localization of Nrf2 (Fig. 4D). Collectively, these results suggest that LIF activates the Nrf2/HO-1 pathway.
Many signal transduction pathways, such as the MAPK and PI3K/AKT, are required for the regulation of Nrf2 expression and nuclear translocation, thereby leading to HO-1 upregulation [32]. We tested whether LIF activates the MAPK and PI3K/Akt pathway. We examined the total and phosphorylated protein levels of MAPK and PI3K/AKT in CTX TNA2 rat astrocytes treated with LIF by western blotting and found that LIF activated ERK, p38MAPK, JNK, and PI3K/Akt. LIF treatment (60 ng/mL) induced a time-related increase in the phosphorylation of ERK1/2 and PI3K/Akt (Fig. 5A), and JNK and p38MAPK (Fig. 5B). The maximal activation of both PI3K/Akt and MAPK was observed 1 h after LIF stimulation. LIF activated the MAPK and PI3K/Akt cascade at 1h after LIF treatment (Fig. 5C,D).These data indicate that LIF activates the MAPK and Akt kinase pathways in CTX TNA2 rat astrocytes.
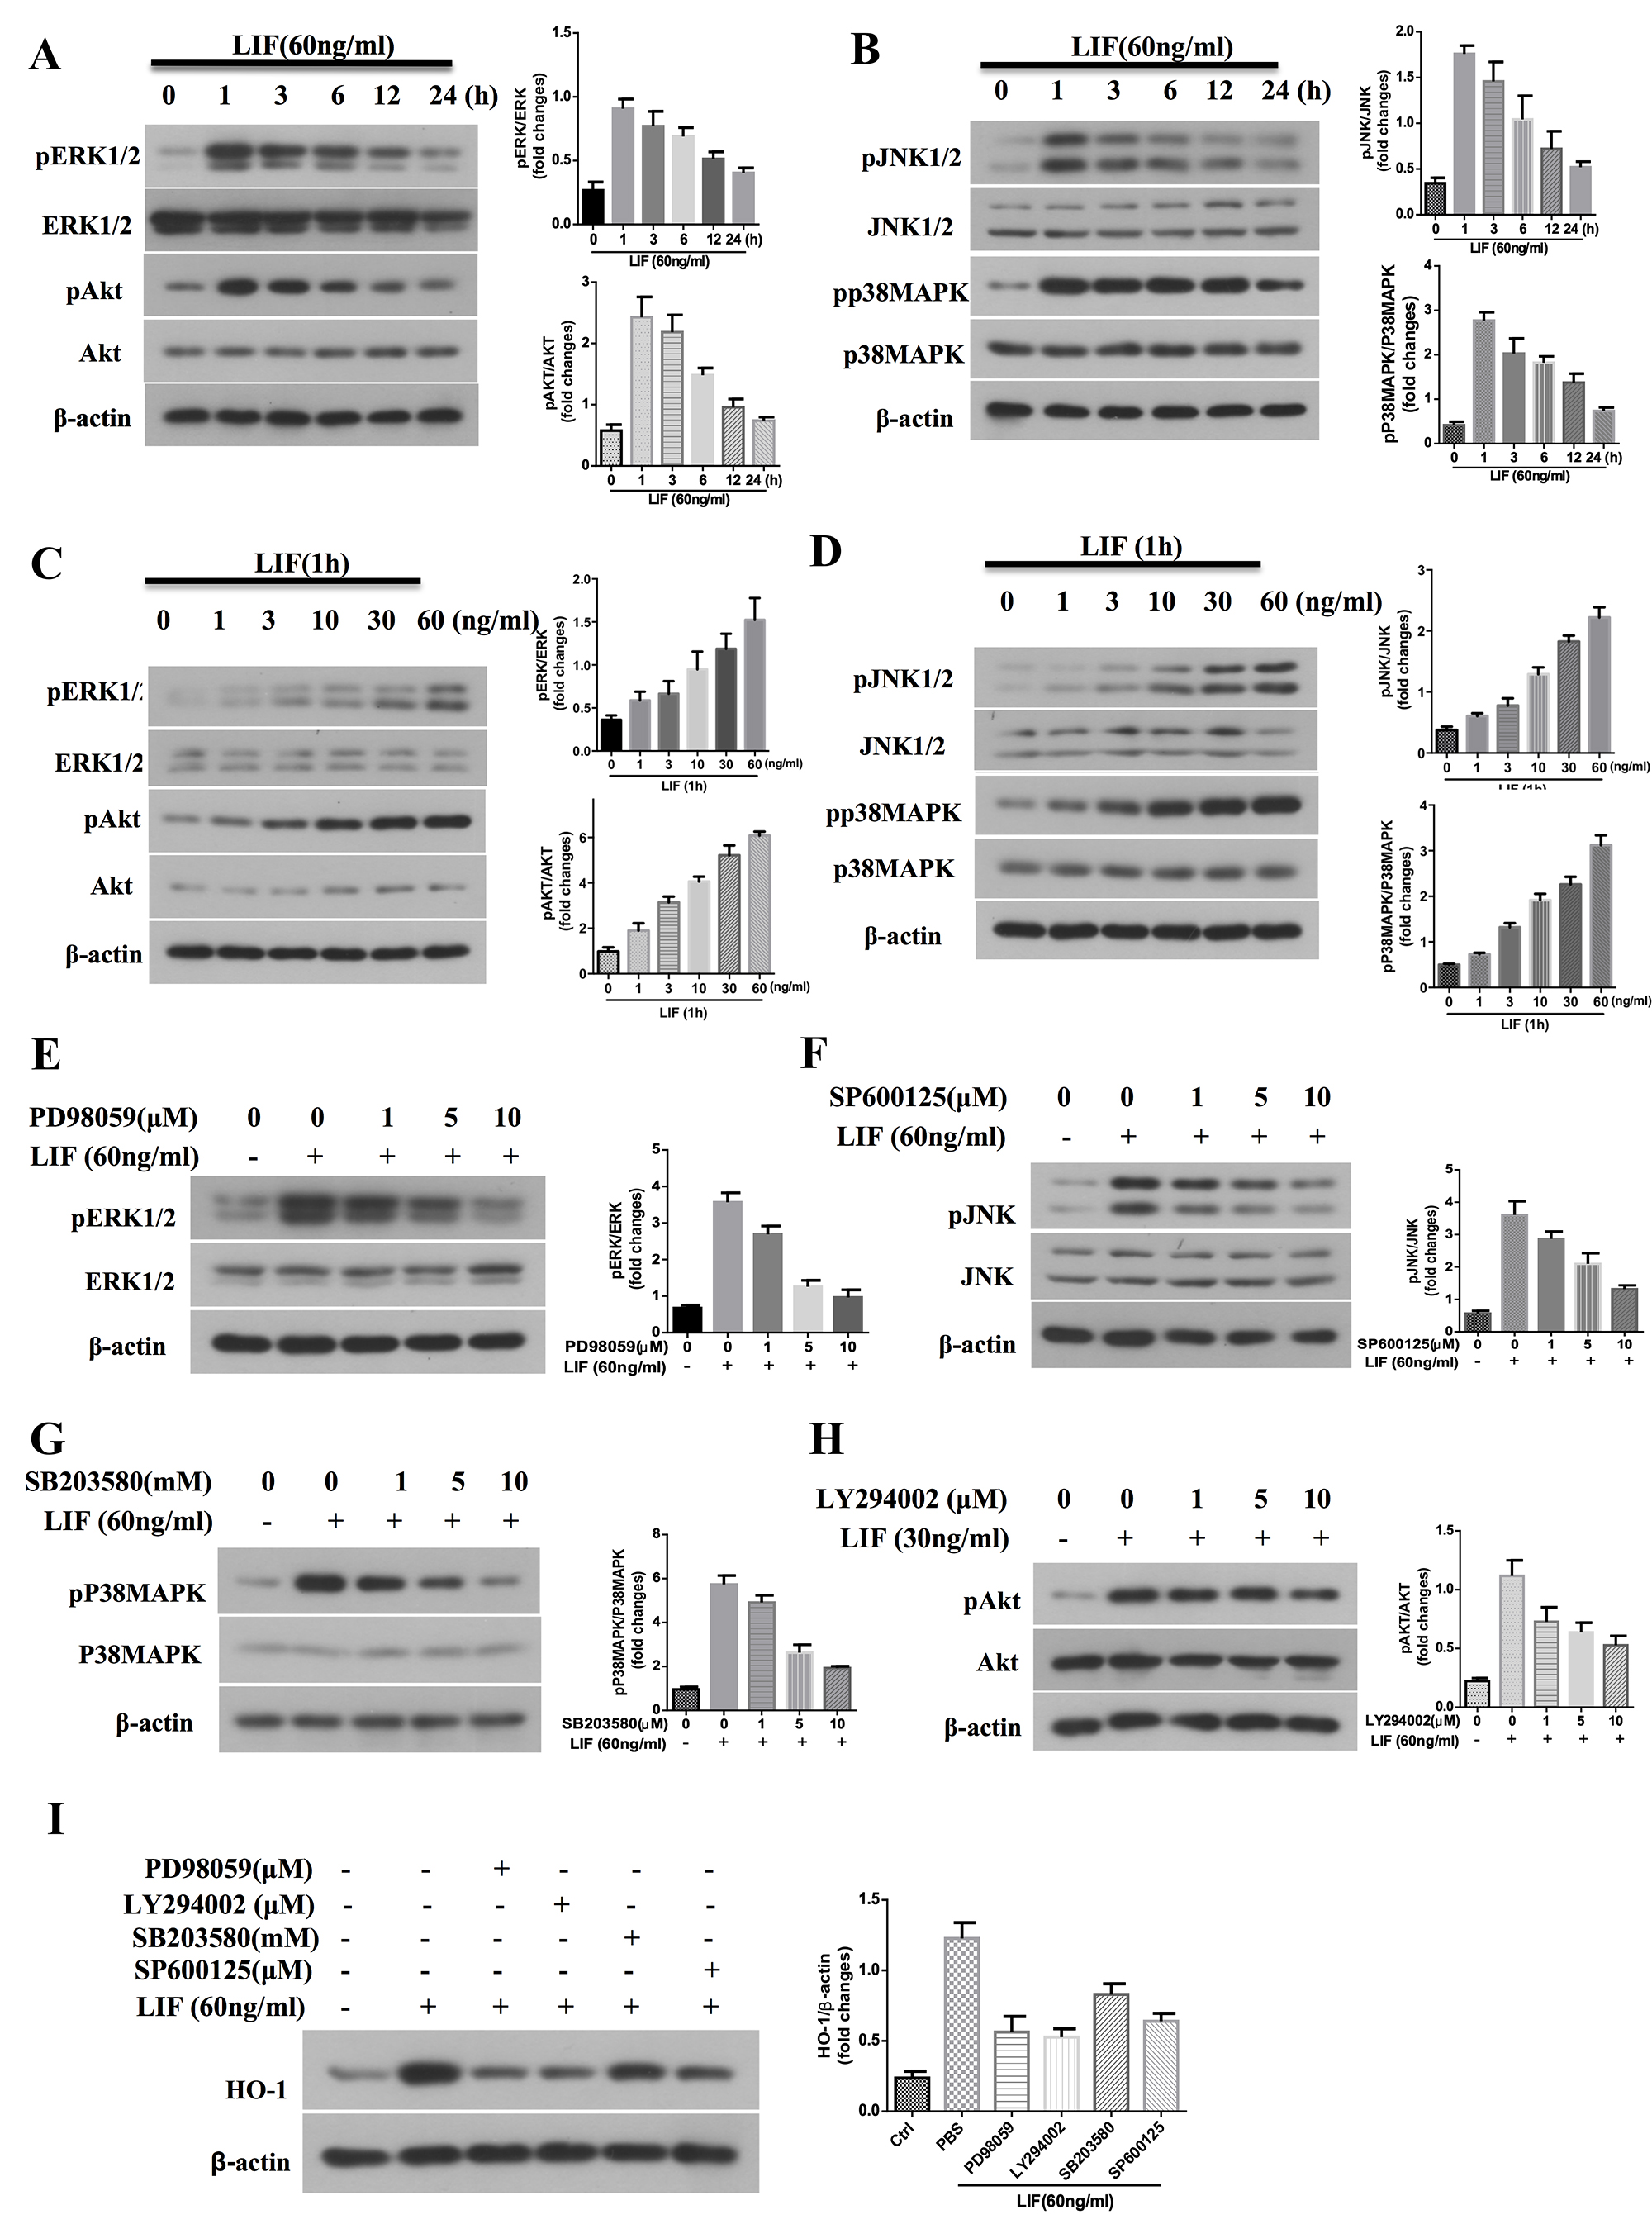 Fig. 5.
LIF induces HO-1 production in CTX TNA2 rat astrocytes through
MAPK and Akt kinase pathways. Western blot analysis for MAPKs and PI3K/Akt.
(A,B) CTX TNA2 rat astrocytes were treated with LIF (60 ng/mL) for indicated
times or (C,D) treated with different concentration of LIF for 1 h. Specific
antibodies that recognize phospho-MAPK, pAkt, and total MAPK, Akt were used to
immunoblot cell lysates.
We then explored the role of the MAPK and PI3K/Akt pathways in LIF-induced HO-1 upregulation. We examined the effect of PD98059 (an ERK inhibitor), SP600125 (a JNK inhibitor), LY294002 (a PI3K/AKT inhibitor), and SB203580 (a p38 inhibitor). LIF-mediated increase in MAPK and PI3K/Akt phosphorylation was blocked by PD98059, SP600125, SB203580, and LY294002 (Fig. 5E–H). To further confirm the roles of MAPK and PI3K/Akt in the HO-1 upregulation, we tested whether pathway inhibitors could block HO-1 upregulation. As shown in Fig. 5I, PD98059, SP600125, SB203580, and LY294002 reversed LIF-induced HO-1 expression, suggesting that LIF upregulates HO-1 expression by activating AMPK and AKT signaling in CTX TNA2 rat astrocytes.
Given that pyroptosis plays a role in OGD/R and that LIF upregulates HO-1
expression by activating AMPK and AKT signaling in CTX TNA2 rat astrocytes, we
hypothesized that LIF may exert a neuroprotective effect in OGD/R-induced cell
injury by inhibiting pyroptosis-dependent neurotoxicity through HO-1 upregulation
in CTX TNA2 rat astrocytes. LIF treatment significantly increased cell viability
(Fig. 6A,B) and decreased OGD/R-induced apoptosis (Fig. 6C) and ROS production
(Fig. 6D). NLRP3 inflammasome-related genes (ASC, NLRP3, active caspase 1,
IL-1
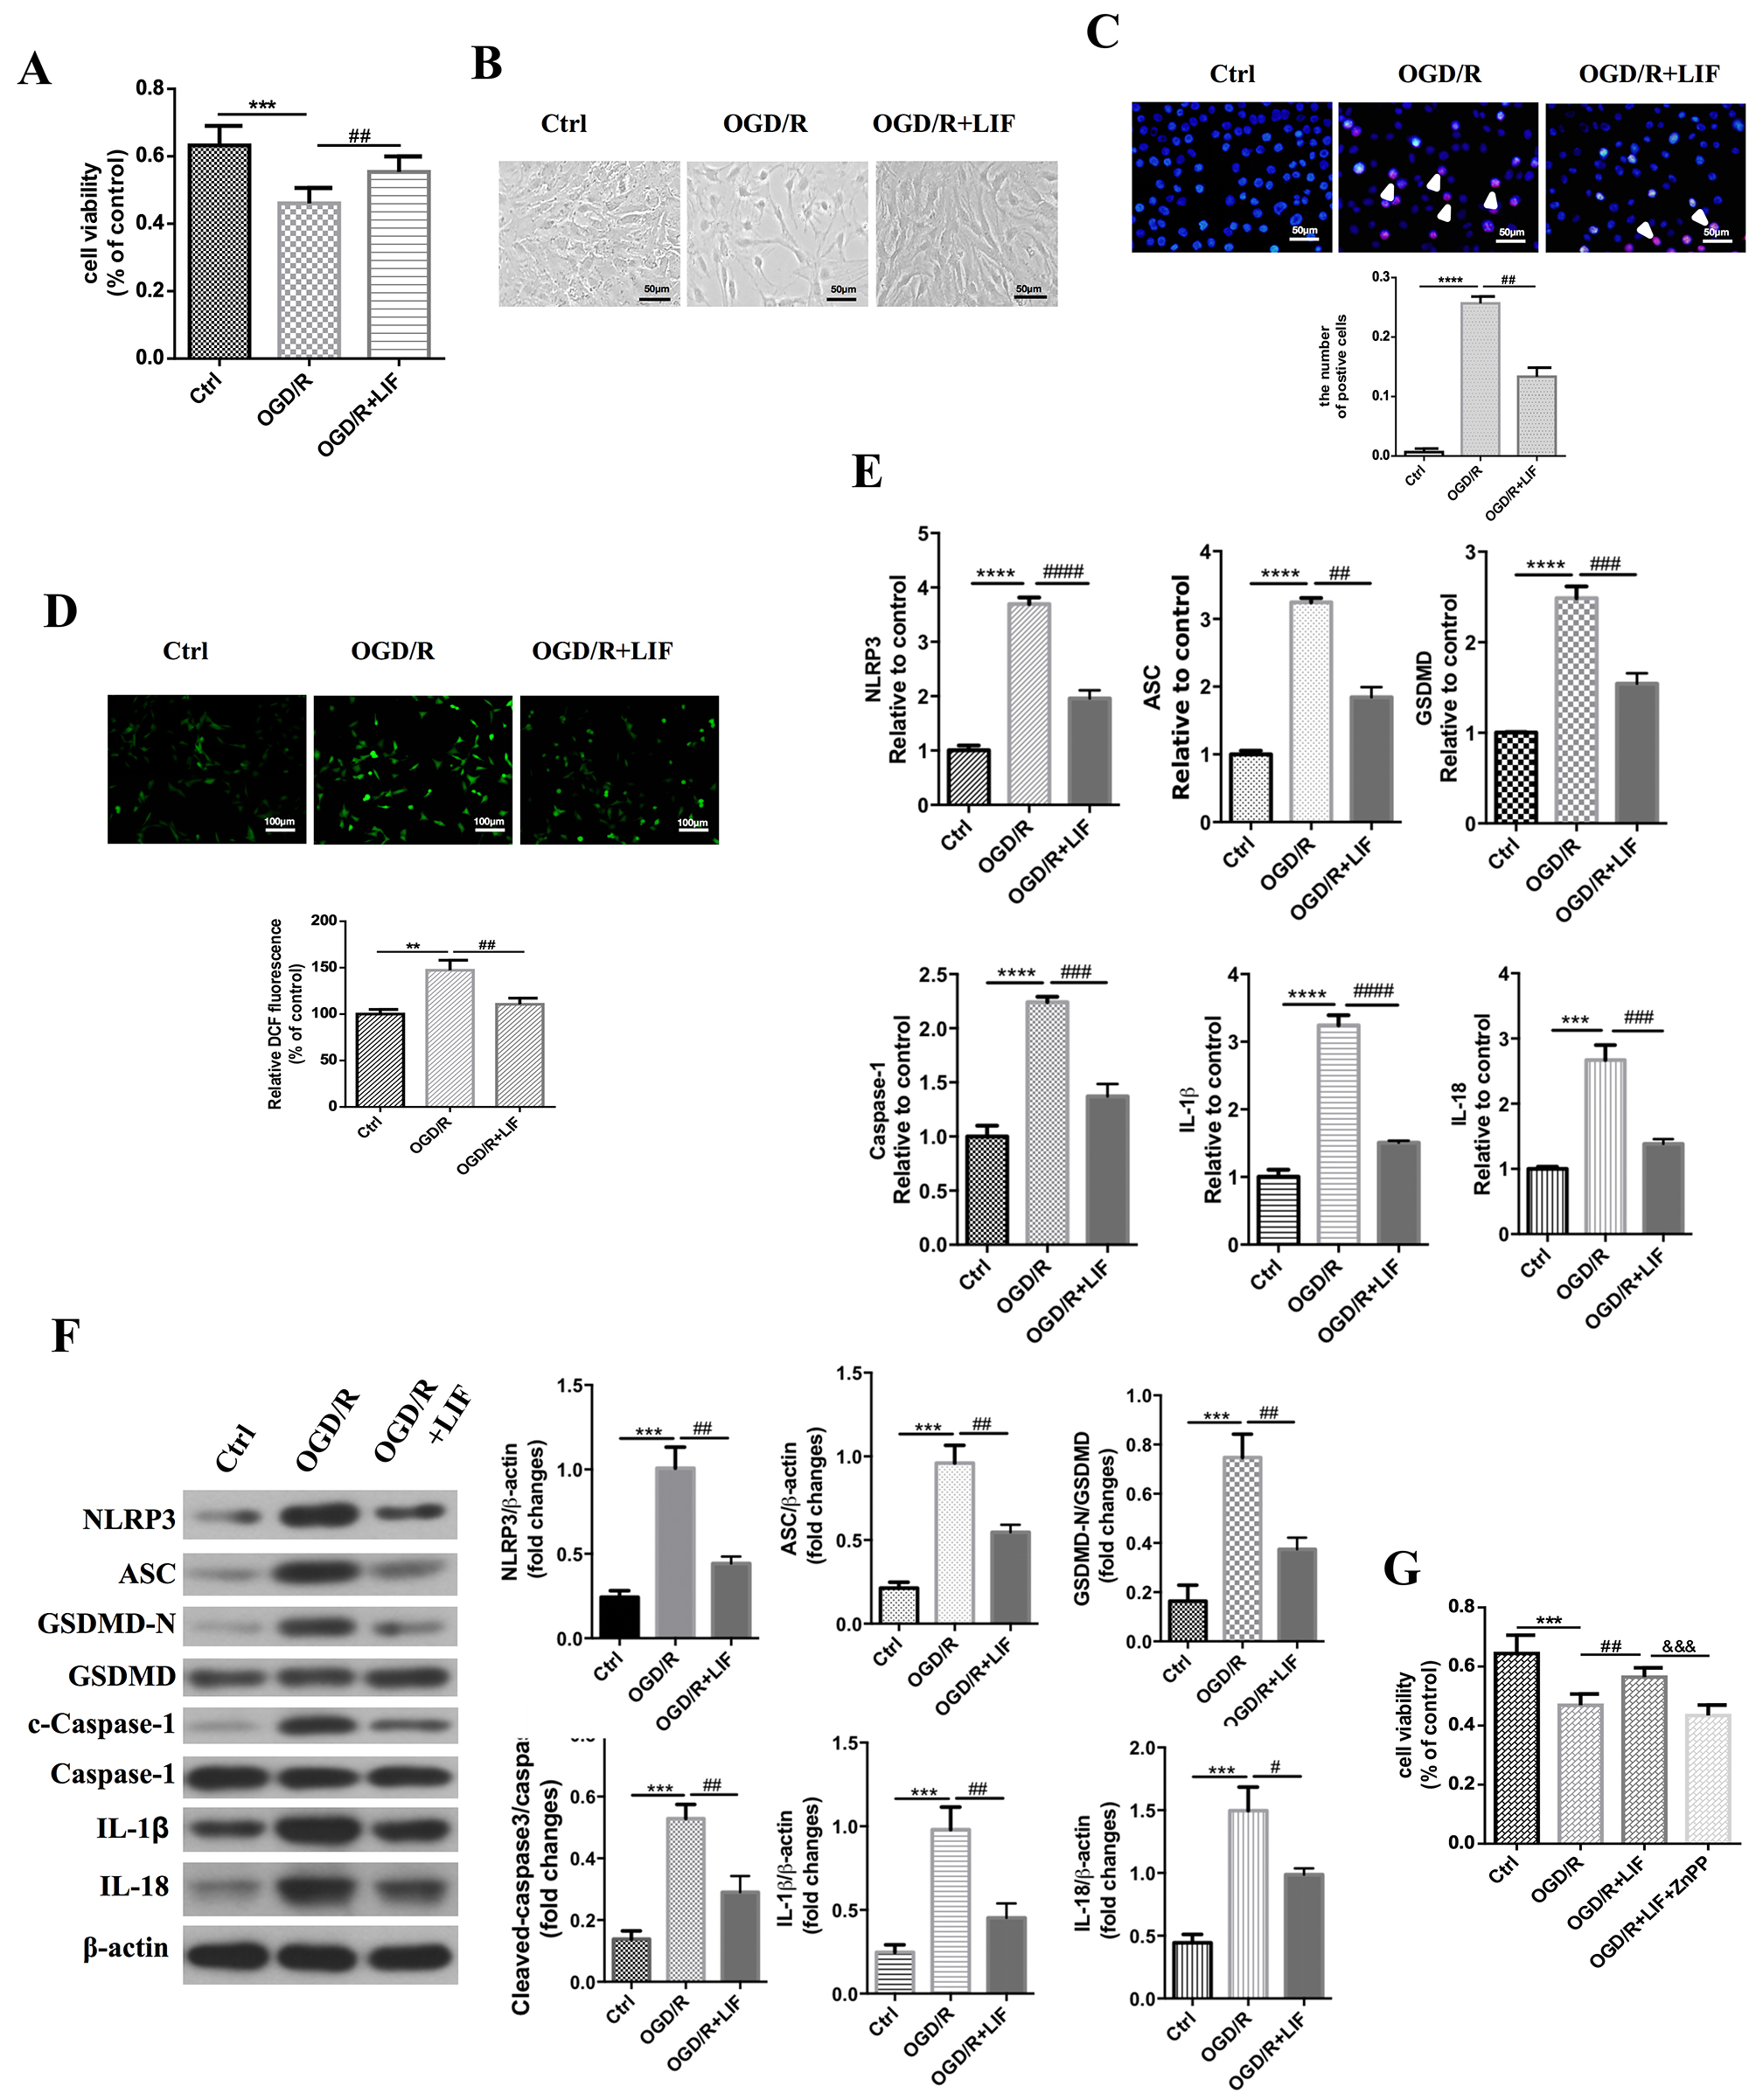 Fig. 6.
LIF protects against OGD/R-induced pyroptosis-dependent
neurotoxicity by upregulating HO-1 expression in CTX TNA2 rat astrocytes. CTX
TNA2 rat astrocytes were subjected to OGD for 24 h, and then cells were treated
with LIF (60 ng/mL) and reoxygenation for 24 h. (A) CCK-8 assay was used to
detect cell viability. OD values were presented as means
This study aimed to determine whether NLRP3-dependent pyroptosis is involved in the pathogenesis of PWMI in a TNA2 rat astrocyte model induced by OGD/R and to delineate the mechanisms by which LIF mediates its therapeutic effects in PWMI. Here, we provide compelling evidence that NLRP3-mediated pyroptosis is enhanced by OGD/R, which was validated using in vitro and in vivo PWMI models, showing that NLRP3 inflammasome-related genes were all upregulated at the protein and mRNA levels. Further, we demonstrated that LIF upregulates Nrf2/HO-1 expression by activating the MAPK and Akt kinase pathways, thereby mitigating OGD/R-induced pyroptosis-dependent neurotoxicity in CTX TNA2 rat astrocytes, demonstrating for the first time that NLRP3-dependent pyroptosis plays a role in PWMI pathogenesis and that LIF possesses neuroprotective effects against OGD/R in PWMI by upregulating HO-1 expression, thereby attenuating pyroptosis, which provides a novel insight into the mechanisms underlying the neuroprotective effects of LIF in PWMI.
The pathophysiological pathways associated with PWMI onset and progression are
complex and multifactorial. The currently understood pathological and biochemical
manifestations include hypoxic-ischemic injury, microglial activation,
excitotoxicity, oxidative stress, and apoptotic cell death [33]. However, the
basic mechanisms by which neuronal injury occurs are not well understood and
warrant further investigation. Given the involvement of NLRP3
inflammasome-related pyroptosis in cerebral ischemia/reperfusion [34, 35, 36] and
OGD/R [37, 38], we investigated whether NLRP3 inflammasome-mediated pyroptosis
also plays a central role in PWMI. We evaluated this possibility using PWMI
cellular models induced by OGD/R in CTX TNA2 rat astrocytes and in vivo
models of PWMI induced by HI in PND3 rats. This study showed that OGD/R decreased
astrocyte cell viability and increased oxidative stress. RNA-seq and KEGG
analysis indicated that NLRP3-dependent pyroptosis was enriched by OGD/R, which
were validated by both in vitro and in vivo PWMI models,
showing that NLRP3 inflammasome-related genes (ASC, NLRP3, IL-1
Given that LIF has neuroprotective effects against neurotoxicological injury in the nervous system, a reasonable hypothesis is that LIF also exerts neuroprotective effects on PWMI. Our previous study showed that LIF mRNA and protein levels were upregulated by HI-induced PWMI in 3-day-old Wistar rats. Maximal LIF upregulation was observed 3 days after PWMI induction. LIF mRNA and protein expression showed an initial increase, followed by a steady decline in neonatal rat astrocytes with PWMI, suggesting that endogenous LIF may promote astrocyte survival after PWMI [39]. We tested the hypothesis that an exogenous LIF supply exerts a neuroprotective effect on PWMI. LIF activates Nrf2, thereby upregulating HO-1 expression. LIF also activated the MAPK and Akt kinase pathways, upregulated HO-1 expression by activating MAPK and Akt kinase pathways, and significantly decreased cell viability loss, apoptosis, and ROS production in OGD/R-treated CTX TNA2 rat astrocytes. NLRP3 inflammasome-related genes were suppressed at the mRNA and protein levels compared with those in the OGD/R group. ZnPP, a HO-1 inhibitor, partially abolished LIF-induced viability enhancement in CTX TNA2 rat astrocytes. Our study is the first to provide evidence that LIF has potential neuroprotective effects in astrocytes induced by OGD/R, showing that LIF mitigates OGD/R-induced pyroptosis-dependent neurotoxicity by upregulating HO-1 expression through the MAPK and PI3K/Akt pathways in CTX TNA2 rat astrocytes. Our data provide novel evidence suggesting that the mechanisms underlying LIF neuroprotection in PWMI are due to its ability to limit pyroptosis. This observation was corroborated by another study that has reported the neuroprotective effects of LIF in PWMI [26].
The main limitation of this study was that the mechanism was not completely understood, as we did not verify the role of NLRP3-related pyroptosis in NLRP3 knockout mice. However, our results provide a basis for novel neuroprotective therapies for PWMI. The role of NLRP3-related pyroptosis in PWMI and the neuroprotection of LIF against PWMI remains an open conundrum for future investigation. We aim to address this issue in future studies.
This study, for the first time, suggests that NLRP3-dependent pyroptosis plays a role in PWMI pathogenesis and that LIF upregulates Nrf2/HO-1 expression by activating the MAPK and Akt kinase pathways, thereby mitigating OGD/R-induced pyroptosis-dependent neurotoxicity in CTX TNA2 rat astrocytes. The study highlights LIF as an effective pharmacological candidate for treating PWMI. Future studies should verify the role of NLRP3-related pyroptosis in PWMI.
The datasets used and/or analyzed during the current study are available from the corresponding author on reasonable request.
XL and HW made substantial contributions to the conception and design of the experiment; LH and HW: acquisition, analysis, and interpretation of data. All authors contributed to editorial changes in the manuscript. All authors approved the final version of the manuscript for publication. All authors have participated sufficiently in the work and agreed to be accountable for all aspects of the work.
All animal procedures were approved by the Experimental Animal Ethics Committee of Shengjing Hospital of China Medical University (2021PS075K), and adhered to Animal Research: Reporting of In Vivo Experiments (ARRIVE) guidelines.
The authors would like to thank Prof. Liqiang Zheng, at the Department of Medical Statistics, Library in Shengjing Hospital of China Medical University, for help with statistical analysis.
This work was supported in part by 2023 China Medical University High-quality Development Fund (2023JH2/20200119).
The authors declare no conflict of interest.
Supplementary material associated with this article can be found, in the online version, at https://doi.org/10.31083/FBL36630.
References
Publisher’s Note: IMR Press stays neutral with regard to jurisdictional claims in published maps and institutional affiliations.