


1 Department of Cardiology, Guangdong Provincial People’s Hospital (Guangdong Academy of Medical Sciences), Southern Medical University, 510080 Guangzhou, Guangdong, China
2 Institute of Medical Research, Guangdong Provincial People’s Hospital (Guangdong Academy of Medical Sciences), Southern Medical University, 510080 Guangzhou, Guangdong, China
Abstract
The expression profiles and function of exosomal long RNAs (exoLRs) in ischemic stroke remain unknown. This study aimed to investigate the pathophysiologic responses reflected by exoLRs.
The expression profile of exosomal messenger RNA, long non-coding RNA and circular RNA in 9 patients with ischemic stroke and 12 healthy individuals were analyzed by sequencing. We assessed the immune cell landscape to reveal the pathophysiologic responses reflected by exoLRs and performed biological process and pathway enrichment analyses. Competing endogenous RNA networks were constructed to explore the molecular functions of exoLRs.
A total of 321 up- and 187 down-regulated messenger RNAs, 31 up- and 9 down-regulated long non-coding RNAs, and 67 up- and 48 down-regulated circular RNAs were identified. The immune cell landscape analysis identified that the proportions of exhausted and gamma delta T cells were statistically higher in patients with ischemic stroke. Bioinformatics analyses, including enrichment and competing endogenous RNA network analyses, also indicated that exoLRs were associated with T- cell-mediated inflammatory responses.
The expression patterns of exoLRs highlighted the association between ischemic stroke and inflammatory responses mediated by T cells.
Keywords
- ischemic stroke
- long RNAs
- T cell
- ceRNA
- exosomes
Stroke is the second most common cause of death and the main cause of disability worldwide. It has been the leading cause of death in China in recent years, with new cases reported every year amount to more than 2 million [1]. In 2020, the prevalence of stroke in China was 2.6%, with an incidence rate of 505.2 and a mortality rate of 343.4 per 100,000 person-years, respectively [2]. Ischemic stroke is the most common stroke subtype [3]. A combination of genetic and environmental factors is involved in the pathogenesis of ischemic stroke. However, there is still a lack of clarity regarding the exact mechanisms underlying ischemic stroke development.
Exosomes are membrane-bound nanovesicles (30–100 nm) produced in the endosomal compartments of numerous cells under normal and pathological conditions [4]. They are present in various bodily fluids, such as the blood [5], and transport various biomolecules including proteins, messenger RNAs, and noncoding RNAs [4]. Recently microRNAs have been found to be associated with the occurrence of ischemic stroke [6, 7, 8, 9, 10] and to potentially serve as novel risk factors [11]. However, the small quantity and lack of specific production of microRNAs in exosomes limit their extensive application [12]. Circular RNAs, long noncoding RNAs (lncRNAs), and messenger RNAs are long RNAs enclosed in exosomes and exhibit stable expression. Exosomal long RNAs (exoLRs) have numerous clinical applications [13]. However, studies characterizing their expression profiles are few, and the pathophysiologic responses reflected by exoLRs in ischemic stroke remain unknown, particularly in the Chinese population. Therefore, further studies are urgently needed to provide novel insights into the prevention, control, and treatment of ischemic stroke.
Based on available data, we speculated that exoLRs might reflect pathophysiologic responses in ischemic stroke. This study aimed to (1) characterize the expression profiles of exoLRs in ischemic stroke and (2) investigate their potential roles in stroke pathophysiology through comprehensive bioinformatics analyses.
This study was conducted at the Guangdong Provincial People’s Hospital from August 2020 to January 2021. It involved nine patients with ischemic stroke within 4 h of onset and two healthy individuals as a healthy control group, all of whom were recruited for plasma exoLR sequencing. The other 10 healthy individuals from our previous study, whose data are available from the Gene Expression Omnibus database (Accession No. GSE159657, https://www.ncbi.nlm.nih.gov/geo/query/acc.cgi?acc=GSE159657), were used as part of the healthy control group, and the expression profiles were analyzed [14].
The inclusion criteria for the ischemic stroke group were patients aged more than 18 years and with a definite diagnosis of ischemic stroke. The diagnosis was performed according to World Health Organization guidelines and validated with computed tomography or magnetic resonance imaging [15]. Conversely, individuals in the healthy control group were required to display normal renal and liver function, with no history of malignancy, rheumatologic disorders, recent cardiovascular or cerebrovascular events, chronic heart failure, diabetes, acute or chronic infectious disease, myocarditis, pulmonary embolism, aortic dissection, or pericarditis. The exclusion criteria for both groups included patients older than 80 years or diagnosed with acquired immunodeficiency syndrome. The study was conducted according to the guidelines of the Declaration of Helsinki and approved by the ethics committee of the Guangdong Provincial People’s Hospital (approval No. GDREC2019443H). Written informed consent was obtained from all the study participants.
The blood samples were taken within an hour of the patients’ hospital admission and prior to thrombolytic therapy. Venous blood (2 mL) was collected from each patient in tubes containing ethylenediaminetetraacetic acid. For extracting plasma, the blood was centrifuged for 10 min at 3000 g and 4 °C, and the supernatant was carefully transferred to a new tube for repeated centrifugation. Then, the plasma was stored in cryogenic vials at –80 °C until further use. Total RNA in exosomal vesicles was extracted using an exoRNeasy serum/plasma kit (77023, QIAGEN, Hilden, Germany) following the manufacturer’s protocol [16]. The RNA-sequencing libraries were constructed using SMART technology (Clontech Laboratories, Mountain View, CA, USA) [17]. RNA sequencing was performed by Guangzhou Epibiotek Co., Ltd. (Guangzhou, China) on an Illumina Nova-Seq 6000 System. The filter sequences and adapters were trimmed using Cutadapt (version 2.5, Technical University of Dortmund, Ruhr region, Germany). Using the “-rna-strandness RF” parameter, the remaining reads were aligned against the human Ensemble genome GRCh38 [18]. Based on featureCounts (version 1.6.3, The University of Melbourne, Victoria, Australia), reads were mapped to the genome [19]. Messenger RNAs and lncRNAs were annotated using the GENCODE database (version 28, https://www.gencodegenes.org/) [20]. R software (version 4.1.2, R Foundation for Statistical Computing, Vienna, Austria) was used to generate principal component analysis (PCA) plots from fragments per kilobase per million mapped fragments. Unmapped reads were circular RNAs identified using the pipeline (https://code.google.com/p/acfs/) [21]. The Gene Expression Omnibus database (Accession No. GSE186844, https://www.ncbi.nlm.nih.gov/geo/query/acc.cgi?acc=GSE186844) contains raw data that supports the results of this study.
The morphological characteristics of the exosomes were assessed using transmission electron microscopy (JEM-1200EX, Japan Electron Optics Laboratory, Tokyo, Japan). The sizes and distribution of the exosomes were measured using a NanoSight NS500 instrument developed by NanoSight Ltd. (Amesbury, UK). Exosomal tumor susceptibility gene 101 (TSG101), CD9, and CD63 protein markers were detected using western blotting [22].
The expression levels of plasma exoLRs were estimated based on high-throughput
sequencing through differential expression analysis. The variance percentile rank
was filtered at 15% or lower, and at least four counts per million were required
to retain an RNA. As a result of filtering the data, the counts were normalized
using the M-value normalization method. The COMBAT algorithm was then used to
remove the batch effect. The raw counts from the sequence datasets were analyzed
using the “DESeq2” R package (version 1.16.1), with design models considering
batch effects [23], to obtain differentially expressed exoLRs. A log2 fold
change
CIBERSORT (version 3.6.2) was used to quantify immune cell abundance in plasma across study groups. The standardized gene expression data were uploaded to a publicly accessible online database (http://cibersort.stanford.edu/). An analysis of 547 marker genes was performed to determine the plasma distribution of 22 human immune cells [24].
We predicted the targeted transcripts of differentially expressed long noncoding
RNAs (DElncRNAs) based on antisense, cis-acting, and
trans-acting analyses to explore the roles of exosomal lncRNA in
ischemic stroke. For antisense DElncRNA analysis, RNAplex (version 2.5.0,
https://www.tbi.univie.ac.at/RNA/ViennaRNA/doc/html/man/RNAplex.html) [25] was
used to predict the complementary correlations between antisense DElncRNAs and
differentially expressed messenger RNAs (DEmRNAs). For cis-acting
analysis, lncRNAs located less than 100 kb upstream/downstream of a gene were
considered potential cis-regulators. For lncRNA trans-acting
analysis, the correlation coefficient between DElncRNAs and DEmRNAs was
determined, and a value
Gene Ontology (GO) enrichment analysis for biological processes regulated by the
differentially expressed exoLRs, including the DEmRNAs, target transcripts of
DElncRNAs, parental genes of differentially expressed circular RNAs (DEcircRNAs),
and DEmRNAs in the competing endogenous RNA (ceRNA) networks, was performed using
the ClusterProfiler package (version 3.10.1,
https://bioconductor.org/packages/release/bioc/html/clusterProfiler.html) [26]
and Metascape (version 3.5, https://metascape.org/gp/index.html) [27]. As
previously described, the pathway enrichment analysis of the Kyoto Encyclopedia
of Genes and Genomes (KEGG) was used to identify the pathways regulated by
differentially expressed exoLRs [28], with a statistical significance threshold
of p
Based on the ceRNA hypothesis, ceRNA networks of DElncRNA/DEcircRNA-microRNA-DEmRNA were built by predicting microRNA-binding RNA. Thus, micro RNAs regulated by DElncRNAs and DEmRNAs were predicted and selected to construct the ceRNA network. First, the microRNAs targeted by DElncRNAs/DEcircRNA were predicted using the MiRcode database (http://www.mircode.org) [29]. The potential messenger RNAs targeted by the micro RNAs were retrieved from miRDB (http://www.mirdb.org/index.html) [30] and TargetScan (http://www.targetscan.org/vert_71/) [31]. The potential messenger RNAs were intersected with the entire dataset of DEmRNAs. DElncRNAs/DEcircRNAs and targeted DEmRNAs in the opposite expression pattern were removed from the ceRNA network. Cytoscape (version 3.9.0, Institute for Systems Biology, Washington, WA, USA) [32] was applied to visualize the constructed network.
For analyzing the clinical characteristics, continuous variables were expressed
as the median (interquartile range). A PCA plot was generated using R software by
transforming the data into a log2 scale and plotting it using the plot PCA
function. Count variables were analyzed using Fisher’s exact probability test,
whereas continuous variables were analyzed using the Kruskal-Wallis rank-sum
test. A p value
The clinical characteristics of the study participants are summarized in Table 1. In the sequencing group, no differences were observed in age, alcohol consumption, lipid profiles, white blood cell counts, neutrophils (%), and C-reactive protein levels between patients with ischemic stroke and healthy individuals. In the validation group, no differences were observed in sex, lipid profiles, and C-reactive protein levels. Overall, the proportions of participants with hypertension, diabetes, or smoking habits were higher in the ischemic stroke group. Furthermore, an increase in monocyte count was also observed in the ischemic stroke group.
| Variables | Control (n = 12) | Ischemic stroke (n = 9) | Standardized difference | p value | |
| Demographic | |||||
| Sex (Female, %) | 9 (75.00%) | 1 (11.11%) | 1.69 (0.68, 2.69) | 0.008 | |
| Ages (years) | 52.50 (41.25–56.00) | 63.00 (55.00–65.00) | 0.88 (–0.03, 1.78) | 0.050 | |
| Clinical | |||||
| Smoking (n, %) | 1 (8.33%) | 5 (55.56%) | 1.17 (0.24, 2.11) | 0.046 | |
| Alcohol consumption (n, %) | 0 (0%) | 0 (0%) | |||
| Hypertension (n, %) | 0 (0%) | 5 (55.56%) | 1.58 (0.59, 2.57) | 0.006 | |
| Diabetes (n, %) | 0 (0%) | 3 (33.33%) | 1.00 (0.08, 1.92) | 0.063 | |
| Laboratory | |||||
| TG (mmol/L) | 1.35 (1.04–2.24) | 1.40 (0.97–1.48) | 0.58 (–0.30, 1.47) | 0.434 | |
| TC (mmol/L) | 4.79 (4.15–5.83) | 4.11 (3.60–5.56) | 0.65 (–0.24, 1.53) | 0.126 | |
| LDL-C (mmol/L) | 3.16 (2.93–3.68) | 2.90 (2.59–3.91) | 0.39 (–0.48, 1.26) | 0.434 | |
| HDL-C (mmol/L) | 1.18 (0.97–1.47) | 1.00 (0.96–1.06) | 0.87 (–0.04, 1.77) | 0.075 | |
| WBC (109/L) | 6.13 (4.71–6.90) | 8.11 (6.03–8.39) | 0.59 (–0.29, 1.48) | 0.227 | |
| Monocytes (%) | 7.69 (0.07–0.08) | 10.92 (0.09–0.13) | 1.39 (0.43, 2.35) | 0.003 | |
| Neutrophil (%) | 59.04 (0.54–0.68) | 59.46 (0.56–0.62) | 0.05 (–0.82, 0.91) | 0.831 | |
| CRP (g/L) | 0.90 (0.50–2.10) | 0.50 (0.47–5.42) | 0.41 (–0.78, 1.60) | 0.341 | |
Results are presented as the median (interquartile range) for continuous variables and N (%) for categorical variables. Count variables were analyzed using the Fisher’s exact probability test, whereas continuous variables were analyzed using the Kruskal-Wallis rank-sum test. CRP, C-reactive protein; HDL-C, high-density lipoprotein cholesterol; LDL-C, low-density lipoprotein cholesterol; TC, total cholesterol; TG, triglyceride; WBC, white blood cell count; exoLRs, exosomal long RNAs.
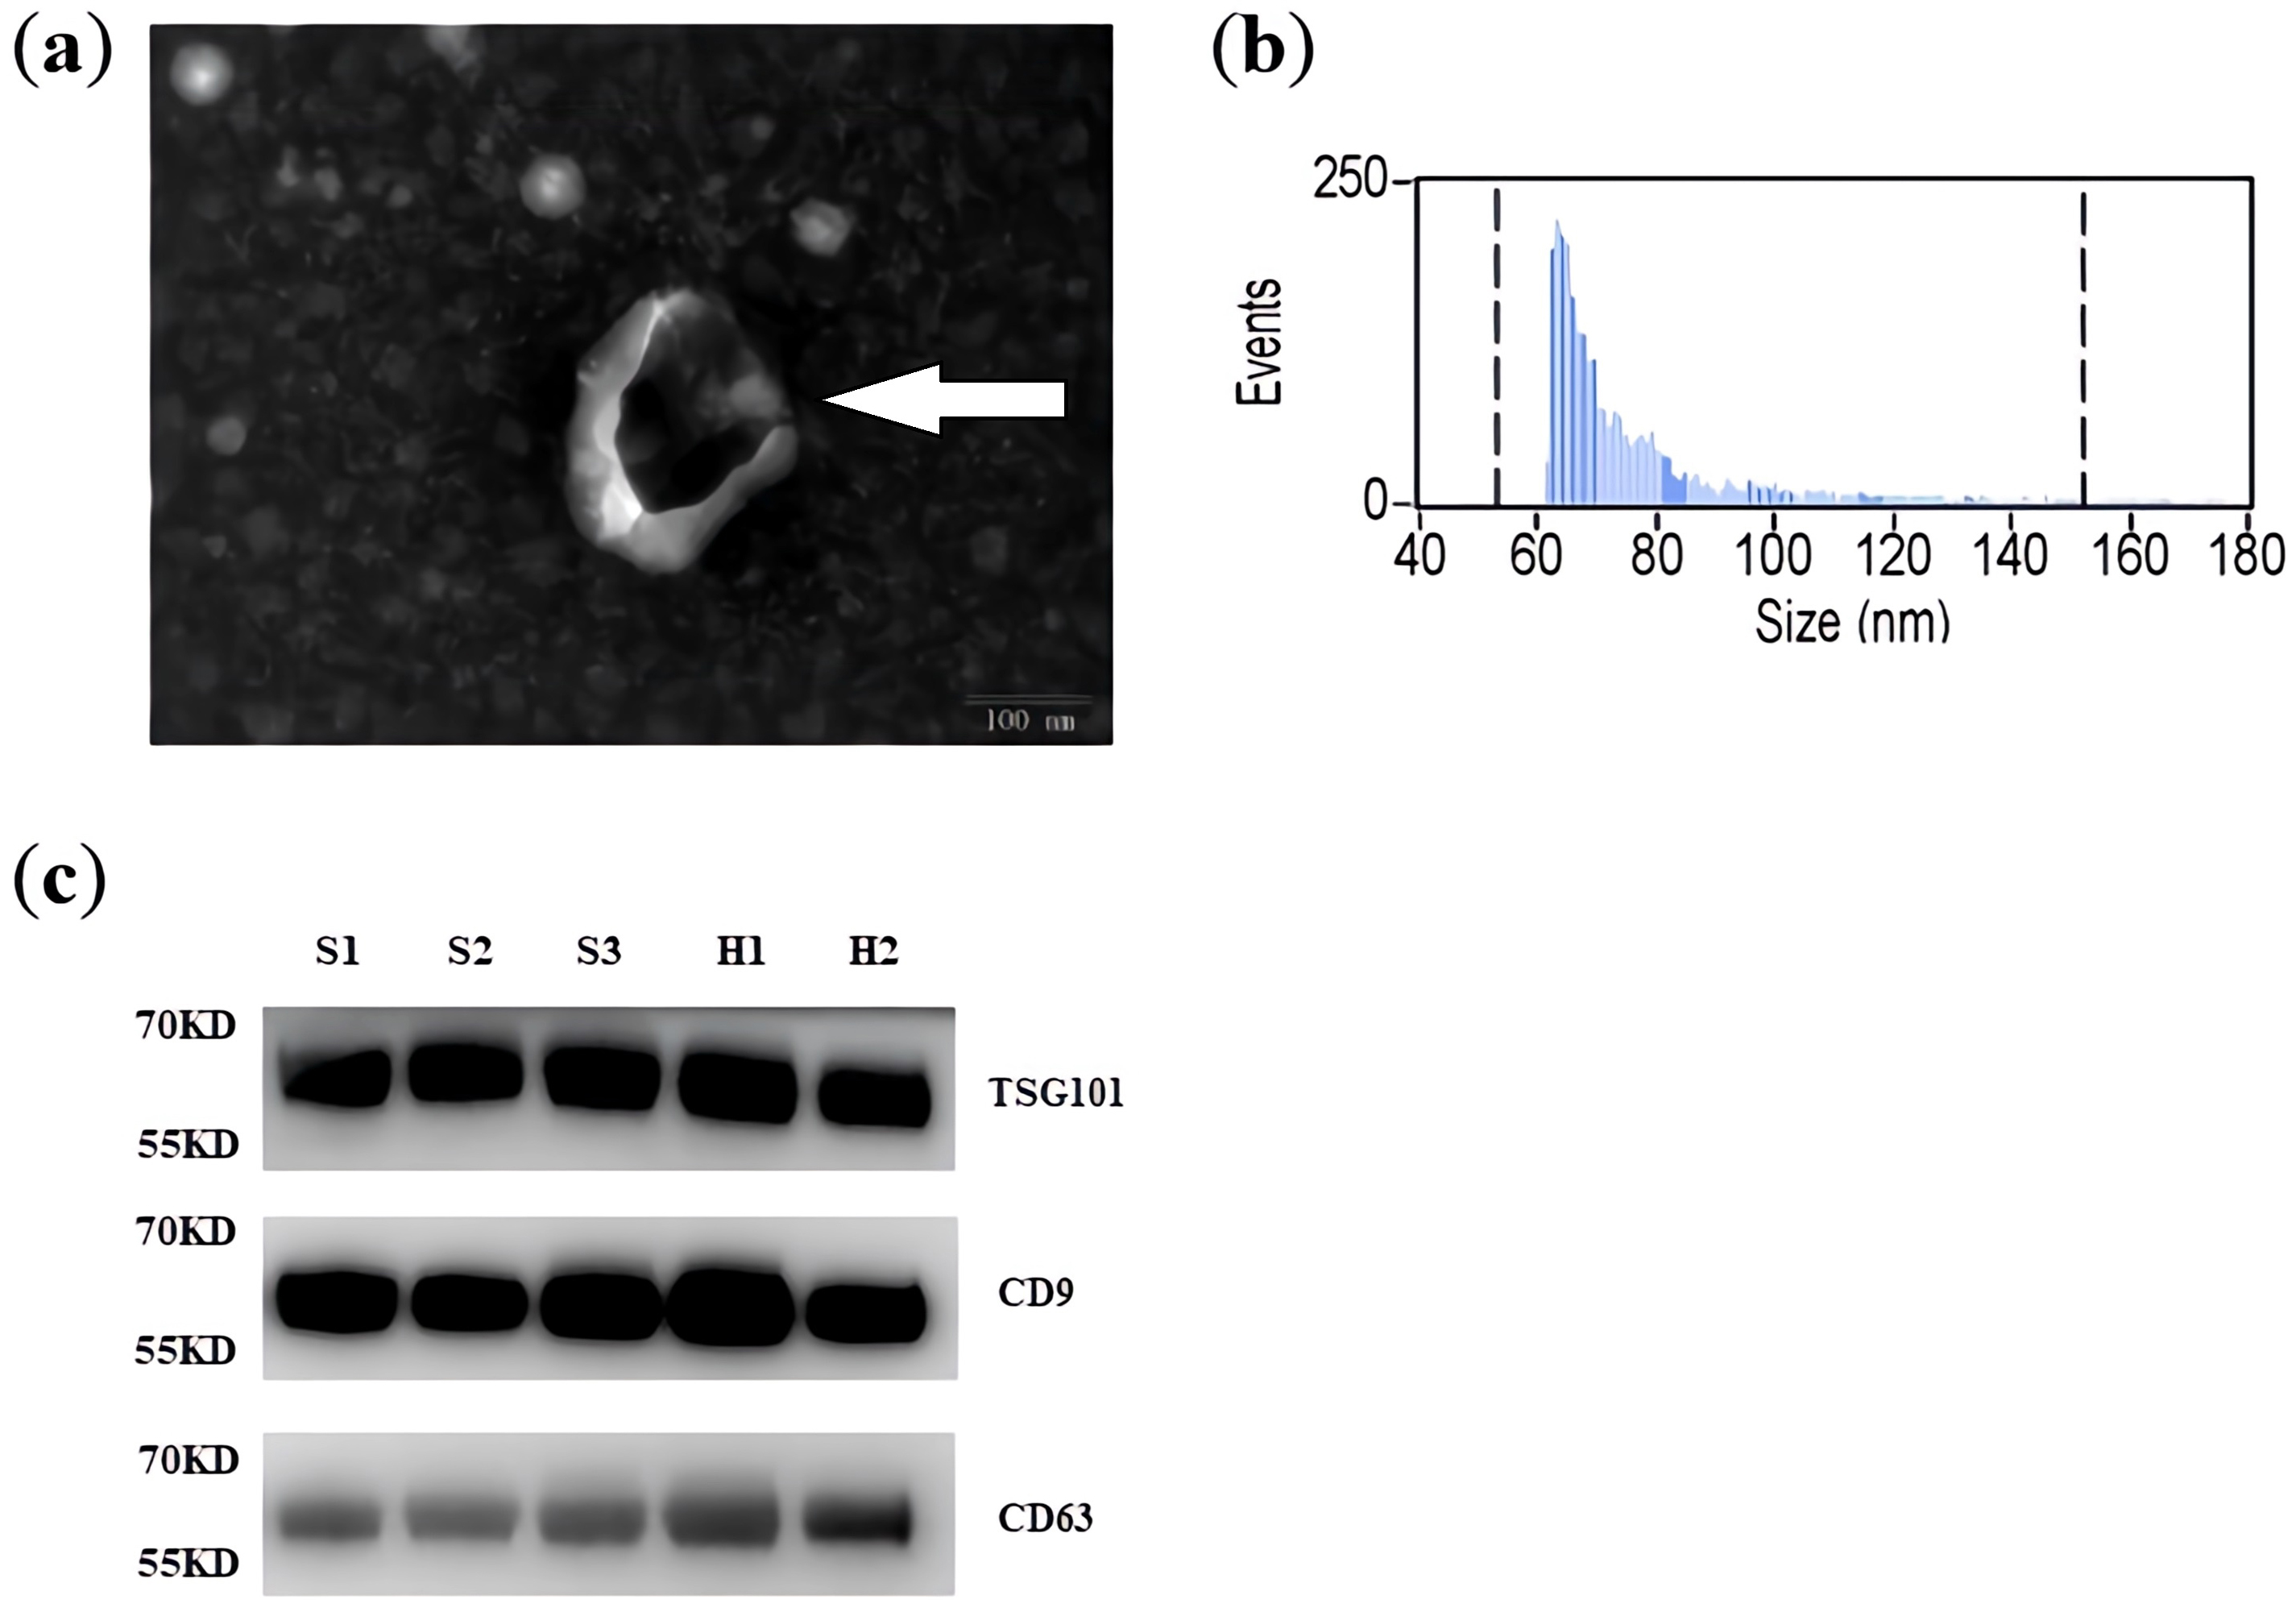
Transmission electron microscopy indicated the membrane-enclosed structures of
exosomes (Fig. 1a). The original transmission electron microscope image is shown
in Supplementary Fig. 1. The average diameter of the isolated exosomes
was 79.11
 Fig. 1.
Characterization of exosomes isolated from plasma. (a) Representative transmission electron microscopy image showing the morphology of exosomes isolated from the plasma and vesicle size (scale bar = 100 nm). (b) NanoSight nanoparticle tracking analysis was conducted to determine the size distribution of isolated exosomes. Most isolated extracellular vesicles had a size distribution consistent with exosomes (30–100 nm). (c) Exosome marker proteins (CD63, TSG101, and CD9) detected by western blotting (S1 to S3: ischemic stroke specimens; H1 and H2: control specimens). TSG101, tumor susceptibility gene 101.
 Fig. 2.
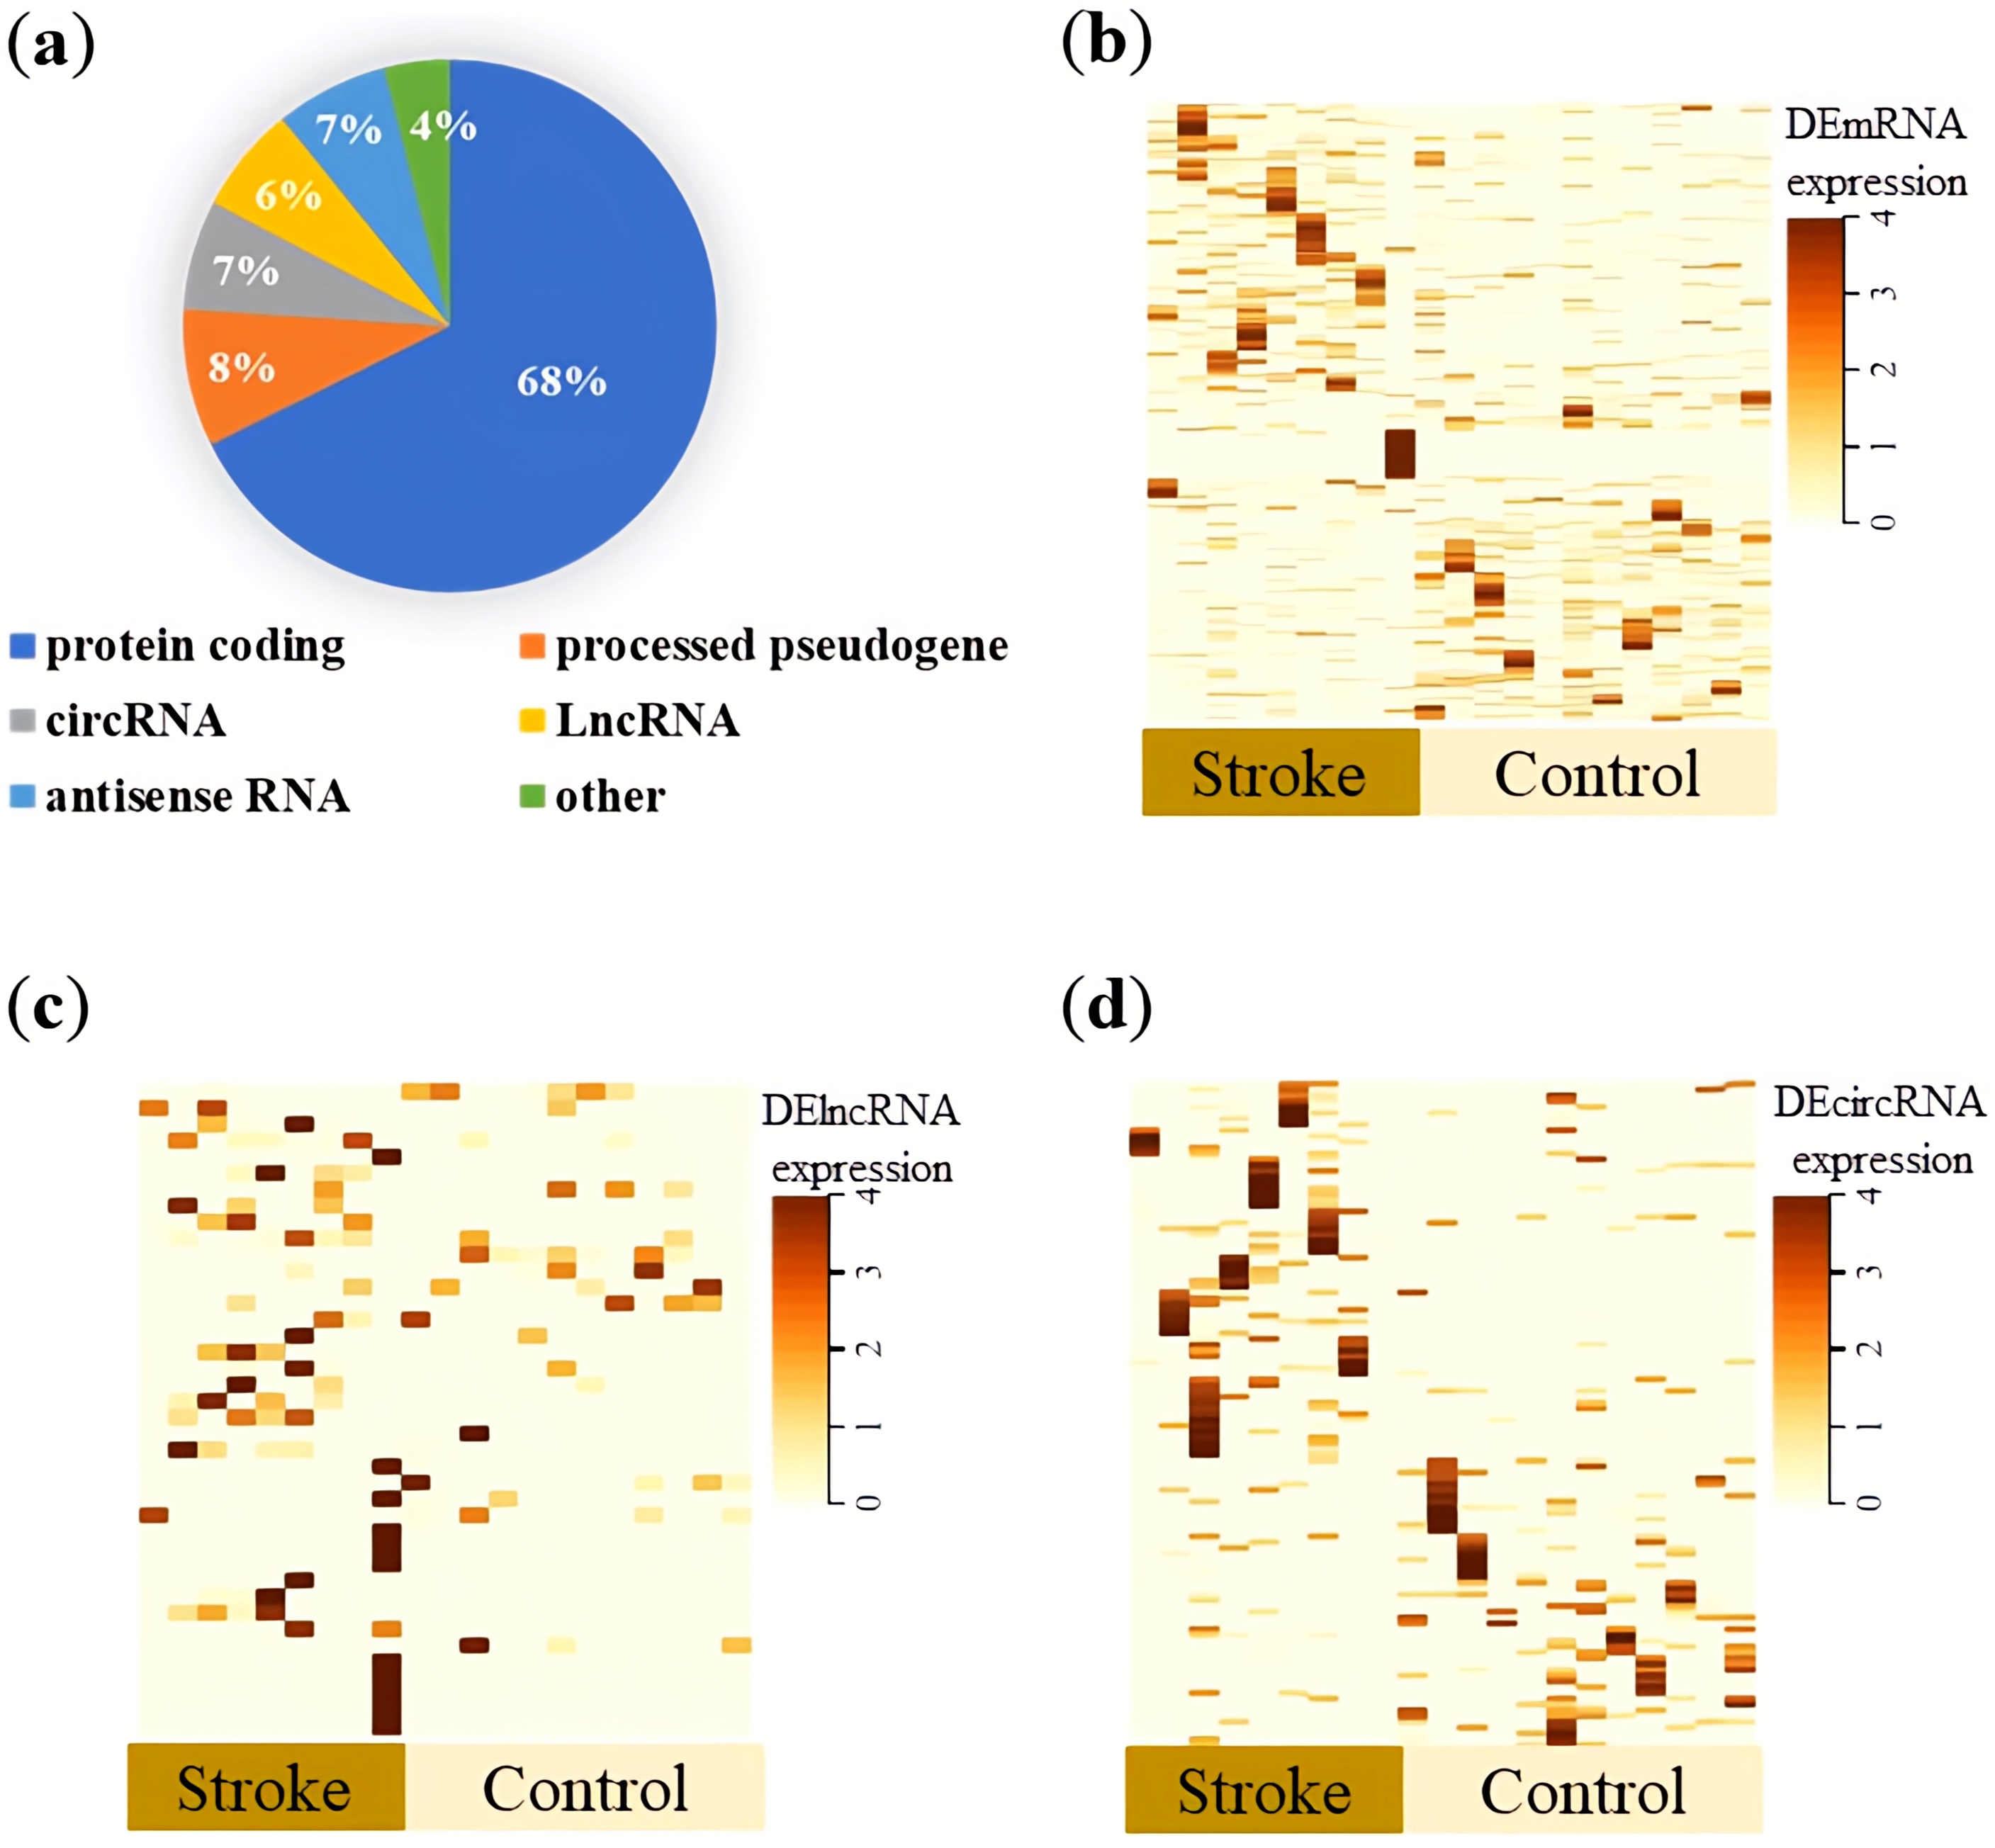
Overview of the expression profile of exoLRs. (a) Distribution of mapped reads to genes, with annotations showing the proportions of different types of RNA. (b–d) Heat maps showing clustered expression patterns of differentially expressed exosomal messenger RNAs (b), long noncoding RNAs (c), and circular RNA (d) between normal and ischemic stroke specimens. In the heat maps, light yellow indicates low expression, whereas brown indicates higher expression. Abbreviations: circRNA, circular RNA; DE, differentially expressed; lncRNA, long noncoding RNA.
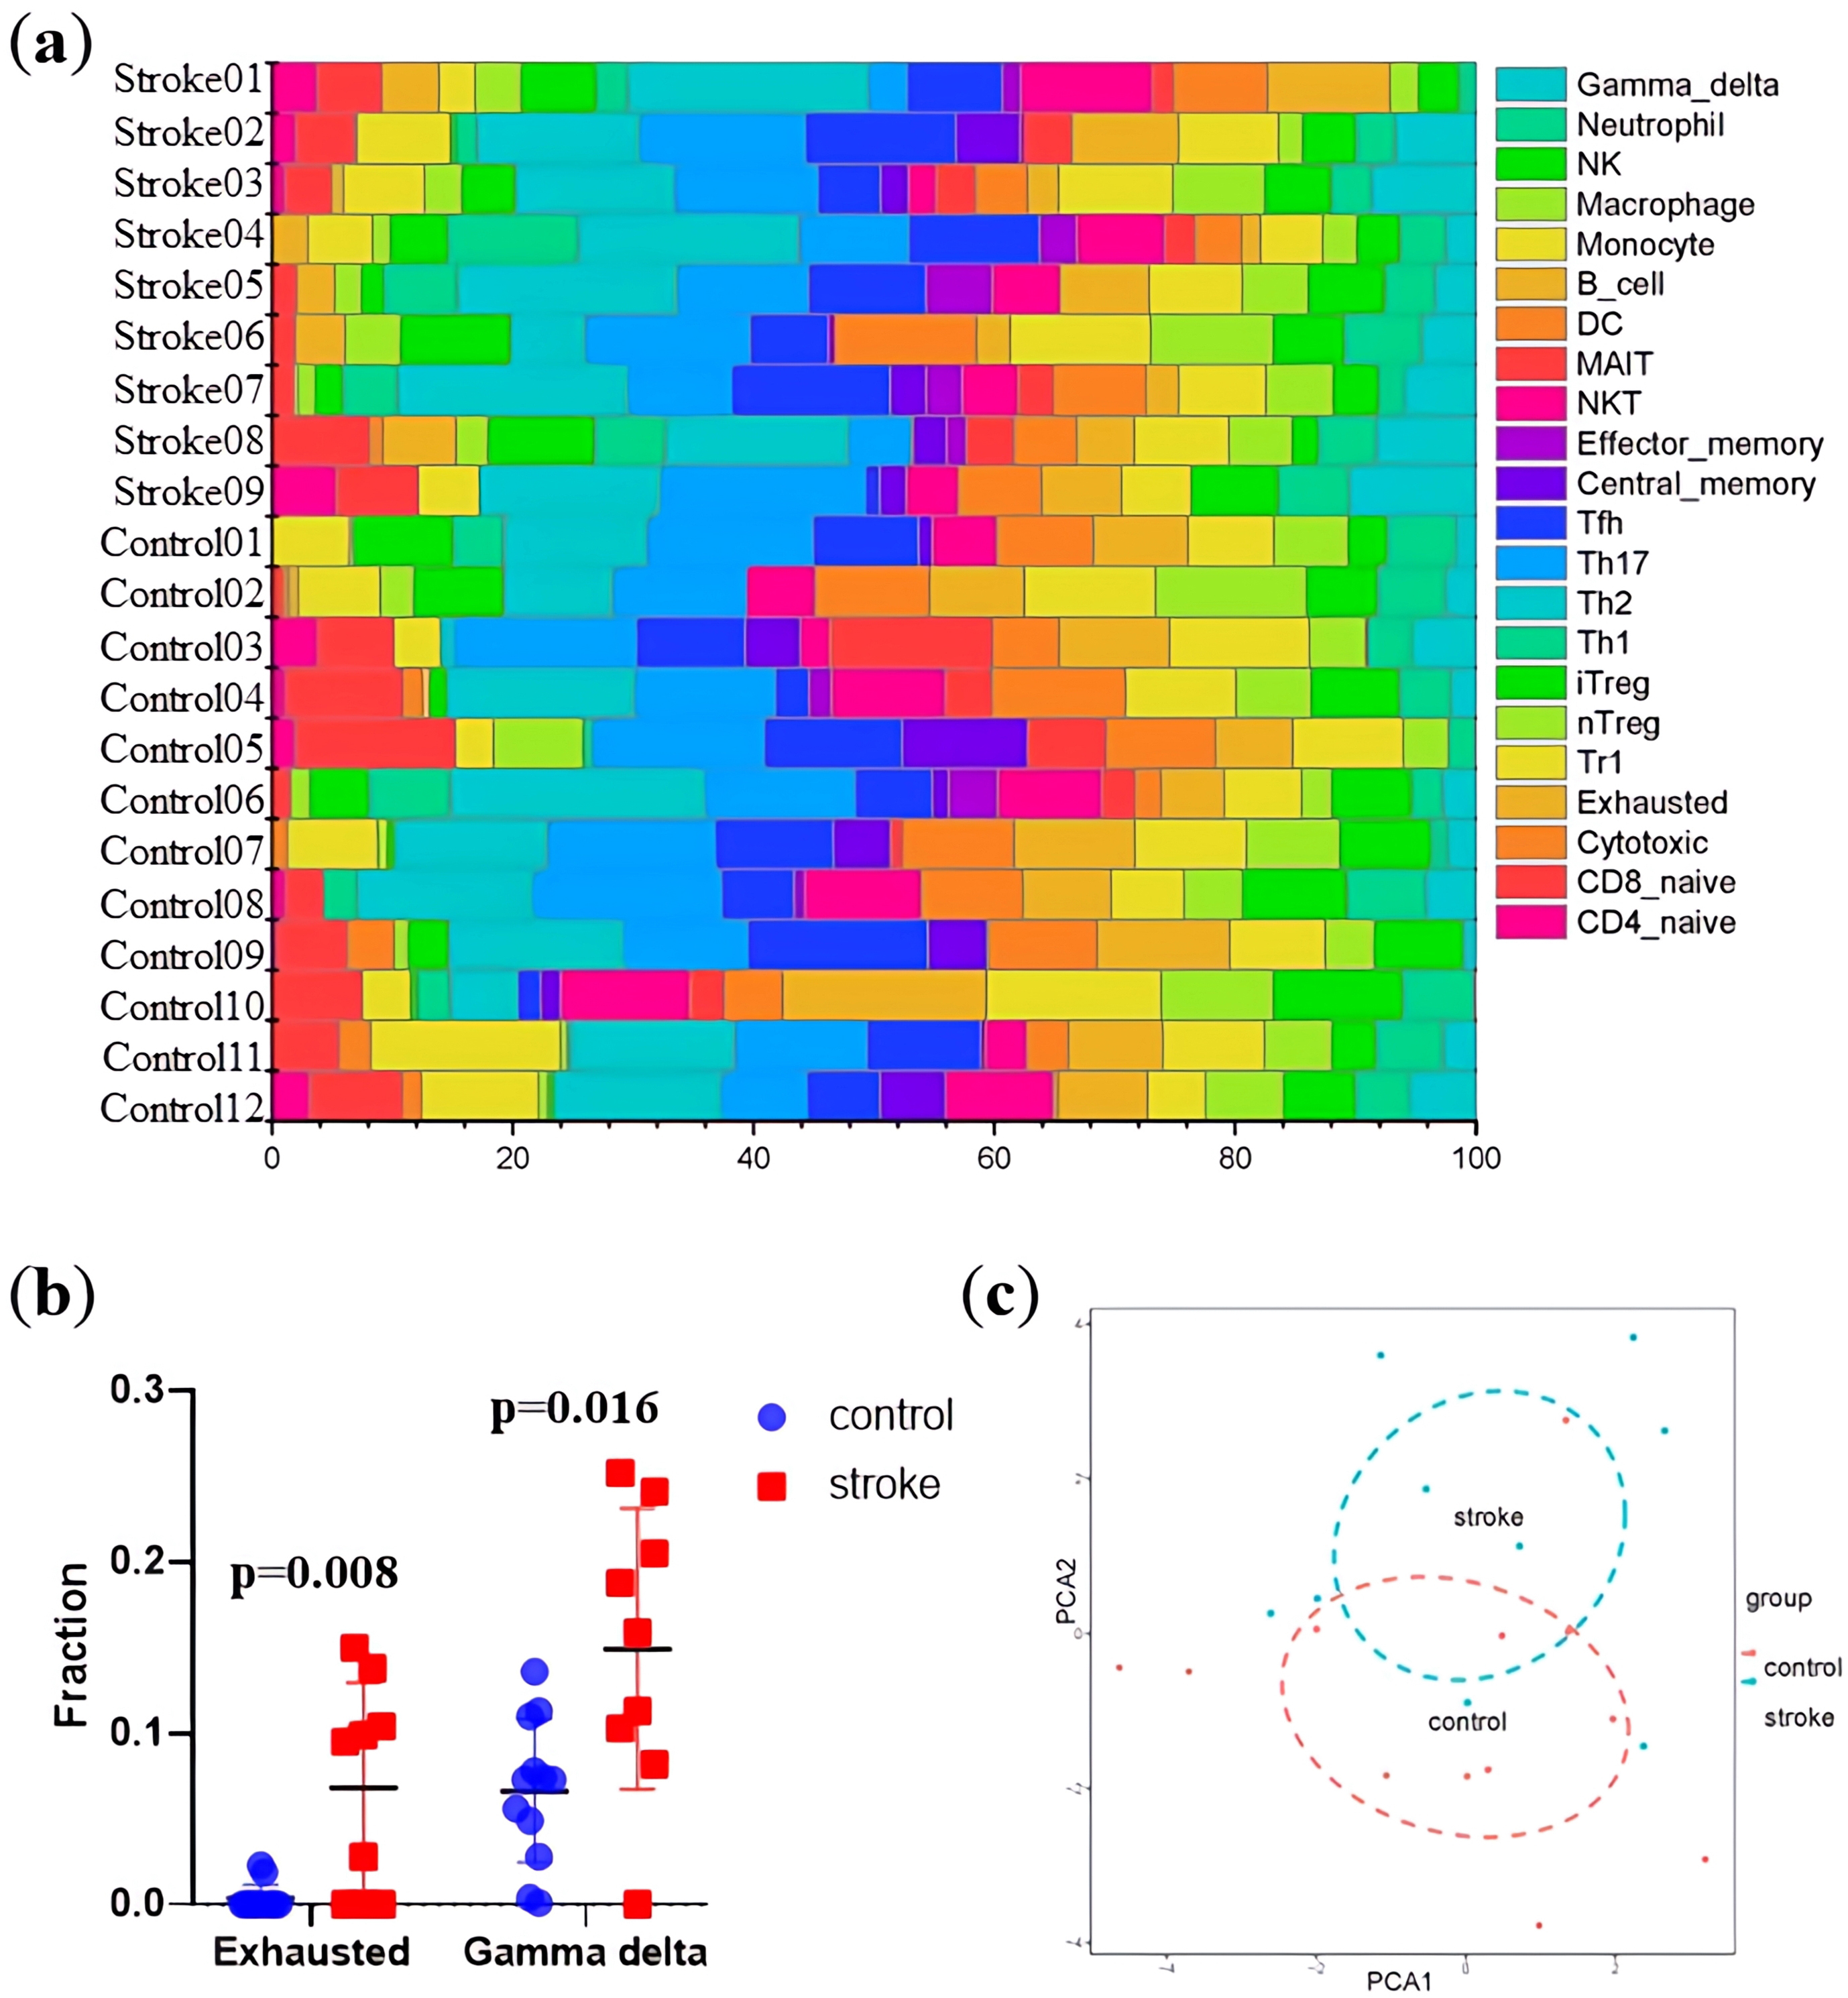
Based on the exosomal sequencing data, we assessed the proportions of 22 circulating immune cells using an established computational resource (CIBERSORT) (Fig. 3a). The proportions of exhausted and gamma delta T cells were statistically higher in patients with ischemic stroke (Fig. 3b). PCA of the immunological profiles showed a nonuniform distribution (Fig. 3c). The expression of exoLRs might be closely associated with the T cell-mediated inflammatory responses.
 Fig. 3.
exoLR reflecting relative fractions of different immune cell types. (a) Relative fraction of immunocytes identified using the CIBERSORT algorithm, which estimated the relative subsets of 22 types of immunocytes from 12 normal and 9 ischemic stroke specimens. (b) Comparison of the fractions of exhausted (p = 0.008) and gamma delta T cells (p = 0.016) between ischemic stroke specimens and normal controls. (c) Two-dimensional region-based PCA plot obtained by including all studied samples and all types of immune cells. Each dot indicates one sample. The red plot refers to normal control specimens, whereas the blue plot indicates ischemic stroke specimens. Abbreviations: PCA, principal component analysis.
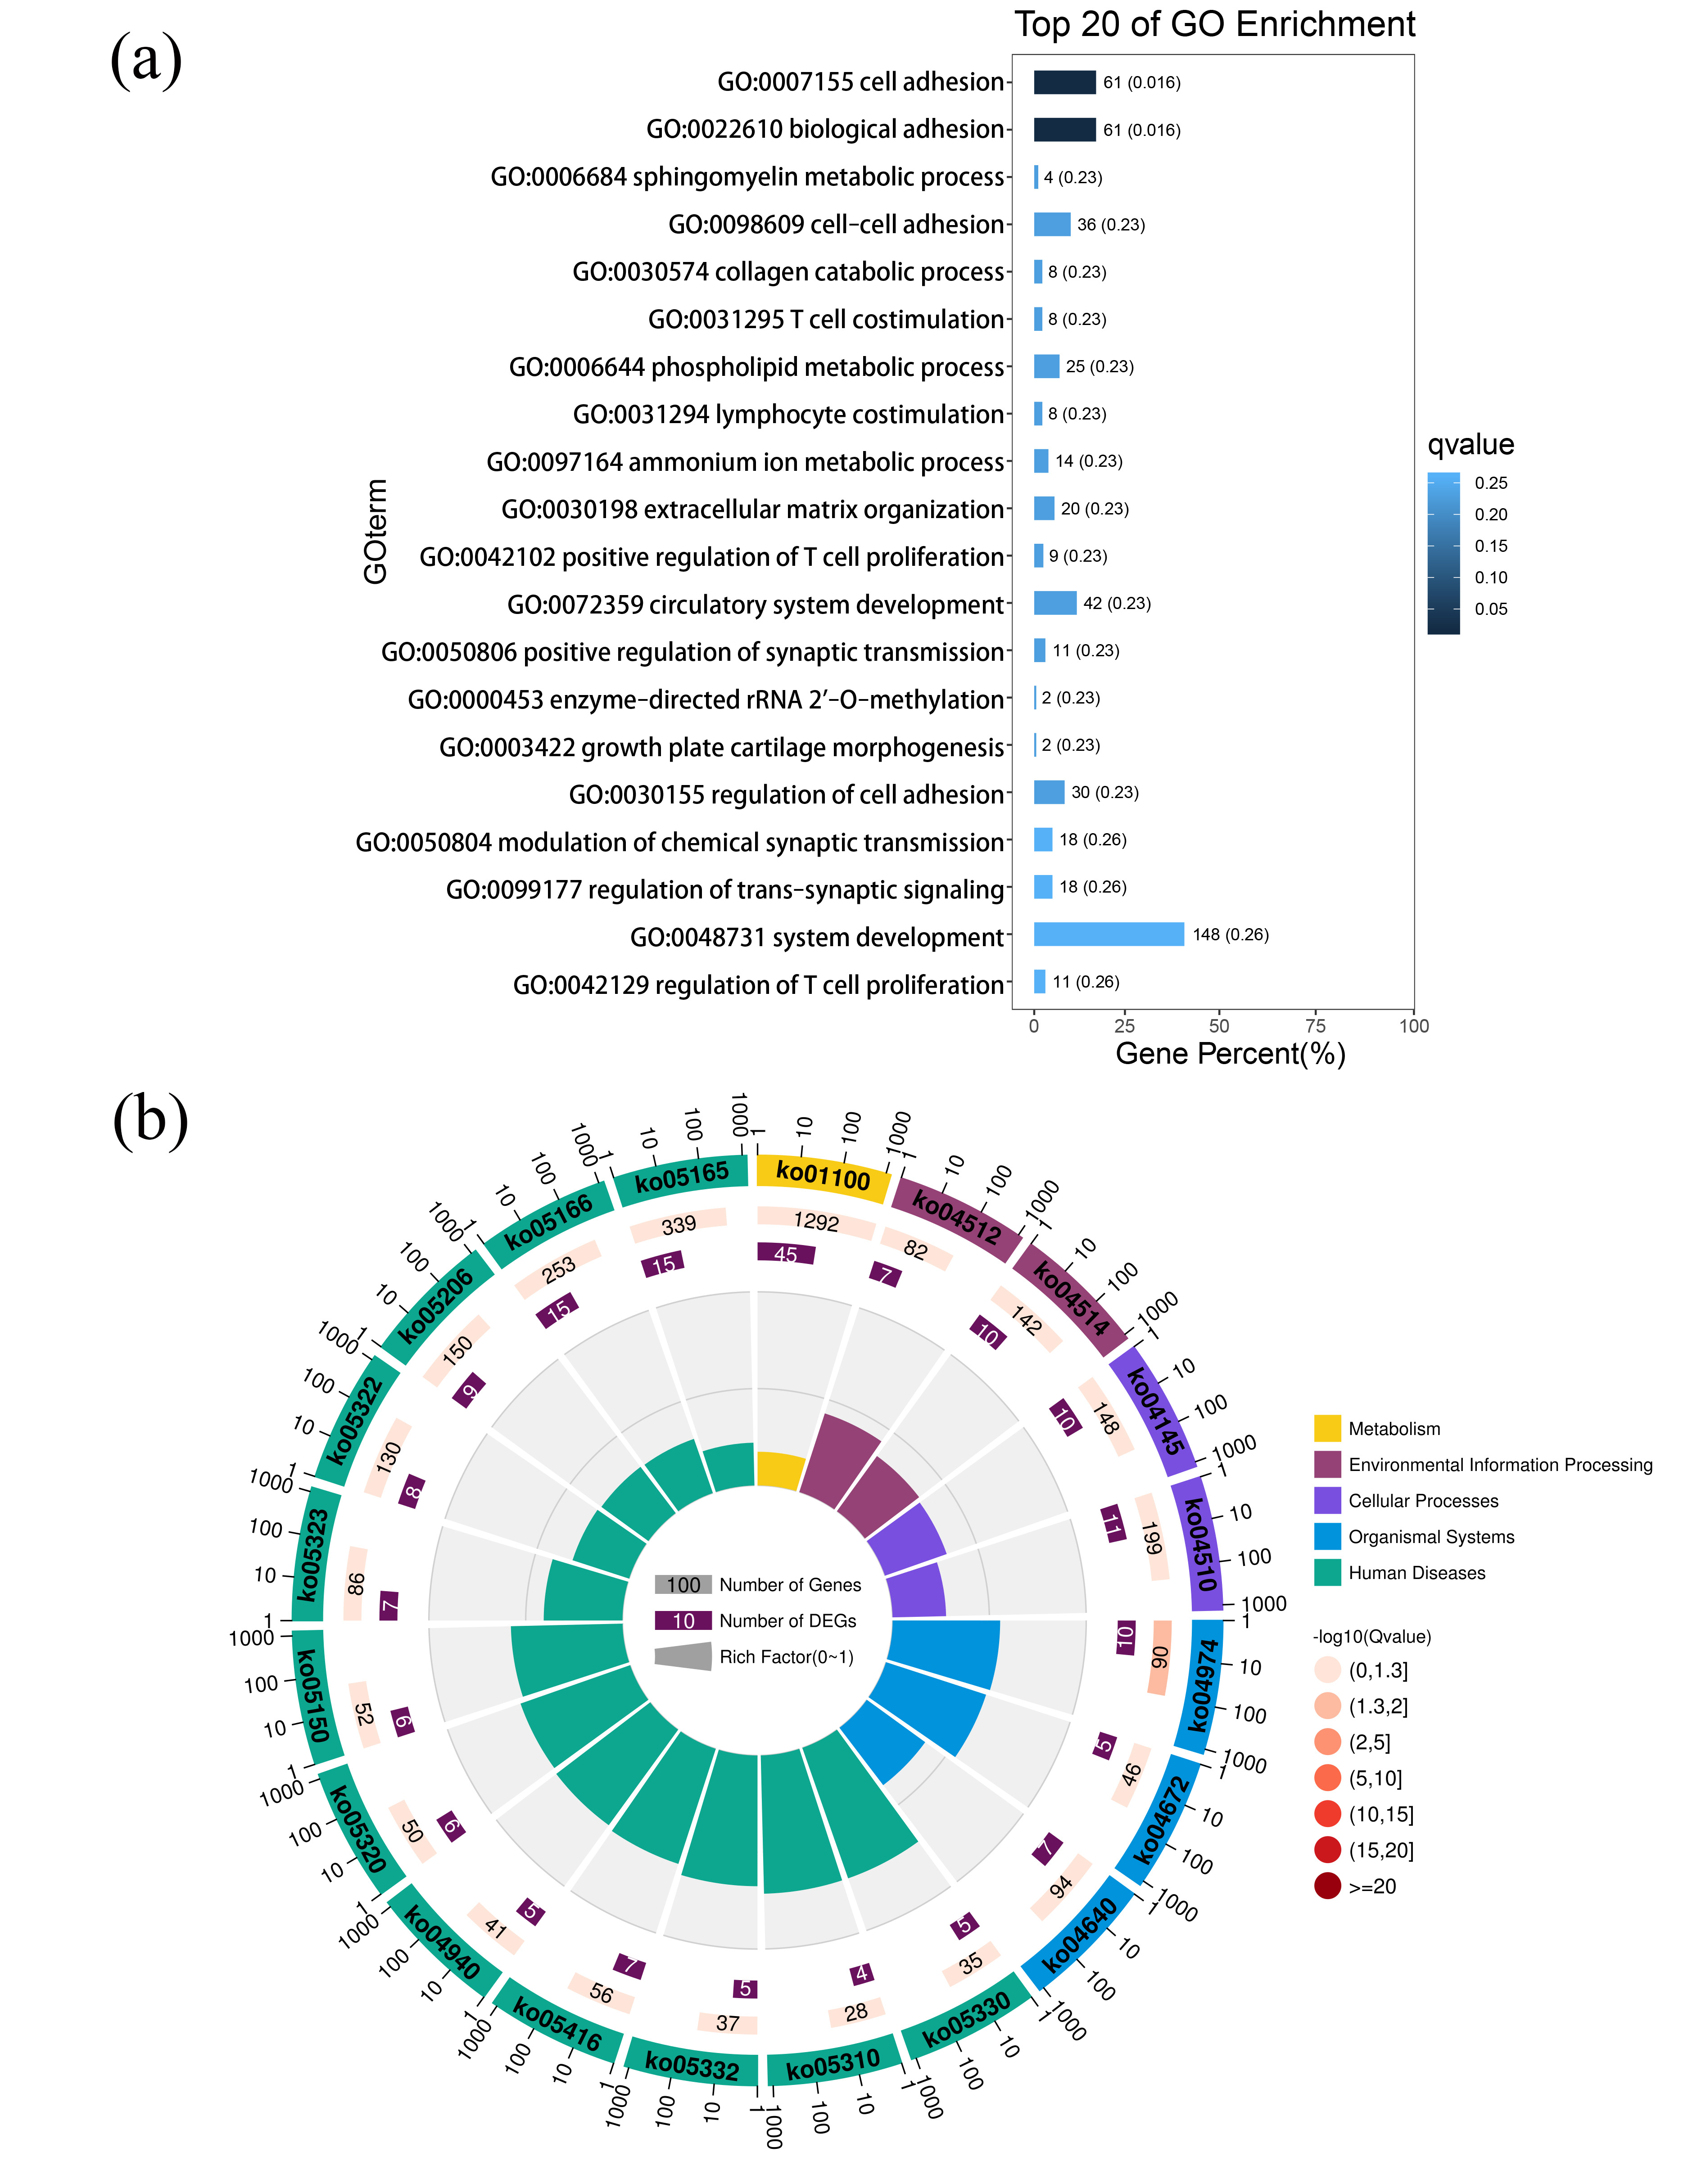
An analysis and visualization of exosomal messenger RNA functional profiles was performed using ClusterProfiler. A bar plot of the functional profile analysis results (Supplementary Table 4) is shown in Fig. 4a. Among the top 20 biological process enrichment terms, cell adhesion-associated biological processes (cell adhesion, biological adhesion, cell-cell adhesion, and regulation of cell adhesion), metabolic processes (sphingomyelin metabolic process, phospholipid metabolic process, and ammonium ion metabolic process), and T cell regulation-associated processes (T cell co-stimulation and positive regulation of T cell proliferation) were significantly enriched. The top 20 pathway analysis enrichment terms are shown in Fig. 4b, and further details are provided in Supplementary Table 5. Beyond metabolic pathways (ko01100) and cell adhesion molecules (ko04514), immune disease pathways, including ko05320, ko05330, ko05332, ko05310, ko05323, and ko05322, accounted for the majority of the significantly enriched human disease pathways (Fig. 4b).
 Fig. 4.
Biological process and pathway enrichment analyses of differentially expressed messenger RNA (DEmRNAs). (a) Bar plot ranking the top 20 biological processes enrichment terms of DEmRNAs. A lower q-value indicates significant enrichment, as indicated by the blue scale bar (high: light, low: dark). (b) Circular plot of the top 20 pathway enrichment terms for DEmRNAs. In the red scale bar, the higher the –log10 (q-value) the greater the enrichment score (high: dark, low: light). GO, Gene Ontology.
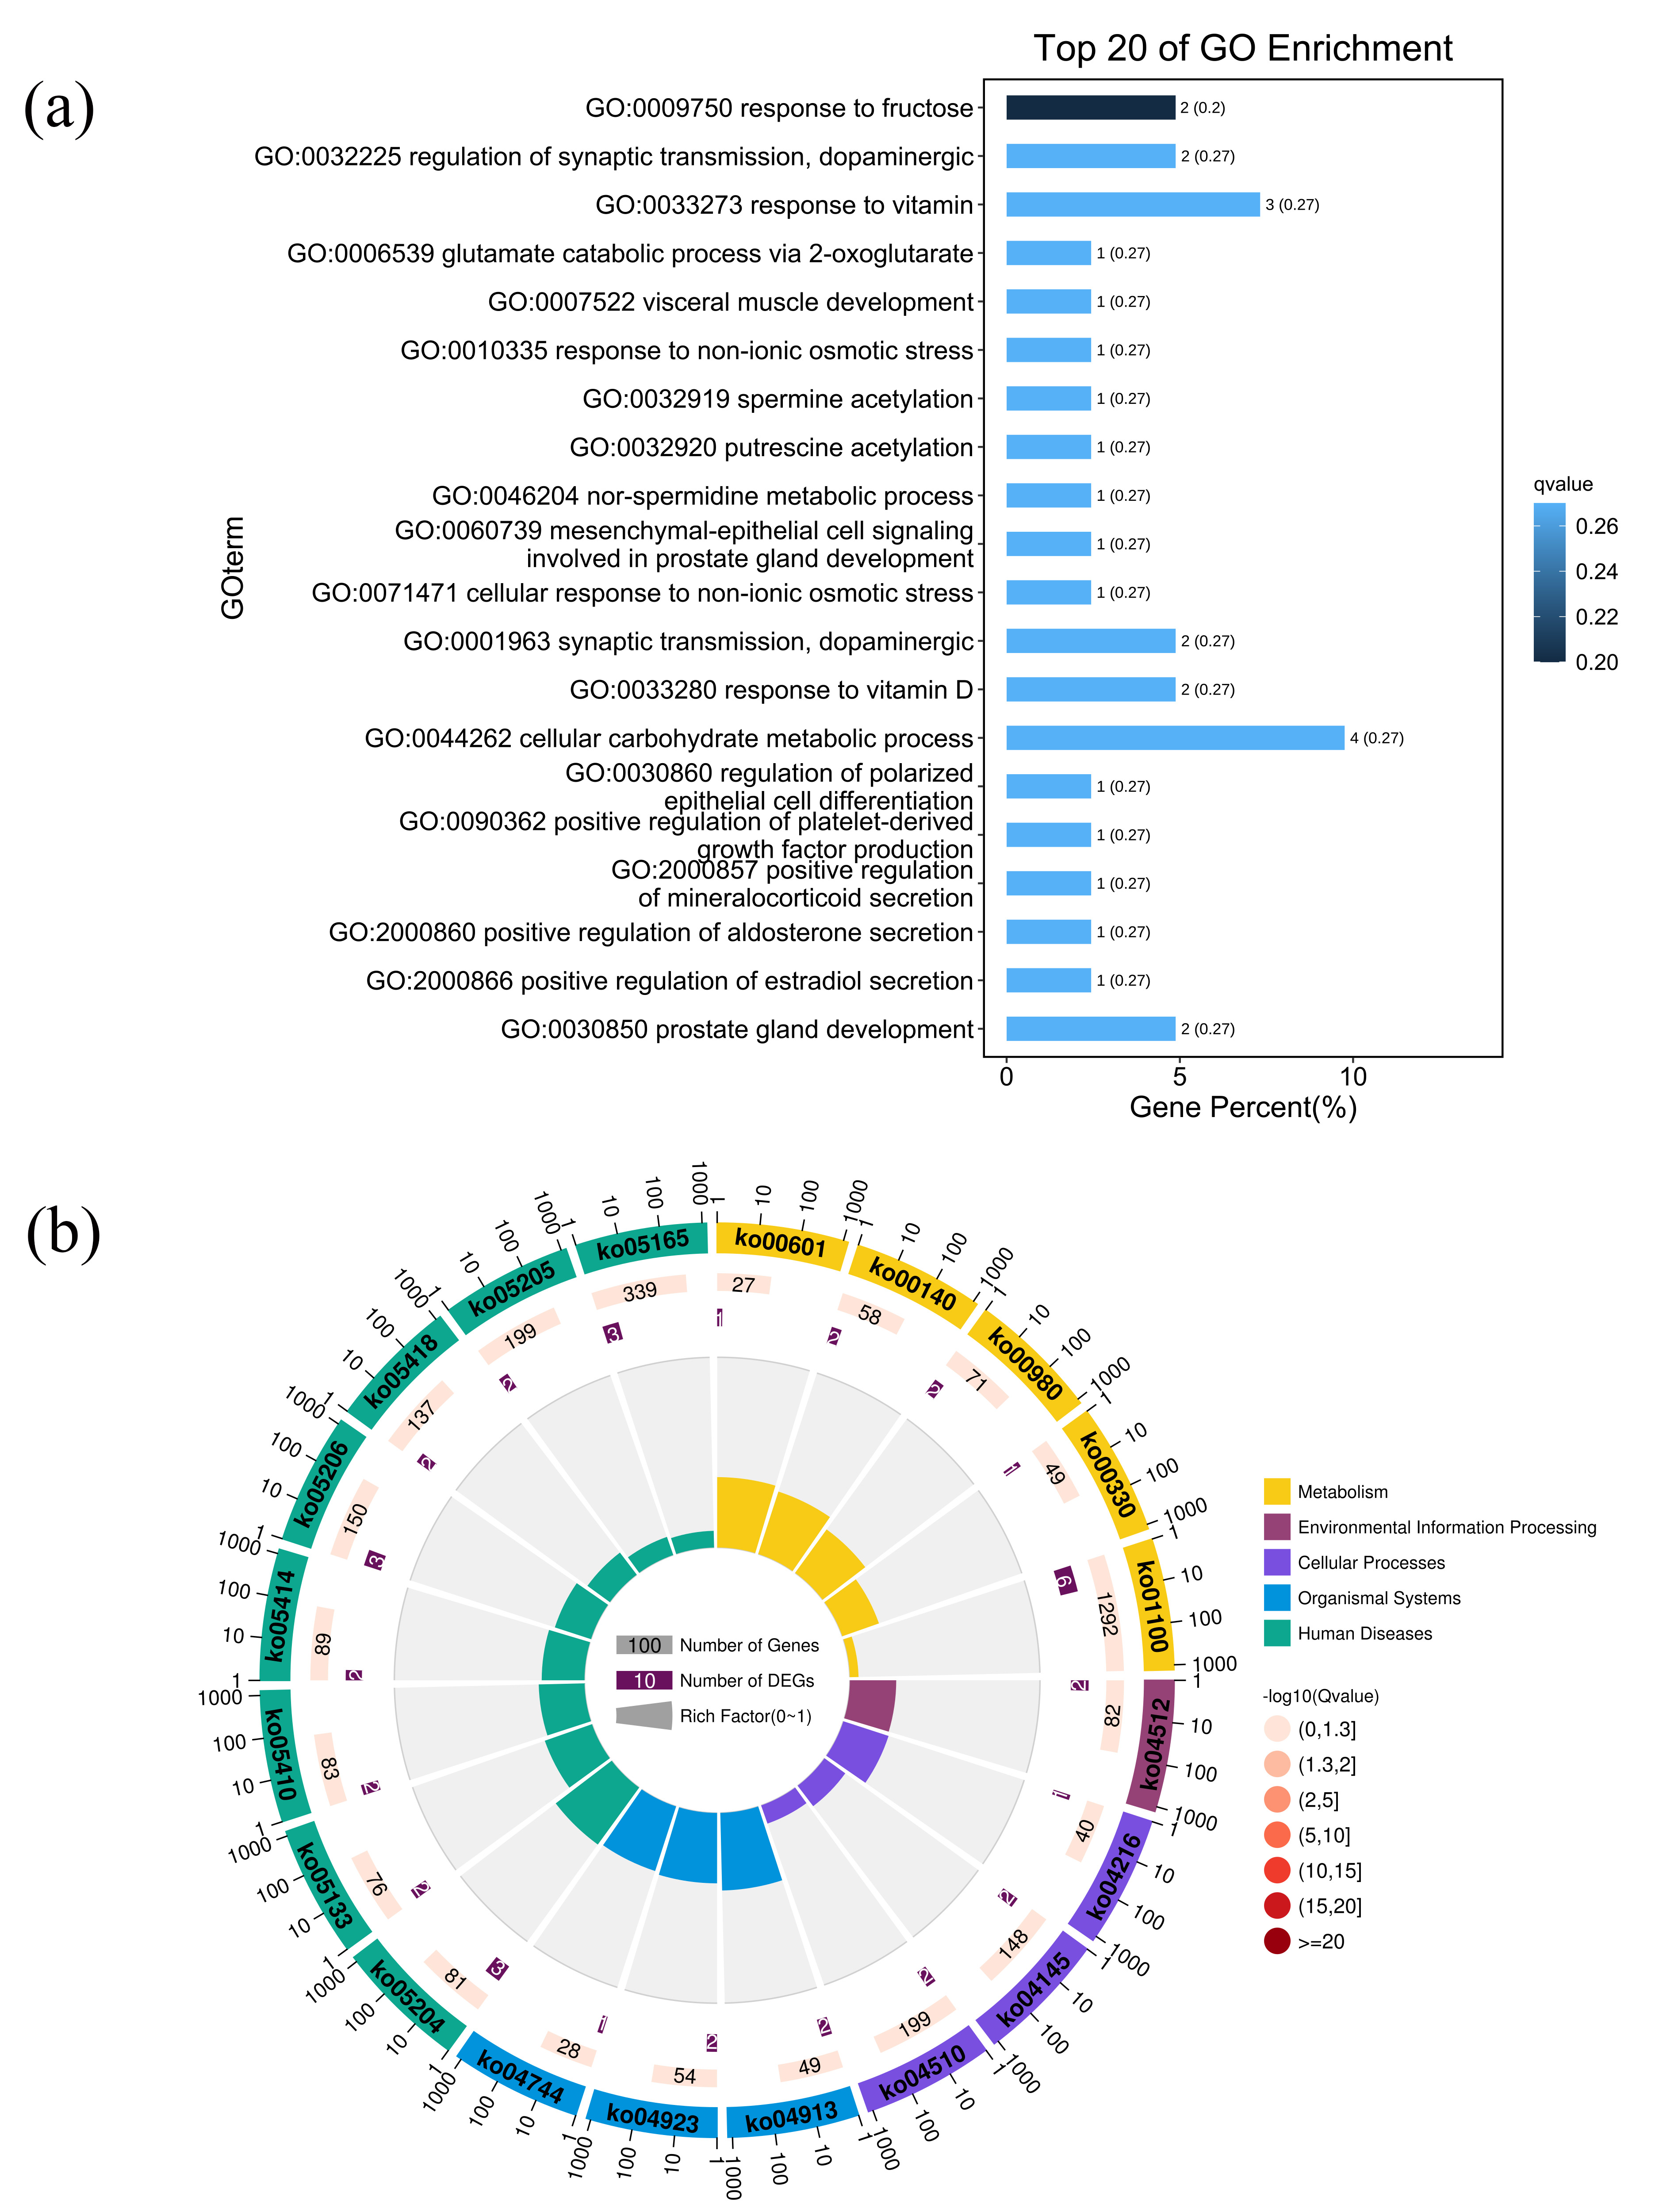
Based on the DEmRNAs and DElncRNAs, we obtained 375 trans-acting pairs, including 51 DEmRNAs and 18 DElncRNAs (Supplementary Table 6). However, no antisense or cis-acting pairs of DElncRNAs and DEmRNAs were found. These 51 DEmRNAs were considered the potential targets of DElncRNAs. The results of biological process enrichment analyses (Supplementary Table 7) are shown as a bar plot (Fig. 5a). Among the top 20 biological processes, metabolic processes (response to fructose, response to vitamins, nor-spermidine metabolic process, and cellular carbohydrate metabolic process) were significantly enriched. The results of the pathway enrichment analysis are shown in Supplementary Table 8. Beyond metabolic pathways and human diseases pathways, cellular processes pathways, including phagosome (ko04145), focal adhesion (ko04510), and ferroptosis (ko04216), might be closely associated with the regulation of the DElncRNAs in trans (Fig. 5b).
 Fig. 5.
Biological process and pathway enrichment analyses of the target transcripts of differentially expressed long non-coding RNAs (DElncRNAs). (a) Bar plot ranking the top 20 biological processes enrichment terms for DElncRNAs. A lower q-value indicates significant enrichment, as indicated by the blue scale bar (high: light, low: dark). (b) Circular plot of the top 20 pathway enrichment terms for DEmRNAs. In the red scale bar, the higher the –log10 (q-value) the greater the enrichment score (high: dark, low: light).
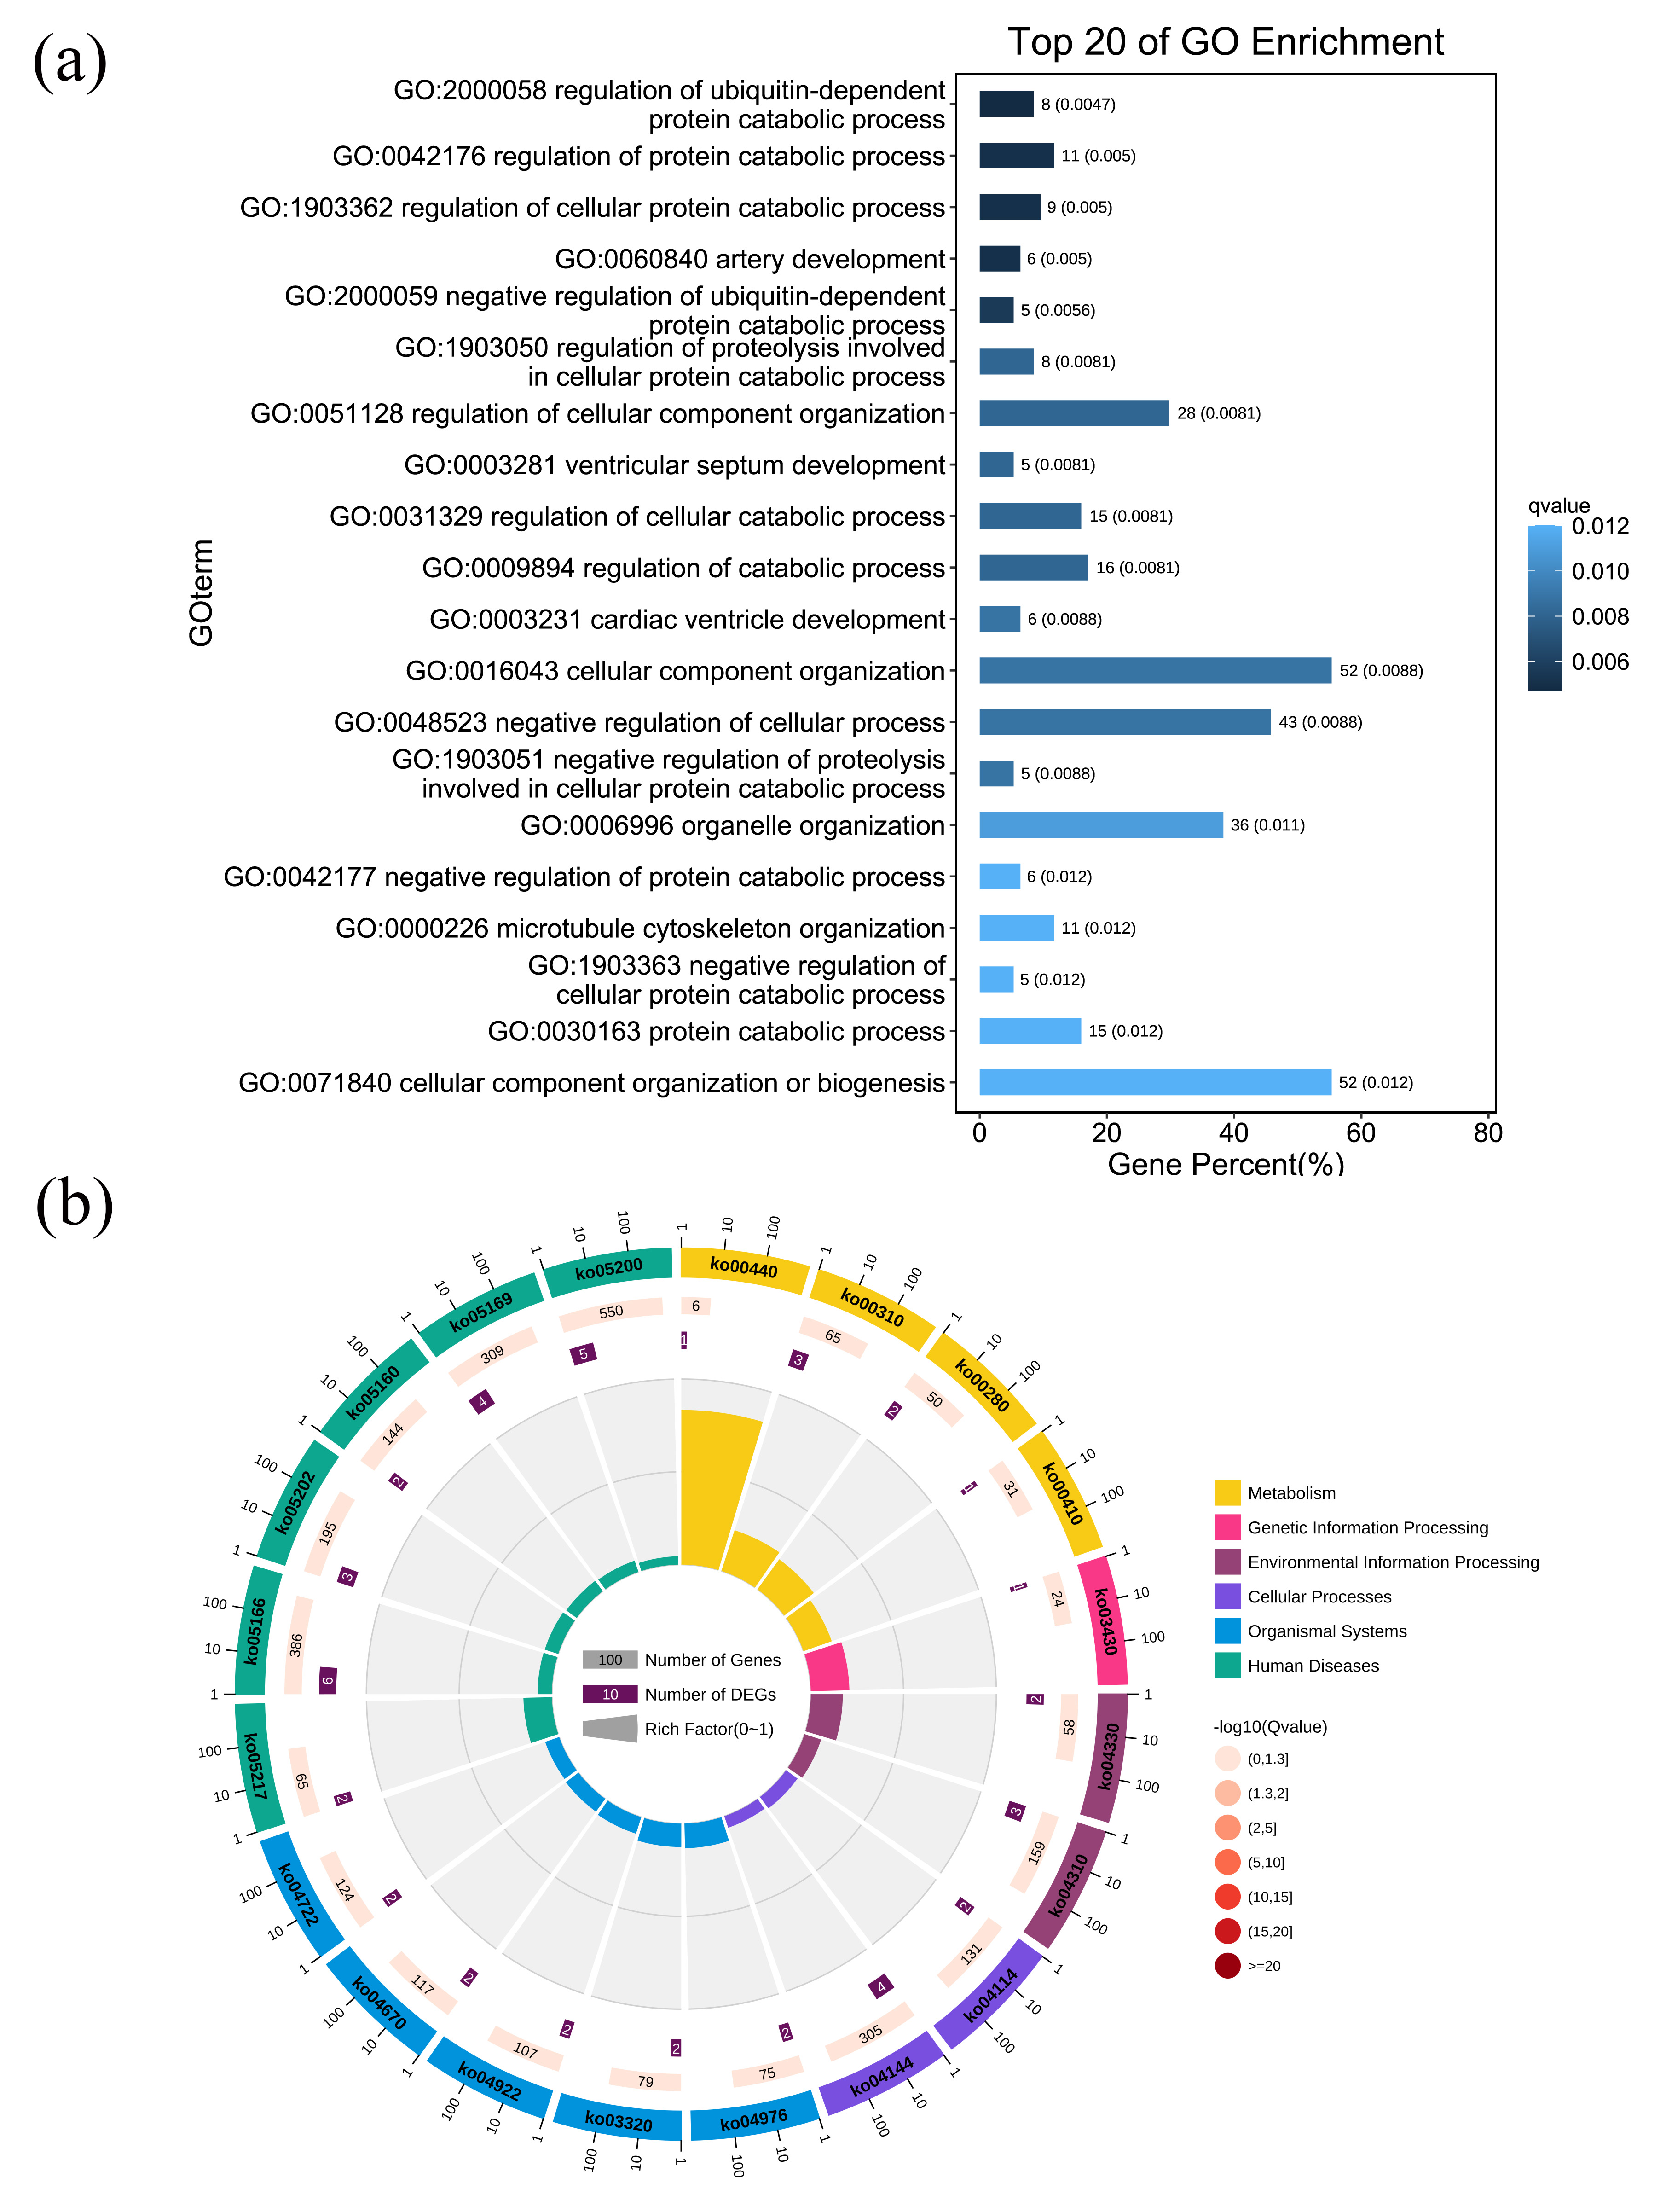
The enrichment of the parental genes of DEcircRNAs in GO biological processes was assessed (Supplementary Table 9), and catabolism-associated processes, particularly protein catabolic processes, were among the most significantly enriched GO terms (Fig. 6a). The function of DEcircRNAs might be closely associated with protein catabolic processes in ischemic stroke. KEGG pathway enrichment analysis revealed that metabolic pathways were closely associated with the expression of DEcircRNAs (Fig. 6b and Supplementary Table 10).
 Fig. 6.
Biological process and pathway enrichment analyses of the parental genes of the differentially expressed circular RNAs (DEcircRNAs). (a) Bar plot ranking the top 20 biological processes enrichment terms for DEcircRNAs. A lower q-value indicates significant enrichment, as indicated by the blue scale bar (high: light, low: dark). (b) Circular plot of the top 20 pathway enrichment terms for DEmRNAs. In the red scale bar, the higher the –log10 (q-value) the greater the enrichment score (high: dark, low: light).
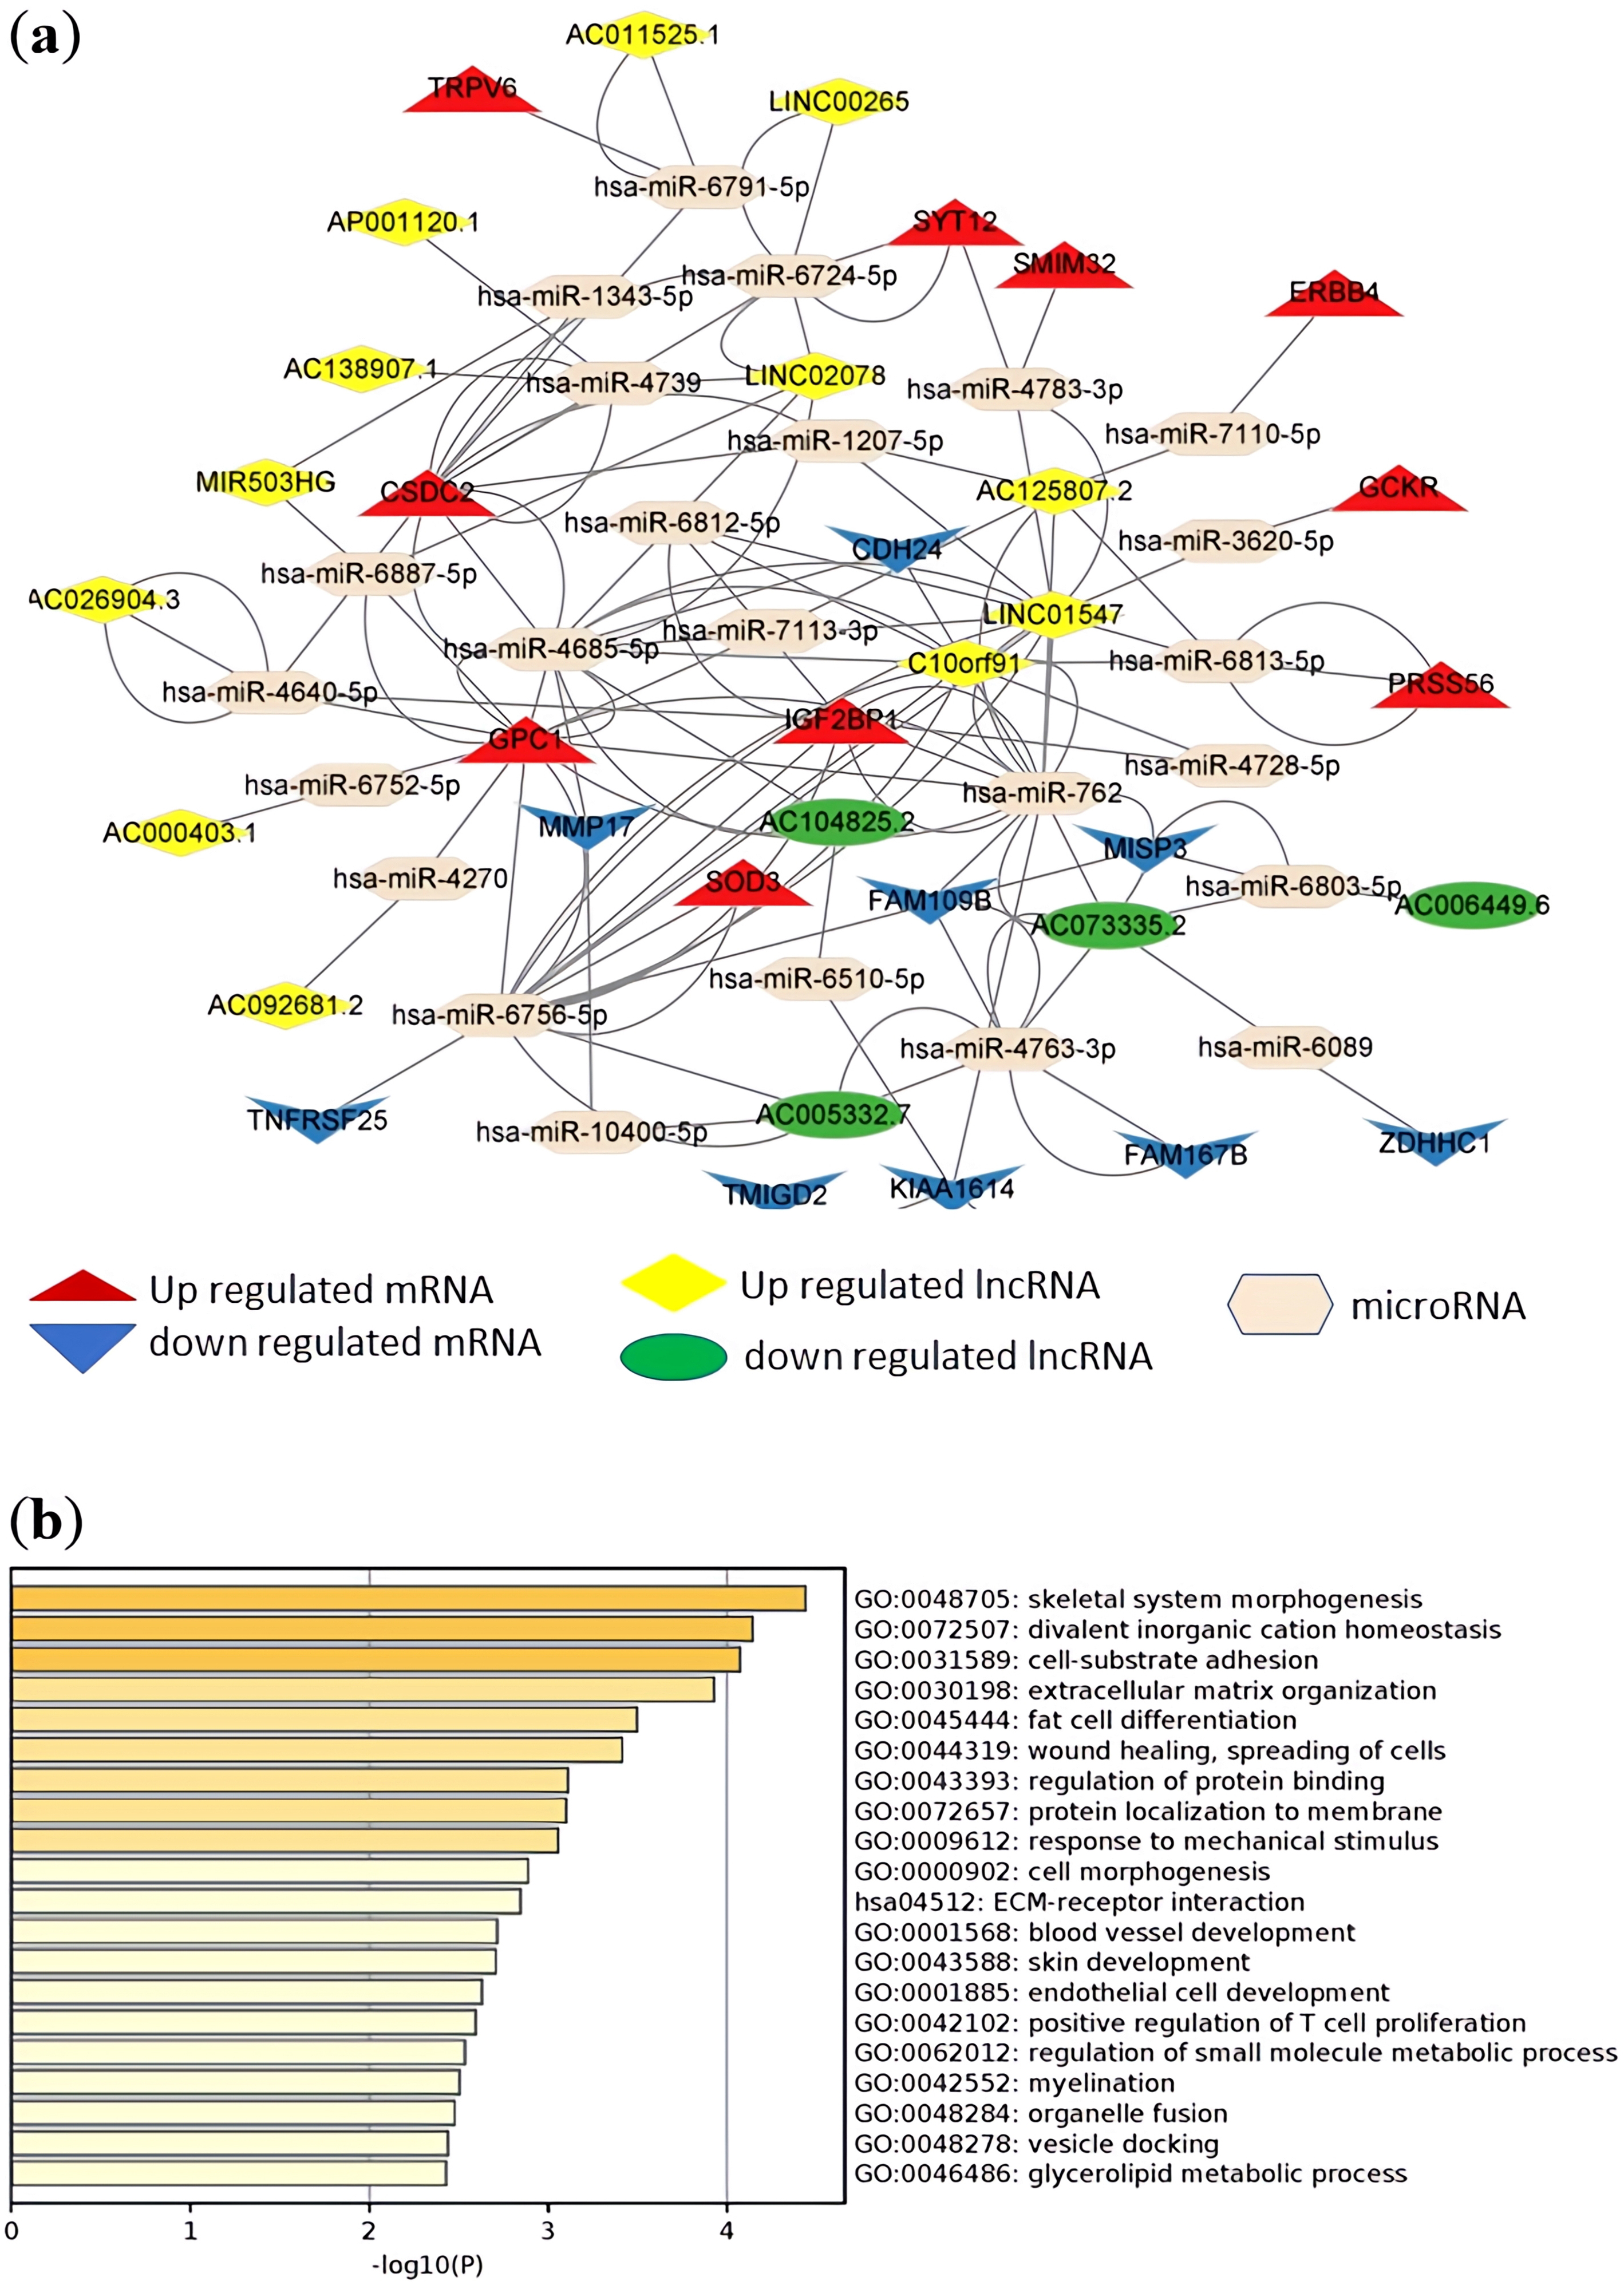
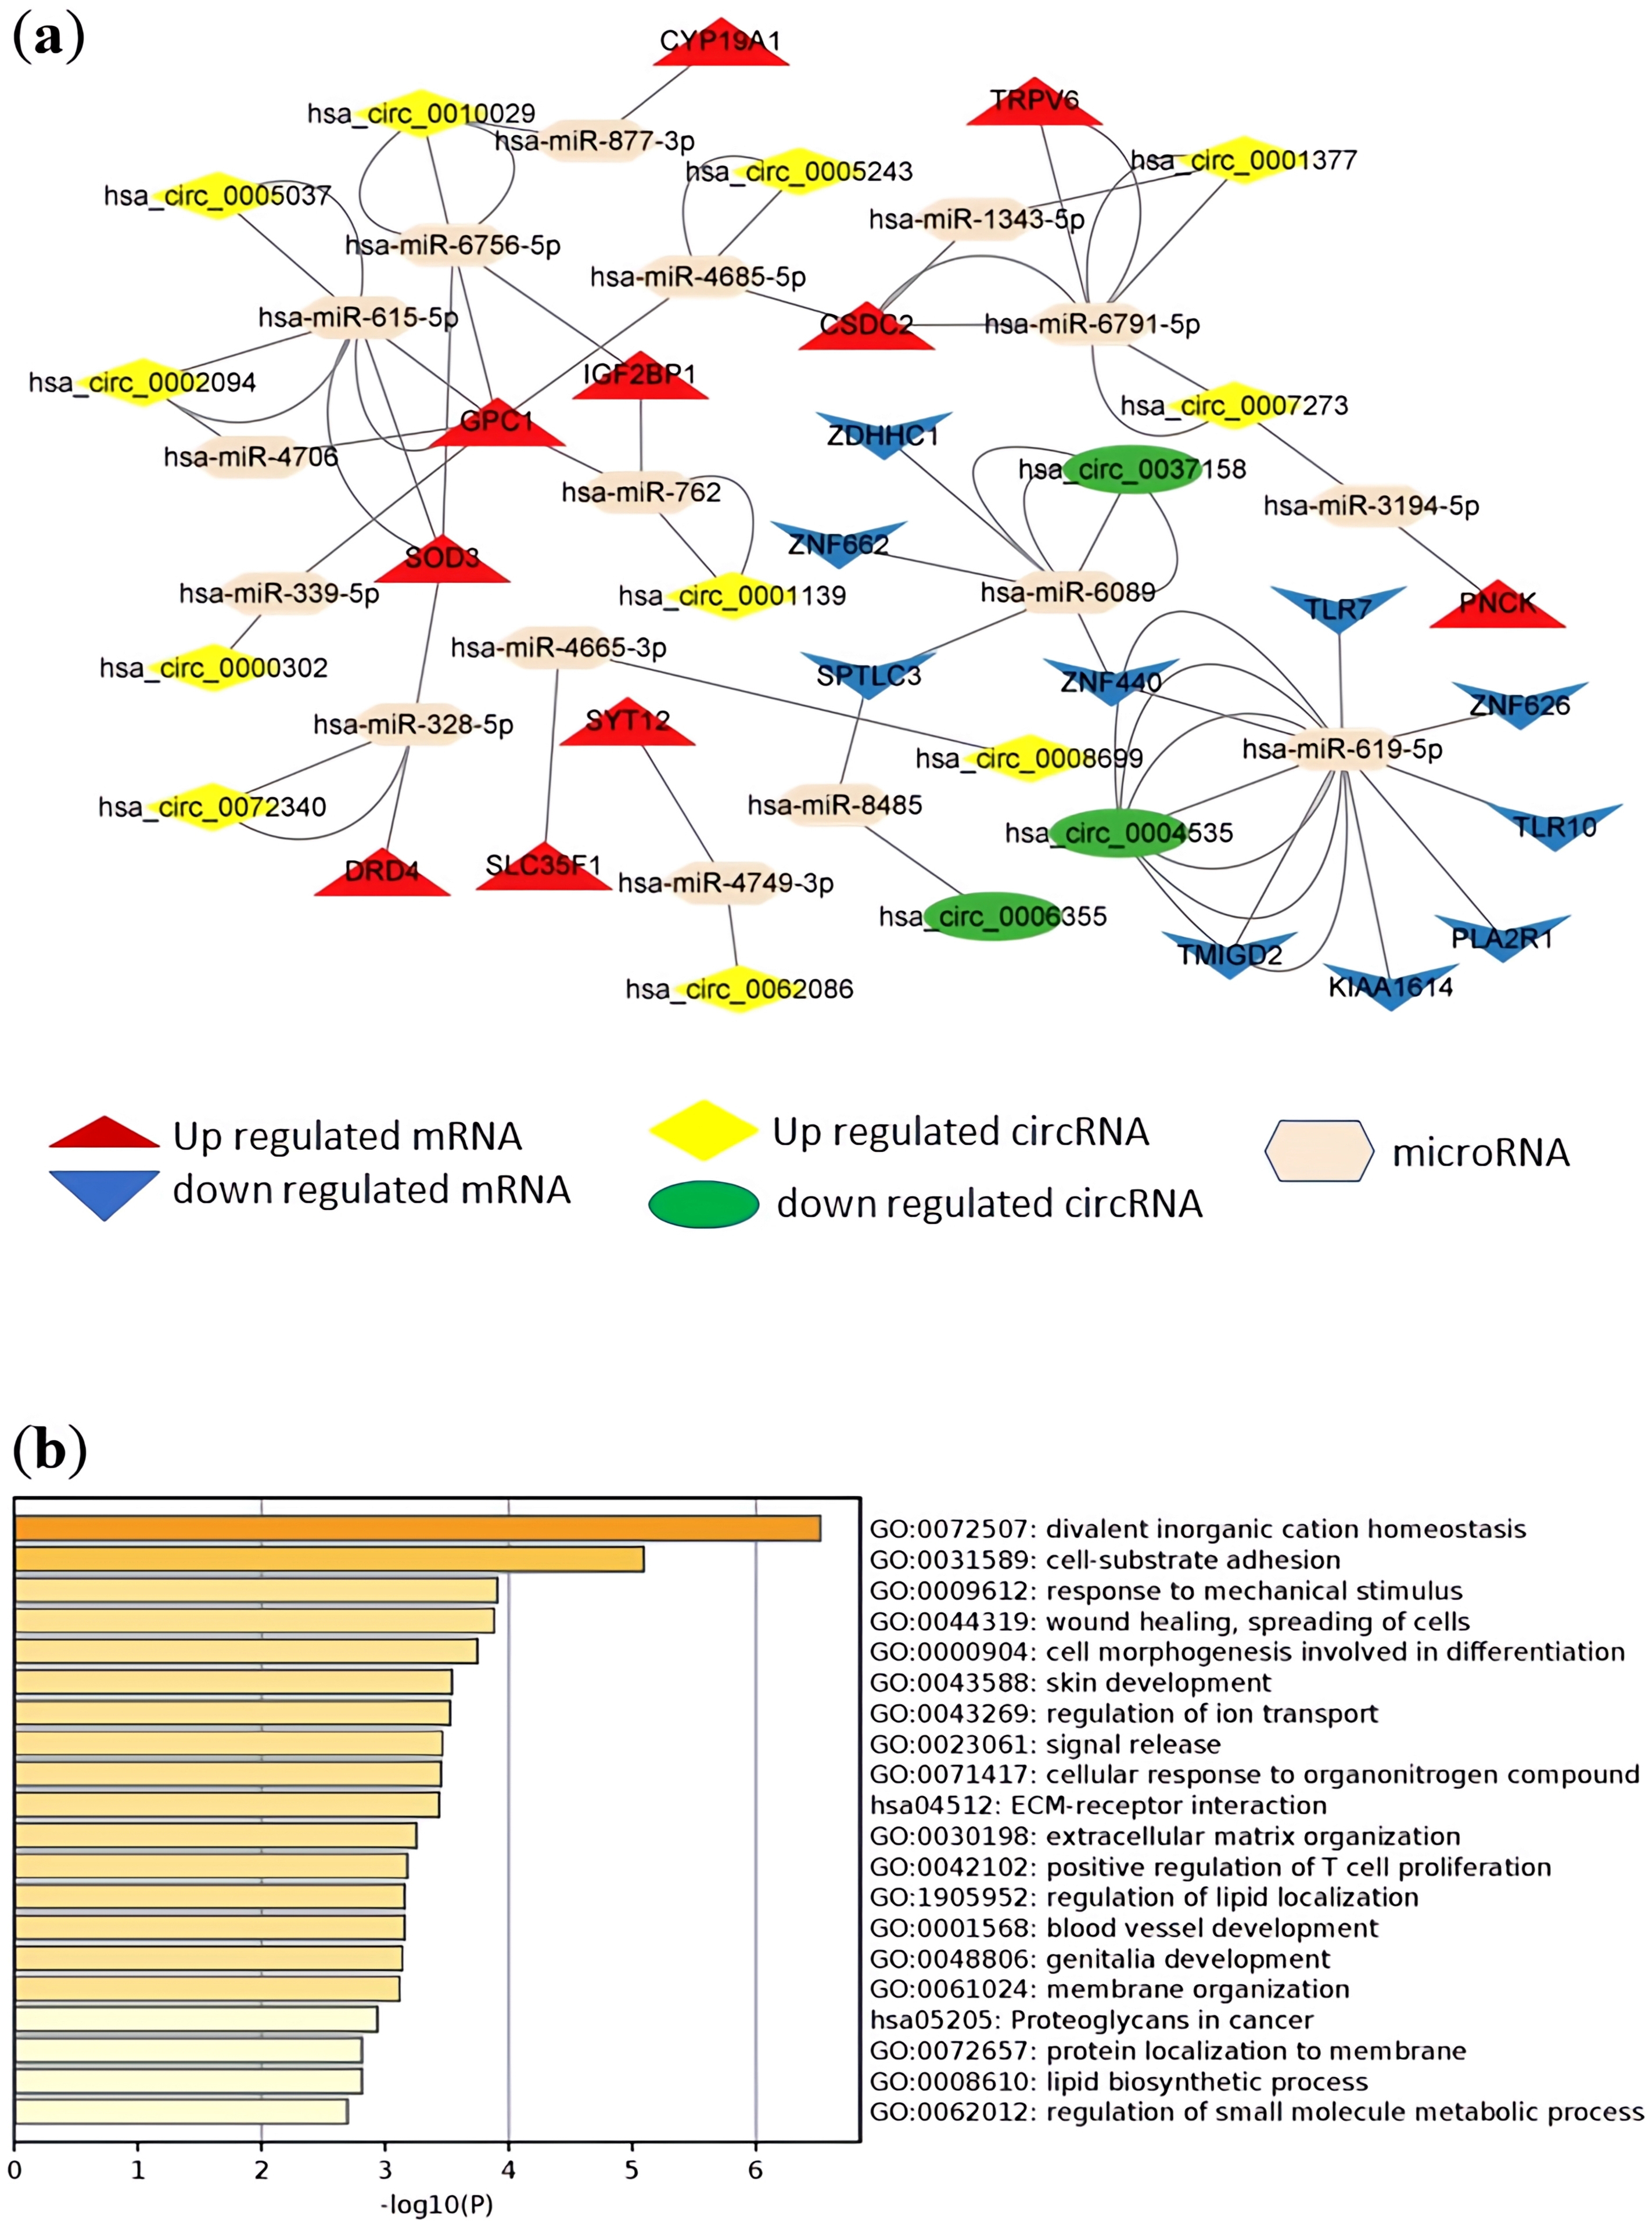
A total of 158 DElncRNA predicted microRNA pairs (Supplementary Table 11) and 441 predicted microRNA-DEmRNA pairs (Supplementary Table 12) were obtained and combined to construct the lncRNA-microRNA-messenger RNA-ceRNA regulatory network (Supplementary Table 13). The lncRNA-related ceRNA networks involving the top 10 up- and downregulated messenger RNAs are shown in Fig. 7a. In the same way, the relationships between 69 DEcircRNA-predicted microRNA pairs (Supplementary Table 14) and 318 predicted microRNA-DEmRNA pairs (Supplementary Table 15) were obtained and combined to construct a circular RNA-microRNA-messenger RNA-ceRNA regulatory network (Supplementary Table 16). The circular RNA-related ceRNA networks involving the top 10 up- and downregulated messenger RNAs are shown in Fig. 8a.
 Fig. 7.
LncRNA-microRNA-messenger RNA regulatory network, and biological process and pathway enrichment analyses of the differentially expressed messenger RNAs involved in the networks. (a) ceRNA regulatory network involving the top 10 up- and downregulated messenger RNAs. Red dots represent upregulated messenger RNA, blue dots represent downregulated messenger RNA, yellow dots represent upregulated lncRNA, green dots represent downregulated lncRNA, and beige dots represent microRNA. (b) Bar plot ranking the top 20 biological processes and signaling pathways, based on enrichment scores [–log10 (p value)] from pathway enrichment analysis of the messenger RNAs involved in the networks. ceRNA, competing endogenous RNA; lncRNA, long-noncoding RNA; mRNA, messenger RNA.
 Fig. 8.
Circular RNA-microRNA-messenger RNA regulatory network, and biological process and pathway enrichment analyses of the differentially expressed messenger RNAs involved in the networks. (a) ceRNA regulatory network involving the top 10 up- and downregulated messenger RNAs. Red dots represent upregulated messenger RNA, blue dots represent downregulated messenger RNA, yellow dots represent upregulated circular RNA, green dots represent downregulated circular RNA, and beige dots represent microRNA. (b) Bar plot ranking the top 20 biological processes and signaling pathways, based on enrichment scores [–log10 (p value)] from pathway enrichment analysis of the messenger RNAs involved in the networks.
GO biological process and KEGG pathway enrichment analyses of the messenger RNAs involved in the networks were investigated and are presented in Fig. 7b and Fig. 8b, respectively. The messenger RNAs involved in both ceRNA networks were significantly enriched in the functions of cell-substrate adhesion, wound healing and spreading of cells, extracellular matrix-receptor interaction, and positive regulation of T cell proliferation. Both ceRNA networks included the lncRNA-microRNA-messenger RNA and circular RNA-microRNA-messenger RNA networks, sharing 108 common DEmRNAs. We performed GO biological process and KEGG pathway enrichment analyses on the 108 common DEmRNAs to investigate the co-regulatory mechanism. Collagen formation and cell-substrate adhesion were significantly enriched terms. The results are shown in Supplementary Fig. 3.
The present study found that circulating exoLRs primarily consisted of messenger RNAs. A total of 508 exosomal messenger RNAs consisting of 321 up- and 187 downregulated RNAs, 40 exosomal lncRNAs consisting of 31 up- and 9 downregulated RNAs, and 115 exosomal circular RNAs consisting of 67 up- and 48 downregulated RNAs were identified in patients with ischemic stroke. Three different bioinformatics analyses, including immune cell landscape, enrichment analysis, and ceRNA networks, were applied, revealing that exoLRs were closely associated with T cell-mediated inflammatory responses. Our study provided novel insights into the clinical value of exoLRs in ischemic stroke.
Initially, the expression profiles of exosomal messenger RNAs, long noncoding RNAs, and circular RNAs in 9 patients with ischemic stroke and 12 healthy individuals were analyzed through next-generation sequencing. Our data indicated that many exosomal messenger RNAs were significantly abnormally expressed in ischemic stroke, and plasma exoLRs primarily consisted of messenger RNAs. In most disease conditions, we observed substantially downregulated expression of exosomal RNAs, with high cell and tissue specificity [33, 34]. Recent studies have revealed that long RNAs, including messenger RNAs, lncRNAs, and circular RNAs, in circulating exosomes have numerous clinical applications [13, 35]. Further study has demonstrated that exosomal RNAs are promising diagnostic and treatment targets for several diseases, such as cardiovascular and cerebrovascular diseases, and tumors [5]. The distinguishable expression patterns of exoLRs in circulating plasma and the high abundance of exosomal messenger RNAs indicated that exoLRs might be used as potential biomarkers and reflect the pathophysiologic responses of ischemic stroke.
Next, we applied multiple bioinformatics methods to analyze the alterations and functions of exoLRs from three different perspectives so as to comprehensively explore the potential molecular function and pathophysiologic importance of circulating exoLRs in ischemic stroke. Further, we applied CIBERSORT to estimate the abundance of immune cell types in a mixed cell population. The results showed that the proportions of exhausted and gamma delta T cells were statistically higher in patients with ischemic stroke. Subsequently, we analyzed the differentially expressed exoLRs and performed biological process enrichment analysis of different exosomal messenger RNAs. T cell regulation-associated processes were significantly enriched, including T cell co-stimulation and positive regulation of T cell proliferation. Finally, based on the ceRNA hypothesis, we constructed ceRNA networks by predicting microRNA-binding RNAs. These two ceRNA networks included the lncRNA-microRNA-messenger RNA and circular RNA-microRNA-messenger RNA networks, sharing 108 common DEmRNAs, and nodes in the network represented groups of genes with similar functions. In addition, the messenger RNAs involved in both ceRNA networks were significantly enriched in the positive regulation of T cell proliferation. In this study, we applied three types of bioinformatics methods, all of which revealed that the alterations of circulating exoLRs in ischemic stroke were closely associated with the inflammatory response mediated by T cells. Ischemic stroke is characterized by the recruitment and activation of inflammatory cells, which exacerbate cerebral infarction [36]. The infiltration rate of T lymphocytes influences infarct size in the early stages of stroke [37]. Study has shown that FasL mutation attenuates the cytotoxicity of CD8+ T cells in ischemic stroke [38]. Similarly, blocking the activation and infiltration of CD8+ T cells can reverse demyelination, even in late-phase ischemic stroke [39]. Furthermore, a recent study has demonstrated that ischemic stroke induced the secretion of the FasL-expressing monocyte population, which modulated T cell apoptosis and drug inhibition, thus minimizing post-stroke bacterial infections [40]. Although the precise physiological role of exosomes in ischemic stroke remains poorly understood, inflammation-associated dysregulated expression of exosomal RNAs may be associated with the biological process of ischemic stroke.
This study was novel in demonstrating that circulating exoLRs reflected T cell-mediated inflammatory responses in ischemic stroke. However, these preliminary results were limited by small sample sizes and lacked generalizability, besides requiring further validation in different clinical settings. Therefore, validation of the clinical value using quantitative polymerase chain reaction in large cohorts will be a promising direction in the future. This study had several limitations. First, although blood samples were collected immediately at the time of admission and before thrombolytic therapy, the profile of exoLRs changed significantly after ischemic stroke in a time-dependent manner. The influence of the time interval between stroke onset and blood sampling on exoLR concentrations requires further investigation. Second, this study analyzed only ischemic stroke. Investigating the alterations in exLRs among patients with ischemic stroke of varying subtypes may constitute a significant and promising avenue for future research. Finally, circulating plasma exosomes interact with numerous cell types and tissues; however, the specific physiological roles of plasma exoLRs must be elucidated in future experimental studies. The functionality of exoLRs depends on the integrity of the vesicles. For instance, certain exosomal messenger RNAs are functional only if they remain intact [41]. Given the paucity of data, further investigations are needed to unravel the association between exoLRs and ischemic stroke.
Many exoLRs, including exosomal messenger RNAs, exosomal lncRNAs, and exosomal circular RNAs, are abnormally expressed in ischemic stroke. The expression patterns of circulating exoLRs highlighted the association between ischemic stroke and inflammatory responses mediated by T cells. These findings provided novel insights into the roles of exoLRs in ischemic stroke pathogenesis, but the molecular mechanisms require further systematic investigation.
exoLRs, exosomal long RNAs; ceRNA, competing endogenous RNA; mRNA, messenger RNA; lncRNA, long non-coding RNA; GO, Gene Ontology; KEGG, Kyoto Encyclopedia of Genes and Genomes; DElncRNAs, differentially expressed long non-coding RNAs; SD, standard deviation; DEmRNAs, differentially expressed messenger RNAs; DEcircRNAs, differentially expressed circular RNAs; PCA, principal component analysis.
The raw datasets generated and/or analyzed during the current study are available in the Gene Expression Omnibus database. (https://www.ncbi.nlm.nih.gov/geo/query/acc.cgi?acc=GSE186844). Original images are available in the supplementary material.
GDH performed the data analysis and interpretation. SS performed collection and assembly of data. GDH and YQH designed the original study. All authors contributed to editorial changes in the manuscript. All authors drafted the manuscript and critically reviewed and approved the final manuscript. All authors have participated sufficiently in the work and agreed to be accountable for all aspects of the work.
The study was conducted according to the guidelines of the Declaration of Helsinki and was approved by the Ethics Committee of Guangdong Provincial People’s Hospital (approval No. GDREC2019443H). Written informed consent was obtained from all the study participants or their families/legal guardians.
We appreciate Guangzhou Epibiotek Co., Ltd. for excellent technical assistance.
This research was funded by the Guangdong Medical Science and Technology Research Fund (No. A2023005), National Natural Science Foundation of China (No. 82103910), Natural Science Foundation of Guangdong Province (No. 2020A1515010738), Initial funding of the National Natural Science Foundation-Youth Project (No. 8210120459) and Guangdong Basic and Applied Basic Research Foundation-Provincial Enterprise Joint Fund (2022A1515220113).
The authors declare no conflict of interest.
Supplementary material associated with this article can be found, in the online version, at https://doi.org/10.31083/FBL25355.
References
Publisher’s Note: IMR Press stays neutral with regard to jurisdictional claims in published maps and institutional affiliations.