


 , Mairobys Socorro 2, Adriana Ferreira Lopes Vilela 1, Juçara Gastaldi Cominal 1, Luiz Henrique da Silva Andrilli 1, Pietro Ciancaglini 1, Saida Mebarek 3, Dobrawa Napierala 2, Ana Paula Ramos 1
1 Department of Chemistry, Faculty of Philosophy, Sciences, and Letters, University of São Paulo, 140400-900 Ribeirão Preto, São Paulo, Brazil
2 Department of Oral and Craniofacial Sciences, Center for Craniofacial Regeneration, University of Pittsburgh School of Dental Medicine, Pittsburgh, PA 15261, USA
3 Institut de Chimie et Biochimie Moléculaires et Supramoléculaires, Université Lyon 1, UMR CNRS, 5246 Villeurbanne Cedex, France
Abstract
Mineral deposition in the extracellular matrix (ECM) is a highly organized process initiated by matrix vesicles (MVs) released from mineralization-competent cells, such as osteoblasts. In bone pathologies, osteogenic inducers (ions, hormones, nanoparticles) are becoming increasingly vital for the repair of damaged tissue. Among these inductors, strontium ranelate (SR), first suggested for treating osteoporotic patients, stands out. The bioactive strontium ion (Sr2+) has a dual mechanism of action in bone homeostasis: it activates osteoblasts, promoting bone formation, and inhibits osteoclasts, limiting bone resorption. Recent research has focused on how Sr2+ influences osteoblast function, but its effects on the mineralization process have not been explored. For this study, we hypothesized that Sr2+ modulates mineralization-competent cells at two levels: (a) it activates the extracellular signal-regulated kinase 1/2 (Erk1/2) and cAMP response element-binding protein (CREB) osteogenic signaling pathways, increasing mineral towards in the ECM, and (b) it regulates MV release and function. Advanced lipidomic analysis examined how Sr2+ affects the MV lipid profile, which is pivotal for MV biogenesis and bone formation.
We performed an MTT assay to assess the cytotoxicity of CaCl2 and SR. Alizarin Red and Von Kossa staining were used to track mineral deposition towards the ECM. We assessed the phosphorylation states of ERK and CREB by western blotting and the osteogenic-related gene levels by quantitative real-time PCR. Biophysical characterization of 17A11-derived MVs was performed by nanoparticle tracking analysis (NTA), dynamic light scattering (DLS), and zeta potential. Mineral deposition and characterization were performed by turbidimetry and Fourier transform infrared spectroscopy (FTIR), respectively. MV activity was studied by alkaline phosphatase activity. We also performed a Western blot analysis to assess MV markers. Atomic force microscopy (AFM) and transmission electron microscopy (TEM) were applied to investigate changes in membrane fluidity and the vesicles’ conformation. We explored the changes in lipid profiles using state-of-the-art lipidomic analysis.
Our findings demonstrate that Sr2+ activates the Erk1/2 and CREB pathways, leading to a dose-dependent increase in ECM mineralization. Additionally, the viscoelastic properties of MVs from Sr2+-stimulated 17IIA11 cells, a preodontoblast progenitor cell line, were altered, as demonstrated by AFM and TEM, which we linked to modifications in their lipid composition, as revealed by the enrichment of ceramide (Cer) and sphingomyelin (SM), both of which play pivotal roles in bone development.
Our study demonstrated that Sr2+ affects the initiation of the mineralization process by changing the release and lipid composition of MVs, and acts, in part, through Erk1/2 and CREB signaling pathways.
Keywords
- strontium ranelate
- biomineralization
- extracellular vesicles
- matrix vesicles
- lipidomics
Mineral deposition within the extracellular matrix (ECM) is a tightly regulated event that occurs during the formation of bone, hypertrophic cartilage, and mineralized dental tissues such as enamel, dentin, and cementum. A key component in initiating this process is the release of matrix vesicles (MVs) from cells capable of promoting mineralization. These vesicles are small, membrane-bound particles—typically about 100–300 nm in diameter—that represent a specialized subtype of extracellular vesicles. Their distinctive role lies in their ability to concentrate Ca2+ and inorganic phosphate (Pi/PO43-), creating a microenvironment suitable for the first hydroxyapatite (HAp) crystals to form. After release, MVs interact with type I collagen fibrils in the ECM, where the newly formed HAp nuclei can expand and align into the organized mineral phase characteristic of skeletal and dental matrices. Through these combined actions, MVs serve as essential initiators of ECM mineralization [1].
Advanced high-resolution imaging techniques have clarified the cellular pathways that govern how mineralizing cells generate and secrete MVs [2, 3, 4, 5]. Evidence indicates that microvesicles enriched with mineral content are released from the plasma membranes of both skeletal cells and odontoblasts [6, 7, 8, 9]. Thus, MV release probably occurs through a mechanism involving the apical membrane, called microvilli budding from the plasma membrane [1]. Comparative proteomic and lipidomic analyses have also identified that MVs and the parental cell membrane microvilli share similar molecular composition [10, 11]. For example, lipidomic data have revealed that fatty acids (FA) found in microvilli membranes and chondrocyte-derived MVs are similar [10]. In addition, the MV membrane contains high levels of cholesterol, sphingomyelin (SM), and phosphatidylcholine, which are highly abundant in lipid rafts [12, 13]. Lipid class and organization influence the MV mineralization activity, as shown previously [14, 15, 16, 17].
For the first HAp seeds to nucleate inside the MV lumen, specialized enzymes and transporters must act to promote Ca2+ (uppercase) and Pi uptake [18, 19]. Previous reports have demonstrated that Ca2+ and Pi effectively induce MV biogenesis [20, 21, 22, 23, 24]. Recent proteomic data have revealed that a Pi transporter (PiT-1) and a calcium transporter (Annexins A2) [11, 25, 26] are localized in the MV membrane. In addition, the MV membrane hosts three key enzymes responsible for producing inorganic phosphate: tissue-nonspecific alkaline phosphatase (TNAP/ALP) and nucleotide pyrophosphatase phosphodiesterase-1 (NPP1), both of which generate Pi through adenosine triphosphate (ATP) hydrolysis, and PHOSPHO1, which releases Pi by cleaving phospholipid head groups such as phosphoethanolamine [27, 28, 29, 30]. More than supporting HAp nucleation and structural organization within the collagenous ECM, MVs exert functions related to mineralized tissue physiology, such as inducing osteogenic differentiation [31]. Under osteogenic conditions in vitro, MVs mineralize type I-collagen [32, 33, 34, 35]. Furthermore, MVs embedded in collagen-based hydrogels accumulate Ca2+ in a dose-dependent manner [36]. Collectively, these findings suggest that MVs may serve as promising therapeutic agents for bone-related disorders [31, 37, 38, 39, 40, 41, 42, 43].
MVs are capable of initiating mineral deposition within the ECM; however, the
regulatory cues that control their release from mineralizing cells remain
incompletely defined. Owing to the ability of Sr2+ to both stimulate
osteoblast-driven mineral formation and suppress osteoclast-mediated bone
resorption, strontium ranelate (SR) has been broadly used in clinical management
of osteoporosis [44, 45, 46, 47], and has been linked to reducing fractures in the
femoral neck [44, 48, 49, 50]. Enhanced mineralization by osteoblasts could be related
to MV release, but how Sr2+ influences MV biogenesis and function has not
been investigated in depth. Studies have demonstrated that Sr2+ interferes
with signaling pathways in differentiating mesenchymal stem cells (MSCs) into
osteoblasts and osteoblast activity [50]. For instance, Sr2+ can engage key
osteoblast-related receptors, including Frizzled/Lrp5/6 and the calcium-sensing
receptor (CaSR), leading to increased expression of osteogenic genes such as
runt-related transcription factor 2 (Runx2), osteocalcin (Ocn),
bone morphogenetic protein 2 (Bmp2), collagen type I (Col1),
and transcription factor osterix (Sp7) [51, 52]. Previous studies have
also demonstrated the “promiscuous” Sr2+ effect over other
osteogenic-related signaling pathways, including the Erk1/2 [53], Bmp2
[54, 55], Wnt/
On the other hand, for monocyte/macrophage progenitor cells to differentiate
into mature osteoclasts, nuclear factor-kappa beta (NF-
Although Sr2+ is often presumed to promote mineralization due to its chemical similarity to Ca2+, the detailed cellular pathways and molecular mechanisms through which Sr2+ influences biomineralization are still poorly defined. We proposed that Sr2+ contributes to biomineralization through two complementary mechanisms: (a) by promoting the differentiation and activation of cells capable of initiating mineralization, and (b) by enhancing both the release and functional activity of MVs. To investigate the first mechanism, we examined the involvement of the Erk1/2 and CREB signaling pathways and assessed changes in osteogenic gene expression using qRT-PCR. We also evaluated how Sr2+ modulates MV secretion and their subsequent mineralizing capacity. Lastly, we characterized, for the first time, the effects of Sr2+ on the MV lipidomic profile, demonstrating how shifts in lipid composition influence the vesicles’ ability to drive ECM mineralization.
Mouse preodontoblast-derived 17IIA11 cells were kindly provided by Prof. Dr.
Odile Kellermann and Prof. Dr. Anne Poliard, Laboratoire de
Différenciation Cellulaire et Prions-UPR, France. The
preodontoblast isolation method and characterization are described elsewhere
[74, 75]. Mycoplasma testing was performed by PCR, and all tests yield negative
results. Standard flow cytometry technique were used to validate the cell surface epitope profile of the pulpal 17IIA11 clones. Cells were maintained in a “growth medium” consisting of Dulbecco’s
modified Eagle’s medium (DMEM; Gibco, Thermo Fisher Scientific, Logan, UT, USA),
enriched with 5% (v/v) fetal bovine serum and 1% (v/v) penicillin/streptomycin.
Incubation was carried out at 37 °C in a humidified chamber with 5%
CO2 and 95% air. For differentiation experiments, cells were seeded into
10-cm dishes at a density of 2
The cells were cultured for 24 h or 4 or 6 days, and cell viability was assessed by the MTT 3-(4,5-dimethylthiazol-2-yl)-2,5-diphenyltetrazolium bromide assay as previously described here [76]. To measure the metabolic activity, the generated formazan product was solubilized in DMSO, and the optical density was recorded at 570 nm.
Cells (1
The staining process began with two washes in PBS and fixation using 4% paraformaldehyde for 10 min. After rinsing twice with deionized water, the cells were incubated with a 2% silver nitrate solution. The formation of the silver precipitate required 20 min of UV lamp exposure, followed by a water rinse. The reaction was subsequently stopped by adding 5% sodium thiosulfate for 5 min, finalized by a deionized water wash.
Total RNA was isolated using the Trizol protocol (0000124780; Invitrogen, Thermo Fisher Scientific, Waltham, MA, USA) and purified with the GenElute Mammalian Total RNA miniprep kit (Sigma). 1 µg of RNA was subjected to DNase I (Invitrogen) treatment and reverse-transcribed into cDNA using the SuperScript III kit (Invitrogen). Gene expression was quantified by real-time PCR on an AB Biosystems 7500 system employing the Fast SYBR Green reaction mix (4385618; Roche Applied Science, Penzberg, Bavaria, Germany). Primer sequences were as follows: Osx F, GGGCGTTCTACCTGCGACTG, and R, ATCGGGGCGGCTGATTG; Runx2 F, TGGCCGGGAATGATGAGAAAC, and R, TGAAACTCTTGCCTCGTCCG; Phospho1 F, CCTGGGAAACAGCCGCCGATGTG, and R, CCCGGAGGAGCATAGCAAAGCGAAG; Gapdh F, GCAAGAGAGGCCCTATCCCAA, and R, CTCCCTAGGCCCCTCCTGTTATT; Col1a1 F, GCAACAGTCGCTTCACCTACA, and R, CAATGTCCAAGGGAGCCACAT; Alpl F, CAGTGGGAGTGAGCGCAGCC, and R, GCACTGGGTGTGGCGTGGTT; Smpd3 F, ACATCGATTCTCCCACCAACACCT, and R, AATTCGCACAATGCAGCTGTCCTC.
For immunoblotting experiments, cells were seeded in six-well plates at a
density of 5
MVs were isolated and purified from the ECM as described previously [16, 77].
Cells were washed with PBS, and MVs were released by digesting the ECM with 2.5
mg/mL collagenase IA (102764679; Sigma-Aldrich, St. Louis, MO, USA) and 2 mM CaCl2 for
4 h at 37 °C in 5% CO2. The digestion mixture was collected and
centrifuged at 600
MV size and concentration were measured by NTA using a NanoSight NS300 (Malvern
Instruments Ltd., Worcestershire, UK). Samples were diluted in filtered PBS (pH
7.4) to reach the recommended range of 1
MV morphology and size were examined by JEOL JEM-100 CXII (JEOL Ltd., Akishima, Tokyo, Japan) TEM by drying a drop of the MV colloidal dispersion on a copper grid covered with a conductive polymer. Then, the sample was treated with phosphotungstic acid (PTA, 1%) for 15 min and analyzed.
MVs were passed through 0.22-µm Millipore® filters to remove aggregates and residual matrix fragments. To preserve vesicle structure, samples were fixed with 1.4% glutaraldehyde and incubated at 37 °C for 5 min. A 15-µL aliquot of each preparation was then placed on freshly cleaved mica, air-dried, and imaged using a SPM-9600 (Shimadzu Corporation, Kyoto, Japan) scanning probe microscope.
Mineral composition was assessed by ATR-FTIR using an IRPrestige-21 spectrometer (Shimadzu Corporation, Tokyo, Japan). Mineral deposits formed in the presence of MVs were gently collected from the culture plate and positioned on a ZnSe ATR crystal for analysis [13, 79].
TNAP activity was determined according to Andrilli et al. (2023) [28]. TNAP activity was quantified by monitoring the formation of the p-nitrophenyl product generated from p-nitrophenylphosphate (pNPP) at pH 10.4. Absorbance was recorded at 405 nm. Enzyme activity was expressed as U per mg of total protein, where one unit corresponds to the hydrolysis of 1 nmol of substrate per mg of protein at 37 °C.
MVs were first incubated in synthetic cartilage lymph (SCL) buffer (pH 7.5) containing 2 mM Ca2+, 2 mM Mg2+, 16.5 mM Tris, 63.5 mM sucrose, 5.55 mM glucose, and the indicated concentrations of Na+, K+, Cl–, HCO3–, and SO42-. ATP (2 mM) served as the phosphate source. Mineral formation was monitored by measuring turbidity at 340 nm using a SpectraMax® M3 microplate reader. Each value was corrected by subtracting the initial absorbance of the corresponding MV sample [28, 80].
All the experiments were conducted at least three times. Data are presented as
the mean
Synthetic lipid standards were acquired by Avanti Polar Lipids (Alabaster, Alabama, USA) and used as internal lipids standards such as: monoacylglycerosphosphocholine (LPC) 17:0, monoacylglycerosphosphate (LPA) 17:0, diacylglycerophosphocholine (PC) 17:0/17:0, phosphatidylserine (PS) 17:0/17:0, diacylglycerophosphoethanolamine (PE) 17:0/17:0, diacylglycerophosphoglycerol (PG) 17:0/17:0, SM 12:0 and ceramide (Cer) 17:0. Stock solutions of each synthetic IS were prepared by dissolving in CHCl3/MEOH (9:1 or 5:1, v/v) at concentrations ranging from 25 mM to 5 mM and stored at –80 ℃. Working solutions were prepared at 25 µM for the assays.
Extraction of samples was carried out based liquid-liquid phase extraction protocol as described here [81]. Briefly, each sample was spiked with 40 µL of a mixture of lipid (IS) before being extracted. MV (100 µL - 1011particles) samples in Eppendorf tubes were adjusted in volume with deionized ultrapure water to 250 µL and mixed with 260 µL MeOH. Followed by the addition of 1000 µL MTBE and vortexed for 10 s. The tubes were incubated in an ice bath for 10 min and followed put on a shaker for 60 min, under gentle stirring at room temperature. Afterwards, the extraction solution was centrifuged at 12,000 g for 10 min, followed by the collection of the upper organic phase. At the end of extractions, all collected samples were dried in a vacuum system at a pressure of 10.0 Torr at 45 ℃. The dried samples were re-suspended in 40 µL isopropanol/acetonitrile/H2O (2:1:1 v/v/v) and analyzed by an LC-MS/MS system.
Tandem mass spectrometry analyses were carried out in an ultra-high-performance
liquid chromatographic (UHPLC - Nexera X2; Shimadzu, Kyoto, Honshu, Japan)
coupled to a triple quadrupole time-of-flight (Triple- TOF® 5600+
Sciex, Foster, CA, USA) mass spectrometer. The UHPLC system consists of two LC
30AD pumps, an autosampler (SIL-30AC), a CTO-30A oven, a CBM-20A controller, and
DGU-20A degassing. The TripleTOF® 5600+ mass spectrometer was
equipped with a turbo-V IonSpray and calibrant delivery system (CDS). Data
acquisition was accomplished on a Shimadzu CBM-20A system interfaced with a
computer, using the Analyst® TF software version 1.7.1 (SCIEX,
CA, USA). The chromatographic separation was performed using an Acquity
UPLC® CSH™ C18 column (100
External calibrations of the calibrated delivery system (CDS) were performed
using an atmospheric pressure chemical ionization (APCI) probe. Automatic mass
calibration (accuracy
All datasets acquired were analyzed using the software PeakView 2.1 (Sciex, CA,
USA) and MS-Dial™ 5.1.230429 (open-source software - RIKEN,
Yokohama, Kanagawa, Japan). The setting parameters used were described here [81].
Briefly, the data were processed using SWATH acquisition files with centroid
MS/MS data in both ionization modes. Parameters included an m/z tolerance of 0.05
Da, mass range of 50–1250, and specific settings for peak detection,
deconvolution, and alignment. Lipid annotation was performed using the MS-DIAL
software with the MSP 20230427074147 conventional as a reference library under
defined mass accuracy and matching criteria. Identified lipid structures were
confirmed by MS/MS fragmentation matching. The final dataset was exported in .svg
or .xls formats for statistical analysis, which was conducted in GraphPad Prism 8.0 (San Diego, CA, USA) and MetaboAnalyst 6.0 (Xia Lab, McGill University, Montréal,
Québec, Canada) using PLS-DA and heatmap visualization, with results
expressed as mean
For our investigation into Sr2+-mediated biomineralization, we used the 17IIA11 preodontoblast cell line, which offers a robust and relatively simple system for analyzing the contribution of MVs to dental tissue formation [78, 82, 83, 84]. Additionally, 17IIA11 cells express high levels of major osteogenic transcription factors Sp7 and Runx2, so these cells are already committed to mineralization, mineralizing the ECM in approximately 6 days. Contrarily, MC3T3-E1, a pre-osteoblast cell line, fully mineralizes the ECM within approximately 21 days, making it a more scalable but also more time-consuming model.
However, despite their similarities, caution is warranted when extrapolating the findings presented here to bone tissue, as important differences between cell types are reported. For example, our group has observed a significant change in the protein and lipid profile of MVs derived from different mineralizing cell lines (data submitted for publication), which suggests a different mechanism of action and biogenesis. Therefore, we encourage further studies using primary osteoblasts or the MC3T3-E1 cell line to determine whether the effects of Sr2+ are consistent across different mineralizing cell types.
We used SR as the primary Sr2+ source because it has been used as a treatment to prevent fractures in postmenopausal osteoporosis [85, 86, 87]. SR is composed of an organic moiety (ranelic acid) and two atoms of stable strontium. One may raise the concern of the ranelic acid having any sort of organic anion effect. However, pharmacokinetics and metabolism investigation of the commercially available SR PROTOS® (CAS number: 135459-87-9) showed no evidence of ranelic acid accumulation and metabolism in animals and humans. Absorbed ranelic acid is rapidly eliminated unchanged via the kidneys [88]. Other works have also tested its reliability [87, 89].
First, we tested the effect of Sr2+ on cell viability (Fig. 1a–f). We tested low (0.1 mM) and high (1.0 mM) concentrations of SR in osteogenic medium consisting of standard growth medium supplemented with AA and sodium phosphate (Na3PO4), so that the effect of Sr2+ with osteogenic inductors could be evaluated. Because Ca2+ is important for mineralization, and Sr2+ may have similar modes of action to Ca2+ [90, 91], we also compared the effects of Sr2+ to the effects of Ca2+. Fig. 1 shows that adding Sr2+ to osteogenic medium was not cytotoxic to 17IIA11 cells at any of the tested concentrations (see Fig. 1e,f).
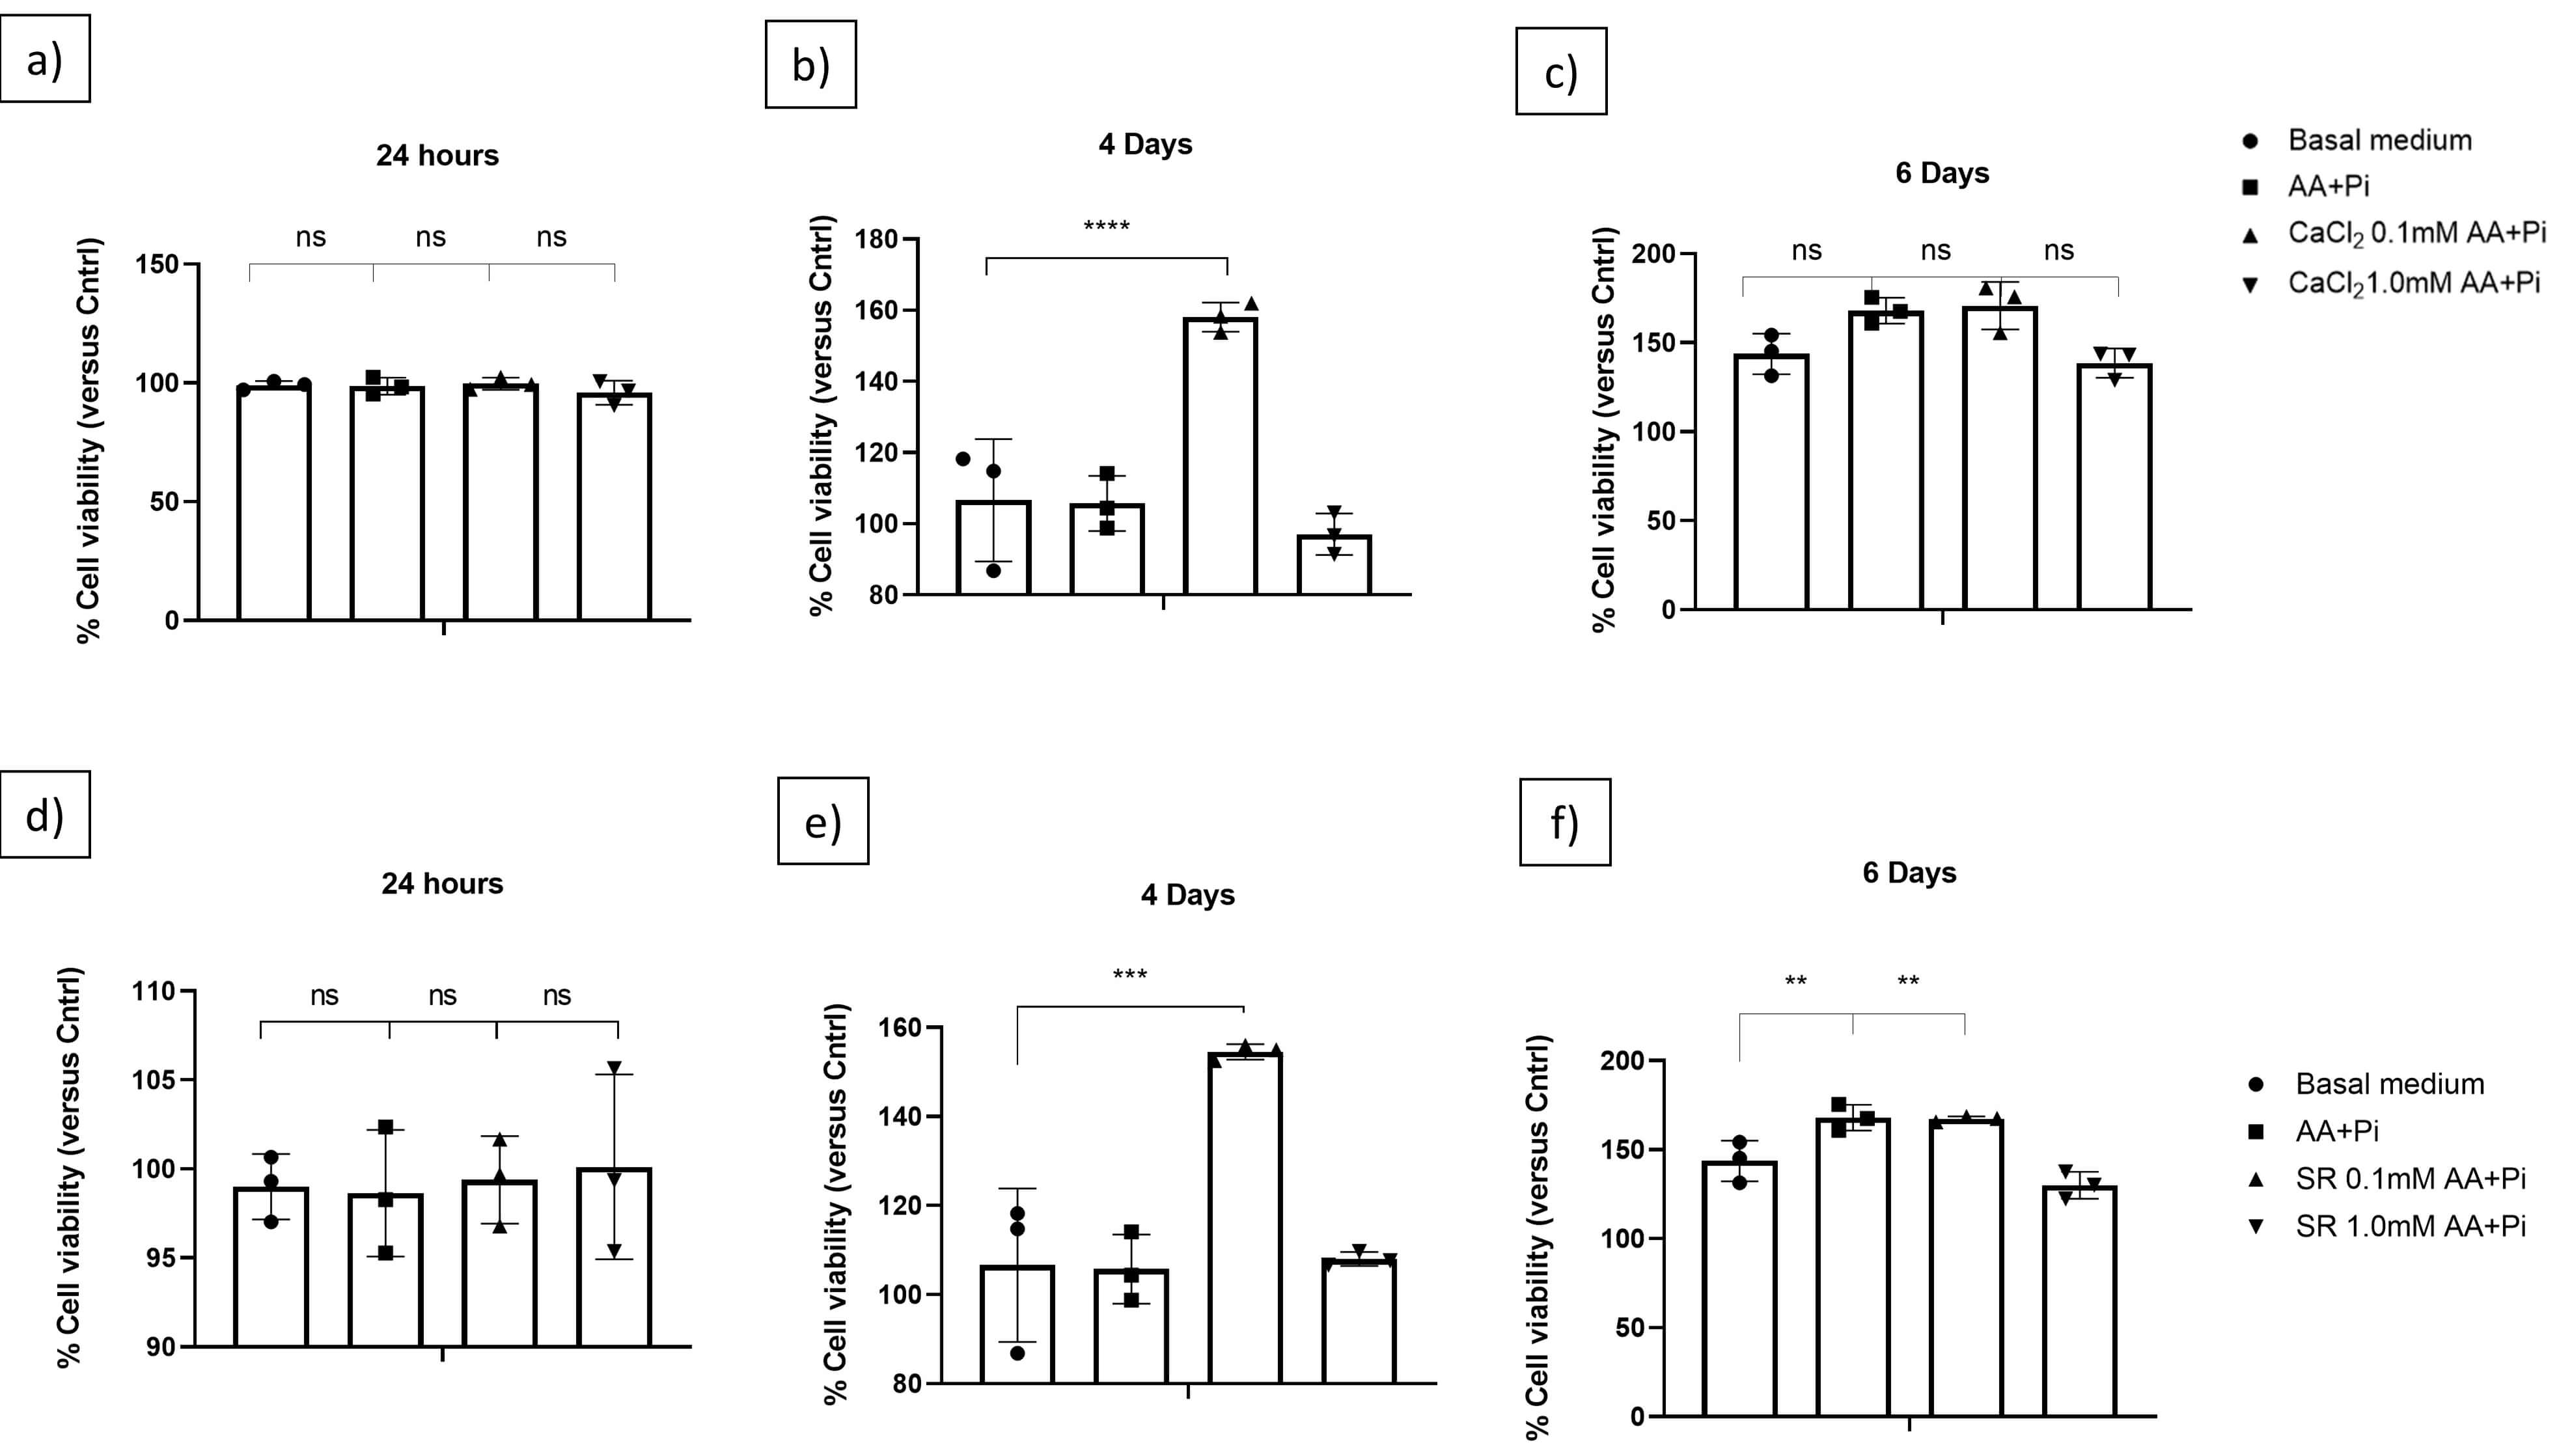 Fig. 1.
Effect of osteogenic medium (AA+P𝐢) containing Ca2+ or
Sr2+ on preodontoblast-derived 17IIA11 cell viability as compared to osteogenic
medium alone. (a–c): cytotoxic effect of basal medium, AA + Pi, CaCl2
0.1–1.0mM after 24 h, 4, and 6 days of treatment. (d–f): cytotoxic effect of
basal medium, AA+ Pi, SR 0.1–1.0mM after 24 h, 4, and 6 days of treatment.
Neither Ca2+, as CaCl2, nor Sr2+, as SR, exerts cytotoxic effects,
irrespective of their concentration (0.1 or 1.0 mM) or culture time (24 h, or 4 or
6 days). One-way ANOVA was performed for multiple statistical comparisons.
p values for CaCl2 ****p
We examined mineral deposition by Alizarin Red S and Von Kossa staining (Fig. 2). Given that alizarin red (Fig. 2, left column) stains Ca2+-rich mineral nodules, and because we used Ca2+ in some assays, we performed Von Kossa staining (Fig. 2, right column), a more precise histological technique when studying mineral deposition [92], to avoid false positives and to double-check mineral deposition. Von Kossa staining confirmed that 1.0 mM Sr2+ in osteogenic medium inhibited mineralization. Alizarin Red S and Von Kossa staining demonstrate accumulation of Ca and Pi, respectively, in the ECM after mineralization had been stimulated for four or six days. In a basal medium, Ca2+ (as CaCl2) or Sr2+ (as SR) alone did not induce mineralization (Supplementary Fig. 1), which was expected given that AA has been reported to participate in the collagen synthesis cascade and that Pi is required for HAp formation. Under osteogenic conditions, Ca2+ and 0.1 mM Sr2+ did not affect mineralization (Fig. 2). In contrast, 1.0 mM Sr2+ in osteogenic medium inhibited mineralization, contradicting previous reports [93, 94]. Because high Sr2+ concentrations in osteoblasts stimulate mineralization [95, 96], whether impaired mineralization is dose-dependent or whether mineral deposition depends on the cell line [94] remains to be investigated.
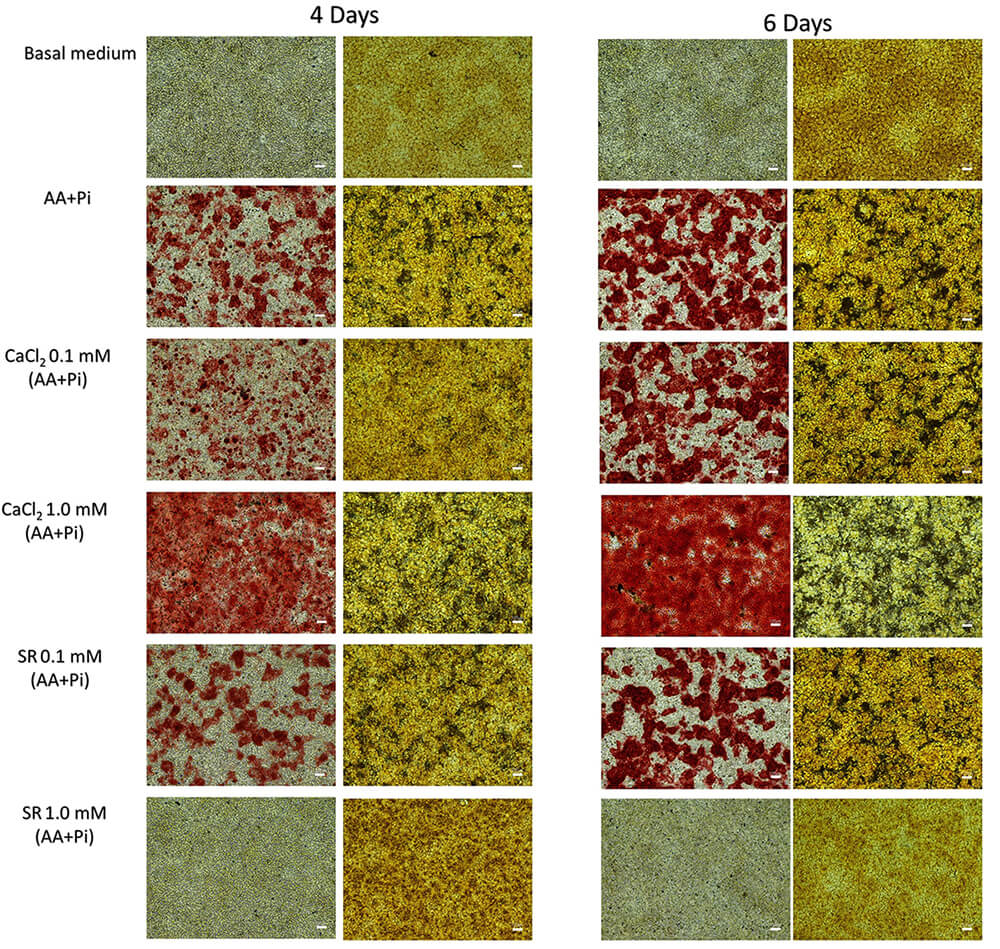 Fig. 2.
Ca2+ (as CaCl2) at 0.1 or 1.0 mM in osteogenic medium (AA+Pi), and Sr2+ (as SR) at 0.1 mM in osteogenic medium, support the mineralizing capacity of preodontoblas-derived 17IIA11 cells. In contrast, 1.0 mM Sr2+ in osteogenic medium impairs mineralization. Mineral deposition was evaluated using alizarin red S and von Kossa staining after four and six days of stimulation. The left and right columns show alizarin red S and von Kossa staining, respectively. All conditions were compared with osteogenic medium alone. Scale bar = 100 µm.
The initiation of mineral deposition within the ECM is contingent upon cellular responses triggered by extracellular signals [97, 98, 99, 100]. This response involves transmitting the signal from the cell membrane through an intracellular signaling cascade, ultimately resulting in a change in the gene expression program. The molecular response of mineralization-competent cells varies depending on the stimulus, but the outcome is the increased expression of genes involved in biomineralization. Studies have shown that stimulation of cells with Pi activates Erk1/2 kinases, while stimulation with Ca2+ activates the CREB pathway [53, 101]. Therefore, we investigated whether the effect of Sr2+ on mineralization is mediated by these molecules in 17IIA11cells (Fig. 3). We analyzed the levels of active CREB (pCREB) and pErk1/2 after stimulating 17IIA11 cells for 15 and 30 min to verify early and late responses, respectively.
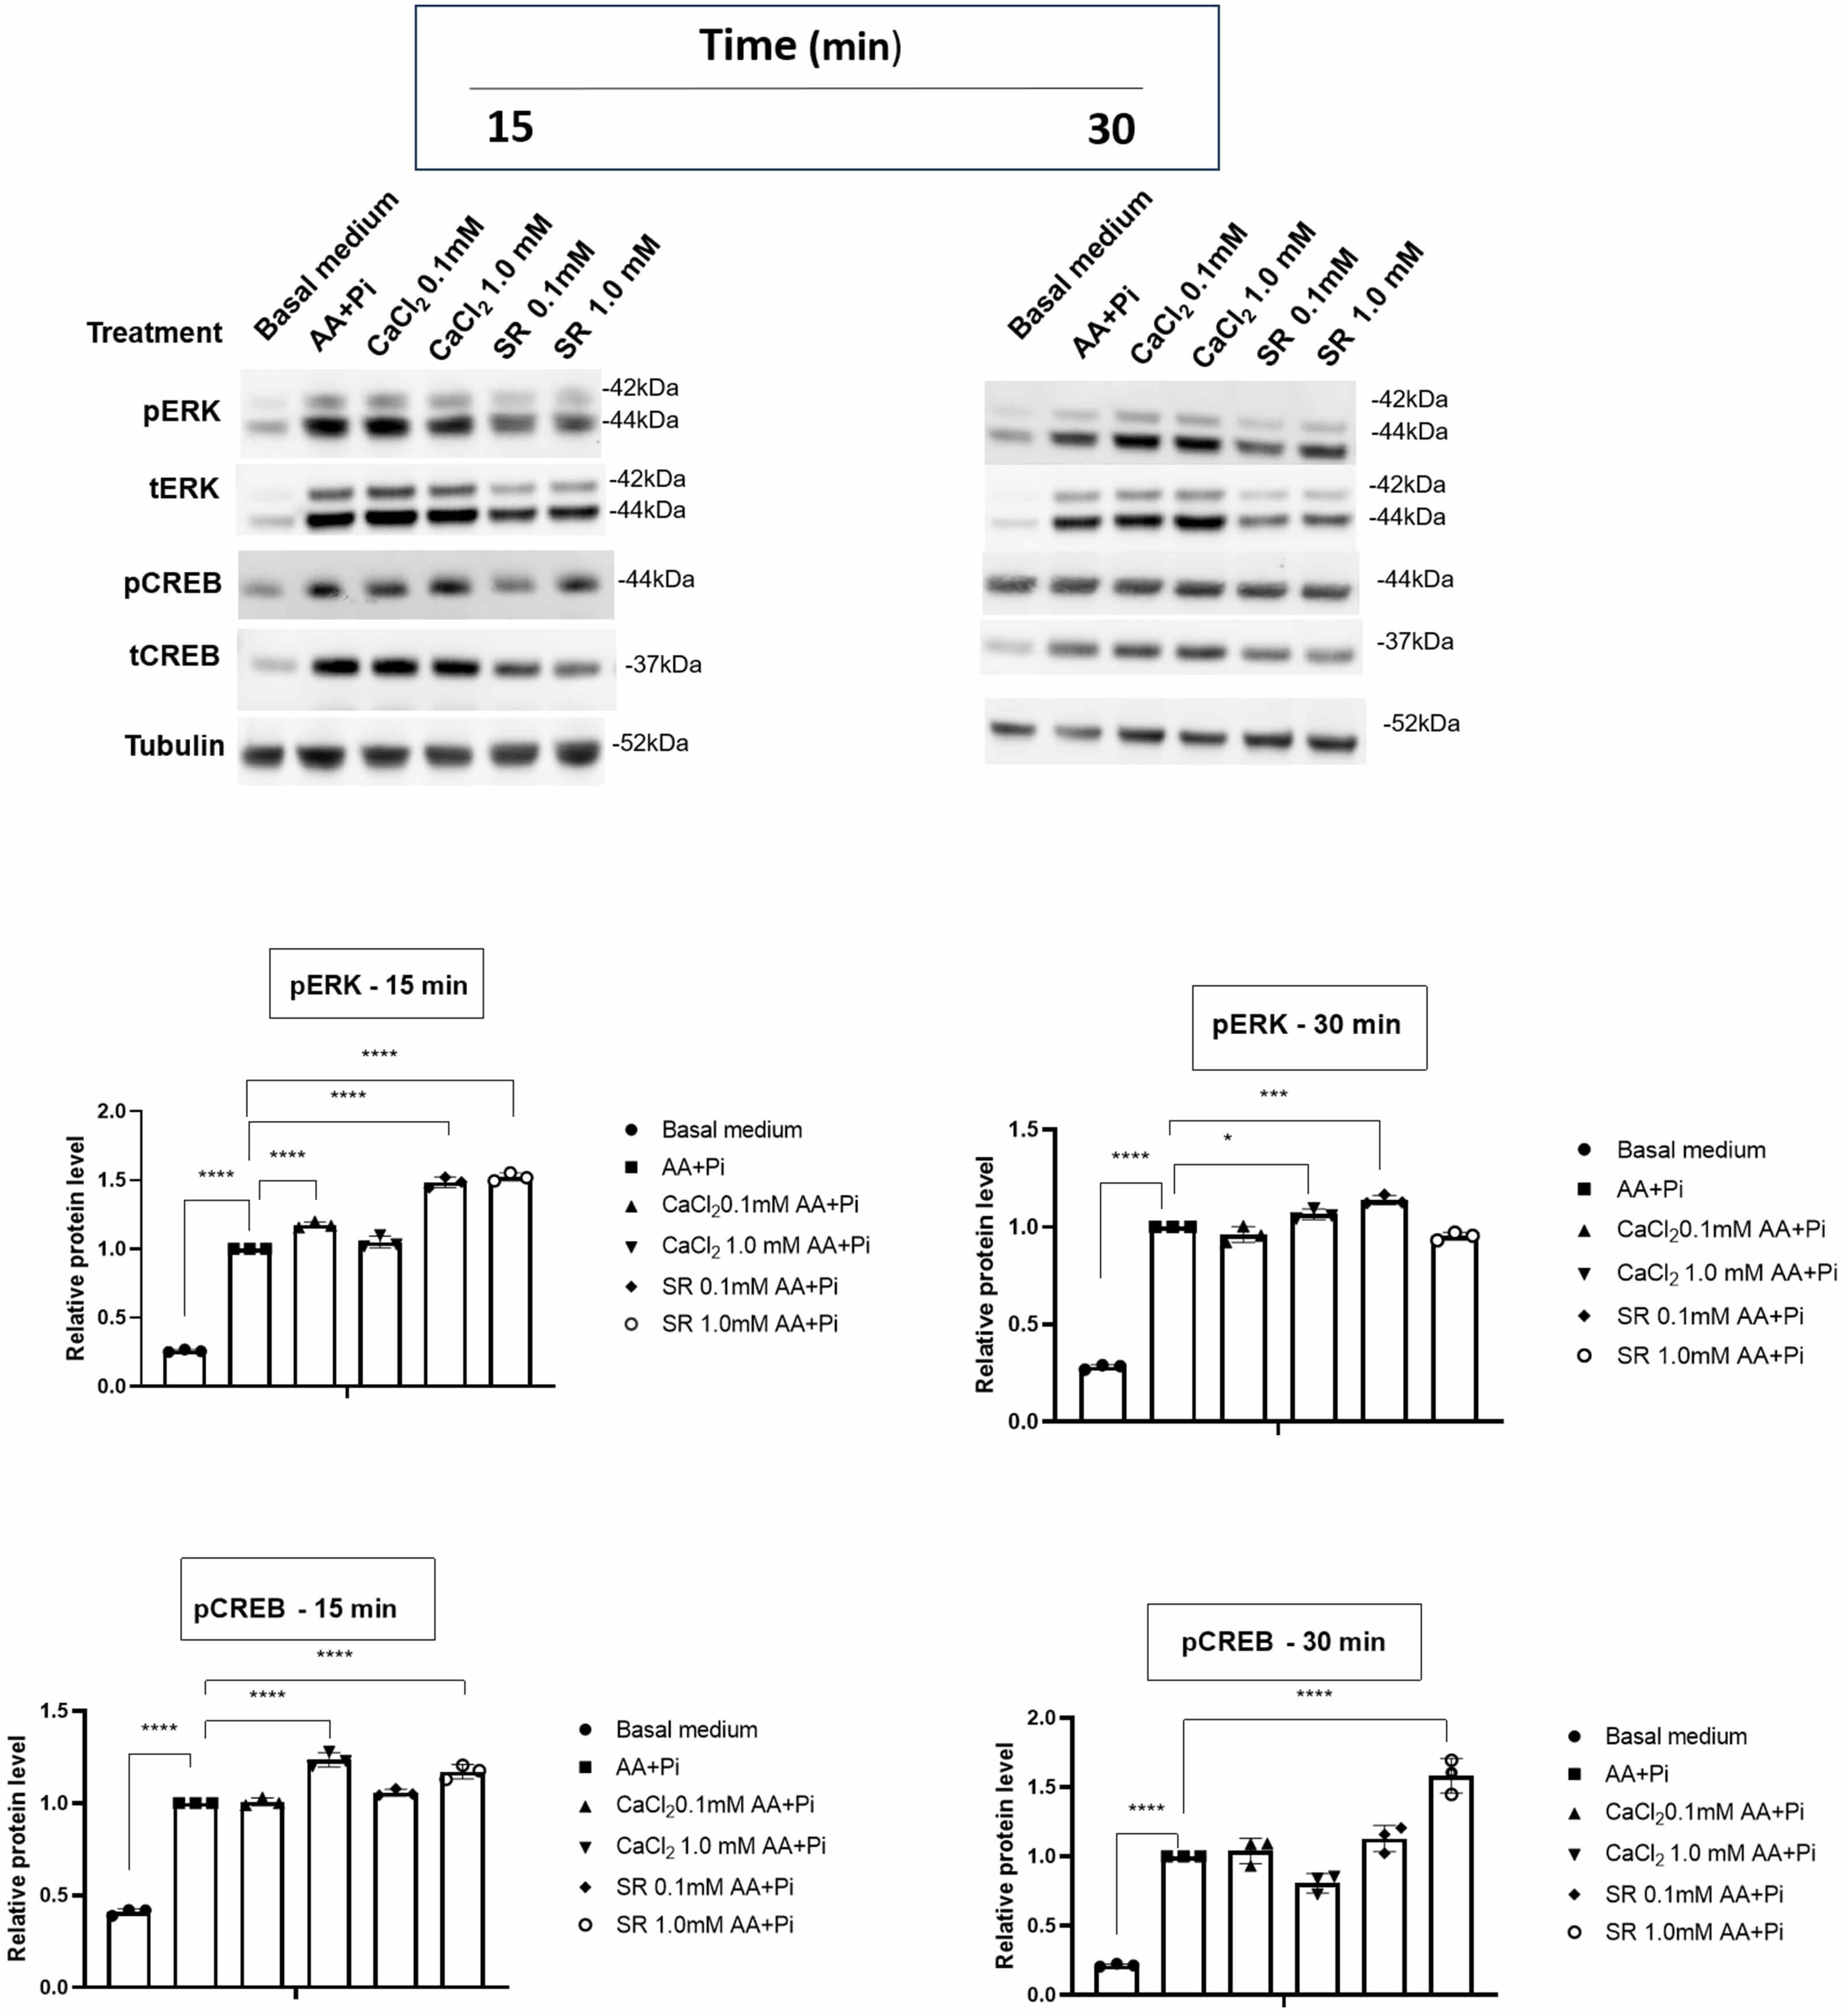 Fig. 3.
Ca2+- or Sr2+-activated ERK1/2 and CREB signaling
pathways in 17IIA11 cells. Activation of the ERK1/2 and CREB pathways was
assessed by analyzing protein phosphorylation after stimulation with different
concentrations of Ca2+ (as CaCl2) or Sr2+ (as SR) in osteogenic
medium (AA+Pi) for 15 or 30 minutes. All conditions were compared with osteogenic
medium alone. Multiple statistical comparisons were performed by one-way ANOVA.
p values for pERK 15 min ****p
Western blot results revealed that activation of Erk1/2 and CREB in 17IIA11 cells varied according to both the duration of stimulation and the concentration of Ca2+ or Sr2+. Erk1/2 is activated in two stages, namely the first and second waves (after approximately 15 min and 8 h, respectively). However, this time varies depending on cell type [102, 103]. In our system, these waves occurred at approximately 15 and 30 minutes, respectively (Fig. 3). During the early phase, Erk1/2 phosphorylation increased after exposure to 0.1 mM Ca2+ or to 0.1- or 1.0-mM Sr2+, suggesting that both ions can initiate early Erk1/2 activation, potentially in synergy with AA and Pi. However, clear differences emerged in the late response. Sr2+ at 0.1 mM continued to enhance Erk1/2 phosphorylation during the late phase, whereas Ca2+ did not. Thus, Sr2+, but not Ca2+, sensitized the Erk1/2 signaling pathway during prolonged stimulation.
CREB, a ubiquitous transcription factor involved in many cellular processes, is phosphorylated in response to diverse stimuli, including growth factors, steroids, cytokines, and Ca2+ [104]. While dysregulated CREB activity is linked to cancer [105, 106, 107], CREB signaling also contributes to bone development and homeostasis [108, 109]. In this study, 1.0 mM Sr2+ in osteogenic medium stimulated CREB phosphorylation during both early and late phases, whereas 1.0 mM Ca2+ induced CREB activation only during the early phase (Fig. 3). These findings mirror the behavior observed for Erk1/2, again indicating a broader temporal window of action for Sr2+ compared with Ca2+. Because CREB and Erk1/2 activation are modulated by CaSR [110, 111, 112], which responds to both Ca2+ and Sr2+ [51] the differential activation profiles likely reflect distinct interactions of each ion with CaSR-mediated pathways. Strontium has a larger atomic radius than calcium, which may result in a different activation profile of the CaSR. In addition, the possibility that cells respond to Sr2+ through mechanisms other than CaSR remains to be investigated. We recognize that to investigate the effect of Sr2+ independently of Ca2+ is challenging because (1) cytosolic calcium levels are high, and (2) the culture medium also contains calcium. Consequently, the observed results may reflect a synergistic interaction between Sr2+ and Ca2+ rather than the effect of Sr2+ alone. Similar to this work, recent studies highlighted the dose-dependent activation of the Erk1/2 pathway by Sr2+ [45, 113, 114]. Further studies must be able to exploit aspects of this area to mitigate the effect of calcium, but also should be careful, since calcium is a secondary messenger involved in many cellular events. Additionally, the use of inhibitors for Erk (U0126) and CREB (KG-501) would greatly help to study the interplay of both pathways to the MV release and biomineralization process.
Furthermore, triggering the Erk1/2 and CREB pathways influences the expression levels of mRNAs encoding key osteogenic markers [51, 115, 116]. Thus, we investigated whether the activation of these pathways influences the expression of Runx2, Sp7, collagen alpha 1, and TNAP, as well as Smpd3 and PHOSPHO1 phosphatases (Supplementary Figs. 2,3). Quantitative PCR revealed that neither Ca2+ nor Sr2+ produced substantial time-dependent changes in the mRNA levels of osteogenesis-related genes.
Chaudhary et al. (2016) [78] described that mineralization-supporting ions, in particular Pi, are stimulators of MVs release from mineralization-competent cells. At the molecular level, Pi mediates MV release by activating the Erk1/2 signaling pathway, which is followed by actin fiber reorganization. Also, the MV protein composition changes in the presence of ions compared to MVs in the presence of classic osteogenic factors alone. Bechkoff et al. (2008) [117] reported how Sr2+ affects MVs. Specifically, these authors demonstrated that Sr2+ negatively affects mineral growth induced by MVs. Whereas earlier work stimulated isolated MVs with SR before functional analysis, our experimental design differed in that we initially exposed 17IIA11 cells to 1.0 mM Ca2+ or to 0.1- or 1.0-mM Sr2+ in osteogenic medium for 24 h, and subsequently quantified MV production and activity. First, we investigated how Ca2+ or Sr2+ in osteogenic medium affected MV size and concentration by quantitative NTA (Supplementary Fig. 4). Fig. 4a,b represent MV release per cell and size distribution.
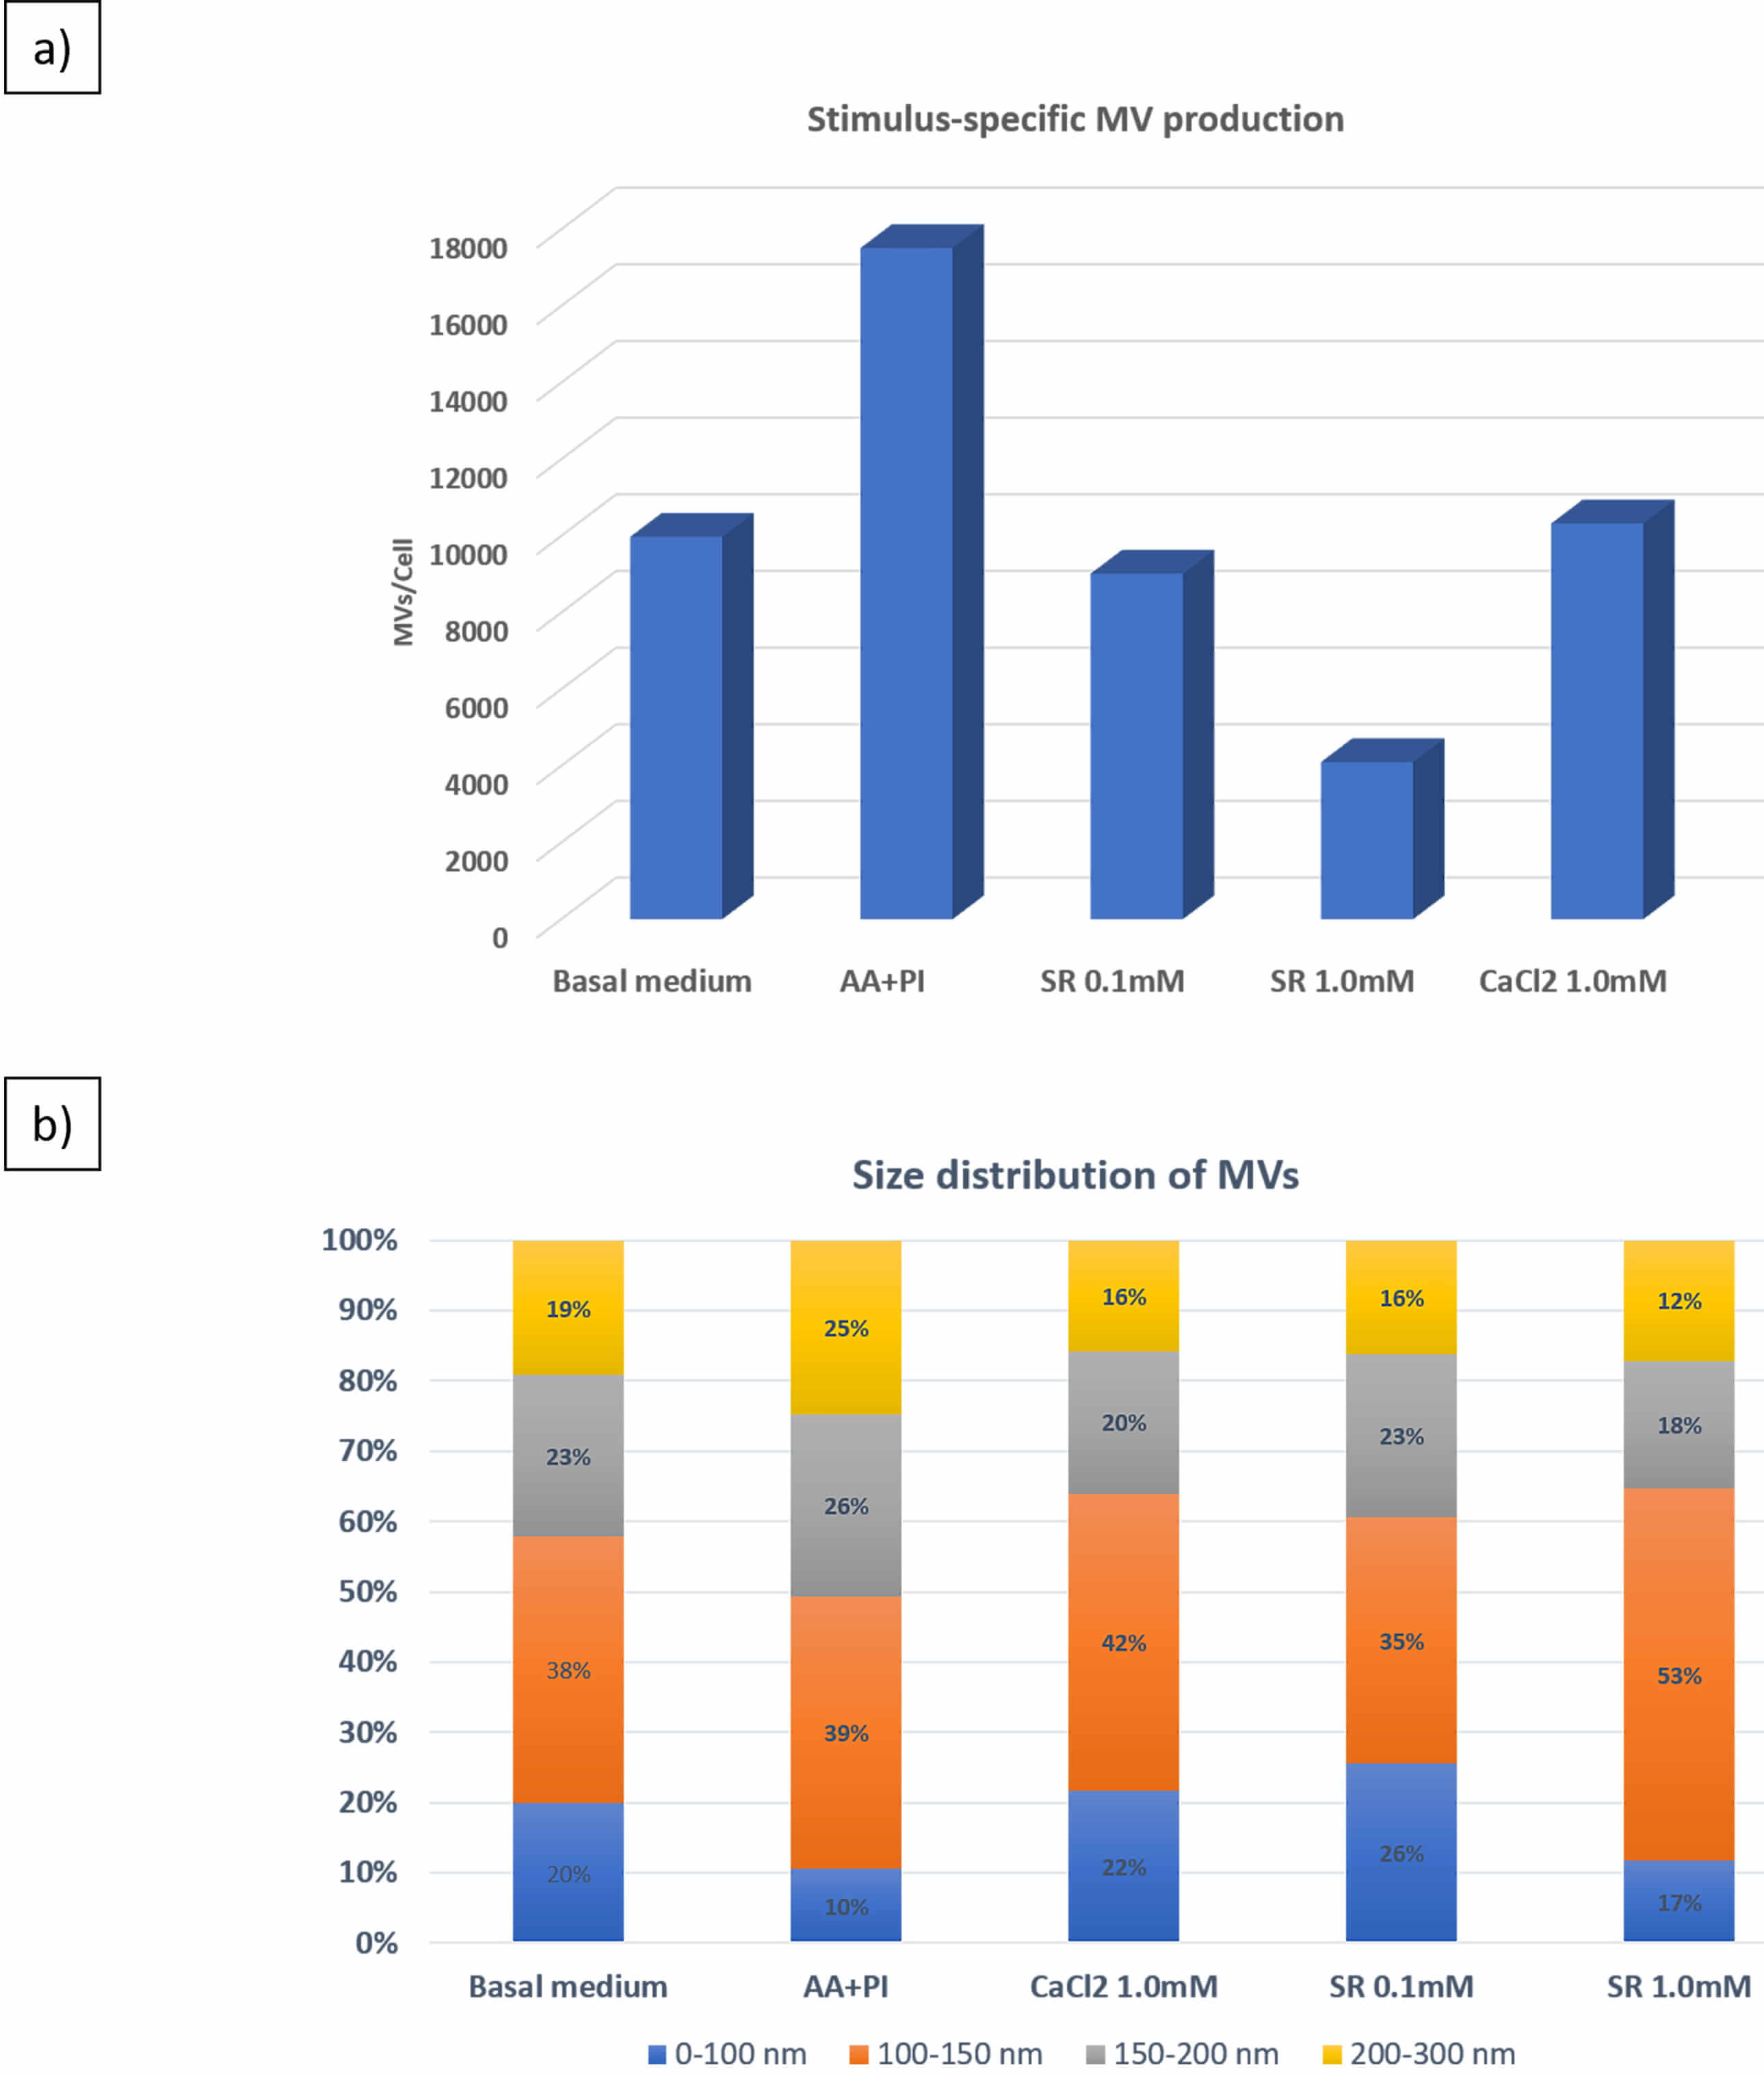 Fig. 4.
Compared to osteogenic medium (AA+P𝐢) alone, Ca2+, as CaCl2, or Sr2+, as SR, inhibits matrix vesicle (MV) secretion by 17IIA11 cells but sustains the average MV size (100–150 nm). (a) Based on NTA analysis, the total MVs released per cell were obtained. (b) Size distribution (%) analysis of MVs ranging from 0 to 300 nm. The number inside the bars represents the percentage of MVs associated with the size corresponding to the colors, as follows: 0–100 nm (blue), 100–150 nm (orange), 150–200 nm (grey), and 200–300 nm (yellow).
We firstly observed that 17IIA11 cells naturally secrete MVs under standard culture conditions, and this secretion is further enhanced when the cells are placed in osteogenic medium (Fig. 4). Addition of 1.0 mM Ca2+ or 0.1 or 1.0 mM Sr2+ to osteogenic medium decreased MV release per cell (Fig. 4a) but did not change MV size (Fig. 4b) compared to osteogenic medium alone. The MV diameters were mostly in the 100–150 nm range, followed by 150–200 nm, which is characteristic of MVs [1]. In osteogenic medium and 1.0 mM Ca2+ or Sr2+, the percentage of MVs with diameters ranging from 100 to 150 nm increased (Fig. 4b).
The amount of MVs released by 17IIA11 cells is not directly correlated with the mineralization function—MV function is dictated by MV molecular composition. Thus, to assess the mineralization potential of MVs released from 17IIA11 cells under different conditions, we measured the activity of TNAP (Fig. 5a, Ref. [28, 118]), a critical enzyme for biomineralization [119, 120]. As anticipated, TNAP activity was elevated in osteogenic medium relative to standard culture conditions. However, when Ca2+ or Sr2+ was added—regardless of the concentration tested, TNAP activity was markedly reduced compared with cells maintained in standard growth medium (Fig. 5a). Despite the lower TNAP activity and reduced MV release, the addition of 0.1 mM Sr2+ to the osteogenic medium enhanced mineral precipitation (Fig. 5b) as evidenced by increased turbidity at 340 nm [28, 79]. These findings indicate that increased MV abundance or TNAP activity does not necessarily correlate with greater mineralization capacity. In contrast, mineral propagation efficiency was lower in basal or osteogenic medium alone, even though both TNAP activity and MV release were higher under these conditions. Moreover, supplementation with 1.0 mM Ca2+ or Sr2+ in the osteogenic medium produced a more efficient mineralization response than basal medium or osteogenic medium alone (Fig. 5b).
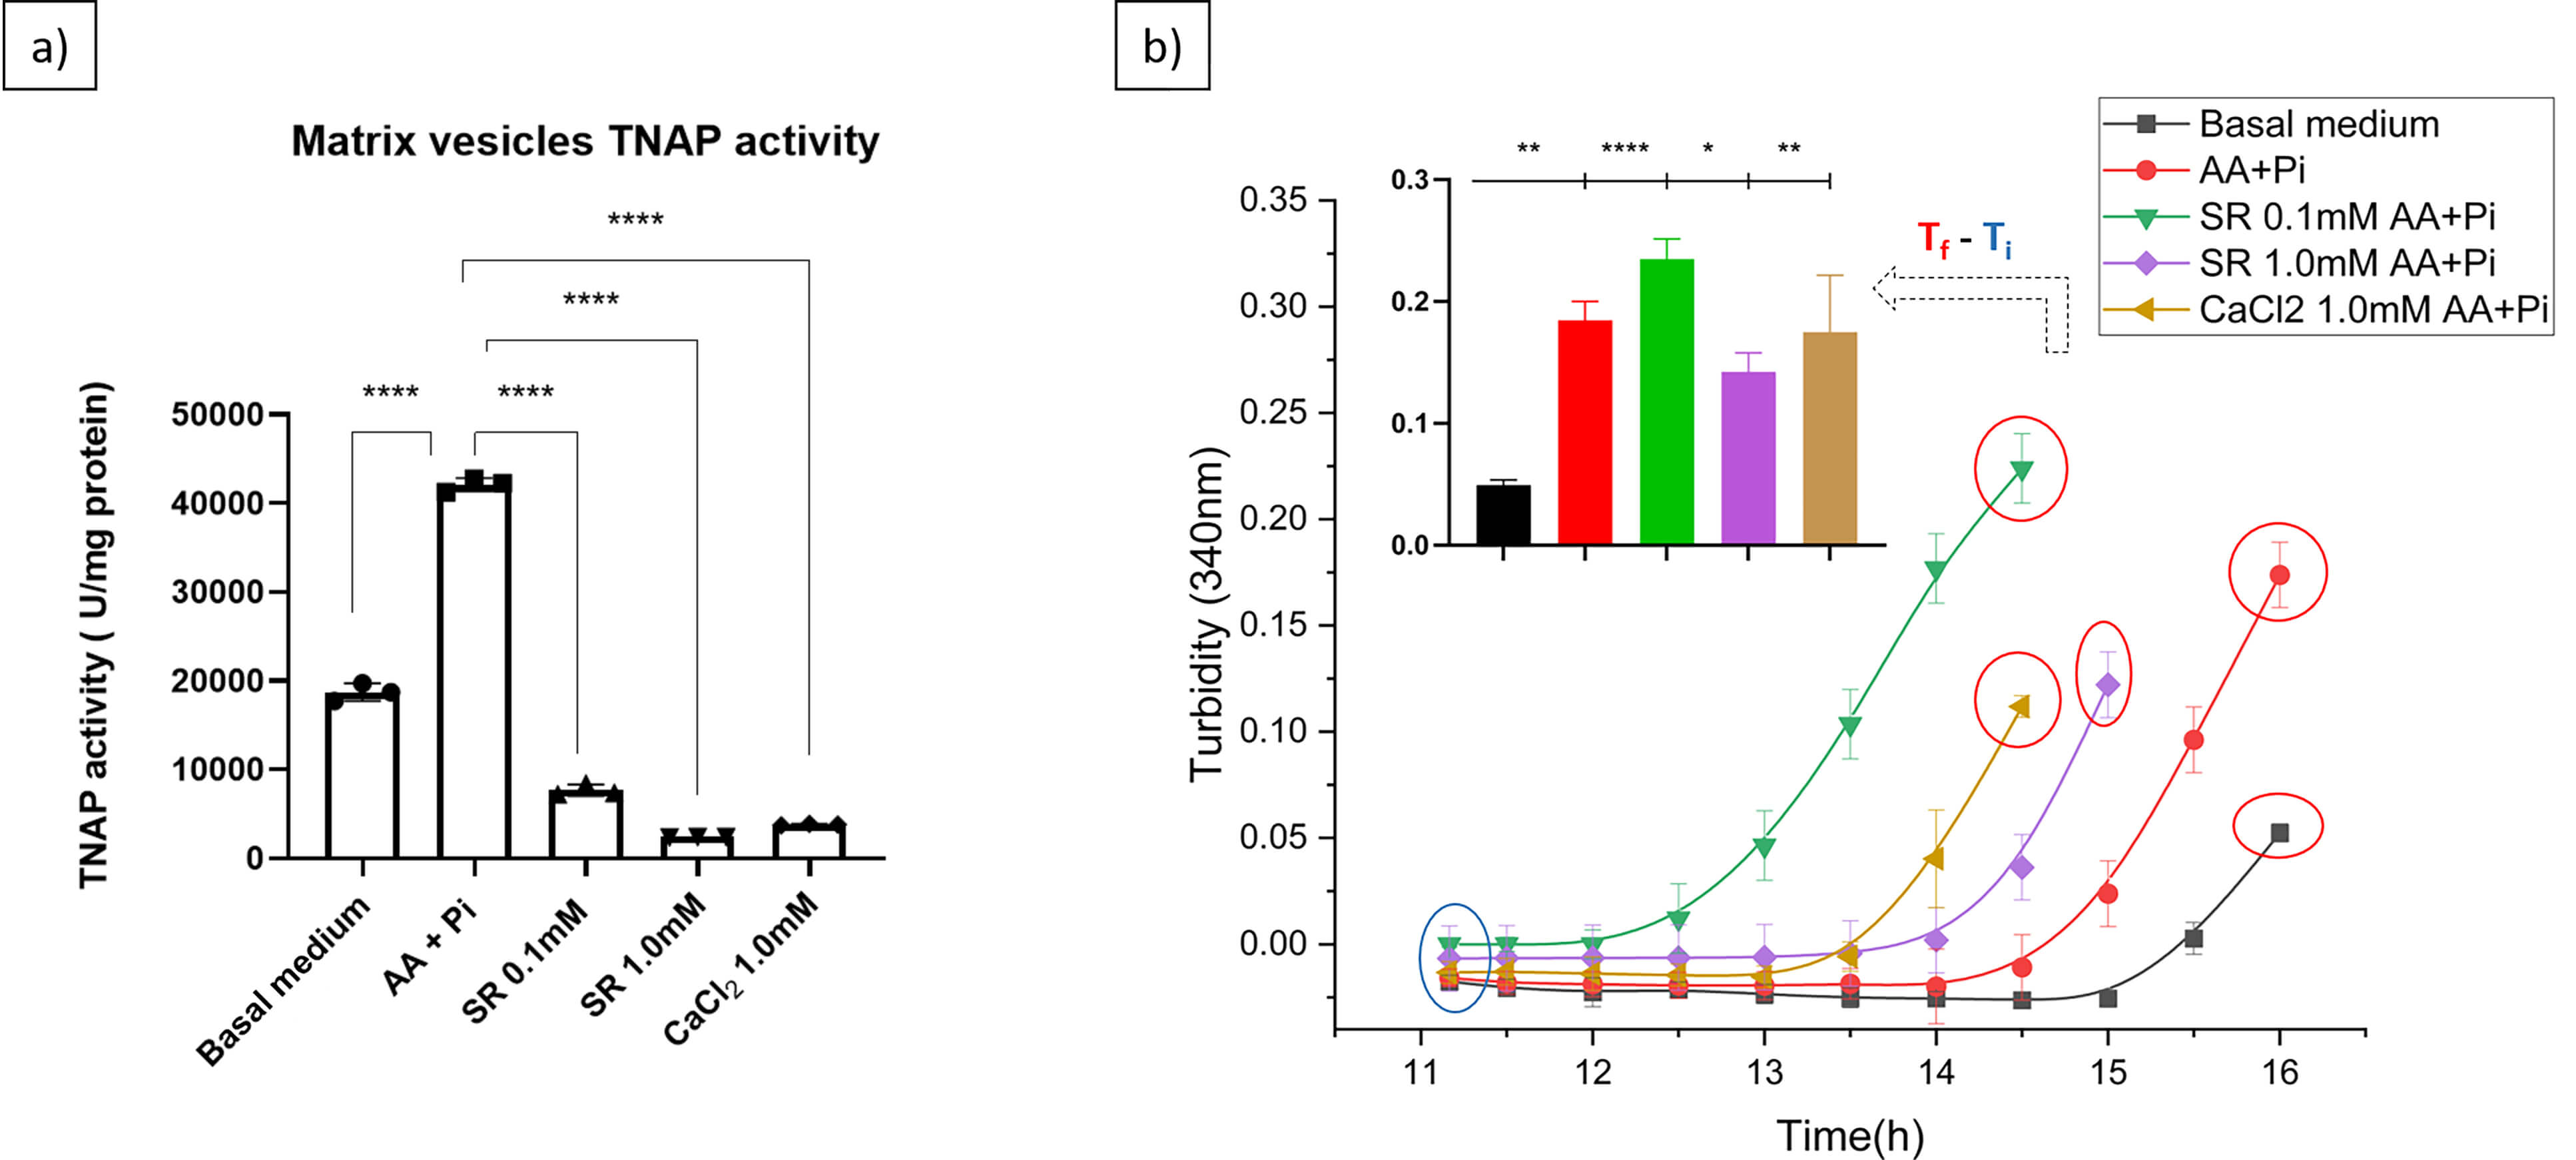 Fig. 5.
Tissue non-specific alkaline phosphatase (TNAP) activity
measured in MVs isolated from 17IIA11 cells increases in osteogenic medium
(AA+P𝐢) compared to basal medium or Ca2+, as CaCl2, or Sr2+,
as SR. (a) TNAP activity in MVs isolated from 17IIA1 cells was assessed as
described previously [118]. Multiple statistical comparisons were performed by
one-way ANOVA, p values ****p
ATR-FTIR spectroscopy was used to analyze the chemical composition of the minerals formed in the presence of MVs incubated in synthetic cartilage lymph (SCL) buffer containing ATP, a natural substrate for TNAP (Fig. 6).
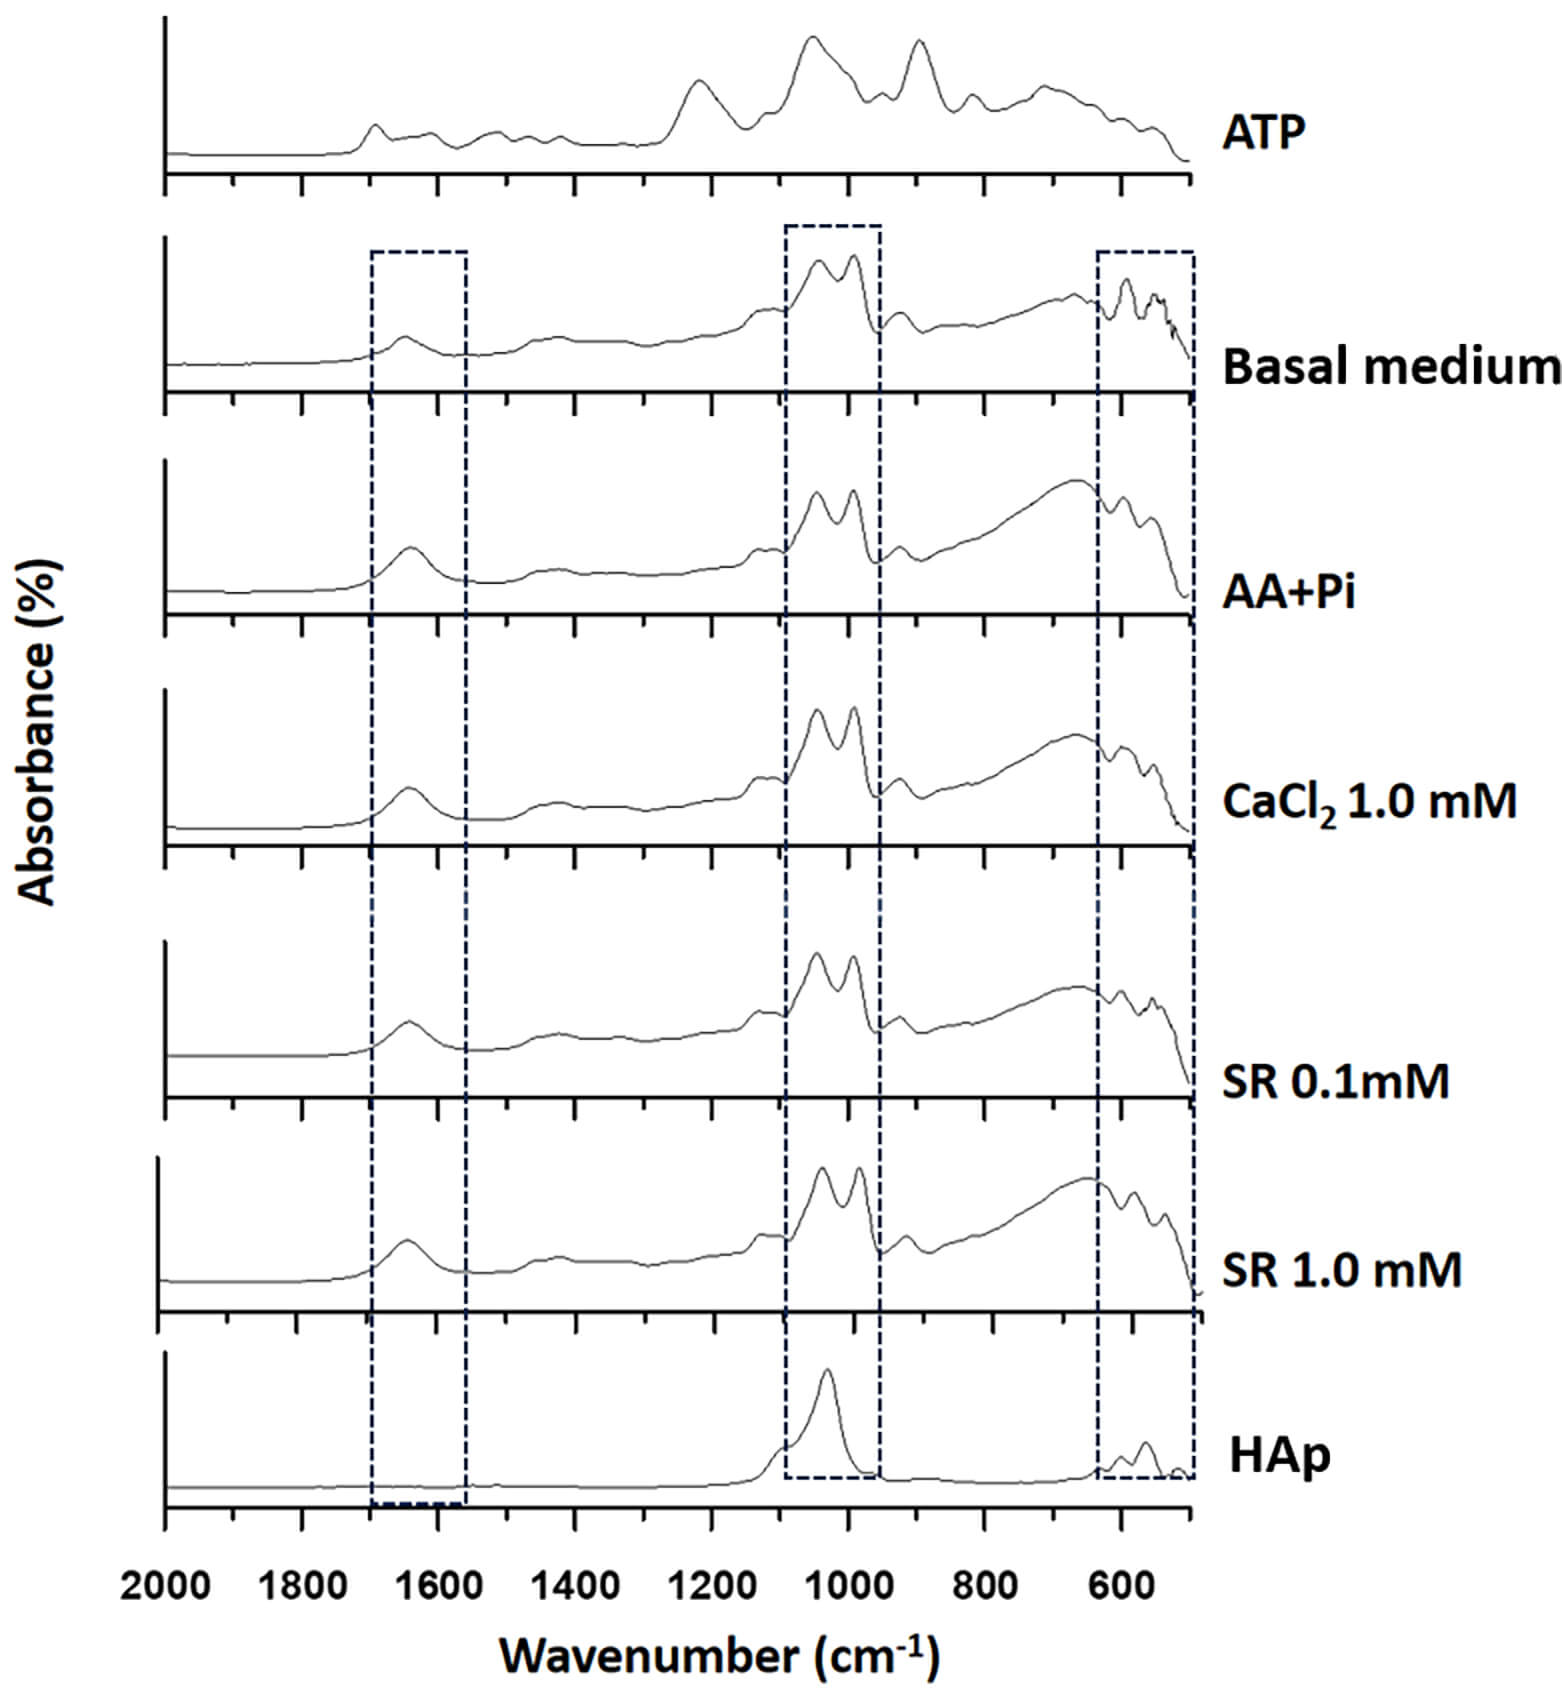 Fig. 6.
Mineral composition assessed by ATR-FTIR spectra, which display the characteristic peaks of hydroxyapatite (HAp) (~1047 cm-1x’). ATR-FITR described the spectra for MVs extracted from basal medium; osteogenic medium (AA+Pi); 0.1 or 1.0 mM Ca2+, as CaCl2; or 0.1 or 1.0 mM Sr2+, as SR, in osteogenic medium. For comparison, the ATR-FTIR spectra of HAp and ATP are presented. The dashed lines represent the peaks used to analyze the mineral phase. Data are reported as the mean of three independent ATR-FTIR spectra.
The ATR-FTIR spectra showed that the minerals obtained after incubating MVs in SCL exhibited the characteristic vibrational peaks of HAp [121]. The intense peaks at 1040 and 940 cm-1 are related to asymmetric stretching of the PO43- group and HPO42-, a precursor of apatite. Comparison with the spectrum of ATP clearly shows that this substrate was completely consumed. Indeed, the spectrum of the resulting minerals did not display the typical peaks of ATP.
Western blot helped to analyze the presence of lysosomal membrane glycoprotein (Lamp1), AnxV, and TNAP, which are proteins usually found in mineralization-competent MVs [78] (Fig. 7).
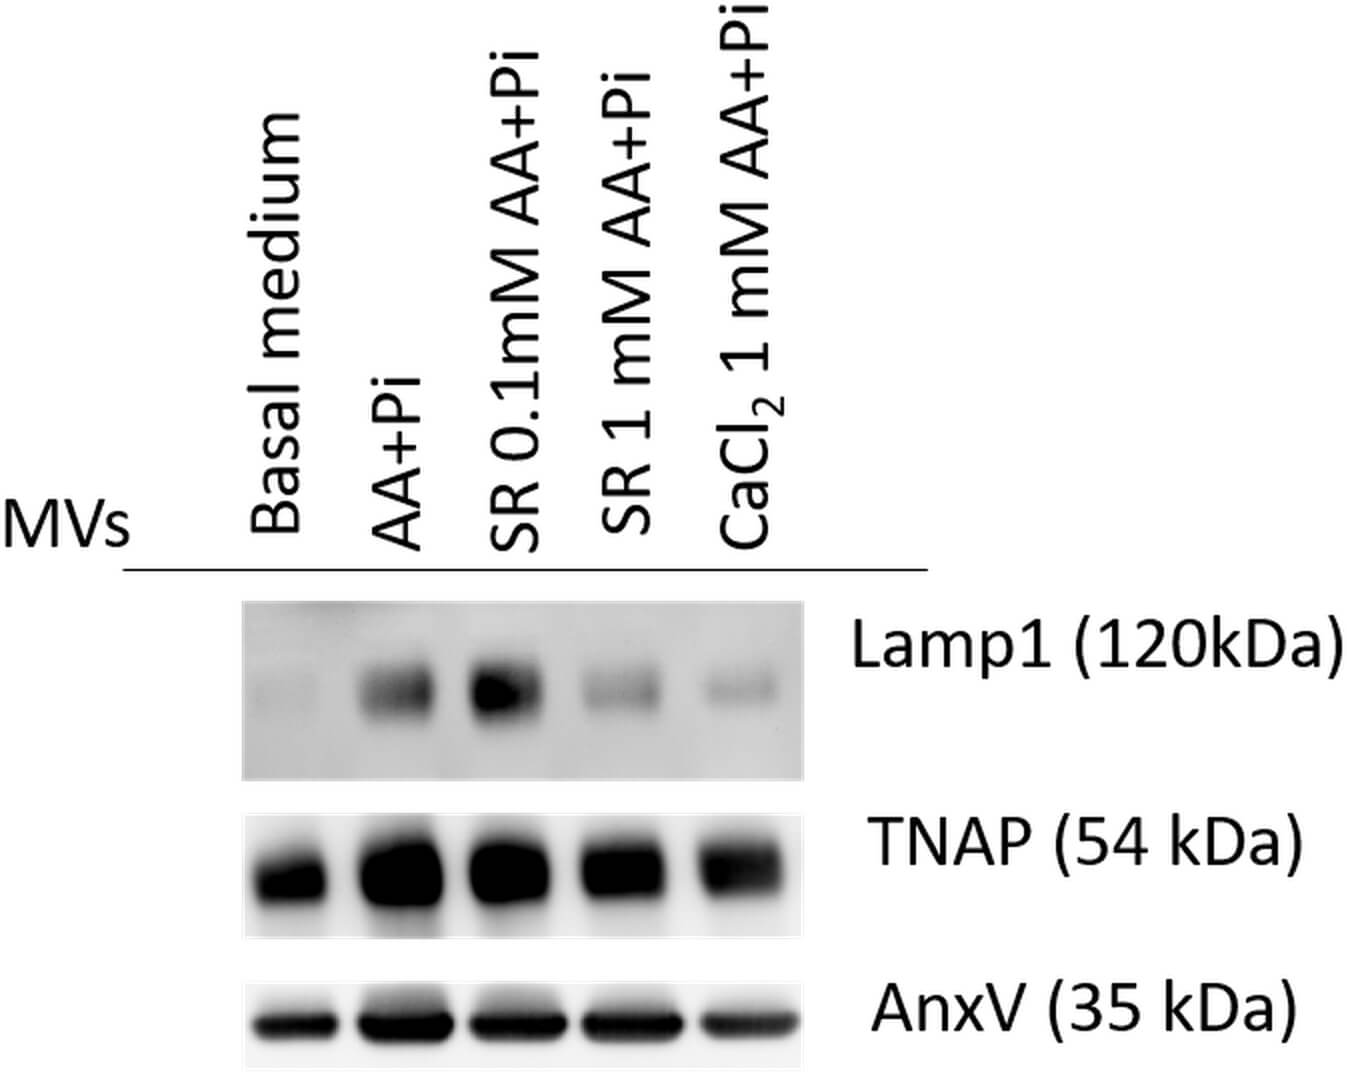 Fig. 7.
Western blot analysis of mineralization-supporting proteins in MVs. MVs derived from 17IIA11 cells exposed to basal medium, osteogenic medium, Ca2+, as CaCl2 or Sr2+, as SR, are enriched in proteins that support mineralization: TNAP and AnxV, and the cytosolic and cell organelle protein Lamp1. Lysosomal marker, Lamp1, is poorly expressed in 17IIA11 cells exposed to basal medium or Sr2+, as SR, in osteogenic medium.
TNAP participates in Pi formation, and AnxV has been associated with Ca2+ transport from the extracellular environment to the MV lumen [15, 122]. The role played by these proteins in biomineralization has also been studied [123, 124]. In this study, we detected these proteins in 17IIA11 cells maintained in basal medium and identified only a single TNAP isoform. This contrasts with previous findings showing that MVs isolated from 17IIA11 cells cultured in osteogenic medium contain at least three distinct TNAP isoforms [78]. Regarding Lamp1, a protein typically detected in MVs derived from 17IIA11 cells, its expression was low in cells cultured either in basal medium or in osteogenic medium supplemented with Sr2+ (0.1 or 1.0 mM). The role played by Lamp1 in biomineralization must be further investigated, but it has been described to participate in pH regulation in lysosomes [125]. Given that pH affects HAp synthesis and deposition [126], Lamp1 may indirectly affect biomineralization.
Afterward, we evaluated MVs’ morphology by AFM and TEM (Fig. 8) and analyzed their surface charge by zeta potential (Table 1). AFM is a powerful technique to investigate particle structure at the nanometric scale based on high-resolution images [127]. AFM-based techniques also enable qualitative assessment of differences in sample viscoelasticity through the interaction between the probe tip and the sample surface. In addition, AFM imaging provides quantitative parameters such as surface roughness, mean diameter, and mean height. This approach has previously been used to characterize MVs [128, 129, 130].
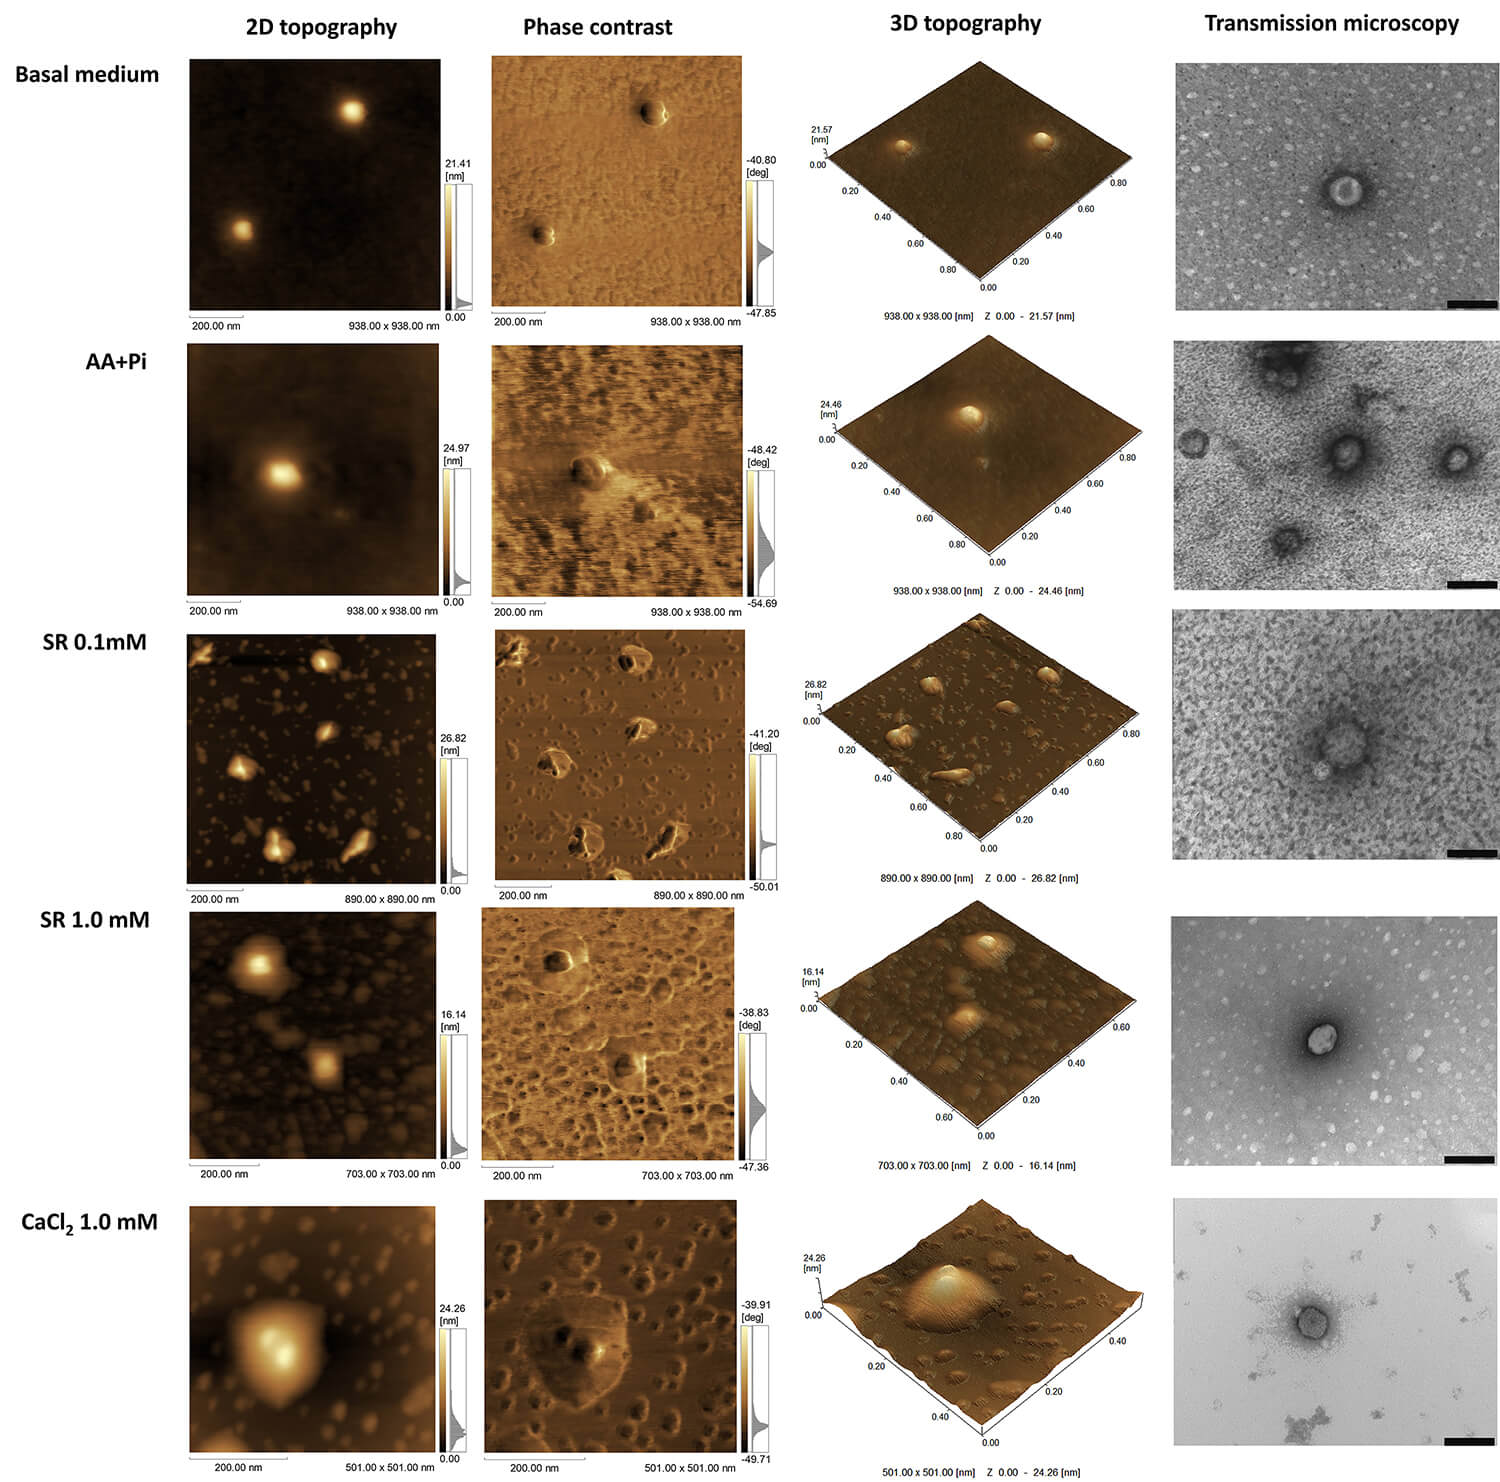 Fig. 8.
Atomic force microscopy (AFM) and transmission electron microscopy (TEM) reveal a change in the membrane fluidity of MVs. From left to right: 2D topography, phase contrast, 3D topography, and TEM images. For each sample, 100 MVs were analyzed. TEM scale bar (black) corresponds to 200 nm.
| Vesicles | Medium diameter AFM (nm) | Medium height AFM (nm) | Protrusion height (nm)* | Mean roughness | Zeta potential (mV) |
| Basal medium | 101.1 |
8.38 |
- | 0.84 |
–25.6 |
| AA+Pi | 164.3 |
8.62 |
- | 0.90 |
–22.2 |
| SR 0.1 mM | 175.0 |
22.71 |
14.91 | 1.13 |
–23.5 |
| SR 1.0 mM | 130.1 |
3.55 |
7.30 | 0.64 |
–21.9 |
| CaCl2 1.0 mM | 158.41 |
6.50 |
5.88 | 0.68 |
–20.4 |
AFM helped to study the MV medium diameter (nm), medium height, presence or
absence of protrusion, and ratio roughness. Zeta potential analysis (mV) was used
to measure the overall MV surface charge. The presence of protrusion suggests a
change in the MV membrane viscoelastic properties, which is often associated with
nucleation. The ratio roughness regards the MV membrane fluidity. One-way ANOVA
was used to determine the statistically significant differences for each group
(****p
MVs derived from 17IIA11 cells exposed to Sr2+ (0.1 or 1.0 mM) or Ca2+ (1.0 mM) in osteogenic medium displayed structural alterations in their outer membrane. These were evidenced by the presence of protrusions (darker regions) with distinct viscoelastic properties, as revealed by variations in the phase-contrast imaging (Fig. 8). Such protrusions could barely be identified in the MVs exposed to basal medium or osteogenic medium alone. In addition, we calculated a series of parameters from AFM data as described in Table 1.
The MVs exhibited an overall diameter of approximately 100–200 nm, consistent with the NTA measurements (Fig. 4b). The average height of the surface protrusions varied depending on the stimulus. Notably, MVs isolated from 17IIA11 cells stimulated with 0.1 mM Sr2+ in osteogenic medium displayed a greater average height and more prominent protrusions (14.91 nm). Such elevated protrusions correspond to a wider range of phase shifts in MV topology, indicating increased protein and lipid complexity, as previously reported [130].
The lipid composition modulates the catalytic activity of enzymes incorporated at the MV bilayer, directly affecting the MV biomineralization ability [79]. Our AFM data pointed to altered viscoelastic properties of the MV membrane, and a change in the MV mineralization profile (Fig. 5b). Therefore, we evaluated the overall lipid content in the MVs by lipidomic analysis. We started by analyzing the principal component analysis (PCA) (Fig. 9a), which demonstrated heterogeneity among the MV groups. The analysis described 51% of the total variance, which included 42.8% of principal component 1 and 8.2% of principal component 2, whereby component 1 was the major component of discrimination.
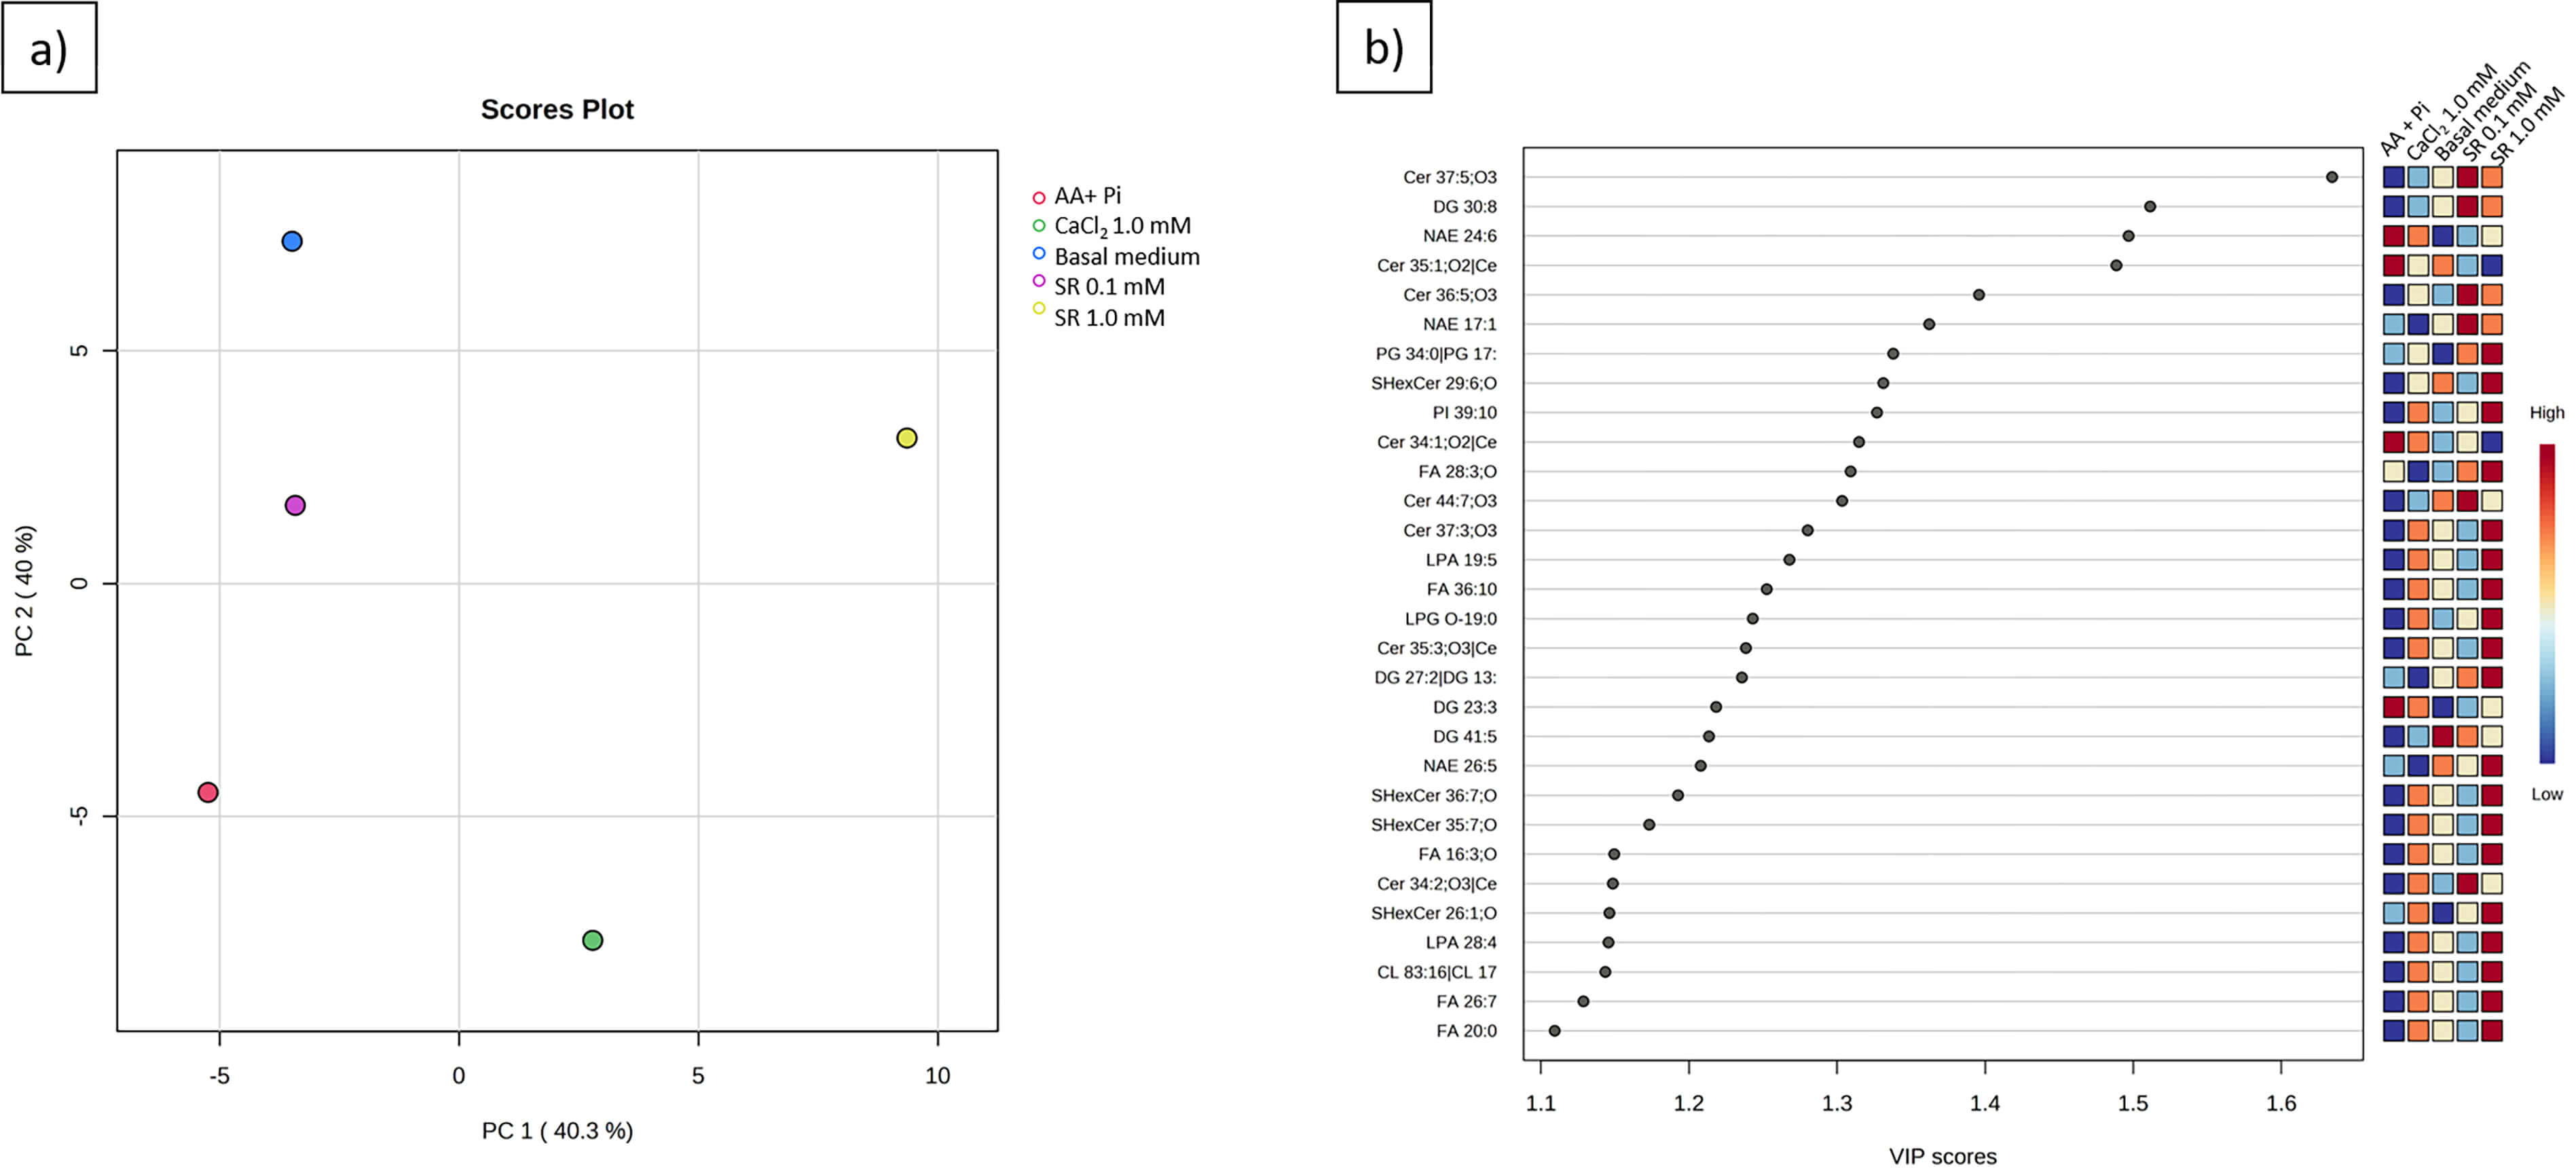 Fig. 9.
MVs derived from 17IIA11 cells stimulated with basal medium, osteogenic medium (AA+P𝐢); Ca2+, as CaCl2, in osteogenic medium, or Sr2+, as SR were subjected to lipidomic analysis. (a) The lipidomic principal component analysis score plot (PCA) reveals heterogeneity between the stimulations, which indicates diversity in the lipid profile of each group. (b) Variable importance in projection (VIP) plot analysis of 30 lipids demonstrates that MVs derived from 17IIA11 cells stimulated with Sr2+, as SR, in osteogenic medium are highly enriched in Cer. The 30 most differently regulated lipids vary among the groups, and their expression is indicated in the color panel. Highly expressed (dark red) and mildly expressed (dark blue) lipids.
We then selected the 30 most differentially regulated lipids among the MVs, as shown in the variable importance in projection (VIP) plot (Fig. 9b). Several lipid species, including N-acylethanolamines (NAE), phosphatidylinositols (PI), FA, ceramides (Cer), lysophosphatidic acids (LPA), sulfatide hexosylceramides (SHexCer), diacylglycerols (DGs), and lysophosphatidylglycerols (LPG), were modulated. The heat map in Fig. 10 illustrates the global lipid profile extracted from each MV sample.
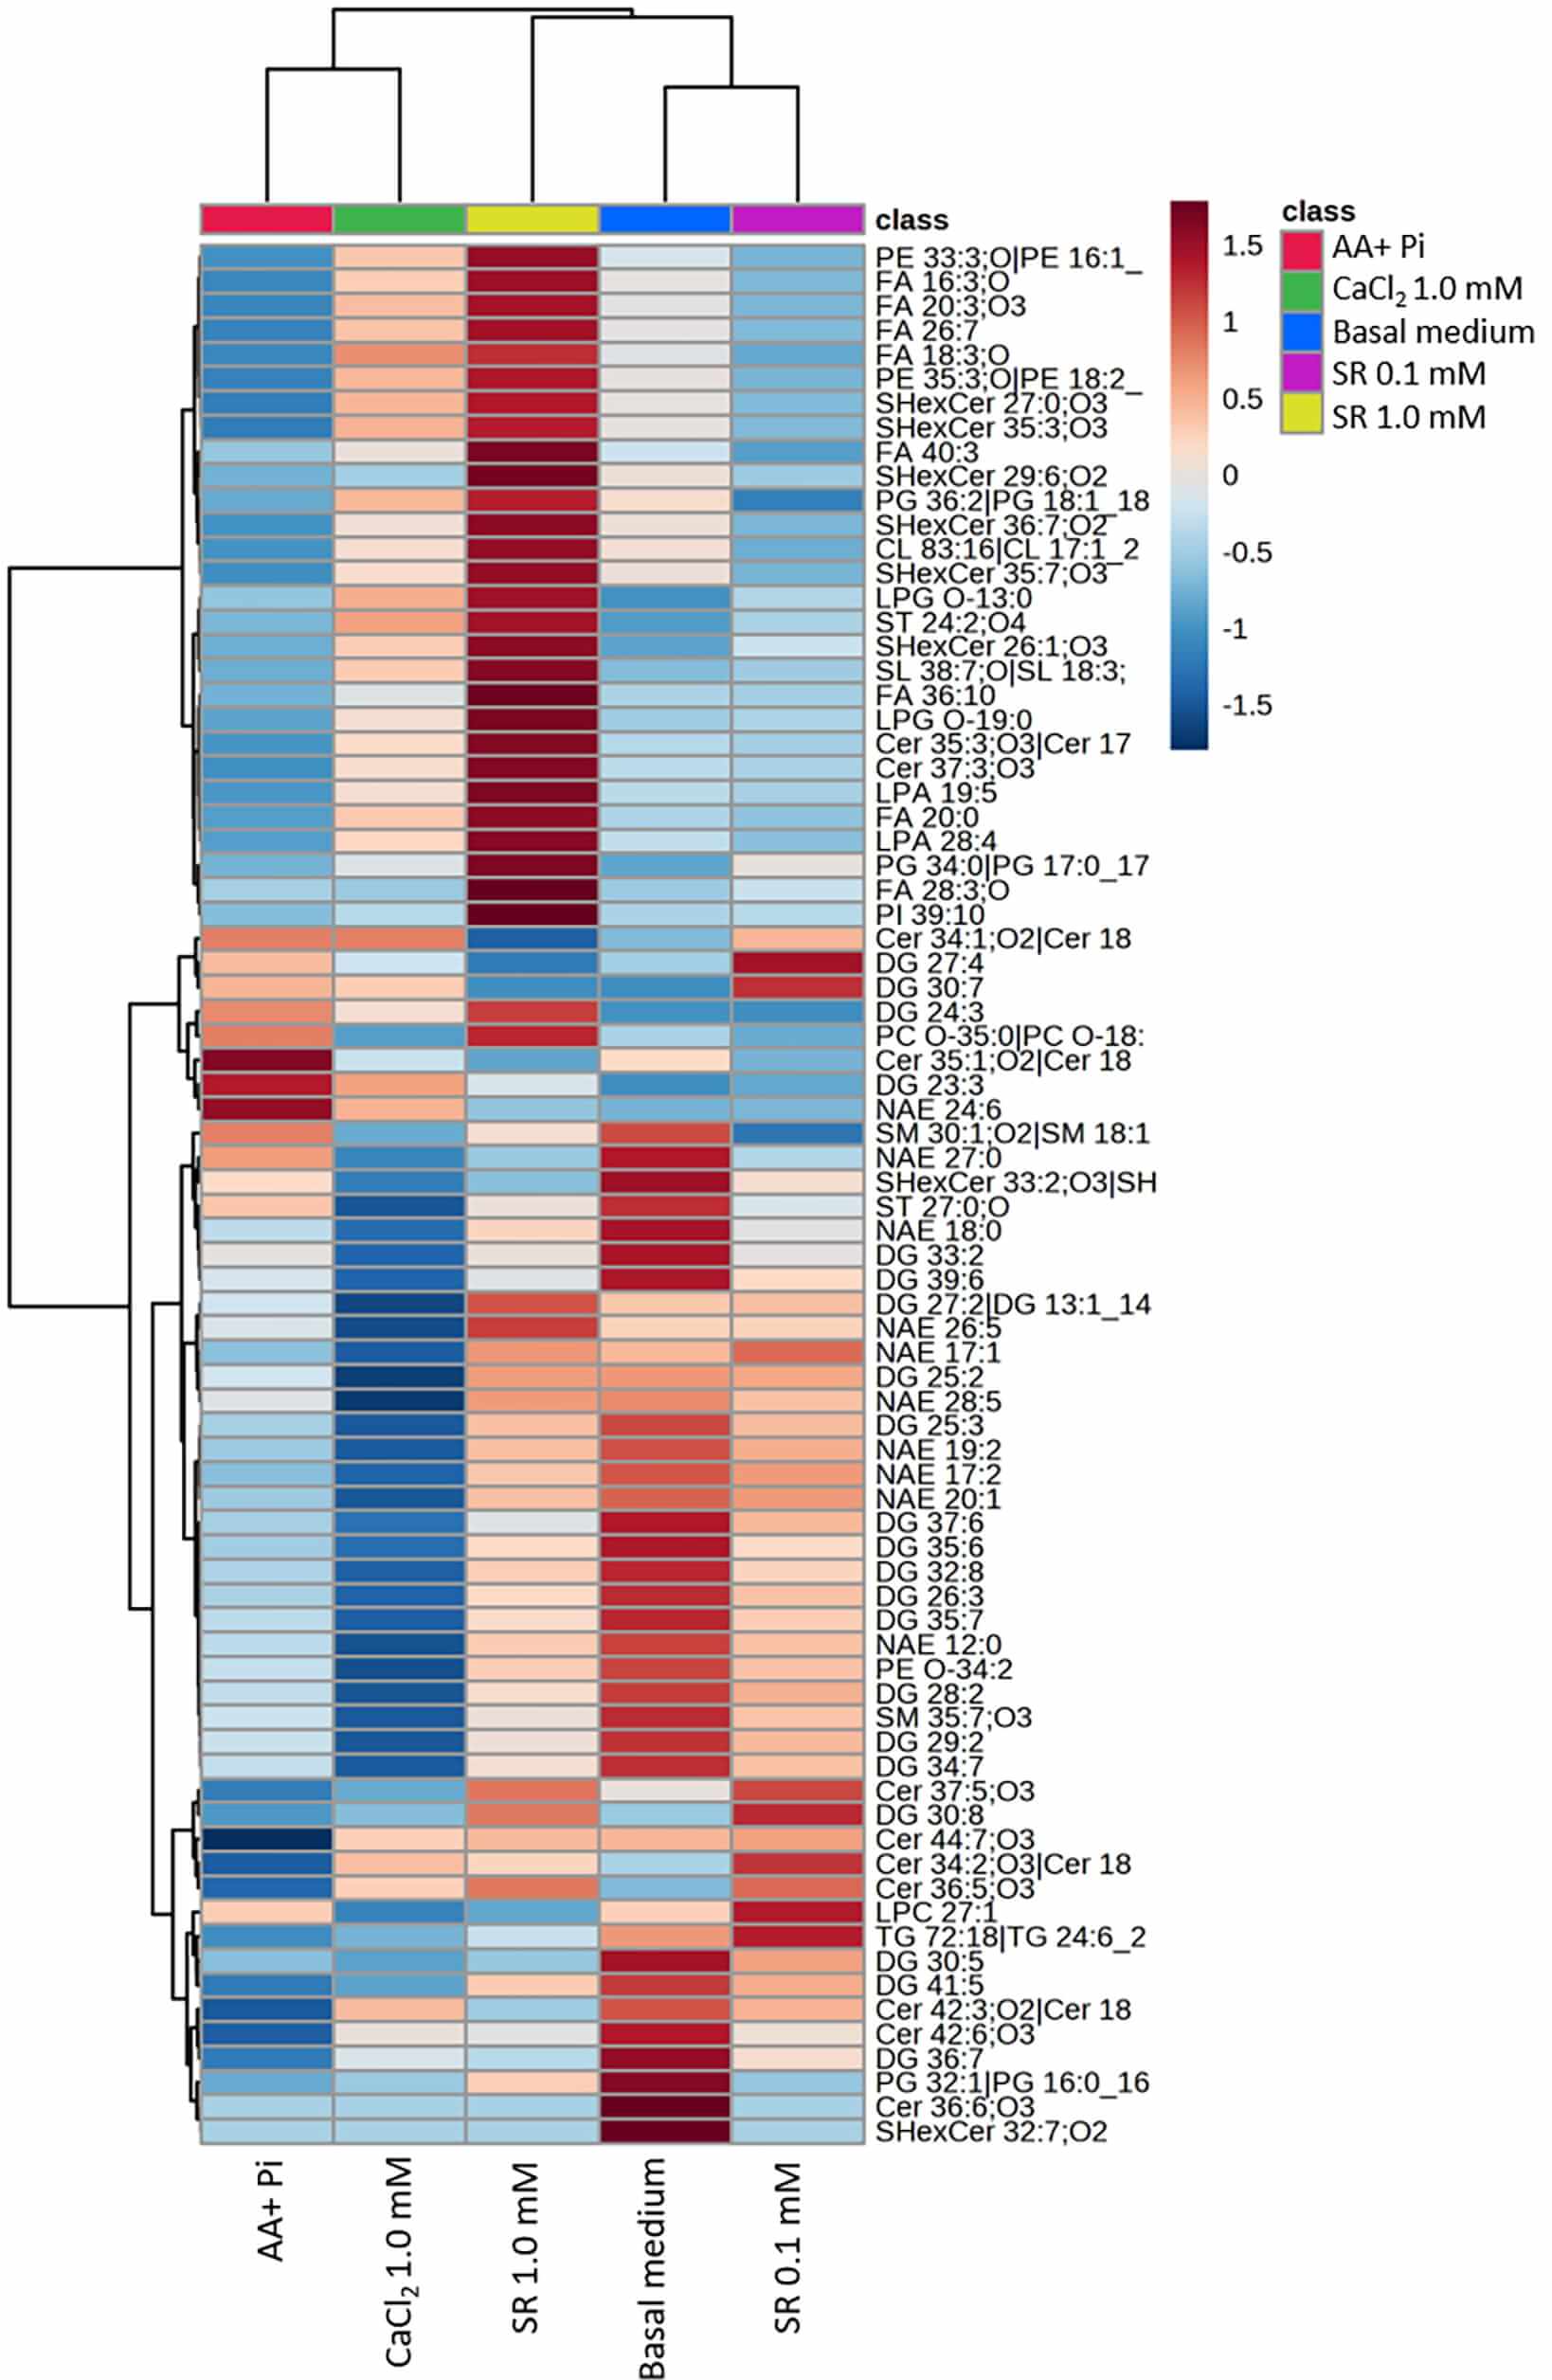 Fig. 10.
A heat map of 81 lipids shows that the lipid composition of MVs varies depending on the stimulus applied to 17IIA11 cells. All 81 lipids are associated with the MV membrane. The color scale ranges from high (dark red) to low (dark blue) abundance, indicating the relative expression level of each lipid across the experimental groups.
The MVs contained 81 identifiable lipid species (Fig. 10), and their lipid class distribution varied depending on the ionic stimulus. MVs derived from 17IIA11 cells exposed to 0.1 mM Sr2+ in osteogenic medium were enriched in Cer, DG, SM, and a wide variety of FA. Similarly, MVs obtained from cells stimulated with 1.0 mM Sr2+ showed a lipid profile comparable to that of the 0.1 mM Sr2+ group, but with higher levels of LPG, PI, phosphatidylethanolamine (PE), and LPA. MVs released under basal medium conditions displayed a lipid composition similar to the Sr2+-stimulated groups. In contrast, MVs isolated from cells cultured in osteogenic medium alone exhibited elevated Cer and SM content. Finally, MVs from cells treated with 1.0 mM Ca2+ in osteogenic medium were NAE along with other lipid species.
Additionally, we generated pie charts to visualize how lipid class proportions shifted in response to each treatment (Fig. 11). The MV membrane is enriched in phospholipids, SM, and cholesterol [12]. Here, various lipids were present in the MV membranes, including lysophosphatidylcholine (LPC), PE, phosphocholine (PA), PI, PS, sphingomyelin (SM), Cer, hexosylceramide (HexCer), and free cholesterol (FC; sterol). Cardiolipin (CL), a lipid predominantly located in inner mitochondrial membranes, was also present. The MV membranes also contained storage lipids, including sterol (ST), DG, and triacylglycerol (TG).
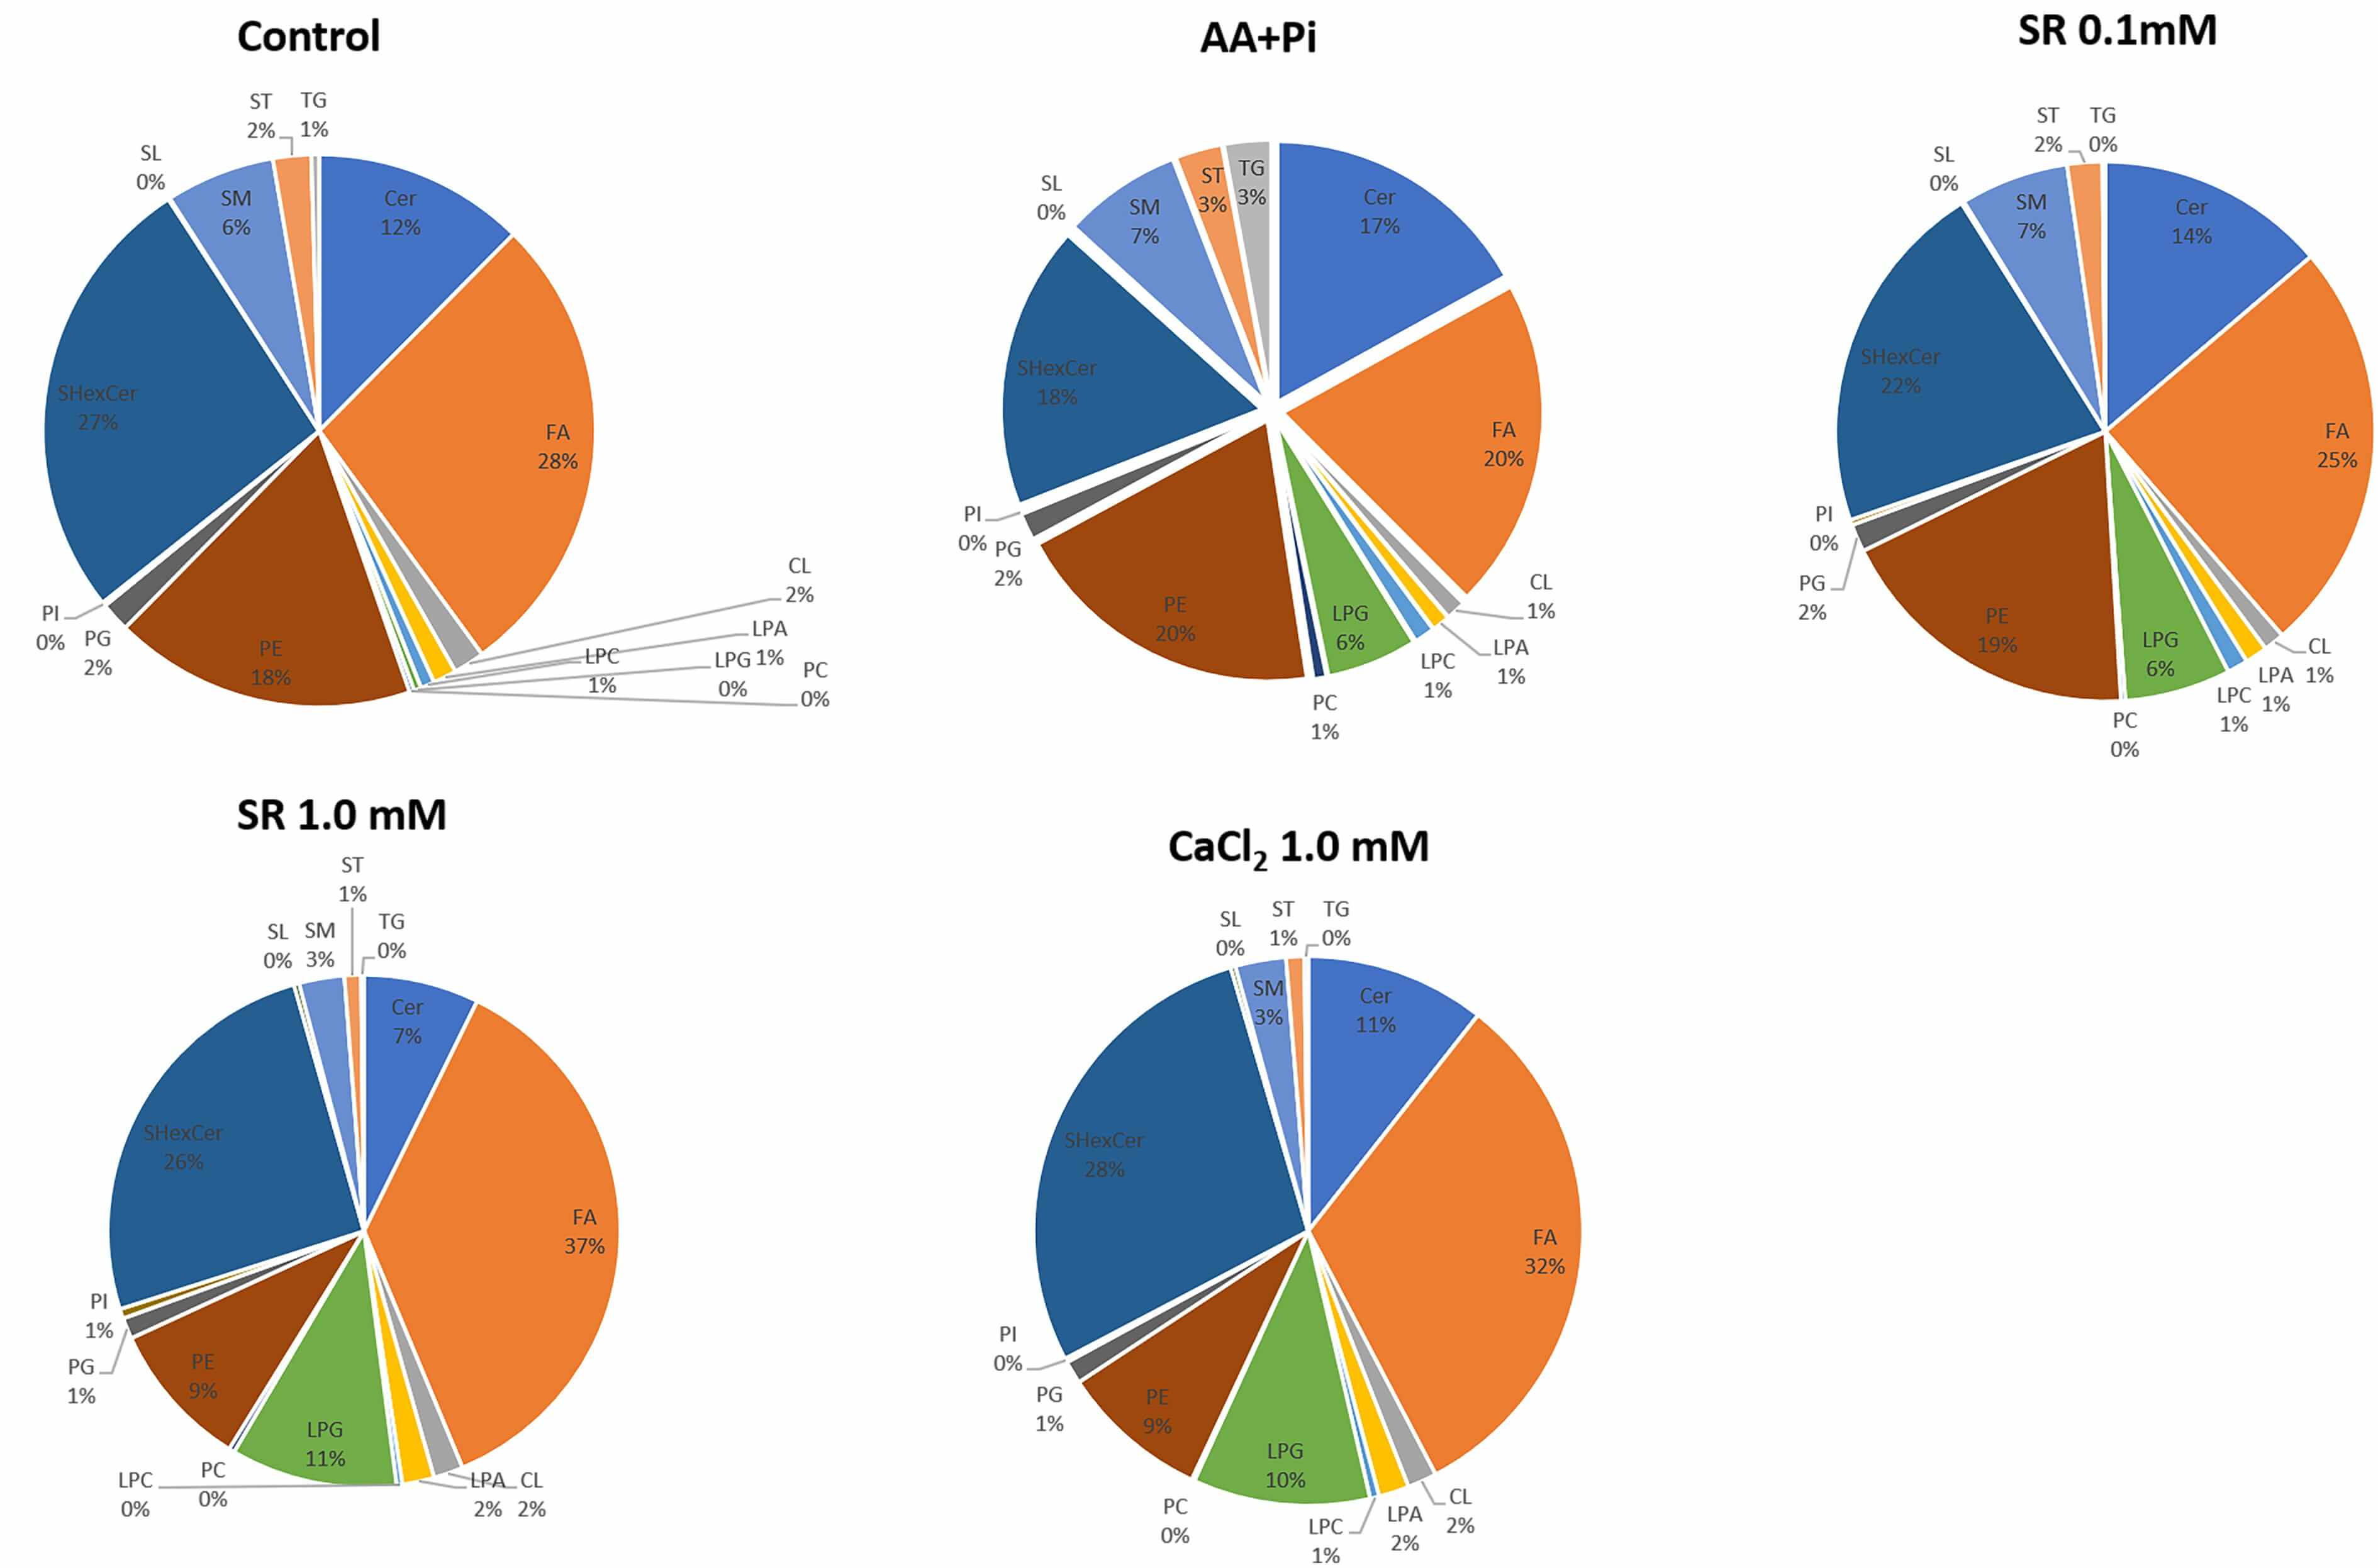 Fig. 11.
The pie charts illustrate the impact of various treatments on overall lipid expression. TG, triacylglycerol; DG, diacylglycerol; FA, fatty acid; ST, sterol lipids; PC, phosphatidylcholine; PE, phosphatidylethanolamine; CL, cardiolipin; PI, phosphatidylinositol; SL, saccharolipid; PG, phosphatidylglycerol; LPC, lysophosphatidylcholine; LPA, lysophosphatidic acid; LPG, lysophosphatidylglycerol; SM, sphingomyelin; Cer, ceramide.
Apart from structural and storage roles, sphingolipids serve as bioactive signaling molecules and are involved in many biological regulations, like inflammation, cell death, and proliferation [131]. In the context of MVs and bone physiology, this class of lipids, together with cholesterol and PS, is extremely important because they are involved with anchoring and regulating key proteins, e.g., TNAP; organizing the lipid bilayer; and creating lipid microdomains (lipid rafts). A better understanding of how sphingolipids and cholesterol regulate MV proteins and help to coordinate lipids throughout the MV membrane can be reviewed elsewhere [132, 133, 134, 135, 136, 137, 138].
In this context, SM and Cer occur in healthy bone tissue and are required for normal mineralization to take place, so their presence in the lipidome of mineral-competent MVs is not surprising [139]. Osteoporotic mice present lower SM and Cer levels in the femur [140], which attests to the role of these lipids in healthy bone homeostasis. Cer, a potent signaling molecule, is pro-apoptotic [141]. Cer hydrolysis to sphingosine mediated by Sphingomyelin Phosphodiesterase 3 (Smpd3) is accompanied by phosphorylation to ceramide-1-phosphate and sphingosine-1-phosphate, which are important bioactive molecules modulating biological processes, such as cell proliferation, apoptosis, migration, and adhesion [131]. Moreover, in situ SM catabolism is needed for mineralizing bone and dentin; hence, in vitro MV-mediated mineralization is associated with SM being rapidly degraded [14]. Additionally, mature osteoblasts have higher expression of Smpd3, a key enzyme in SM hydrolysis to PC and Cer [142, 143]. A similar effect has been observed in odontoblasts [144]. Even though SM and Cer are relevant for bone physiology, their roles in MVs are not fully understood. SM hydrolysis to PA and Cer has been hypothesized to increase free PO43- concentration in the MV vicinity, thereby favoring the onset of mineralization [139].
Importantly, these compositional shifts in lipid profile correlate with the structural alterations observed by phase-contrast imaging as described in the AFM and TEM panel (Fig. 8). We demonstrated that MVs derived from 17IIA11 cells exposed to Sr2+ (0.1 or 1.0 mM) or Ca2+ (1.0 mM) in osteogenic medium exhibited distinct outer-membrane protrusions—visible as darker regions with differing viscoelastic properties. These protrusions were minimal or absent in MVs from cells maintained in basal or osteogenic medium alone. Collectively, the data suggest that ion-dependent remodeling of MV lipid composition—particularly changes in Cer, SM, PE/PI/LPA species, and NAE—is associated with alterations in MV membrane architecture. The presence of specific lipid enrichments under Sr2+ and Ca2+ stimulation likely contributes to the formation of the protrusions observed, reflecting changes in membrane rigidity, curvature, and organization.
Finally, MVs isolated from 17IIA11 cells exposed to 1.0 mM Ca2+ or to 0.1- or 1.0-mM Sr2+ showed greater mineralizing capacity (Fig. 5b) and were characterized by elevated levels of SM and Cer (Fig. 11). Supplementary Table 1 provides a summary of the key findings shown here.
SR has been used as a potential drug aimed at bone fractures since 1870, but its prescription for osteoporotic patients was only made possible years later (1960). Since then, the Sr2+ biochemical mechanism has been widely investigated. Its anabolic effect in promoting bone turnover and its inhibitory effect on osteoclast activity make SR a strong candidate for treating osteoporosis and other bone-related diseases. However, the intrinsic mechanisms involved in these processes are not fully understood. Mineral deposition in the ECM mediated by MVs is also poorly understood. Here, we have investigated how Sr2+ affects MV release and function. Additionally, for the first time, we have studied the MV lipid profile by lipidomic analysis and evaluated how it is affected by Sr2+. For comparison purposes, we have also evaluated Ca2+, whose function in mineralization is well established. In contrast with other works, here we stimulated the cells with different SR or CaCl2 concentrations and isolated the MVs. The effect of SR and CaCl2 on osteocompetent cells (more so in osteoblasts) is well described, but no one has ever paid attention to or fully characterized the MVs released by preodontoblast cells. Given that MVs are nanoreactors that can bind to collagen and deposit HAp, characterizing them in the presence of different stimuli (e.g., osteoinductors-hormones, BMP, biomaterials, ions, etc.) is pivotal.
The multifaceted influence of Sr2+ on mineralization became evident in our study. At the molecular level, we found that extracellular mineral deposition is highly dependent on Sr2+ concentration, with lower concentrations enhancing mineral formation and higher concentrations suppressing it. Among the pathways examined, Erk1/2 and CREB signaling were sensitive to changes in Sr2+ levels, whereas the expression of osteogenic genes in 17IIA11 cells remained largely unaffected. Whether Sr2+ activates CaSR or other ion-sensing receptors remains elusive. Additionally, Sr2+ reduces MV release and TNAP activity, while maintaining highly efficient mineral deposition, as indicated by turbidimetry analysis. The lipid composition of MVs varied according to both the type and concentration of the stimulating ion, supporting the notion that the parental cells sense these ionic cues and adjust MV lipid profiles accordingly. Indeed, the heat map indicates that Ca2+ and Sr2+ differentially alter MV lipid composition, which in turn is reflected in changes to MV release and mineralization efficiency. In this sense, SR acts as an anabolic drug that can activate many osteogenic pathways and interfere with MV release and efficiency by modulating the lipid content of MV.
The datasets used and analyzed during the current study are available from the corresponding author on reasonable request.
LH, APR, and DN conceived the study; APR and DN supervised the study; LH, MS, JGC and SM designed experiments; LH, MS, LHSA, and JGC performed experiments; AFLV and SM helped with the lipidomic experiment and analysis; LH, PC, APR, SM and DN analyzed data; PC, APR, SM, and DN made manuscript revisions. All authors contributed to editorial changes in the manuscript. All authors read and approved the final manuscript. All authors have participated sufficiently in the work and agreed to be accountable for all aspects of the work.
The 17IIA11 cell line used in this study was obtained from Prof. Dr. Odile Kellermann and Prof. Dr. Anne Poliard, Laboratoire de Différenciation Cellulaire et Prions-UPR, France. As this study involved only in vitro experiments using an established cell line and did not include the collection of new human or animal samples, ethical approval was not required according to the regulations of the Institutional Animal Care and Use Committee of the University of Pittsburgh.
We want to express our sincere gratitude to Professor Carlos Sorgi of the Department of Chemistry, Faculty of Philosophy, Sciences, and Letters at Ribeirão Preto, University of São Paulo, for his invaluable assistance and expertise in lipidomic analysis. His technical guidance, attention to detail, and insightful feedback greatly enhanced the quality and depth of this work. We are deeply appreciative of the time and effort he dedicated to ensuring the success of this project.
This work was supported by the Fundação de Amparo à Pesquisa do Estado de São Paulo (grant number 2019/25054-2, 22/04885-6, 2019/0856-2, LH, JGC, LHSA, PC, and APR, respectively); the National Institute of Dental and Craniofacial Research (grant number DE023083, F32DE029096, DN and MS, respectively).
The authors declare no conflict of interest.
Supplementary material associated with this article can be found, in the online version, at https://doi.org/10.31083/FBL47664.
References
Publisher’s Note: IMR Press stays neutral with regard to jurisdictional claims in published maps and institutional affiliations.