


 , Wei Liu 1,*
 , Pingping Tan 1,*
1 Department of Pathology, Hunan Cancer Hospital, Affiliated Cancer Hospital of Xiangya Medical School, Central South University, 410073 Changsha, Hunan, China
Abstract
Programmed death-ligand 1 (PD-L1) partners with specificity Protein 1 (SP1) or signal transducer and activator of transcription 3 (STAT3) to modulate the transcription of growth arrest-specific 6 (GAS6) and early growth response protein 1 (EGR1), necessitating mediators to avoid feedback. Based on binding and stemness data, high mobility group A1 (HMGA1) and Small Mother Against Decapentaplegic3 (SMAD3) were identified as potential mediators in this context. While the SMAD3–P300–STAT3 complex facilitates SMAD3–STAT3 crosstalk, it remains unclear whether the PD-L1–HMGA1–SP1 or PD-L1–SMAD3–SP1 complexes bind to GAS6 and EGR1 promoters to regulate their transcription.
MG63 osteosarcoma cells and SW620 colon cancer cells with unidentified nuclear PD-L1 function were chosen for our study. Chromatin immunoprecipitation and co-immunoprecipitation assays were performed to evaluate SP1, HMGA1, SMAD3, STAT3, P300 and PD-L1 (also denoted CD274) enrichment at the GAS6 and EGR1 promoters; the existence of the PD-L1–(HMGA1 or SMAD3)–SP1 complexes; whether P300 binds to STAT3; and whether HMGA1 and SMAD3 bind to P300. The alterations in GAS6, EGR1 and PD-L1 mRNA levels after their combined over-expression and/or knockdown were assessed via qPCR. Two representative target genes identified via PD-L1 chromatin immunoprecipitation (ChIP)-seq were examined to determine whether HMGA1 and SMAD3 were enriched at their promoters.
PD-L1, HMGA1, SMAD3, SP1, P300 and STAT3 were enriched at GAS6 and EGR1 promoters in two cell lines. HMGA1 or SMAD3 antibody pulled down PD-L1 and SP1; PD-L1 antibody pulled down HMGA1, SMAD3 and SP1; P300 antibody pulled down STAT3; and, surprisingly, HMGA1 and SMAD3 antibodies pulled down P300. Combined over-expression or knockdown significantly altered GAS6, EGR1 and PD-L1 mRNA levels. PD-L1 ChIP-seq indicated 114 target genes, among which PD-L1 and beta-transducin repeat containing E3 ubiquitin protein ligase (BTRC) were chosen to verify the promoter enrichment of HMGA1 and SMAD3.
Our study provides initial evidence that PD-L1 might form HMGA1- and SMAD3-dependent complexes to bind the GAS6, EGR1 and CD274 promoters, thus modulating the transcription of GAS6, EGR1 and PD-L1 mRNA in cancer and sarcoma cells.
Keywords
- PD-L1
- HMGA1 protein
- SMAD3 protein
- growth arrest-specific protein 6
- early growth response protein 1
- neoplasms
- sarcoma
The interactions between programmed death-ligand 1 (PD-L1) on cancer and sarcoma
cell membranes with programmed death protein 1 (PD-1) on T cells inhibit T cells
from attacking tumor cells, thus promoting immune checkpoint escape [1, 2].
Membrane PD-L1 also has pro-survival and invasive-enhancing functions in cancer
and sarcoma cells, but the definite mechanisms underpinning signal transduction
remain poorly understood [3, 4]. PD-L1/PD-1 blockade therapies have been
clinically used to restore the anti-tumor immune response; however, checkpoint
blockade drugs are prone to low response rates, serious adverse effects and
therapeutic resistance [5, 6]. Recent research has shown that PD-L1 expressed on
the cell surface has a secondary mechanism of regulating immune responses that is
mediated via its endocytic and nucleocytoplasmic translocation into the nucleus
[7]. P300-mediated acetylation of PD-L1 blocks its translocation, whereas histone
deacetylase 2 (HDAC2)-driven deacetylation promotes this process [7]. In previous
research, TGF-
Regarding PD-L1-modulated transcription within the nucleus, PD-L1 forms a complex with the transcription factor specificity protein 1 (SP1) and enhances the expression of Growth Arrest-Specific 6 (GAS6) by binding to its promoter. subsequent activation of MerTK signaling by up-regulated GAS6 has been shown to drive tumor proliferation in non-small cell lung cancer [10]. Furthermore, nuclear PD-L1 drives the progression of uveal melanoma by co-localizing with phosphorylated signal transducer and activator of transcription 3 (STAT3) at promoter regions, leading to transcriptional up-regulation of Early Growth Response protein 1 (EGR1) [9]. In addition, p-STAT3 physically interacts with PD-L1 to enter the nucleus and binds to the gasdermin C promoter to enhance its transcription under hypoxic conditions, leading to the activation of a non-canonical pyroptosis pathway that fuels tumor progression [11]. Better comprehension of the mechanisms of PD-L1-activated signal pathways and PD-L1-regulated genes is critically needed to “harness” PD-L1 for more effective therapeutic management of sarcoma and cancer.
Emerging studies have identified novel transcription factors governing the
expression of PD-L1. A polymorphism in the PD-L1 promoter enhances its
affinity for SP1, resulting in up-regulated PD-L1 expression and increased risk
of gastric cancer [12]. In Kaposi’s sarcoma-associated herpesvirus infection, the
viral replication and transcription activator (K-RTA) cooperates with host SP1
near the transcription start site to transactivate the CD274/PD-L1 promoter. This mechanism facilitates immune evasion by elevating PD-L1
expression [13]. Furthermore, SP1 and STAT3 not only serve as established
transcriptional activators of PD-L1, but are also reciprocally
up-regulated by PD-L1 over-expression via Myc- or HIF-1
Transcriptional complexes formed by High Mobility Group A1 (HMGA1) or SMAD3 with
SP1 orchestrate the expression of oncogenic targets such as insulin-like growth
factor 1 receptor (IGF-1R) and Tenascin-C (TNC), thereby
promoting tumor progression through activation of growth and matricellular
signaling pathways [17, 18]. Interestingly, both HMGA1 and SMAD3 have been
demonstrated to directly bind PD-L1 [8, 19]; therefore, both can be considered as
candidate mediators, and their combination as mediators should also be validated.
Whether HMGA1 and SMAD3 are enriched at GAS6 and EGR1 promoters has not yet been
studied; nevertheless, they might mediate the binding of PD-L1 and SP1 to those
promoters to modulate the expression of GAS6 and/or EGR1. Although this concept
may seem strange and complicated at first, we present the results of systematic
tests performed to determine its fundamental viability in this study. Direct
P300–STAT3 and SMAD3–STAT3 interactions have been reported in previous studies,
but whether these complexes are enriched at the GAS6 and EGR1 promoters has not been studied [20]. In the present study, we over-expressed
PD-L1/CD274 in colon cancer and osteocarcinoma cells, as the role of their
nuclear PD-L1 in regulating GAS6 and EGR1 expression has not
yet been explored. We treated the cells with Transforming growth factor-
Taken together, the results of these experiments validate the critical role of PD-L1 in modulating the transcription of GAS6, EGR1 and PD-L1 itself through the formation of HMGA1- and SMAD3-dependent complexes to bind relevant promoters. Given the complexity of the proposed concept, further validation using other sources and more in-depth exploration are warranted.
SW620 and MG63 cells were acquired from the Cell Bank of the Chinese Academy of
Sciences (Shanghai, China). All cell lines were validated via STR profiling and
tested negative for mycoplasma. According to previous research focused on PD-L1
regulation, TGF-
ChIP was conducted using a commercial Millipore kit (GeneCreate, Wuhan, Hubei, China), following established methods [6]. After crosslinking, cells were lysed, and chromatin was fragmented via sonication on ice. Immunoprecipitation was performed using Protein G agarose beads with antibodies against SP1, HMGA1, SMAD3, STAT3 or PD-L1, with normal IgG as a control. Following reversal of crosslinking and proteinase K treatment, purified DNA was analyzed via qPCR using primers specific to the GAS6 and EGR1 promoter regions, whose 5′ to 3′ sequences are listed as follows [6, 7] (Table 1).
| Gene | Primer set | Forward primer (5′→3′) | Reverse primer (5′→3′) |
| GAS6 | F1/R1 | CCAAGACAAGAGCCAGAA | CGAGTGAAATGCGACG |
| GAS6 | F2/R2 | GGAACCCTTAGGAAATAATAGC | TTCTGCCCCGAAACCAC |
| GAS6 | F3/R3 | CAATCCTATTCCATTCTTCC | AATCCCCACACCCCA |
| EGR1 | F1/R1 | CTGGACTGGATAAAGGGGGG | TGTCGCTGGGAAATTGAGGAT |
| EGR1 | F2/R2 | GGGACAGCCACAGAGGGATT | AAGGAGGGTGCTTGACGACA |
| EGR1 | F3/R3 | CAGCGACACCCGGAAAGACA | TCAGGGACCGTGAGAGCGAA |
| CD274 | F1/R1 | AAAGAAAAGGGAGCACA | CAAGATGACAGACGATGG |
| CD274 | F2/R2 | ACCTGTAAACTGTATTGCC | CAGCTCAGATGTTCCTTC |
| CD274 | F3/R3 | TAAAAGATGTAGCTCGGG | TGTGTGTGTGTATGGGTGT |
| BTRC | F1/R1 | AGTCCTCTGAAAACCTCC | CTTTGTCCTAGCCCCTA |
| BTRC | F2/R2 | CAAGGCTGTCACAATCTAA | AAACCCCCGTCTCTACTA |
| BTRC | F3/R3 | GCTGTGGGGGAGAAAAG | GGCAAGAATCACGGGTC |
ChIP-qPCR, ChIP-quantitative polymerase chain reaction.
The generation and sequencing of short DNA reads from immunoprecipitated samples were performed at GeneCreate (Wuhan, Hubei, China) using an Illumina NovaSeq6000 (San Diego, CA, USA). Reads were mapped against the human reference genome hg38 with Bowtie 2 version 2.5.0 (https://bowtie-bio.sourceforge.net/) [24]. Peak calling was carried out using MACS3 (version 3.0.0, Buffalo, New York, NY, USA), peak gene annotation was accomplished using ChIPseeker (version 1.36, Guangzhou, Guangdong, China), and Homer (version 4.11, San Diego, CA, USA) analysis was performed to identify enriched motifs.
Cell lysates were prepared in RIPA buffer supplemented with protease inhibitors and cleared by centrifugation. Target protein complexes were immunoprecipitated using antibody-conjugated agarose beads. Following extensive washing and elution, immunoprecipitated proteins were resolved by SDS-PAGE and analyzed by immunoblotting with the indicated antibodies.
MG63 and SW620 cells were divided into five groups to be successively
transfected with control, PD-L1OE,
PD-L1OE+HMGA1OE+SP1OE, pD-L1OE+SMAD3OE+SP1OE or
P300OE+STAT3OE+SP1OE plasmids (Honorgene, Changsha, China) for 48 h under
normoxic conditions, following which PCR was performed to confirm their
successful over-expression and measure GAS6 and EGR1 mRNA. As
p-STAT3 physically interacts with PD-L1 in the nucleus to regulate
gasdermin C transcription under hypoxic conditions, we assessed their
expression levels under hypoxia and their effects with or without SP1, PD-L1,
HMGA1 and SMAD3 knockdown [11]. SW620 cells with adequate PD-L1 expression were
divided into five groups to be successively transfected with control small
interfering ribonucleic acids (siRNAs) and siRNAs targeting SP1,
PD-L1+SP1, HMGA1 and HMGA1+SMAD3 (Honorgene, Changsha,
Hunan, China) for 48 h under normoxic conditions or two cycles of 20 h under
normoxic and 4 h under hypoxic conditions. qPCR was then performed to confirm
their successful knockdown and to measure GAS6 and EGR1 mRNA.
Total RNA was isolated using a commercial RNA purification kit (Honorgene, Changsha, Hunan, China), and cDNA was
synthesized with the PrimeScript RT reagent kit (Honorgene, Changsha, Hunan, China). Quantitative real-time PCR was
performed using SYBR Green master mix (Honorgene, Changsha, Hunan, China) with
ACTB or GAPDH as the endogenous control for over-expression or
knockdown experiments, respectively. To evaluate the knockdown efficiency of
siRNA in preliminary experiments, the specific si-SP1, si-SP1+PD-L1, si-HMGA1 and
si-HMGA1+SMAD3 combinations were selected based on their knockdown performance
both independently and in combinations. Each sample was analyzed in triplicate,
and the cycle threshold (Ct) value was calculated. The
The primer sequences used are listed below (Tables 2,3).
| Gene | Forward Primer (5′-3′) | Reverse Primer (5′-3′) |
| SMAD3 | GGGGGTTGGACTTTCCTTCC | GACTCCAAGTGGCAGCAGAA |
| SP1 | CCCTTGAGCTTGTCCCTCAG | TGAAAAGGCACCACCACCAT |
| P300 | GCAGTGTGCCAAACCAGATG | GGGTTTGCCGGGGTACAATA |
| GAS6 | ACGACCCCGAGACGGATTAT | GGCGAAGCCTGAGTTTTTGG |
| STAT3 | TCTGTGTGACACCAACGACC | TCCTCACATGGGGGAGGTAG |
| EGR1 | CCCACCATGGACAACTACCC | AAAGACTCTGCGGTCAGGTG |
| HMGA1 | CATCCGCATTTGCTACCAGC | TCTCAGTGCCGTCCTTTTCC |
| CD274 | ACTGGCATTTGCTGAACG | TCCTCCATTTCCCAATAGAC |
| ACTB | GCGTGACATTAAGGAGAAGC | CCACGTCACACTTCATGATGG |
| GAPDH | CTGACTTCAACAGCGACACC | GTGGTCCAGGGGTCTTACTC |
| siRNA Name | Sense Strand (5′-3′) | Antisense Strand (5′-3′) |
| si-h-CD274_007 | GCUGUCUUUAUAUUCAUGATT | UCAUGAAUAUAAAGACAGCTT |
| HMGA1-Homo-256 | GAGUCGAGCUCGAAGUCCATT | UGGACUUCGAGCUCGACUCTT |
| HMGA1-Homo-1378 | GCUCCCCUAACCCUACUUUTT | AAAGUAGGGUUAGGGGAGCTT |
| HMGA1-Homo-402 | GCCAACACCUAAGAGACCUTT | AGGUCUCUUAGGUGUUGGCTT |
| SMAD3-homo-660 | GCGUGAAUCCCUACCACUATT | UAGUGGUAGGGAUUCACGCTT |
| SMAD3-homo-1307 | GGAUGCAACCUGAAGAUCUTT | AGAUCUUCAGGUUGCAUCCTT |
| SMAD3-homo-1414 | CCGCAUGAGCUUCGUCAAATT | UUUGACGAAGCUCAUGCGGTT |
| SP1-homo-2414 | GCAGAUCUGCAGUCCAUUATT | UAAUGGACUGCAGAUCUGCTT |
| SP1-homo-379 | CCUCACAGCCACACAACUUTT | AAGUUGUGUGGCUGUGAGGTT |
| SP1-homo-1689 | CCAUUAACCUCAGUGCAUUTT | AAUGCACUGAGGUUAAUGGTT |
| Negative Control | UUCUCCGAACGUGUCACGUTT | ACGUGACACGUUCGGAGAATT |
The siRNA sense and antisense sequences used are also listed below (sense: 5′-…-3′; antisense: 5′-…-3′).
Statistical analyses were conducted using SPSS 20.0 (IBM Corporation, Armonk,
NY, USA) and GraphPad Prism 5.0 (GraphPad Software Inc., San Diego, CA, USA).
ChIP-qPCR, Co-IP and Western blotting experiments were performed with three
independent replicates, while qRT-PCR was performed with six independent
replicates. Data are presented as the mean
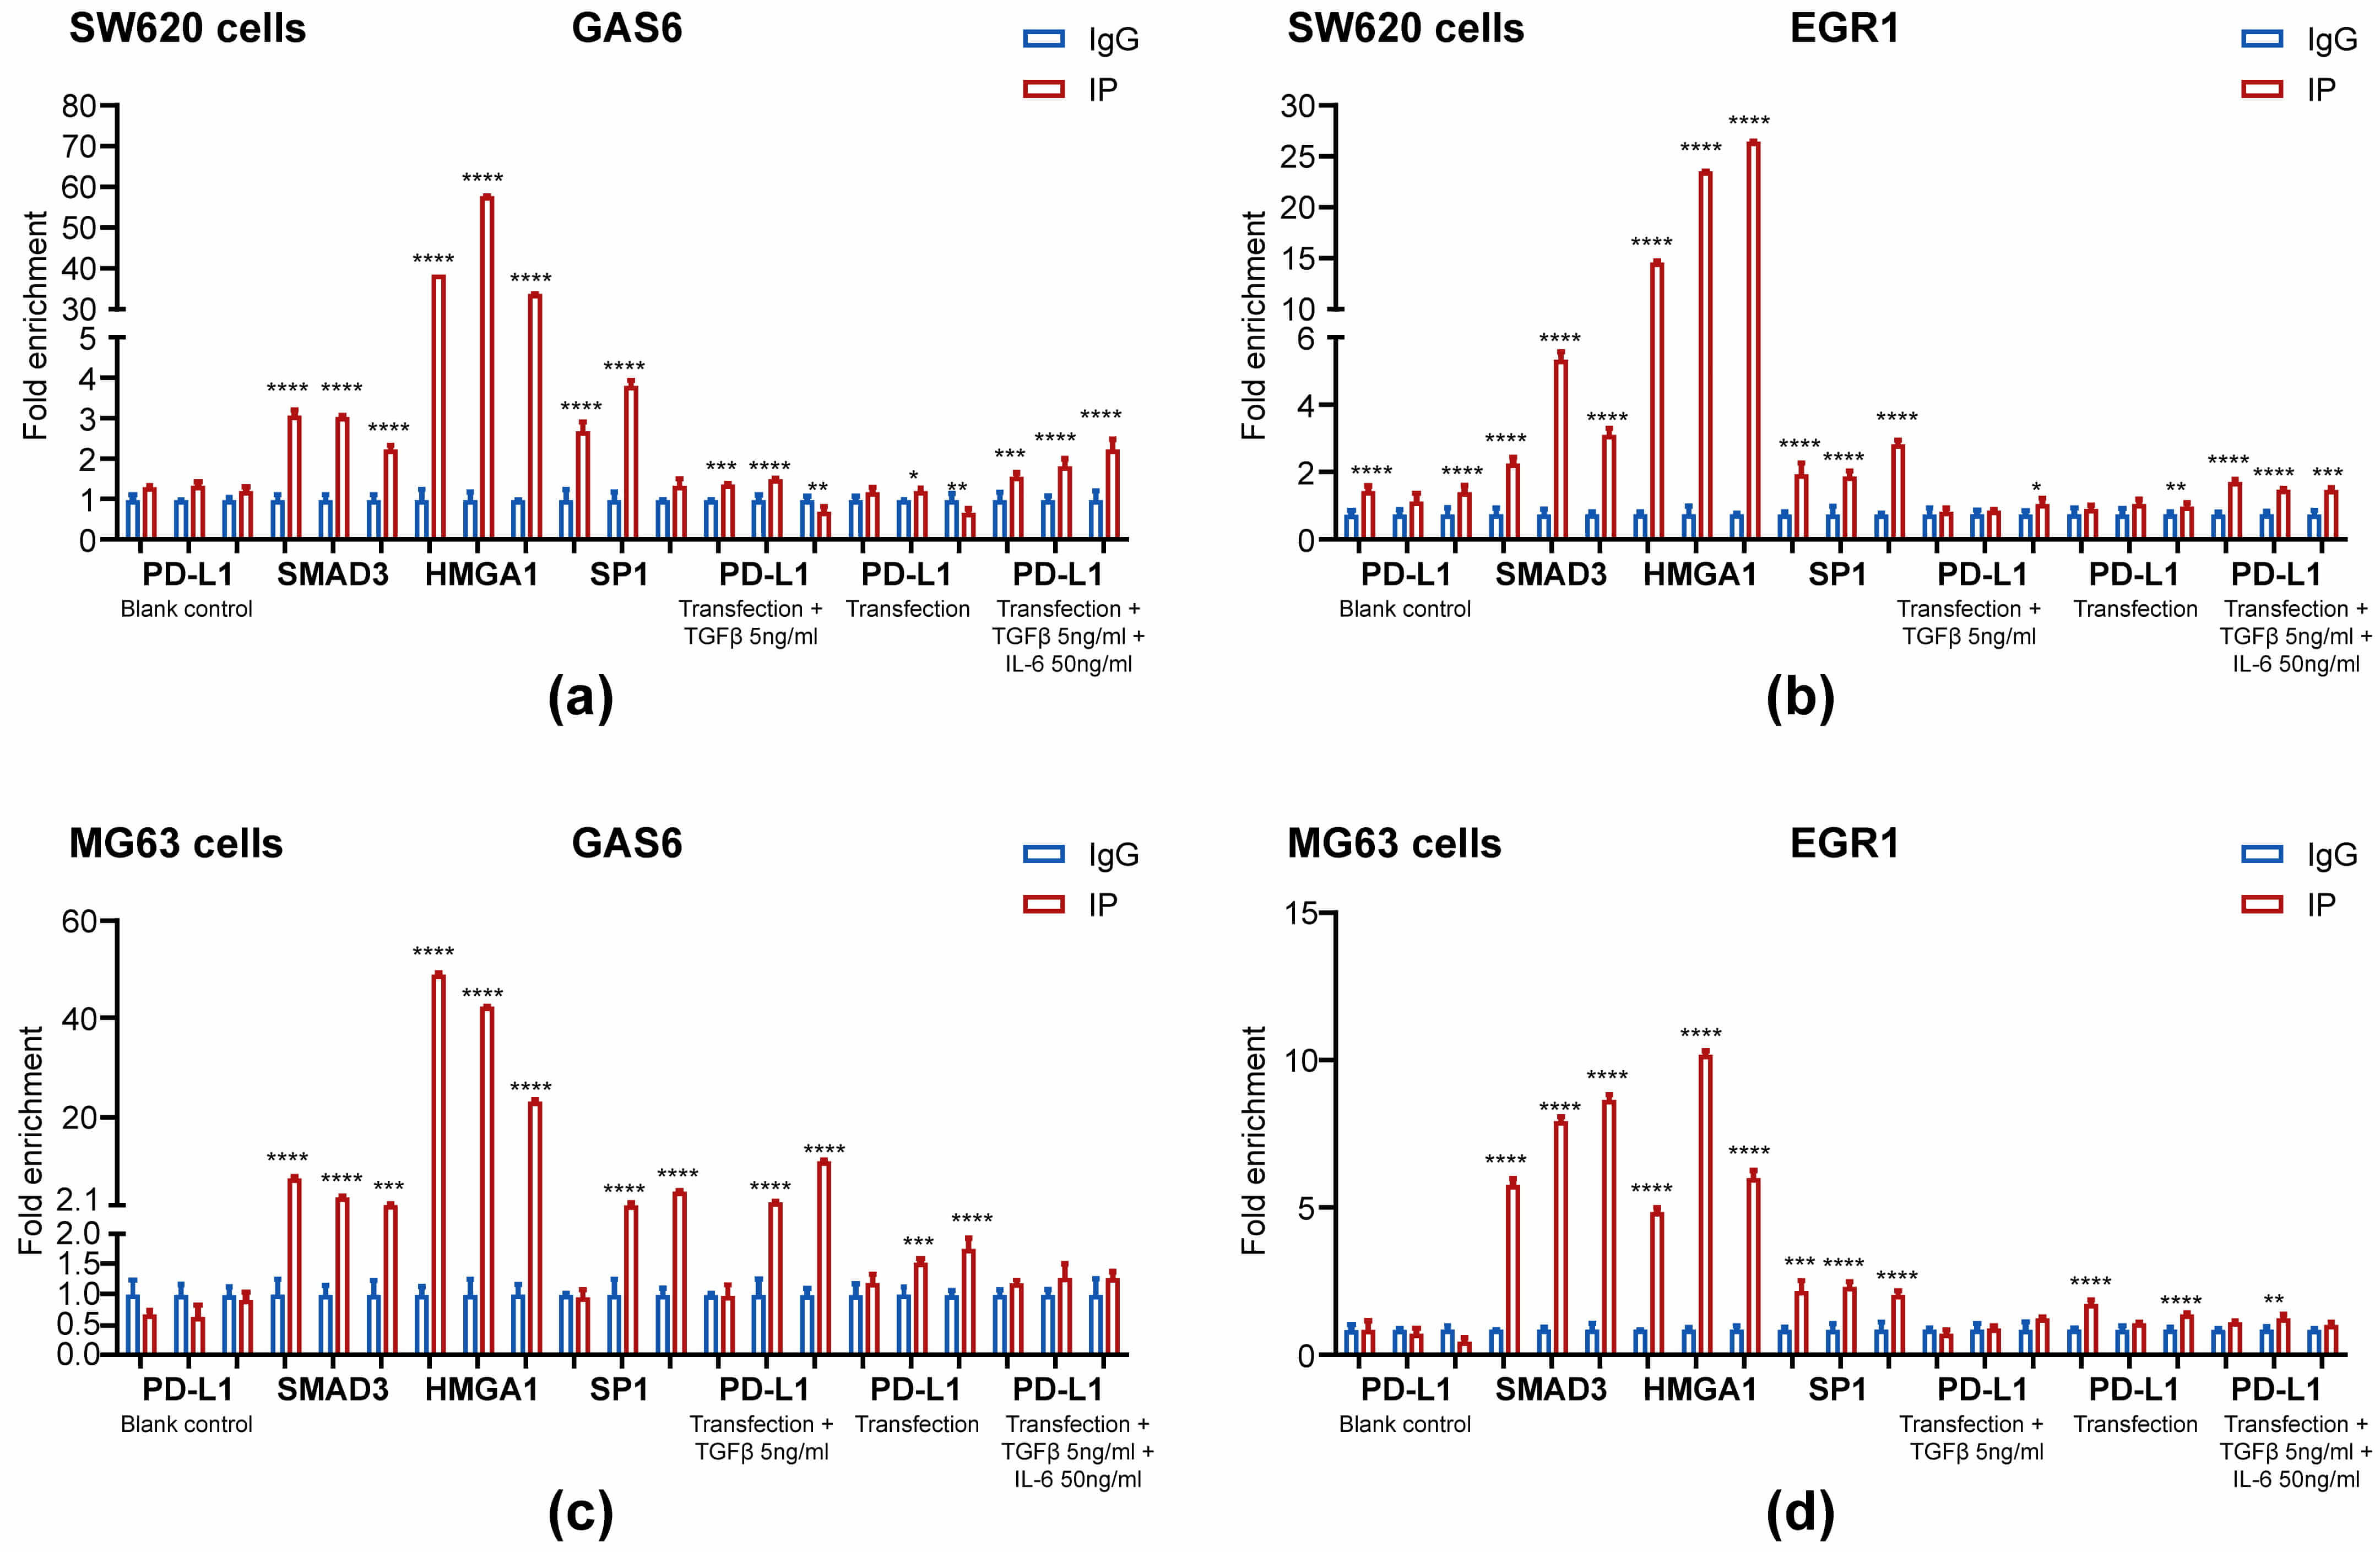
We performed ChIP assays to evaluate the mechanisms underlying the binding of
PD-L1 to the promoter of GAS6. In contrast with blank control and
control IgG, PD-L1, SMAD3, HMGA1 and SP1 were enriched at the GAS6
promoter after the 6 h treatment with 5 ng/mL TGF-
 Fig. 1.
Enrichment of HMGA1, SMAD3, SP1 and PD-L1 at the GAS6 and EGR1
promoters. SW620 (a,c) and MG63 cells (b,d) were transfected with PD-L1 plasmid
for 42 h. Then, the cells were treated with 5 ng/mL TGF-
We also performed ChIP assays at the EGR1 promoter to gain additional
insights into the potential roles of protein complexes containing HMGA1, SMAD3,
SP1 and PD-L1. Consistent with the results for the GAS6 promoter, SMAD3,
HMGA1 and SP1 were enriched at the EGR1 promoter in MG63 and SW620 cells
after treatment with 5 ng/mL TGF-
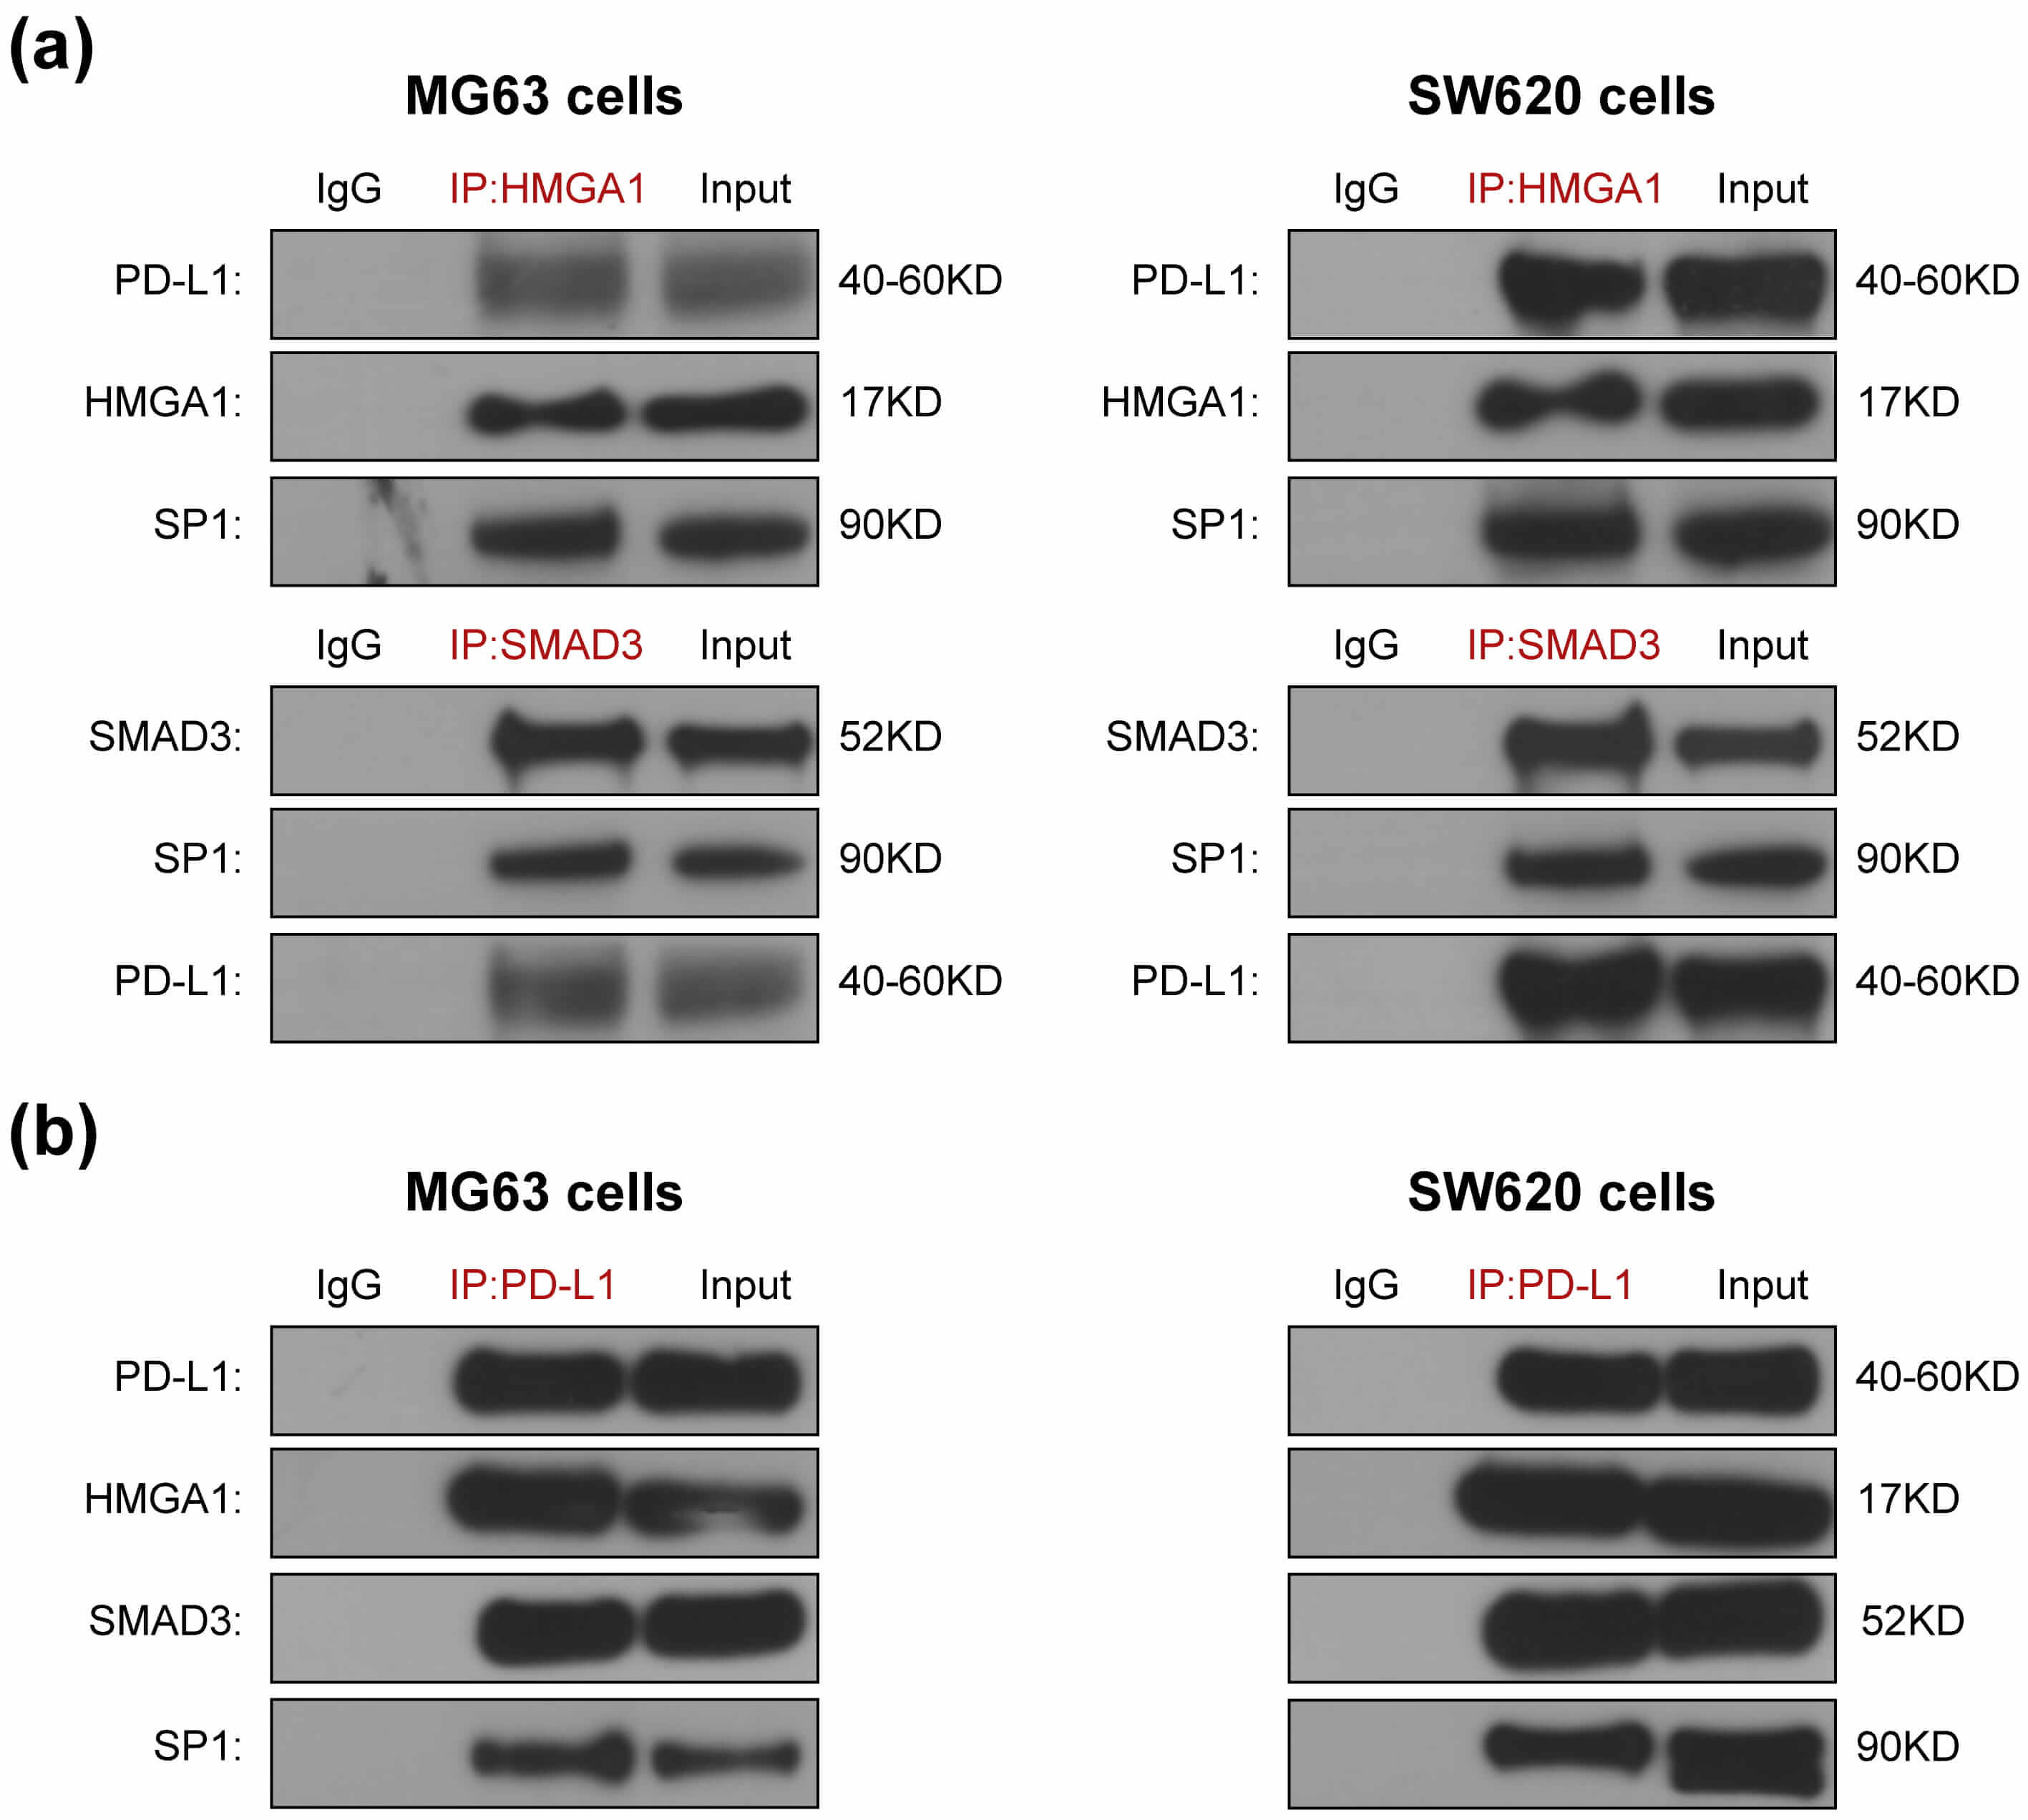
SMAD3 has been reported to directly interact with PD-L1 [8], STAT3 [21, 22] and SP1 [18]; while HMGA1 has been reported to bind to PD-L1 and SP1 [17, 19]. To determine whether SMAD3 and HMGA1 interact with PD-L1 and SP1 within PD-L1–SMAD3–SP1 and PD-L1–HMGA1–SP1 ternary complexes or HMGA1 complexes with SMAD3, we performed CoIP assays. In SW620 and MG63 cells, PD-L1 and SP1 were pulled down by both anti-SMAD3 and anti-HMGA1 antibodies (Fig. 2a). Furthermore, HMGA1, SMAD3 and SP1 were pulled down by PD-L1 antibody in both cells (Fig. 2b). These results are consistent with the existence of PD-L1–SMAD3–SP1 and PD-L1–HMGA1–SP1 ternary complex or a connection between HMGA1 and SMAD3, PD-L1 and SP1 were reduced to at least one pair in SW620 and MG63 cells.
 Fig. 2.
The comfirmation of HMGA1 and SMAD3 as mediators for
PD-L1 and SP1 combination. HMGA1 and SMAD3 antibodies pull down PD-L1 and SP1
(a). PD-L1 antibody pulls down HMGA1, SMAD3 and SP1 (b). SW620 and MG63 cells
were transfected with PD-L1 plasmids. After 42 h, they were treated for 6 h with
5 ng/mL TGF-
To further assess the role of STAT3, we performed Western blot assays in
PD-L1-transfected SW620 and MG63 cells using an antibody that binds its activated
form, p-STAT3. The results demonstrated that, compared to the blank control, 5
ng/mL TGF-
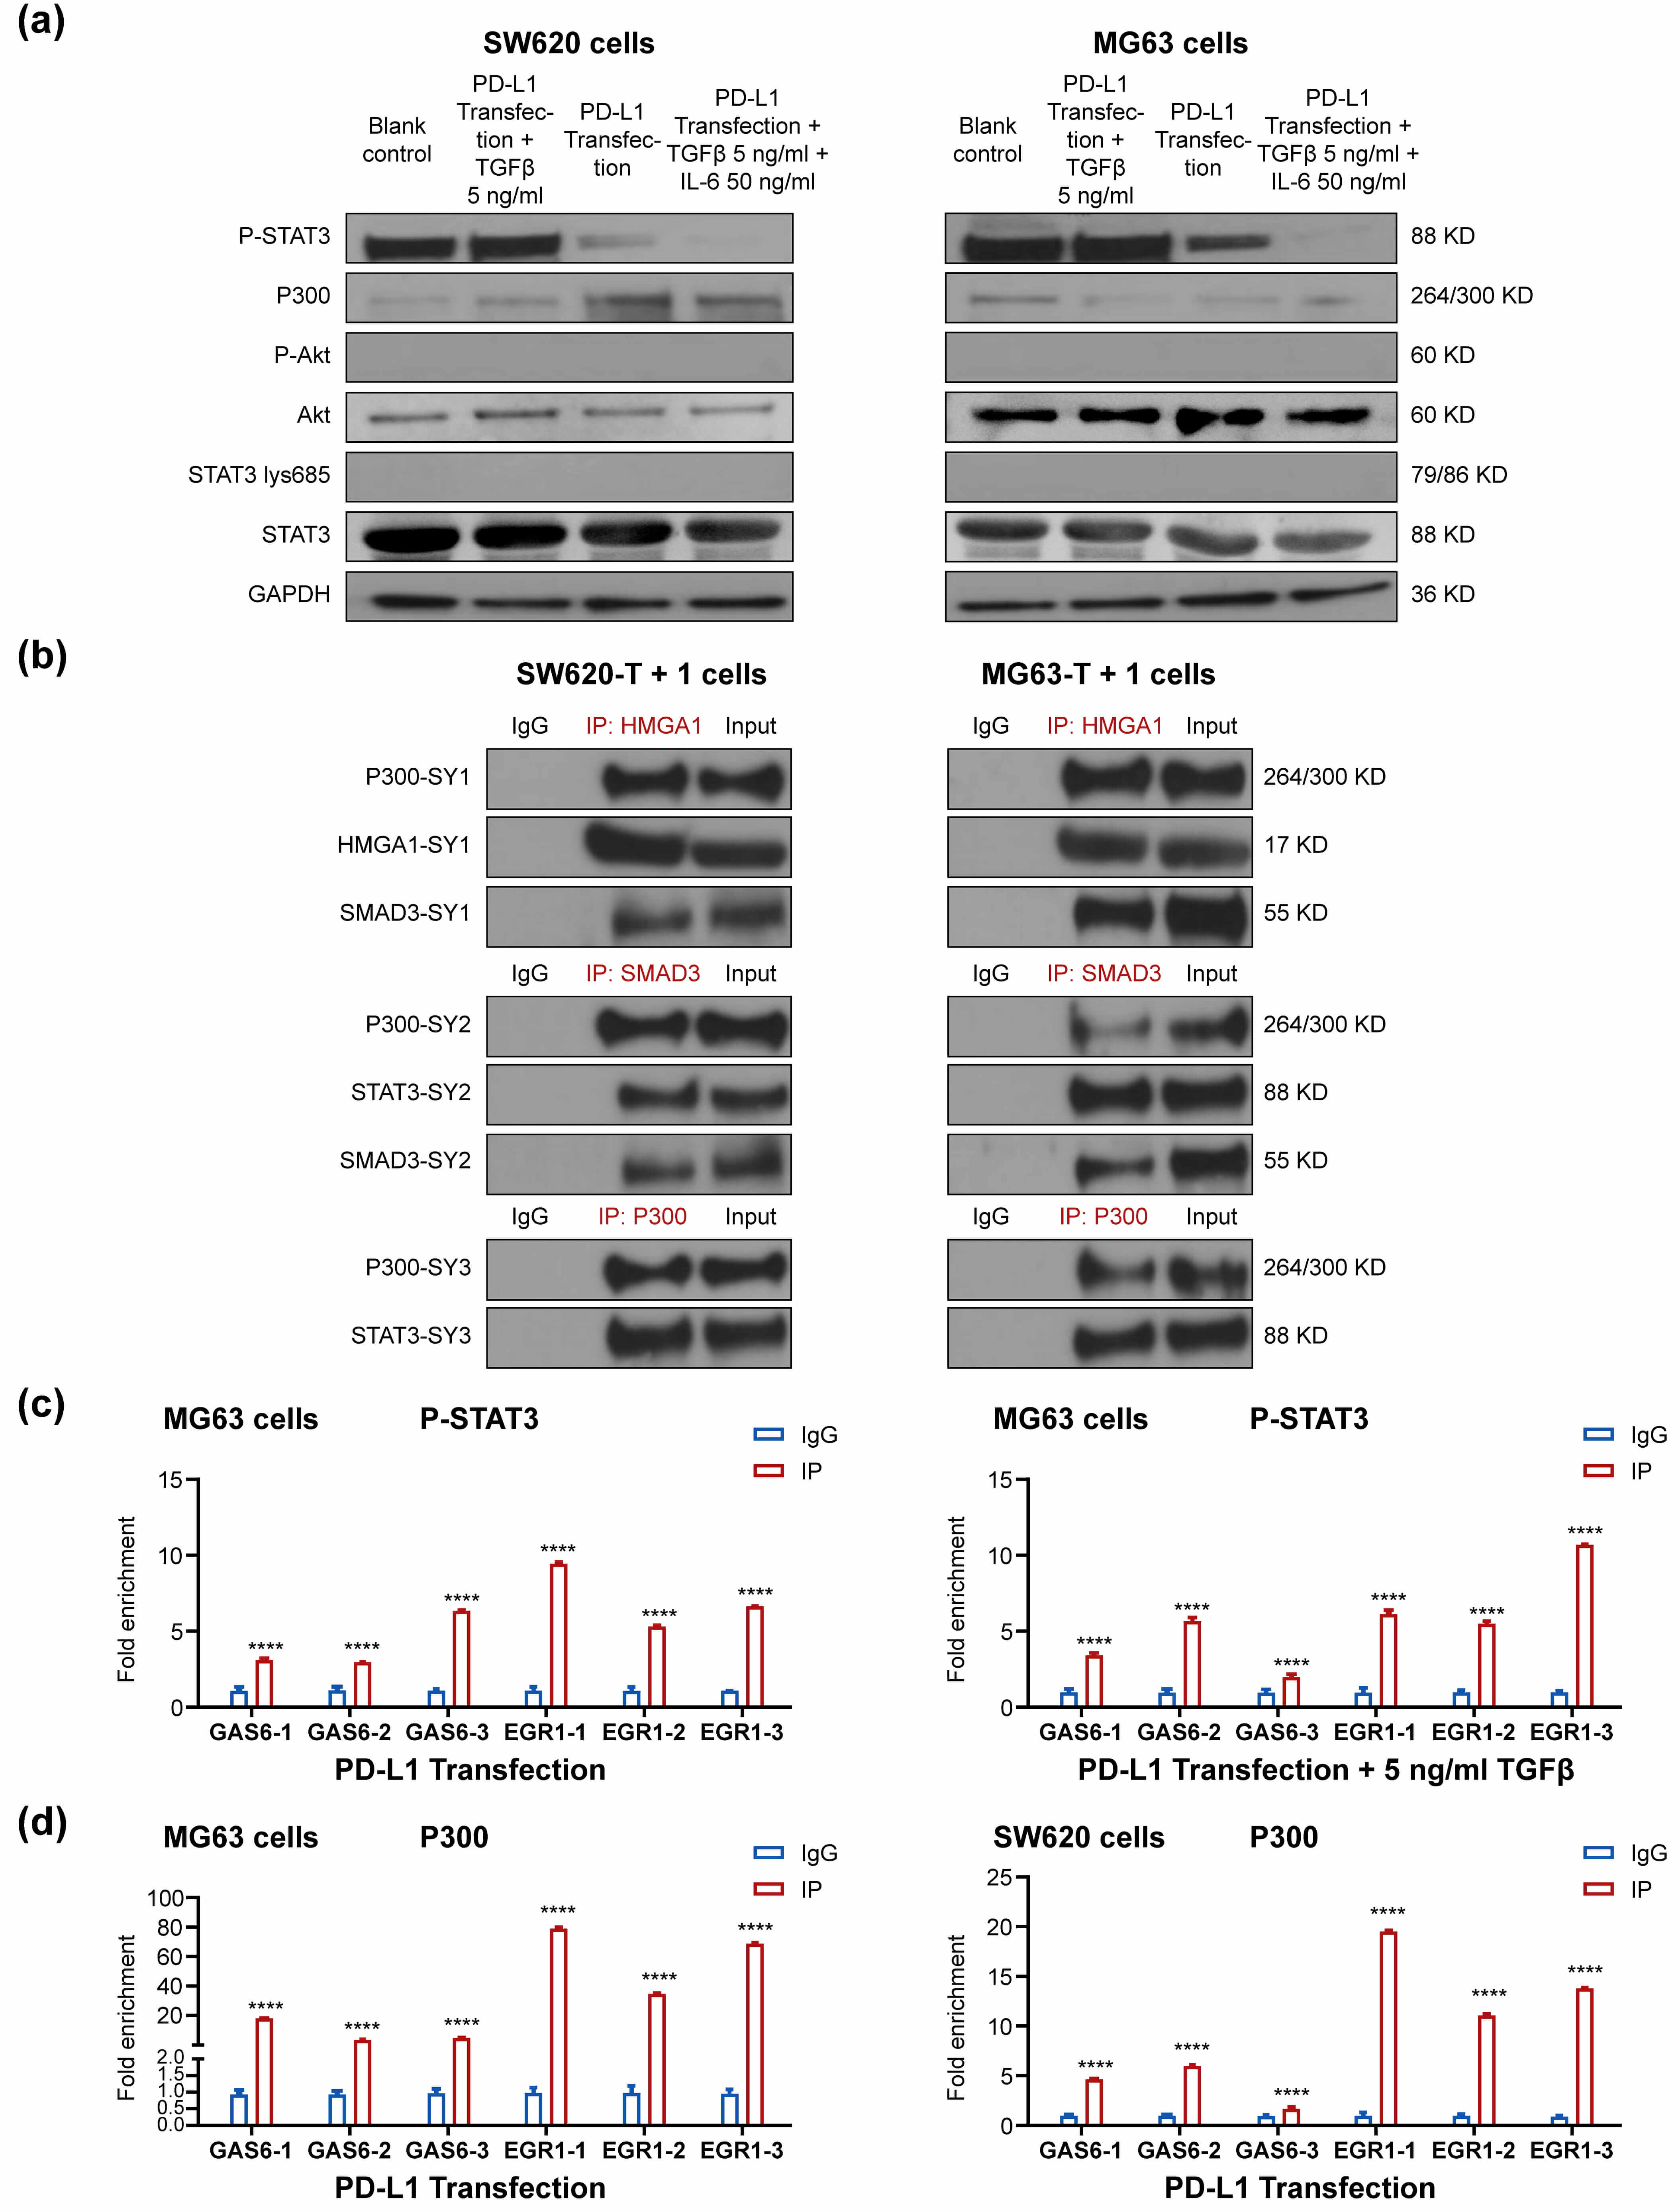 Fig. 3.
SW620 and MG63 cells were transfected with PD-L1 plasmids for 48
h, 42 h followed by 5 ng/mL TGF-
The ChIP results confirmed that P-STAT3 was enriched at the GAS6 and EGR1
promoters, both in the absence and presence of 5 ng/mL TGF-
We performed a series of ChIP and CoIP assays to determine whether PD-L1, SP1
and P300–STAT3 form an expedient complex at the GAS6 and EGR1 promoters in a
HMGA1- and SMAD3-dependent manner; however, whether this actually facilitates the
transcription of target genes GAS6 and EGR1 has not been examined.
Over-expression of PD-L1, PD-L1–HMGA1–SP1, PD-L1–SMAD3–SP1 and
P300–STAT3–SP1 in MG63 cells significantly elevated GAS6 mRNA by 31-, 17-, 19-
and 15-fold (p
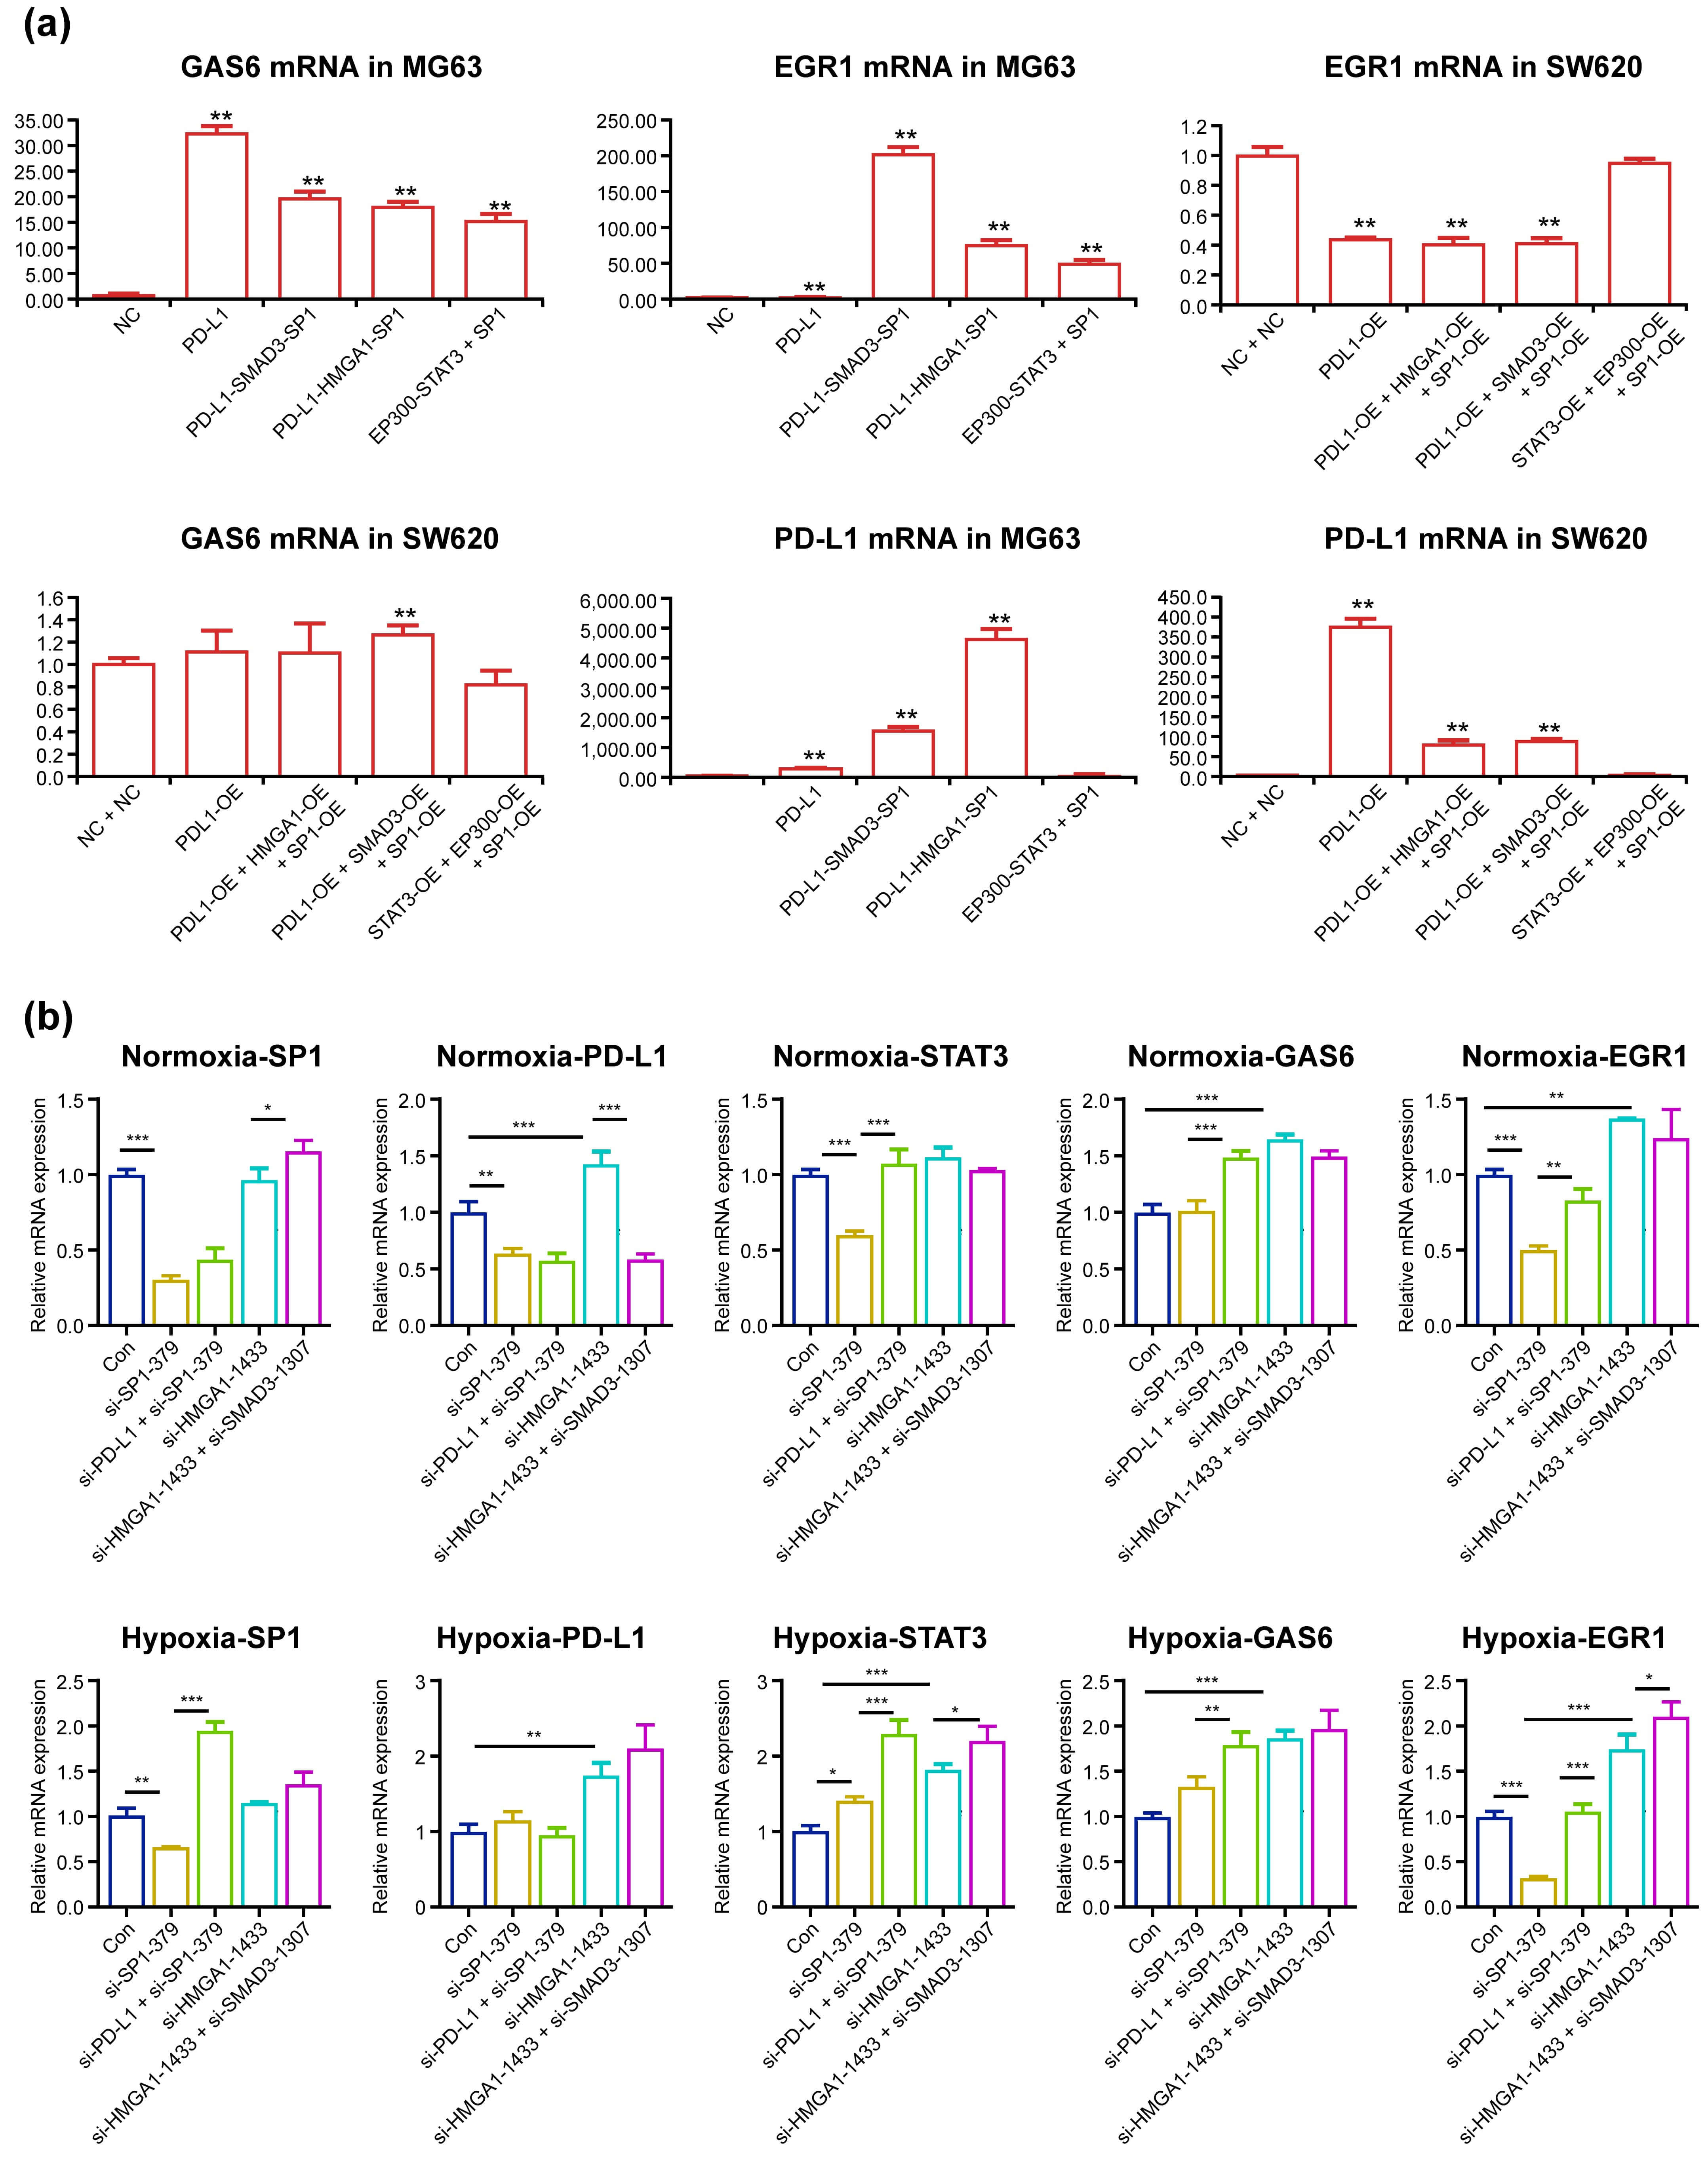 Fig. 4.
GAS6 mRNA and EGR1 mRNA significantly increased after PD-L1,
PD-L1–HMGA1–SP1, PD-L1–SMAD3–SP1 and P300–STAT3–SP1 over-expression and
decreased after SP1, PD-L1–SP1, HMGA1 and HMGA1–SMAD3 knockdown in SW620 cells.
Control plasmid or PD-L1 and HMGA1, SP1 or SMAD3 plasmids were transfected for
48 h under normoxic conditions or two cycles of 20 h under normoxic and 4 h under
hypoxic conditions. SW620 and MG63 cells were then harvested and subjected to
qPCR (a). Control plasmid or PD-L1 and other specific siRNAs against HMGA1, SMAD3
and SP1 were co-transfected for 48 h under normoxic conditions or two cycles of
20 h under normoxic and 4 h under hypoxic conditions. Then, SW620 cells were
harvested and subjected to qPCR (b). *p
Over-expression of PD-L1, PD-L1–HMGA1–SP1, PD-L1–SMAD3–SP1 and
P300–STAT3–SP1 in MG63 cells elevated EGR1 mRNA expression by 5-, 77-, 204- and
51-fold (all groups p
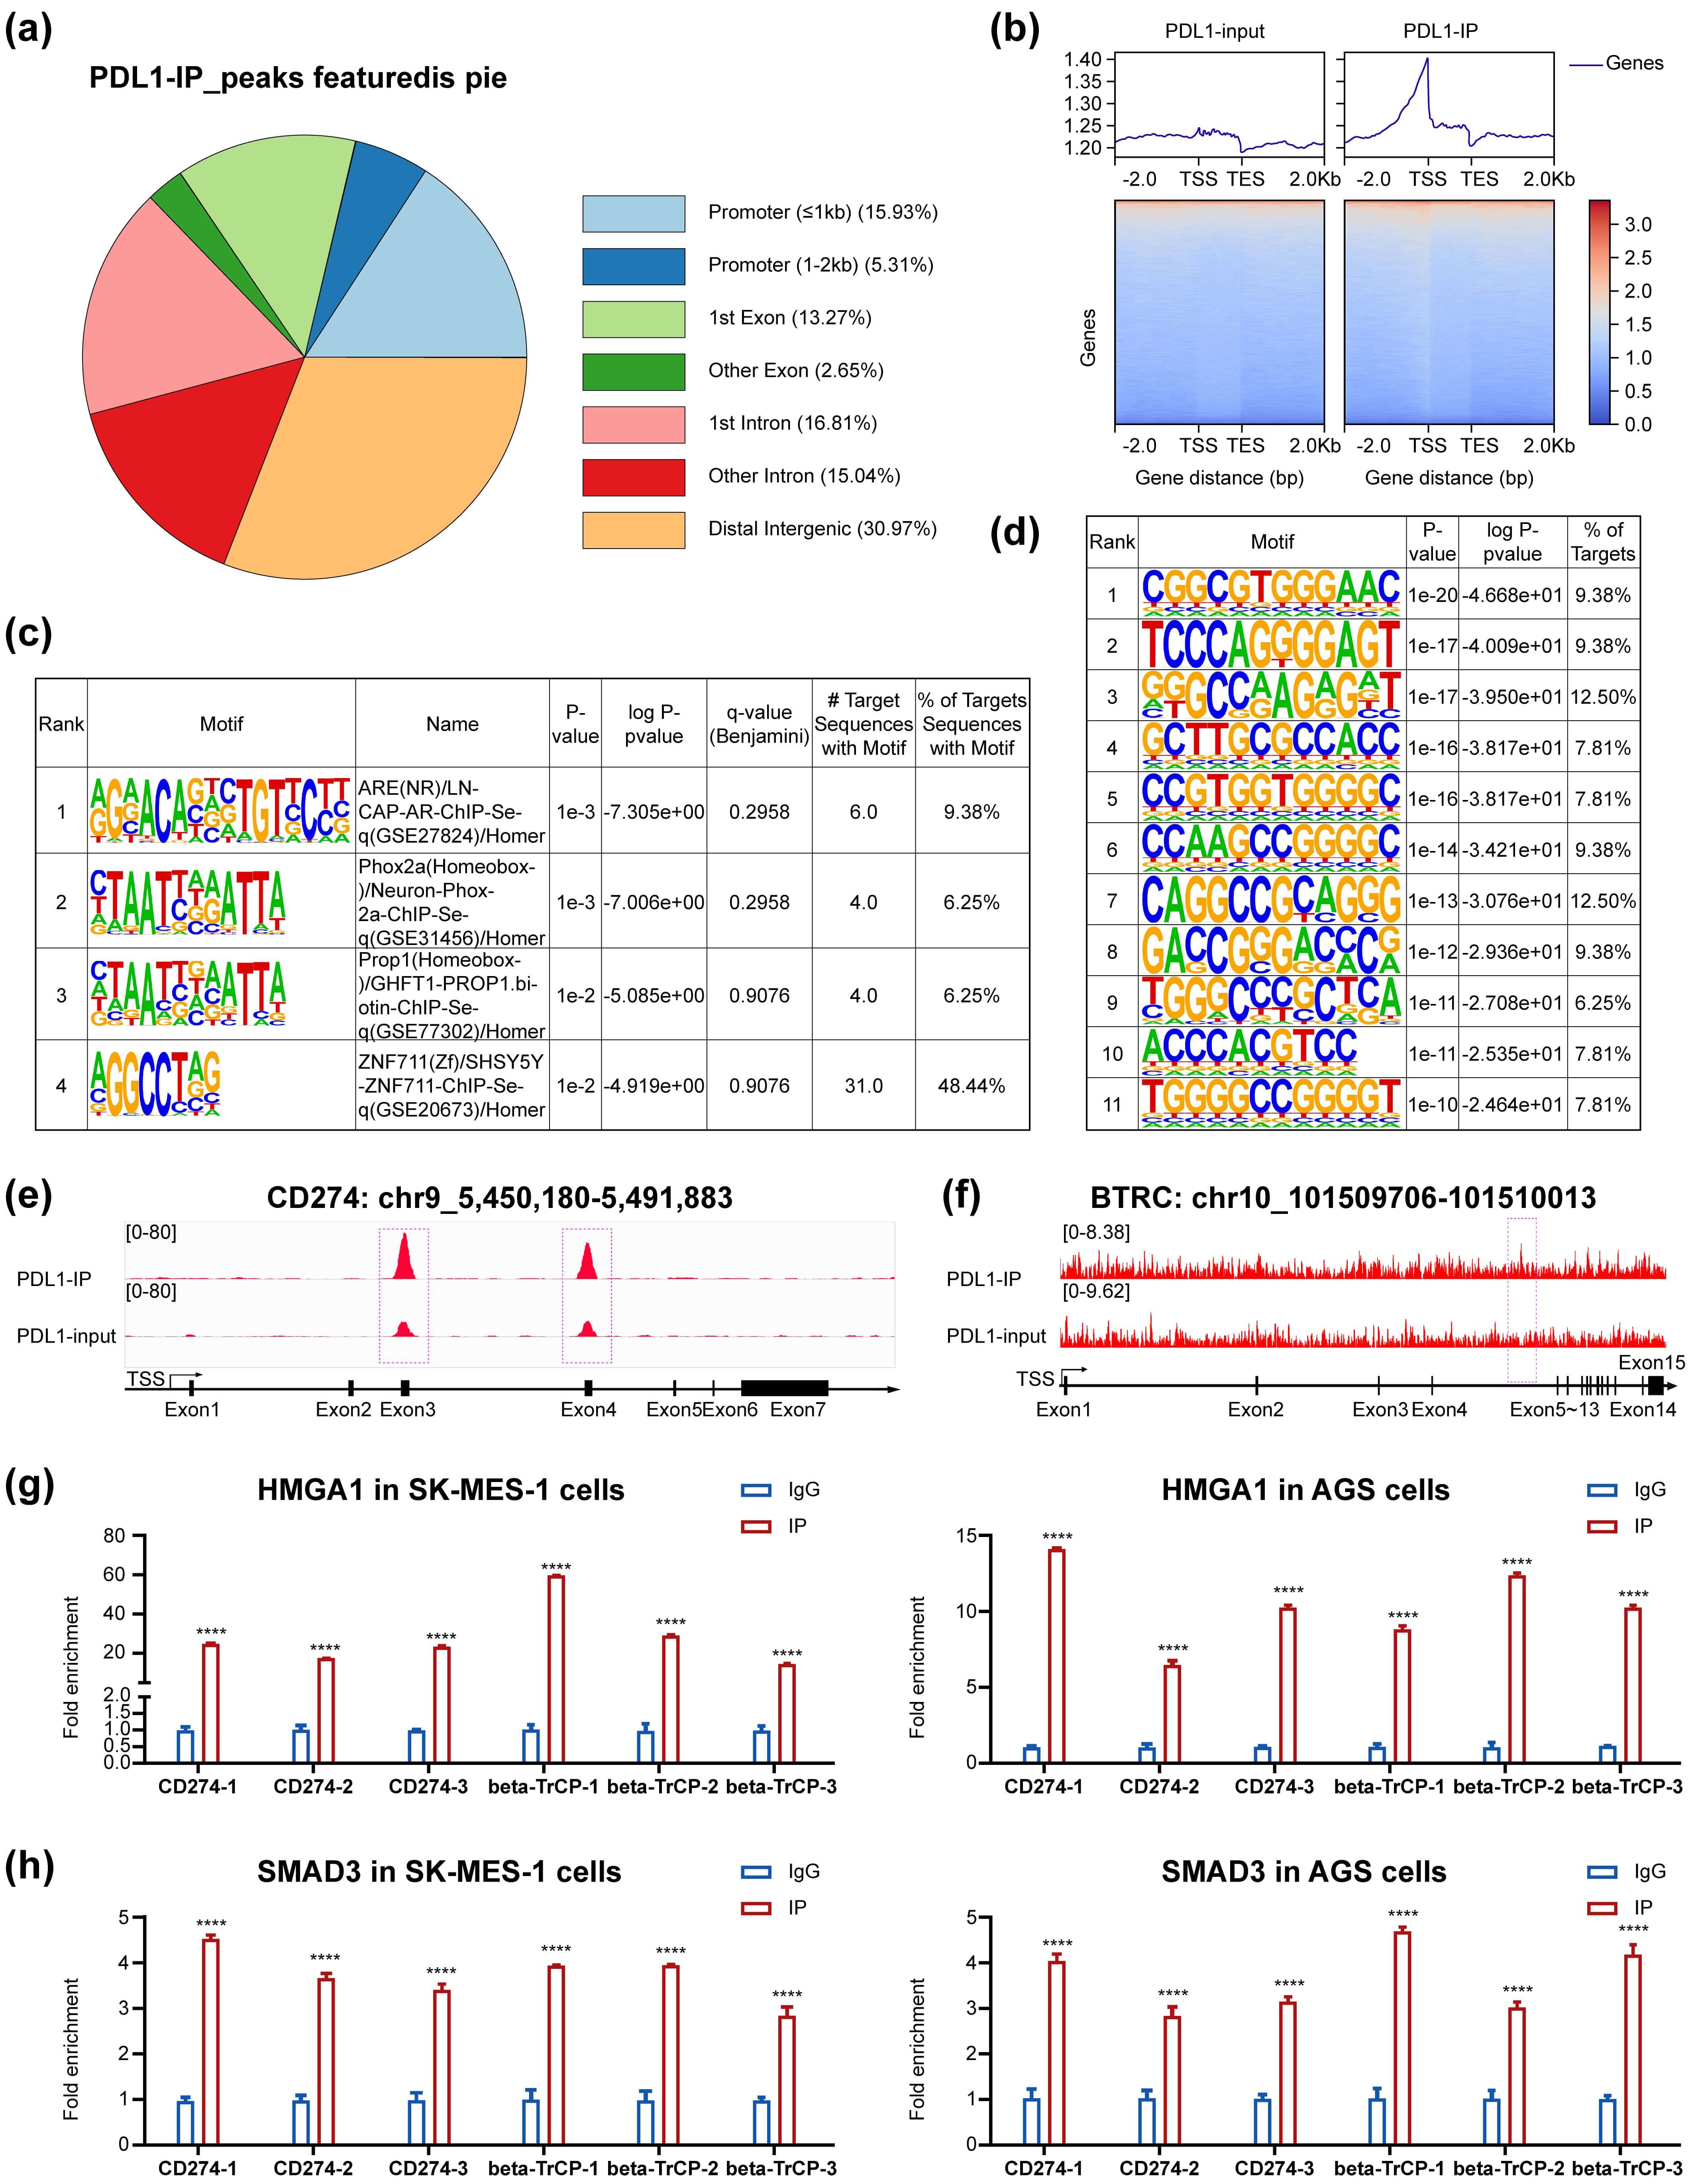
Our PD-L1 ChIP-seq results revealed that PD-L1 was enriched in the CD274/PD-L1
promoter (
As PD-L1 expression in MG63 cells was low in our preliminary study, SW620 with
adequate endogenous PD-L1 expression was chosen for knockdown experiments.
Successive knockdown of SP1, PD-L1–SP1 and HMGA1–SMAD3 altered PD-L1 mRNA by
0.641-, 0.578- and 0.589-fold, while knockdown of HMGA1 increased it by
1.140-fold (all p
PD-L1 ChIP-seq using PD-L1 over-expressed SW620 cells enabled the identification of 114 target genes, in contrast to the 1144 target genes previously reported via Cut&Tag in MUM2B cells [7] (Fig. 5a–d). Among these 114 target genes, we found two interesting newly delineated genes: CD274/PD-L1 and beta-transducin repeat-containing E3 ubiquitin protein ligase (BTRC), which targets many important proteins for ubiquitination and degradation (Fig. 5e,f).
 Fig. 5.
The PD-L1 ChIP-seq results, PD-L1 and BTRC
identified as PD-L1 target genes,HMGA1 and SMAD3 enrichment in newly identified
genes’ promoters in two new cell-lines. PD-L1 ChIP-seq revealed 114 target
genes, mostly near the transcript start site (a,b). Previously reported binding
motifs were confirmed in our study, with no new special binding motifs identified
(c,d). PD-L1 was newly found to be enriched at the CD274 and BTRC promoters
(e,f), and concomitant enrichment of HMGA1 and SMAD3 was also validated at these
promoters (g,h). BTRC, beta-transducin repeat containing E3 ubiquitin protein
ligase. ****p
PD-L1 complexes were found to boost CD274/PD-L1 transcription, generally
correlating with HMGA1, SMAD3, SP1, STAT3 and P300 up-regulation. TGF-
Nuclear expression of PD-L1 in lung, breast, colon, renal cell and hepatic cell cancers might be clinically associated with shorter survival duration or higher resistance to anti-PD1/PD-L1 therapies [9, 10]. Nuclear PD-L1 has been reported to regulate caspase-8-mediated pyroptosis [11], immune-related gene expression [7], genomic stability and sister chromatid cohesion [28] and GAS6 expression through coupling with SP1 to activate MerTK signaling in lung cancer [10]. To the best of our knowledge, it has not been determined whether nuclear PD-L1 binds to DNA directly or through its interaction with transcription factors. There are 1144 PD-L1 binding sites genome-wide, according to the latest report [9]. These are mainly distributed near the transcription start sites, supporting a transcription regulatory function; however, the number of PD-L1 binding sites is much lower than that for SP1, with over 12,000 known sites [29]. Therefore, it is quite likely that there exist mediators that facilitate the PD-L1- and SP1-associated regulation of target gene transcription.
Hydrogen peroxide, serum deprivation and temozolomide have been shown to
up-regulate cancer stem cell (CSC)-related genes in glioblastoma cells via SP1
[30]. Furthermore, PD-L1 expression is increased in chemo-resistant colorectal
cells, promoting colorectal CSC self-renewal by up-regulating stemness genes via
direct interaction with HMGA1 [19]. On the other hand, TGF-
The EGR1 promoter comprises five serum response elements and two SP1 sites [32],
similarly to the Tenascin-C promoter, in which the SMAD3 complex translocates to
the nucleus and binds Ets1 and SP1 to regulate gene expression in cooperation
with P300 [11]. In our study, SMAD3 and HMGA1 were confirmed to concomitantly
bind PD-L1 and SP1, while P300 was shown to concomitantly bind p-STAT3, HMGA1 and
SMAD3. These results support the idea that P300–STAT3 joins up with the
PD-L1–SMAD3–SP1 and PD-L1–HMGA1–SP1 complexes to form a whole to bind the
EGR1 promoter. In the case that HMGA1 directly connects to SMAD3 as a whole to
bind P300–STAT3, the combined PD-L1 and SP1 could be reduced to only one pair.
PD-L1, HMGA1, SMAD3, SP1, STAT3 and P300 were consistently enriched at the EGR1
promoter in MG63 and SW620 cells. PD-L1 over-expression has been shown to
activate the PI3K/AKT pathway in head and neck squamous cell carcinoma. This
pathway is also triggered by IL-6, leukemia inhibitory factor (LIF) and
oncostatin M, leading to P300-mediated acetylation of STAT3 at Lys685, which
enhances its DNA binding affinity and transcriptional activity [25]. In contrast,
we did not detect STAT3 Lys-685 acetylation and p-AKT after PD-L1 over-expression
with/without TGF-
The PD-L1 complexes dramatically elevated GAS6 and EGR1 mRNA in MG63 cells, but
only one group slightly increased GAS6 mRNA, and all (except one) did not
decrease EGR1 mRNA in SW620 cells in a significant manner. Although the
underlying reasons for these discrepancies are currently unknown and warrant
further investigation, we offer some explanations here. The existence of RNA
polymerase II holoenzyme assembly, initiation repressing [35] or transcription
silencing [36] mechanisms might underlie the transcript differences in MG63 and
SW620 cells. Furthermore, the PD-L1 complex formation process might incorporate
or upregulate some transcription factors, leading to down- or up-regulation of
target gene transcription. When the transcription enhancement mechanism is at
work, the mRNA expression levels increased by more than 5-fold; meanwhile, when
the enhancement mechanism was impeded, with regard to whether the transcript
factors were incorporated or released, the mRNA expression levels fluctuated
between 0.40- and 2-fold. Our PD-L1 ChIP-seq results revealed for the first time
that PD-L1 was enriched at the CD274/PD-L1 gene promoter, and HMGA1 and SMAD3
were also newly found to be enriched at the same promoter, thus confirming the
existence of our proposed complex. Accordingly, PD-L1 mRNA considerably increased
in PD-L1, PD-L1–HMGA1–SP1 and PD-L1–SMAD3–SP1 groups in MG63 and SW620 cells.
The aforementioned treatments dramatically elevated PD-L1 transcription in MG63
cells by 384-, 4647- and 1628-fold (p
Knockdown of SP1 and PD-L1–SP1 significantly reduced SP1 and PD-L1 expression
under normoxic conditions, while knockdown of both HMGA1 and HMGA1–SMAD3
elevated GAS6 and EGR1 mRNA under normoxic conditions; this is likely due to
knockdown of HMGA1 elevating PD-L1 mRNA expression through some unknown
compensation mechanism. Under hypoxic conditions, PD-L1 mRNA expression was
elevated with the knockdown of HMGA1 and HMGA1–SMAD3, likely through
Hypoxia-inducible Factor-1 binding with the PD-L1 gene promoter, which
accordingly increased GAS6 and EGR1 mRNA levels. Intriguingly, under both
conditions, knockdown of SP1 in SW620 cells significantly reduced EGR1 mRNA
(p
Taken together, despite the complexity of the proposed concept and the crudeness of our methods, our findings support a novel model in which PD-L1, SMAD3, SP1 and HMGA1 complexes and P300–STAT3 form an expedient complex to bind the GAS6 and EGR1 promoters in SW620 and MG63 cells in order to modulate mRNA transcription. Consistent with this model, PD-L1, HMGA1 and SMAD3 were confirmed for the first time to be enriched at the newly identified CD274/PD-L1 and BTRC gene promoters. These novel findings validate our proposed complex, which dramatically boosted PD-L1 mRNA expression in the PD-L1, PD-L1–HMGA1–SP1 and PD-L1–SMAD3–SP1 groups and slightly decreased it in the P300–STAT3 group in MG63 and SW620 cells. The associated effects on BTRC expression and functions warrant further investigation. Our identification of PD-L1 enrichment at the CD274 and BTRC promoters not only evidences an unprecedented self-reinforcing transcriptional circuitry driving PD-L1 expression, but also opens new avenues for targeting this regulatory axis to overcome immune evasion in cancer through the modulation of PD-L1 protein homeostasis, inducing its targeted degradation or inhibiting its nuclear transport [37]. The discovery of PD-L1-mediated regulation of BTRC—a key modulator of protein stability and signaling cascades—provides a novel mechanistic link between immune checkpoint control and cellular degradation machinery, suggesting potential dual-therapeutic strategies for aggressive cancers [38]. By elucidating the cooperative binding of PD-L1-containing complexes to the GAS6 and EGR1 promoters, our work establishes a foundational framework for exploiting transcriptional co-regulators in high-PD-L1 tumors, thereby paving the way for next-generation epigenetic and immune combination therapies [39, 40]. The accurate structure of the expediently modeled PD-L1 complex and its precise mode of action in conjunction with RNA polymerase II to modulate gene transcription are still in the initial stage of exploration. However, these insights are expected to pave the way for further research on PD-L1-regulated immune and non-immune genes, which might lead to innovation in PD-L1-targeted therapies for cancer and sarcoma.
Our findings support a model wherein a complex comprising HMGA1, SMAD3, SP1 and PD-L1 binds to the promoters of 114 target genes—including GAS6, EGR1 and CD274 (PD-L1 itself)—to regulate their expression. Although this proposed mechanism provides a foundational framework for understanding this regulatory axis, further validation is required to fully elucidate the composition and functional dynamics of the proposed complex.
The relevant data are presented in the five figures and the Supplemnentary Material. All data are available from the corresponding authors by reasonable request.
WL: conception of the work. WL and HG: composition of the figures. WL, PT: acquisition, analysis, and interpretation of the literature. WL: drafting and revising the manuscript. All authors contributed to editorial changes in the manuscript. All authors read and approved the final manuscript. All authors have participated sufficiently in the work and agreed to be accountable for all aspects of the work.
Not applicable.
We thank all the reviewers for contributing to this article. We would like to express our gratitude to all those who helped us during the experiments and the writing of this manuscript.
Funding was obtained from Wei Liu, Hunan Provincial Health Commission Foundation of China (No.20257169).
The authors declare no conflict of interest.
Supplementary material associated with this article can be found, in the online version, at https://doi.org/10.31083/FBL46743.
References
Publisher’s Note: IMR Press stays neutral with regard to jurisdictional claims in published maps and institutional affiliations.