


 , Xueting Wang 1,†, Yaomei Wang 1, Yushan Cui 1, Baijun Fang 1,*
1 Department of Hematology, The Affiliated Cancer Hospital of Zhengzhou University & Henan Cancer Hospital, 450008 Zhengzhou, Henan, China
2 Department of Hematology, Puyang Oilfield General Hospital, 457001 Puyang, Henan, China
†These authors contributed equally.
Abstract
Although epirubicin is used among therapeutic options for multiple myeloma (MM), its clinical use remains limited, in part because the subgroup of patients most likely to benefit has not been clearly defined. Identifying robust biomarkers capable of predicting chemosensitivity is therefore essential to aimed personalized treatment strategies and enhance therapeutic outcomes. This study sought to characterize the molecular effects of epirubicin in MM cells, elucidate its tumor-suppressive mechanisms, and determine potential indicators for patient stratification.
The half-maximal inhibitory concentration (IC50) for epirubicin was quantified using the Cell Counting Kit-8 (CCK-8) viability assay. Gene expression alterations before and after epirubicin exposure were investigated via microarray profiling, followed by bioinformatic interrogation of publicly available datasets to examine the prognostic value of CDC20 expression in MM. Subsequently, functional validation was performed through in vitro assays and in vivo xenograft models to evaluate the impact of epirubicin on cell-cycle progression and tumor growth.
Epirubicin exhibited an IC50 of 23.85 μM in MM.1R cells. Transcriptome analysis revealed 115 genes upregulated and 25 genes downregulated post-treatment. Among the significantly altered genes were CDC20 (log FC = –2.409), KIF20A (log FC = –1.693), FAM72A (log FC = –1.742), CCNB1 (log FC = –1.787), PIF1 (log FC = –2.201), and LMNB1 (log FC = –1.589). Higher CDC20 expression was associated with shorter overall survival (OS), event-free survival (EFS), and post-progression survival (PPS). Mechanistic studies demonstrated that epirubicin triggers G2/M arrest in MM cells by suppressing CDC20, and in vivo experiments corroborated that decreased CDC20 expression contributes to reduced tumor proliferation via cell-cycle blockade.
Epirubicin exerts anti-myeloma effects by downregulating CDC20 and inducing cell-cycle arrest in MM, highlighting CDC20 as a potential biomarker for identifying MM patients likely to benefit from epirubicin.
Keywords
- CDC20
- multiple myeloma
- epirubicin
- cycle arrest
Multiple myeloma (MM) is a hematologic malignancy in which plasma cells undergo clonal expansion accompanied by excessive monoclonal immunoglobulin production [1]. Advances in therapeutic modalities, including proteasome inhibitors (e.g., carfilzomib, ixazomib, bortezomib), immunomodulatory drugs (thalidomide, pomalidomide, lenalidomide), monoclonal antibodies (daratumumab), and cellular immunotherapies such as CAR-T technology, have markedly enhanced the prognosis of MM patients over recent decades [2, 3, 4]. Nevertheless, MM exhibits pronounced biologic and clinical heterogeneity, leading to variable treatment responses and survival outcomes. Consequently, there is an urgent clinical need to identify predictive biomarkers that can reliably indicate sensitivity to specific therapies and assist in tailoring treatment regimens to optimize patient benefit.
Anthracycline compounds, including epirubicin hydrochloride, have been utilized in MM therapy [5], although the subset of patients likely to respond remains undefined. This limitation curtails its widespread clinical adoption and contributes to its infrequent use as a first-line agent. Thus, clarifying the molecular mechanisms underlying epirubicin activity and identifying patients who might derive significant benefit are essential to enhance therapeutic precision and survival outcomes. Additionally, resistance to existing treatments frequently develops in MM, culminating in disease relapse for the majority of patients [6]. Determining whether individuals with relapsed or refractory MM may preferentially respond to epirubicin is of particular interest. Accordingly, this study was developed to investigate changes in gene expression induced by epirubicin in MM cells to reveal its primary molecular targets, integrating clinical survival datasets associated with these specific targets in order to delineate patient subgroups for whom epirubicin-based regimens may be most advantageous.
Human MM.1R, ARD, and RPMI-8226 MM cell lines were from the American Type Culture Collection (ATCC). Short tandem repeat (STR) profiling confirmed cell identity, and cultures tested negative for mycoplasma. Cells were maintained in RPMI-1640 medium (01-106-1A, Biological Industries Inc., Beit Haemek, Israel) with 10% fetal bovine serum (A5256701, Gibco, Shanghai, China) at 37 °C in a humidified 5% CO2 incubator.
MM.1R cells were seeded into 96-well plates and exposed to epirubicin hydrochloride (56390-09-1, Selleck, Shanghai, China) for 48 h. CCK-8 reagent (10 µL/well; C0038, Beyotime Biotechnology, Shanghai, China) was added 4 h before endpoint measurement. Optical density was recorded at 450 nm via microplate reader (Varioskan™ ALF Multimode, Thermo Fisher Scientific Inc., shanghai, China). The inhibitory concentration (IC)50 was subsequently used for microarray analysis, Western blotting, and cell-cycle assays.
MM.1R cells (2
Total RNA was extracted using TRIzol (15596-018, Solarbio, Shanghai, China), and
cDNA synthesis was performed using the Vazyme RT Reagent Kit (P612,
Vazyme, Shanghai, China). Reactions were run in triplicate using AceQ SYBR Green
Master Mix (Q111-02, Vazyme, Shanghai, China) on a VIIA-7 PCR system (Thermo
Fisher Scientific Inc., shanghai, China). Relative expression was calculated by the
2-ΔΔCT method, normalized to GAPDH. Primer sequences were:
CDC20 (Sangon Biotech, China) 5′-AATGGAGCAGCCTGGGGAATA-3′ (sense) and
5′-CGGGCAGAGTGACTGGTCATAT-3′ (antisense). GAPDH (SangonBiotech, Shanghai,
China) 5′-TGACTTCAACAGCGACACCCA-3′ (sense) and 5′-CACCCTGTTGCTGTAGCCAAA-3′
(antisense). Experiments were repeated
Full-length CDC20 sequences were cloned into LV-002 and LV-003 vectors (BGI, Shanghai, China). Control vectors were purchased from YBR (Shanghai, China). HEK-293T cells were transfected using Lipofectamine™ 2000 (Invitrogen, Shanghai, China) along with packaging plasmids pMD2.G and psPAX2 (pMD2.G #12259, psPAX2 #12260, Addgene, MA, USA). Viral supernatants were harvested at 48 h and used to transduce MM.1R cells in the presence of 0.1% polybrene (H-8968, Sigma-Aldrich, Shanghai, China).
Immediately following cell harvest, total proteins were isolated using RIPA
lysis buffer supplemented with protease inhibitors (R0010, Solarbio, Shanghai,
China). Lysates were clarified by centrifugation at 12,000
After collection, cells were fixed in pre-chilled 70% ethanol at –20 °C overnight. Fixed cells were washed with PBS and stained using a cell-cycle detection kit (KGA9101-50, KeyGen Biotech, Shanghai, China) according to the manufacturer’s protocol. DNA content and distribution across cell-cycle phases were assessed by flow cytometry (FACSCanto™ II, BD Biosciences, USA), and the proportion of cells in each phase was quantified.
Six-week-old female nude mice were obtained from Hangzhouziyuan Experimental
Mobility Co., Ltd. Animals received subcutaneous and intravenous injections of 2
Euthanasia protocol: Based on American Veterinary Medical Association (AVMA) standards, mice were euthanized via CO2 exposure to ensure humane termination. The surgery performed on the mice requires anesthesia. The anesthetic used is tribromophenol, with a concentration of 1.25%, and the dosage for each mouse is 200 µL. Place the animal in the box and slowly inject CO2 into the box at a rate of 10–30% of the box’s volume per minute (for this system, a 20% volume flow rate is 5.8 L/min. Adjust the flow rate by turning the left knob). Ensure that the animal is motionless, not breathing, and its pupils are dilated. Turn off the CO2 cylinder switch and observe for another 2–3 minutes to confirm the animal’s death.
Quality control procedures included assessment of intensity distributions,
normalization, sample correlation analysis, and principal-component analysis.
Probes with mean signal values below 0.005 were removed. Differentially expressed
genes (DEGs) were identified using an empirical Bayes-based linear-model approach
to determine p-values, minimizing false-positive rates. Significant
genes were defined using
Four publicly available datasets were utilized for this study, including GSE24080, GSE4204, GSE57317, and GSE9782. The details of these datasets were as follows: GSE24080: Contributed by the Myeloma Institute for Research and Therapy at the University of Arkansas for Medical Sciences, comprising 340 training and 214 validation samples; GSE4204: Consisted of pre-treatment bone-marrow aspirates from MM patients; GSE57317: Included gene-expression profiles from 55 previously treated MM patients; GSE9782: Contained data from a bortezomib clinical trial cohort (528 samples), representing proteasome-inhibitor-treated MM.
SPSS software (SPSS Statistics 27, IBM, NY, USA) or Microsoft Excel 2010
(Microsoft, WA, USA) were used for all analyses. Results are expressed as mean
Gene-expression profiling was performed to compare MM cells before and after
epirubicin hydrochloride treatment. A total of 115 transcripts were significantly
upregulated, whereas 25 genes were significantly downregulated (Fig. 1A,B).
Functional enrichment analysis of upregulated genes (log FC
 Fig. 1.
Differentially expressed gene analysis. (A) Volcano plot
showing differentially expressed genes. (B) Heatmap of differentially expressed
genes. (C) Enrichment analysis of upregulated DEGs. (D) Enrichment analysis of
downregulated DEGs. (E) Enrichment analysis of significantly down-regulated genes
(log FC
To elucidate the molecular pathways and biological functions modulated by
epirubicin in MM cells, genes exhibiting marked expression shifts were subjected
to enrichment analysis using Metascape. Functional clustering focused on
transcripts that showed a pronounced increase (log FC
CDC20 has previously been identified as one of the most highly upregulated chromosomal instability-related regulators in MM, promoting proliferation and contributing to therapeutic resistance [8]. High-risk MM cohorts demonstrate elevated CDC20 expression, and enhanced CDC20 activity correlates with worse clinical outcomes [9]. Functional suppression of CDC20 has been reported to induce metaphase arrest and apoptosis in MM models, supporting the concept that the APC/C-CDC20 axis represents a promising therapeutic target, particularly in aggressive disease subsets [9]. Consistent with these observations, our microarray profiling identified CDC20 as the most significantly suppressed transcript following epirubicin treatment, raising the possibility that individuals with inherently high CDC20 expression could derive enhanced benefit from epirubicin-based therapy.
Although previous work has linked elevated CDC20 levels to inferior survival in MM, heterogeneity across molecular subgroups remains poorly explored. Identifying which patient groups derive the greatest benefit from therapeutic modulation of CDC20 is a major priority in precision oncology. To refine this association, we examined survival outcomes in a cohort of 1416 MM patients integrated through the KMplot platform, incorporating four datasets: GSE24080 [10], GSE4204 [11], GSE57317 [12], and GSE9782 [13, 14]. Across the full cohort, increased CDC20 expression was significantly associated with reduced overall survival (OS), event-free survival (EFS), and post-progression survival (PPS). Similar trends were observed among male patients, whereas in female patients, only the PPS correlation remained but did not reach statistical significance (Fig. 2). When stratified by immunoglobulin subtype, elevated CDC20 expression corresponded to shortened PPS in the serum free light chain (FLC) group and was strongly linked to inferior OS, EFS, and PPS in immunoglobulin A (IgA) and immunoglobulin G (IgG) subtypes. Interestingly, in the light chain subtype subset, high CDC20 expression was paradoxically associated with improved OS and PPS outcomes (Fig. 3).
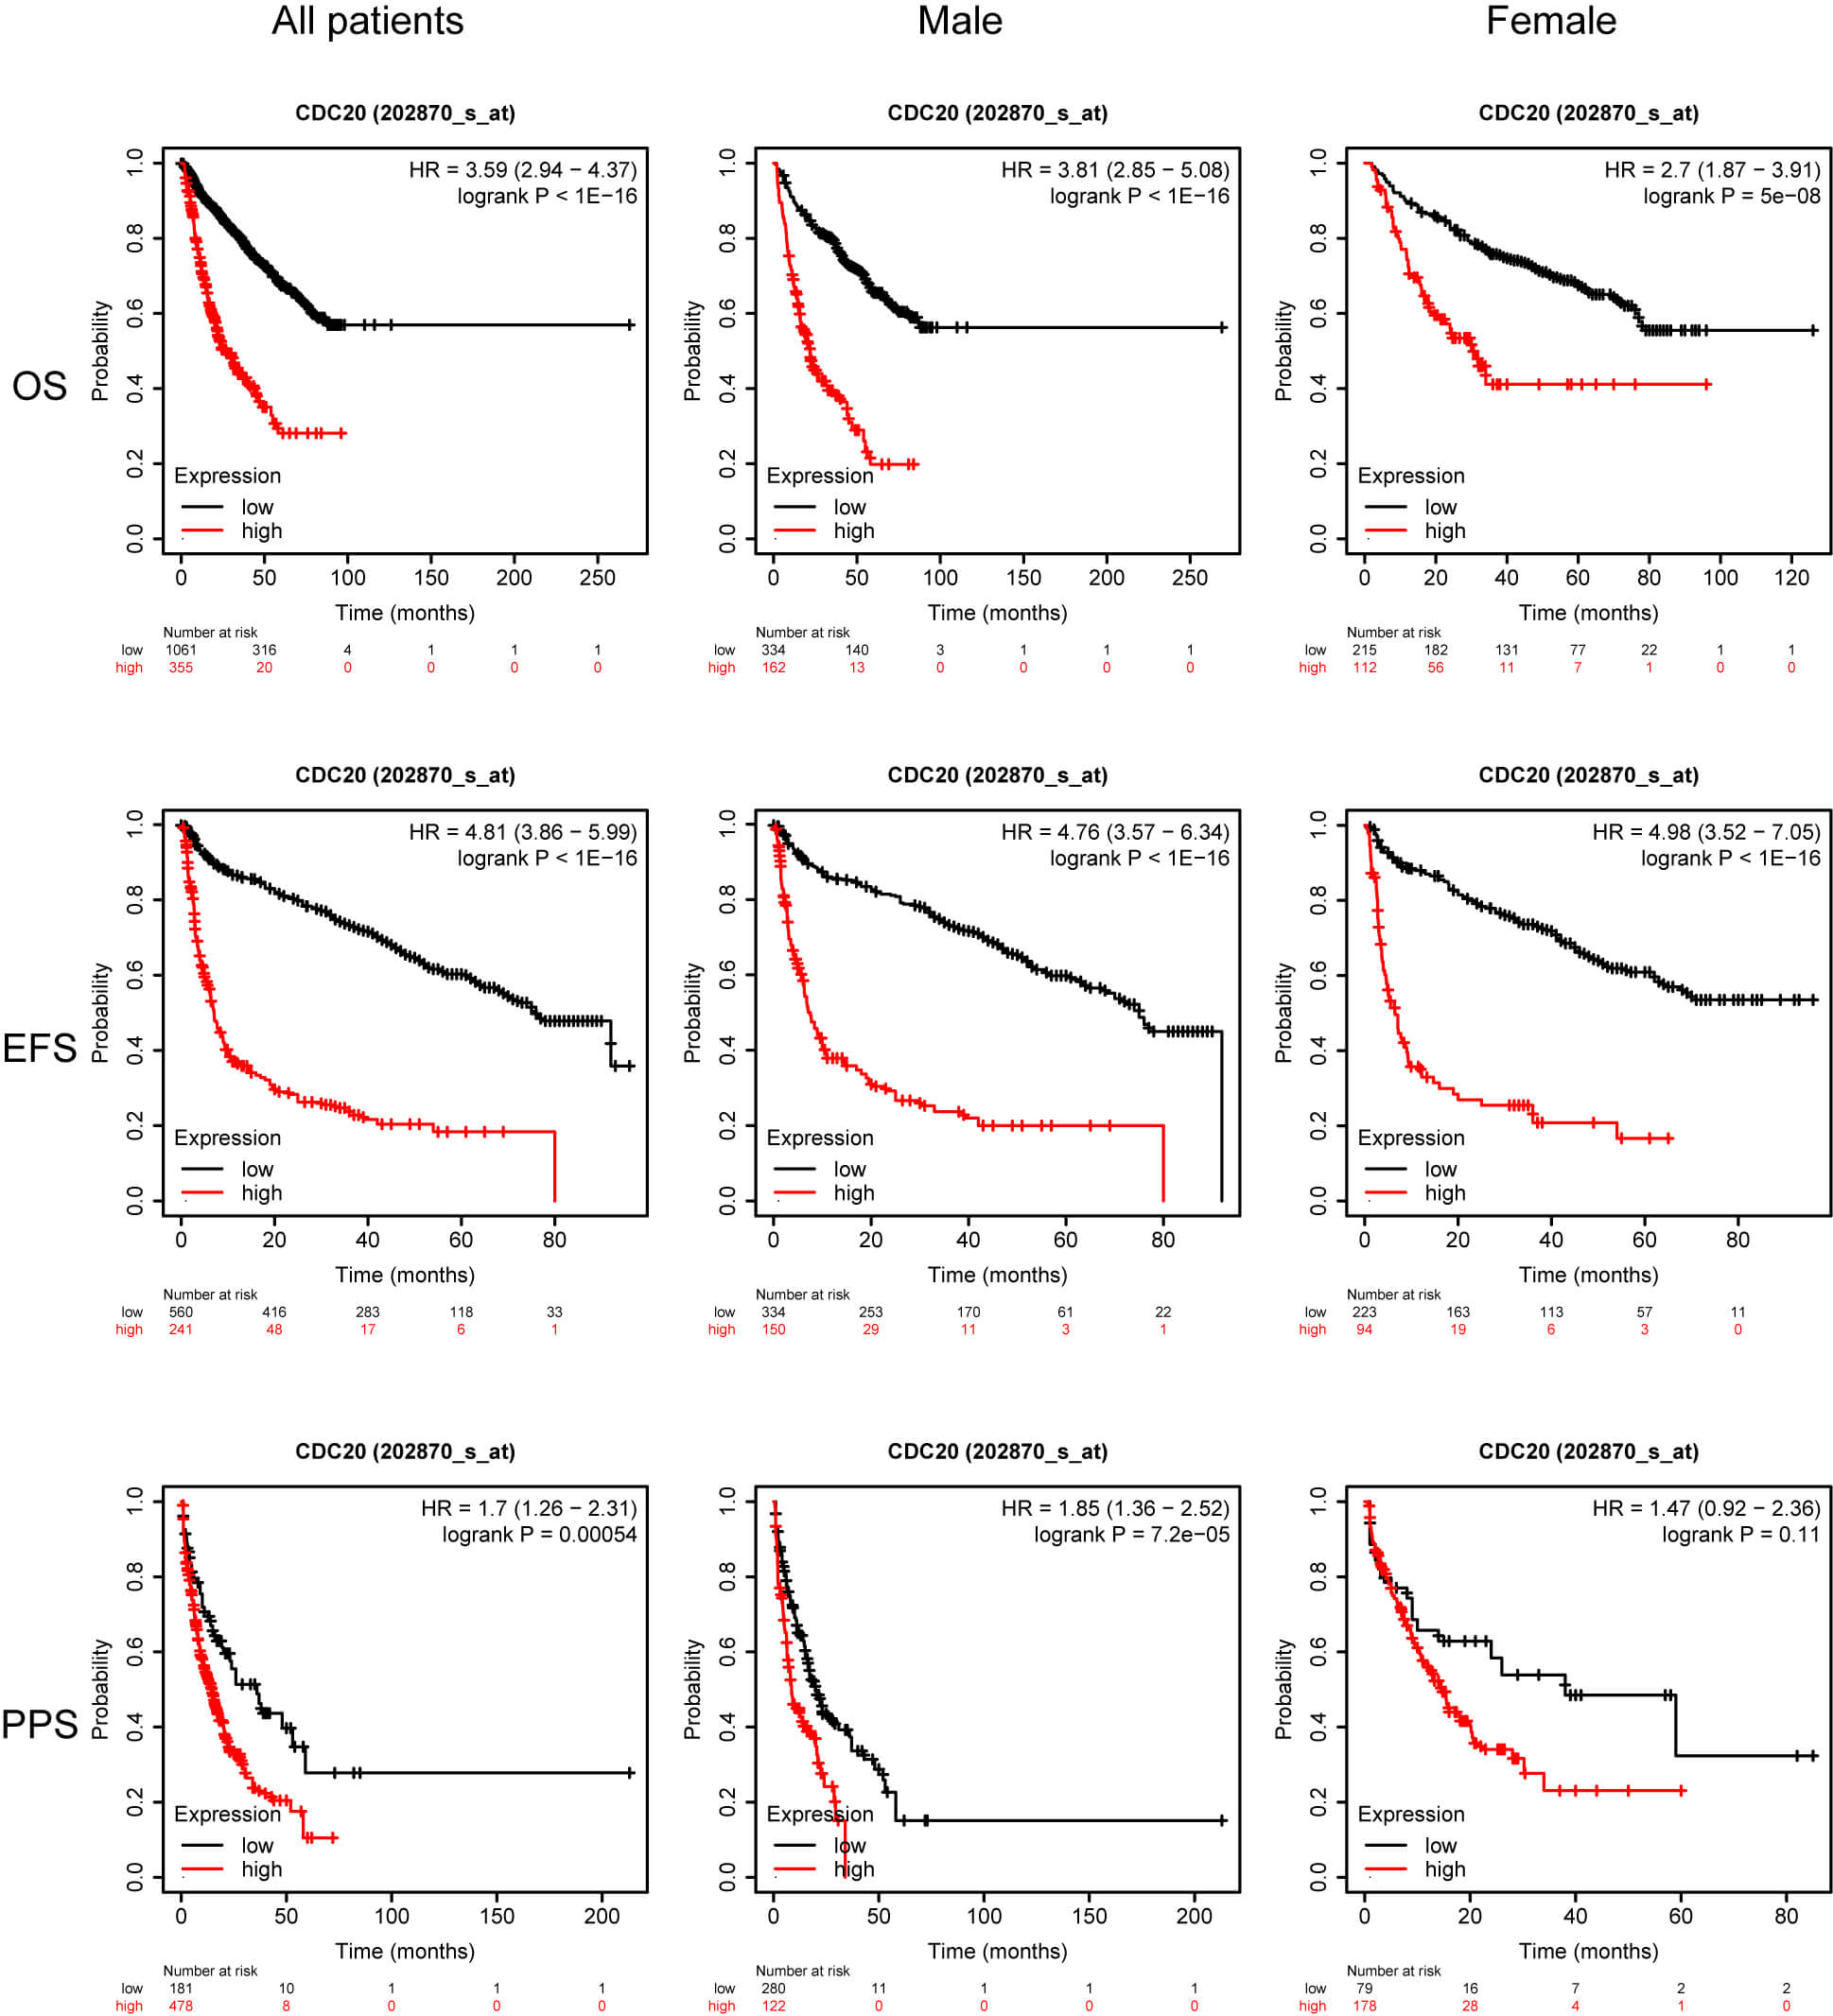 Fig. 2.
OS, EFS, and PPS for patients stratified based on sex and CDC20 expression. OS, overall survival; EFS, event-free survival; PPS, post-progression survival.
 Fig. 3.
OS, EFS, and PPS for patients stratified according to CDC20 expression and myeloma subtype. OS, overall survival; EFS, event-free survival; PPS, post-progression survival; FLC, serum free light chain; IgA, immunoglobulin A; IgG, immunoglobulin G.
Given CDC20’s critical role in coordinating mitotic progression, we next analyzed cell cycle distribution prior to and following epirubicin exposure. As illustrated in Fig. 4A, epirubicin treatment caused a marked accumulation of cells in the G2/M phase, with MM.1R cells increasing from 20.1% to 46.4% and ARD cells rising from 43.6% to 57.9%. Parallel assessments using qPCR and western blotting confirmed a substantial reduction in CDC20 expression at both mRNA and protein levels following treatment (Fig. 4B,C). These findings collectively indicate that epirubicin-induced G2/M arrest occurs concurrently with transcriptional and translational downregulation of CDC20.
 Fig. 4.
Epirubicin induces G2/M phase arrest in MM cells. (A) Cell cycle
profiles before and after drug exposure. (B) Changes in CDC20 mRNA expression
following treatment. (C) Alterations in CDC20 protein levels post-treatment. Data
are presented as means
To evaluate whether MM cells with heightened baseline CDC20 levels exhibit increased vulnerability to epirubicin, we established CDC20-overexpressing cell lines and assessed drug sensitivity using both in vitro and in vivo platforms. Colony formation assays demonstrated a pronounced reduction in clonogenic survival in the CDC20-overexpression group relative to controls when treated with epirubicin (Fig. 5A). Consistent with this, CCK-8 analysis revealed a lower IC50 in CDC20-overexpressing cells compared with controls, indicating enhanced drug sensitivity (Fig. 5B). EdU labeling assays further supported this trend, showing significantly decreased proliferation rates under epirubicin challenge (Fig. 5C). In vivo xenograft studies corroborated these findings, with tumors derived from CDC20-high cells exhibiting reduced volume and weight after epirubicin administration relative to control tumors (Fig. 5D–F).
 Fig. 5.
High levels of CDC20 expression make cells more sensitive to
epirubicin. (A) Colony-forming capacity under drug exposure. (B) IC50 comparison
between control and CDC20-overexpressing groups after 48 hours. (C) Proliferation
rates determined after 48 hours of treatment. Scale bar = 50 μm. (D,E) Tumor volume changes in
wild-type and overexpression groups treated with epirubicin. (F) Tumor weight
comparisons between wild-type and overexpression groups following epirubicin
treatment. Data are means
MM remains a prevalent plasma cell malignancy and is recognized as the second most prevalent hematologic cancer. The disease is marked by the clonal plasma cell expansion in the bone marrow, resulting in excessive monoclonal immunoglobulin production and subsequent organ dysfunction, including hypercalcemia, renal impairment, anemia, and skeletal destruction. Although major therapeutic advances have significantly extended survival over recent decades, MM remains incurable, largely due to emergent drug resistance and eventual disease relapse. Consequently, the discovery of reliable biomarkers that accurately predict therapeutic response remains of paramount importance. In the present analysis, we explored the transcriptional alterations triggered by epirubicin hydrochloride in MM cell lines using gene expression profiling. This is the first investigation demonstrating that epirubicin exerts anti-myeloma activity in part through the suppression of CDC20 expression, suggesting that CDC20 may serve as a predictive indicator of response to this agent.
Our findings indicated that epirubicin hydrochloride markedly decreases CDC20 expression in MM cells, implying that tumors exhibiting elevated CDC20 levels may display heightened susceptibility to epirubicin. Notably, prior work reported that nearly 25% of 351 newly diagnosed MM cases express substantially increased levels of CDC20 [8], supporting the concept that a considerable proportion of patients may derive clinical benefit from this drug. Moreover, survival analyses revealed that reduced CDC20 expression favors improved OS, EFS, and PPS across the majority of MM cases. Stratified by immunoglobulin subtype, the IgA and IgG groups appeared most likely to benefit from CDC20 downregulation. Collectively, these observations lead us to hypothesize that patients with high CDC20 expression, particularly within the IgA and IgG subgroups, could be especially responsive to epirubicin hydrochloride. However, robust prospective clinical investigations will be necessary to confirm this hypothesis.
Given the oncogenic functions attributed to CDC20, multiple inhibitory compounds have been developed, including TAME and its prodrug pro-TAME [15], Apcin [16], withaferin A, NAHA [17], ganodermanontriol, genistein, CFM-4, and BCHHD [18, 19, 20]. While Apcin and pro-TAME selectively inhibit CDC20 and APCPC/CCDC20/APC/CCDH1, respectively, clinical translation has been limited predominantly due to inadequate bioavailability and the need for high therapeutic dosing. Thus, repurposing established antineoplastic agents that can modulate CDC20 expression is a practical and attractive strategy. CDC20 has been identified as a downstream target negatively regulated by p53 [21], and epirubicin is known to enhance p53 expression [22]. These data support a model in which epirubicin downregulates CDC20 via p53 activation, resulting in cell-cycle arrest. Although further mechanistic studies are warranted, the present work supports a biologically plausible role for epirubicin hydrochloride as a nonspecific CDC20 inhibitor in MM management.
Clinically, relapse is nearly universal in MM, and each recurrence narrows the spectrum of therapeutic choices while diminishing the capacity to suppress tumor progression. Both initial treatment and subsequent lines of therapy are threatened by either intrinsic or acquired drug resistance. Drug exposure simultaneously induces cell death and drives adaptive genetic reprogramming, whereby some cells succumb to cytotoxic stress while others survive due to inherent resistance or dynamic transcriptional adaptation. Josh N. Vo et al. [6] identified TP53 as the third most frequently mutated gene in relapsed/refractory MM, and TP53 is a transcriptional regulator of CDC20 [21]. As such, targeting CDC20 may represent a potential therapeutic avenue for patients with TP53-mutated refractory disease. Additionally, during cell-cycle regulation, RB1 phosphorylation by CDK4/6 initiates E2F release and subsequent transcription of downstream genes, including cyclin E, which activates CDK2 to promote S-phase entry. Previous studies have shown that the CDR complex (CDC20, DTL, RRM2) modulates CDK1 during G2/M to maintain accurate chromosome segregation. Loss of RB1 leads to upregulation of the CDR complex, raising the possibility that MM patients harboring RB1 alterations may display enhanced responsiveness to epirubicin.
In conclusion, this study offers the first evidence that epirubicin suppresses CDC20 expression in MM cells and induces cell-cycle arrest, and our analyses of public genomic datasets further clarify the association between CDC20 expression, prognosis, and disease subtypes in MM. These findings furnish a rationale for precision implementation of epirubicin in MM therapy. However, the specific signaling mechanisms through which epirubicin reduces CDC20 expression remain incompletely defined and warrant additional mechanistic investigation.
The data used to support the findings of this study are available from the corresponding author upon request.
Conceptualization, ZN, XTW, YSC and BJF; Data curation, YMW; Investigation, ZN; Methodology, ZN; Software, ZN; Writing—original draft, ZN; Writing—review & editing, YSC and BJF. All authors contributed to editorial changes in the manuscript. All authors read and approved the final manuscript. All authors have participated sufficiently in the work and agreed to be accountable for all aspects of the work.
Animal experiments were conducted in strict accordance with the National Regulations on the Administration of Laboratory Animals issued by the Ministry of Science and Technology of the People’s Republic of China (Beijing, China). The animal use protocol was reviewed and approved by the Animal Ethics and Welfare Committee (AEWC) of Zhengzhou University (Approval No. DW2023078).
Not applicable.
This research received no external funding.
The authors declare no conflict of interest.
References
Publisher’s Note: IMR Press stays neutral with regard to jurisdictional claims in published maps and institutional affiliations.