


 , Yu Chen 1,†, Yuhuai Peng 1, You Tang 1, Bo Sun 1, Jia Zhou 1,2, Yufan Zhou 3, Ou Li 1, Chuang Peng 1, Xu Chen 1,*
1 Department of Hepatobiliary Surgery, Hunan Provincial People’s Hospital, The First Affiliated Hospital of Hunan Normal University, 410005 Changsha, Hunan, China
2 The First School of Clinical Medicine, Lanzhou University, 730000 Lanzhou, Gansu, China
3 Department of General Surgery, Hunan Provincial People’s Hospital, The First Affiliated Hospital of Hunan Normal University, 410005 Changsha, Hunan, China
†These authors contributed equally.
Abstract
Hepatocellular carcinoma (HCC) is as the most frequently observed histological subtype among primary liver malignancies. While quercetin (QT) shows potential antitumor activity, its preclinical anti-HCC effects and safety (especially in animals) remain unclear. Most existing studies use single methods (e.g., individual animal or in vitro assays), which compromises the reliability of the conclusions. This study’s novelty lies in its use of a combined approach—integrating meta-analysis to quantify efficacy and network pharmacology to explore mechanisms, with experimental validation—to address this research gap. This work explores QT’s preclinical anti-HCC effects and adverse effects using this integrated approach.
We collected literature on the treatment of HCC with QT from January 2000 to August 2024. Nine articles meeting the requirements were included in the current study. Subsequent to this, a meta-analysis was conducted, with further validation via network pharmacology approaches and experimental assays.
A meta-analysis found that QT significantly inhibited HCC growth (reduced tumor volume/weight) and reduced mortality in tumor-bearing mice, with no significant effect on body weight. Network pharmacology identified protein kinase B alpha (AKT1) and the phosphoinositide 3-kinase (PI3K)/AKT pathway as potential therapeutic targets. Finally, the aforementioned conclusions were further verified through experimental validation.
Preclinically, QT effectively inhibited HCC growth and reduced mortality in tumor-bearing mice without affecting body weight, likely via the PI3K/AKT pathway (targeting AKT1). Our study results furnish preliminary evidence for QT as a promising candidate for HCC adjuvant treatment, supporting its further evaluation in clinical trials. Limitations include reliance on preclinical data; thus, the translational value needs clinical validation, and the underlying mechanisms require more in-depth investigation.
Keywords
- hepatocellular carcinoma
- network pharmacology
- quercetin
- PI3K/AKT pathway
Globally, hepatocellular carcinoma (HCC) ranks sixth among the most common cancers and third as a major cause of cancer-related fatalities, accompanied by a considerable number of new diagnoses and deaths each year [1, 2, 3]. Surgery is the main therapeutic modality for HCC patients at the early clinical stage. After radical surgical resection or interventional therapy, roughly 40% of patients attain 5-year survival, with 50–70% experiencing recurrence or metastasis [4]. Due to the insidious onset, long latency, rapid progression, and high malignancy of HCC, most patients are identified at advanced HCC, ultimately resulting in poor prognosis [5]. Accordingly, identifying novel therapeutic agents or molecular targets for HCC treatment has become an urgent priority.
Statistics indicate that the compounds isolated from traditional chinese medicine (TCM) can be utilized for the treatment of liver cancer and, moreover, can help reduce cytotoxicity as well [6, 7]. Research within the framework of TCM has established the flavonoid quercetin (QT), which is a kind of flavonoid that exists in fruits, vegetables, and plants [8]. QT was chosen for three primary advantages in HCC research over other flavonoids with antitumor potential, such as rutin and apigenin. First, its superior oral bioavailability and liver-targeting capabilities are critical for HCC treatment, as many flavonoids are limited by low bioavailability [9]. Second, QT has stronger inhibitory effects on the proliferation and metastasis of HCC cells and lower toxicity to normal hepatocytes [9]. Third, its well-documented “multi-pathway regulation” (e.g., targeting oxidative stress, angiogenesis) matches HCC’s complex pathogenesis, an advantage that single-target flavonoids lack [10]. QT exerts anticancer activities via a variety of cellular pathways, such as oxidative stress and apoptosis. Its effects also extend to regulating angiogenesis, suppressing proliferation, and mediating tumor necrosis factor pathways to inhibit tumor growth. QT has been widely researched in preclinical studies on malignant tumors, including cancer, breast, lung, and prostate cancers [11, 12, 13, 14].
Two critical limitations hinder QT’s translational research for HCC. First, current evidence on QT’s efficacy and safety for HCC is unreliable because there is only a small number of preclinical studies, and the results have been inconsistent due to different experimental models and dosages. Second, current research primarily focuses on single molecular targets or signaling pathways, failing to systematically clarify QT’s inherent “multi-target, multi-pathway” regulatory mechanism in the context of HCC [10].
To address these gaps, meta-analysis and network pharmacology can be combined, yet their integration remains rare in research on natural compounds for HCC. Meta-analysis synthesizes data across multiple studies to confirm QT’s efficacy and safety, while network pharmacology is used to analyze the underlying mechanisms. However, each approach has limitations when used in isolation: meta-analysis can verify efficacy but fails to elucidate the underlying mechanistic pathways, whereas network pharmacology enables mechanistic prediction but lacks adequate empirical validation. To overcome these limitations, we propose an integrated “validation–prediction–validation” framework, which sequentially applies meta-analysis to confirm efficacy, network pharmacology to predict mechanisms, and in vivo experiments to validate these mechanisms. This integrated design fills the existing methodological gap in current research.
This design is specifically tailored to tackle the identified gaps: meta-analysis addresses the inconsistency of small-sample studies to clarify efficacy/safety, while network pharmacology-based strategies combined with experiments overcome the insufficiency of systematic mechanistic research. Therefore, a meta-analysis was first carried out by our team regarding preclinical animal experiments to evaluate QT’s anti-HCC efficacy and adverse effects, providing evidence for clinical translation. Subsequently, we used network pharmacology to screen QT’s core targets/pathways in HCC, and validated key mechanisms via in vivo experiments. This integrated approach not only addresses current knowledge gaps in QT-related HCC research but also highlights the novelty of combining meta-analysis and network pharmacology in this field.
We scoured articles in a number of databases, such as PubMed (https://pubmed.ncbi.nlm.nih.gov), Scopus (https://www.scopus.com), Web of Science (https://www.webofscience.com), ScienceDirect (https://www.sciencedirect.com), and the Cochrane Library (https://www.cochranelibrary.com). The time span for the literature we were looking for was from January 2000 to August 2024. The search was limited to peer-reviewed articles published in English. Zotero document management software was used to screen and remove duplicates, which were identified using a search strategy (Supplementary Table 1) that combined the terms “quercetin” and “hepatocellular carcinoma or HCC or liver cancer”.
(1) Animal Selection Criteria: When selecting animals for experimental models, the predominant choice was rodents such as mice, nude mice, and rats. (2) Model Selection Criteria: to facilitate the observation of whether the tumor model was successfully established and to make it convenient for the measurement of subsequent relevant results, only subcutaneous models were considered, whereas orthotopic models were excluded. (3) Intervention Measures: QT was used alone for treatment, and there was a placebo group or blank control group. (4) Outcomes: The impact of QT on animal models of HCC after tumor implantation, including changes in tumor volume, changes in tumor weight, mortality rate of mice during the treatment process, and changes in the animals’ own body weight before and after QT injection.
(1) Research Subjects: experimental animals for which basic information could not be extracted, or animal models with only orthotopic tumors; (2) Intervention Measures: Studies where QT was used in combination with other drugs; (3) Study design: non-randomized controlled trials (RCTs); (4) Data availability: studies with unavailable or missing relevant original experimental data; (5) Literature type: literature published in the forms of letters, editorials, abstracts, conference proceedings, experience summaries, or case reports; (6) Literature duplication: similar or duplicate studies; and (7) Literature timeliness/credibility: outdated articles lacking significance and credibility.
Authors Zhiguo Tan (ZT) and Yu Chen (YC) designed a data extraction form covering the first author, publication year, country, animal baseline data, detailed intervention information, and required specific outcome data. ZT and YC extracted the data independently. In case of any discrepancies that arise during the data extraction process, they will either resolve them through discussion or turn to a third author, Xu Chen (XC). If the relevant basic information and outcome indicators in an article are not clear, we will attempt to contact the first author of the article or reach out for consultation based on the email address of the corresponding author. Should the outcome indicators be unavailable and presented in the form of pictures, we will utilize the GetData Graph Digitizer (v2.24, GetData Pty Ltd., Brisbane, Queensland, Australia) software to reproduce the relevant data. Moreover, we will use Excel spreadsheets to independently extract the above data and materials from the articles that are finally included. ZT and YC will evaluate these preclinical animal studies using SYRCLE’s Risk of Bias tool, evaluating bias risk (e.g., publication bias, selective reporting) for each study. Results were categorized as “Yes” (low bias risk), “No” (high bias risk), or “Uncertain” (unclear bias risk). To evaluate the influence of high-risk (No) studies on our overall conclusions, we performed sensitivity analysis using two methods. First, we re-ran the primary analysis (low/unclear risk only) after including the high-risk studies, and compared the new pooled effect size to the original. Second, we systematically excluded each high-risk study and recalculated the pooled effect size to observe its impact. We independently evaluated the quality of each RCT, and any difference in opinion was settled through discussion until an agreement was reached or with the help of the third author (XC).
We conducted a statistical analysis using the Review Manager software (v5.4,
Cochrane Collaboration, Copenhagen, Denmark). Standardized mean difference (SMD)
with 95% confidence interval (CI) was employed to quantify effect sizes, while
relative risk (RR) with 95% CI was utilized for the dichotomous mortality
variable. First, we considered the heterogeneity of the included studies and
conducted meta-synthesis after excluding clinical and methodological
heterogeneity. The Q test and I2 test were employed to determine the
heterogeneity of the research results. In the Q test, p
The TCMSP database (https://www.tcmsp-e.com/) was adopted to search for the PubChem Compound ID of “quercetin”. Subsequently, search for Canonical SMILES within the PubChem database (http://pubchem.ncbi.nlm.nih.gov/). Ultimately, employ the SwissTargetPrediction database (https://www.swisstargetprediction.ch/) to gather the targets of compounds that have a probability score higher than zero. Genes associated with HCC were identified by searching the GeneCards (http://www.genecards.org) and Online Mendelian Inheritance in Man (http://omim.org) databases using the keywords “hepatocellular carcinoma” and “liver cancer”. We selected genes that scored above 1 as potential targets from the GeneCards database. Genes from the two databases were de-integrated, with the Uniprot database (https://www.uniprot.org/) employed for the standardization of gene names.
The potential anti-HCC targets of QT were uploaded into the STRING 11.5 database
(https://cn.string-db.org/) for construction of the PPI. “Homo sapiens” was
designated as the target protein species, and a minimum interaction threshold of
“high confidence
The potential targets of QT for treating HCC were analyzed using R. Gene Ontology (GO) functional enrichment was analyzed using the R package org.Hs.eg.db. (3.20.0, Bioconductor Project, Seattle, WA, USA) As for the Kyoto Encyclopedia of Genes and Genomes (KEGG) pathway enrichment results, these were analyzed with the R Package clusterProfiler (4.18.1,Yu Lab, Guangdong, China). Those top-ranked results where the p-values were less than 0.05 and the false discovery rate (FDR) was less than 0.25 were visualized and analyzed. GO enrichment and KEGG pathway analyses were plotted via the tool available on https://www.bioinformatics.com.cn.
The two-dimensional structure of QT was retrieved as a Spatial Data File from the National Center for Biotechnology Information PubChem database. Target proteins were obtained in Protein Data Bank (PDB) format from the PDB [16]. Using PyMOL (v2.5.2, Schrödinger, LLC, New York, NY, USA), water molecules and ligands were removed from the crystal structure complex; then the target proteins were imported into AutoDock Tools (v1.5.6, Molecular Graphics Laboratory, La Jolla, CA, USA), where hydrogenation was performed, followed by saving in PDBQT format. The protein’s protonation states were calculated using the Add Gasteiger Charges module. The active site was defined using a grid box, centered on the protein’s co-crystallized ligand binding pocket for full coverage. Finally, AutoDock Vina [17] was used to perform molecular docking of the receptor protein with the ligand and calculate its binding energy score. Binding energy less than zero denotes spontaneous binding potential between the ligand and receptor. It is generally acknowledged that the lower the binding energy between the receptor and ligand, the more probable their binding will be [17]. Molecular dynamics (MD) simulations were conducted using GROMACS (v2018.1, GROMACS Development Team, Stockholm, Sweden) [18]. The protein’s topology was generated with the GROMACS 54a7 force field, whereas the ligand’s parameters were obtained from the ATB website (https://atb.uq.edu.au/). The system was placed in a cubic box with simple point charge water and neutralized with Na+/Cl– ions [19, 20]. Prior to the production runs, the system was prepared through a series of steps: first, energy minimization was performed via 50,000 steepest descent steps, with 100 ps NVT (constant atomic number, volume, and temperature) and 100 ps NPT (constant atomic number, pressure, and temperature) equilibration carried out sequentially [21, 22]. The production simulation was carried out for 100 ns under equilibrated conditions (310 K, 1.0 bar) [23]. Long-range electrostatic interactions were evaluated using the Particle Mesh Ewald method. Trajectory analyses (root mean square deviation [RMSD], root mean square fluctuation [RMSF], radius of gyration, solvent accessible surface area, and hydrogen bonds [HBs]) were performed using GROMACS modules, with data visualized using Xmgrace (v5.1.25, The Grace Development Team, Göttingen, Lower Saxony, Germany). To ensure the reliability of results, MD simulations were independently repeated three times with different initial velocity distributions.
For the Cell Counting Kit-8 (CCK-8) assay, 1
For the colony formation assay, MHCC97-H cells were seeded into 6-well plate
wells. After adherence, medium was replaced with fresh medium containing QT (40
and 80 µM) for 24 h. Then cells were cultured in standard growth medium for
14 days, fixed in 4% paraformaldehyde at room temperature for 10 min, and washed
three times with phosphate-buffered saline. Finally, cells were stained with
crystal violet for 15 min, rinsed, and then analyzed directly. Colonies were
quantified using ImageJ software (v1.54, National Institutes of Health, Bethesda,
MD, USA). The software was set to automatically recognize stained colonies based
on color and size thresholds (area
The EdU (C0078S, Beyotime, Beijing, China) proliferation test was performed according to the manufacturer’s protocol. After incubation at 37 °C, cells were added with 50 µM EdU and incubated for 2 h. Subsequently, the corresponding reagents were added sequentially in the specified order. The images were taken using Leica Application Suite (version 3.0.0, Leica Microsystems, Wetzlar, Germany).
For cell cycle assessment, MHCC97-H cells treated with QT were trypsinized and
processed using a flow cytometry cell cycle kit (C1052, Beyotime, Beijing,
China), with propidium iodide (PI) staining. We collected cell cycle data via a
CytoFLEX flow cytometer (Beckman Coulter, Brea, CA, USA) and analyzed
with CytoFLEX analysis software (v2.4, Beckman Coulter Life Sciences, Brea,
CA, USA). The gating strategy began by excluding debris and aggregates
using a forward scatter-side scatter plot to select only single cells.
Subsequently, G0/G1, S, and G2/M cell cycle distribution was identified by
analyzing PI fluorescence. The controls included unstained cells (to set the
autofluorescence baseline) and untreated PI-stained cells (normal cycle
reference). Samples were analyzed on the CytoFLEX cytometer, with
All in vivo experiments used 6-week-old male BALB/c nude mice (Slack
Jingda Experimental Animal Co., Ltd, Hunan, China). A 5
The tumor tissue was fixed, embedded, sectioned, stained, dehydrated, and sealed. Subsequently, 5% goat serum (31872, Invitrogen, Carlsbad, CA, USA) was used to block sections for 30 min, followed by the addition of primary antibody (p-AKT, AP0637, ABclonal, Wuhan, China, 1:400) and incubation at 4 °C for 12–16 h. On the subsequent day, the secondary antibody (G1213, Servicebio, Wuhan, China, 1:200) was incubated for 2 hours at ambient temperature. To ensure the specificity and reliability of the immunohistochemical staining results, a negative control group was included. Staining intensity multiplied by positive cell percentage yielded the immunoreactive score [24]. For H&E staining, the reagent we used was the HE staining kit (G1076, Servicebio, Wuhan, China).
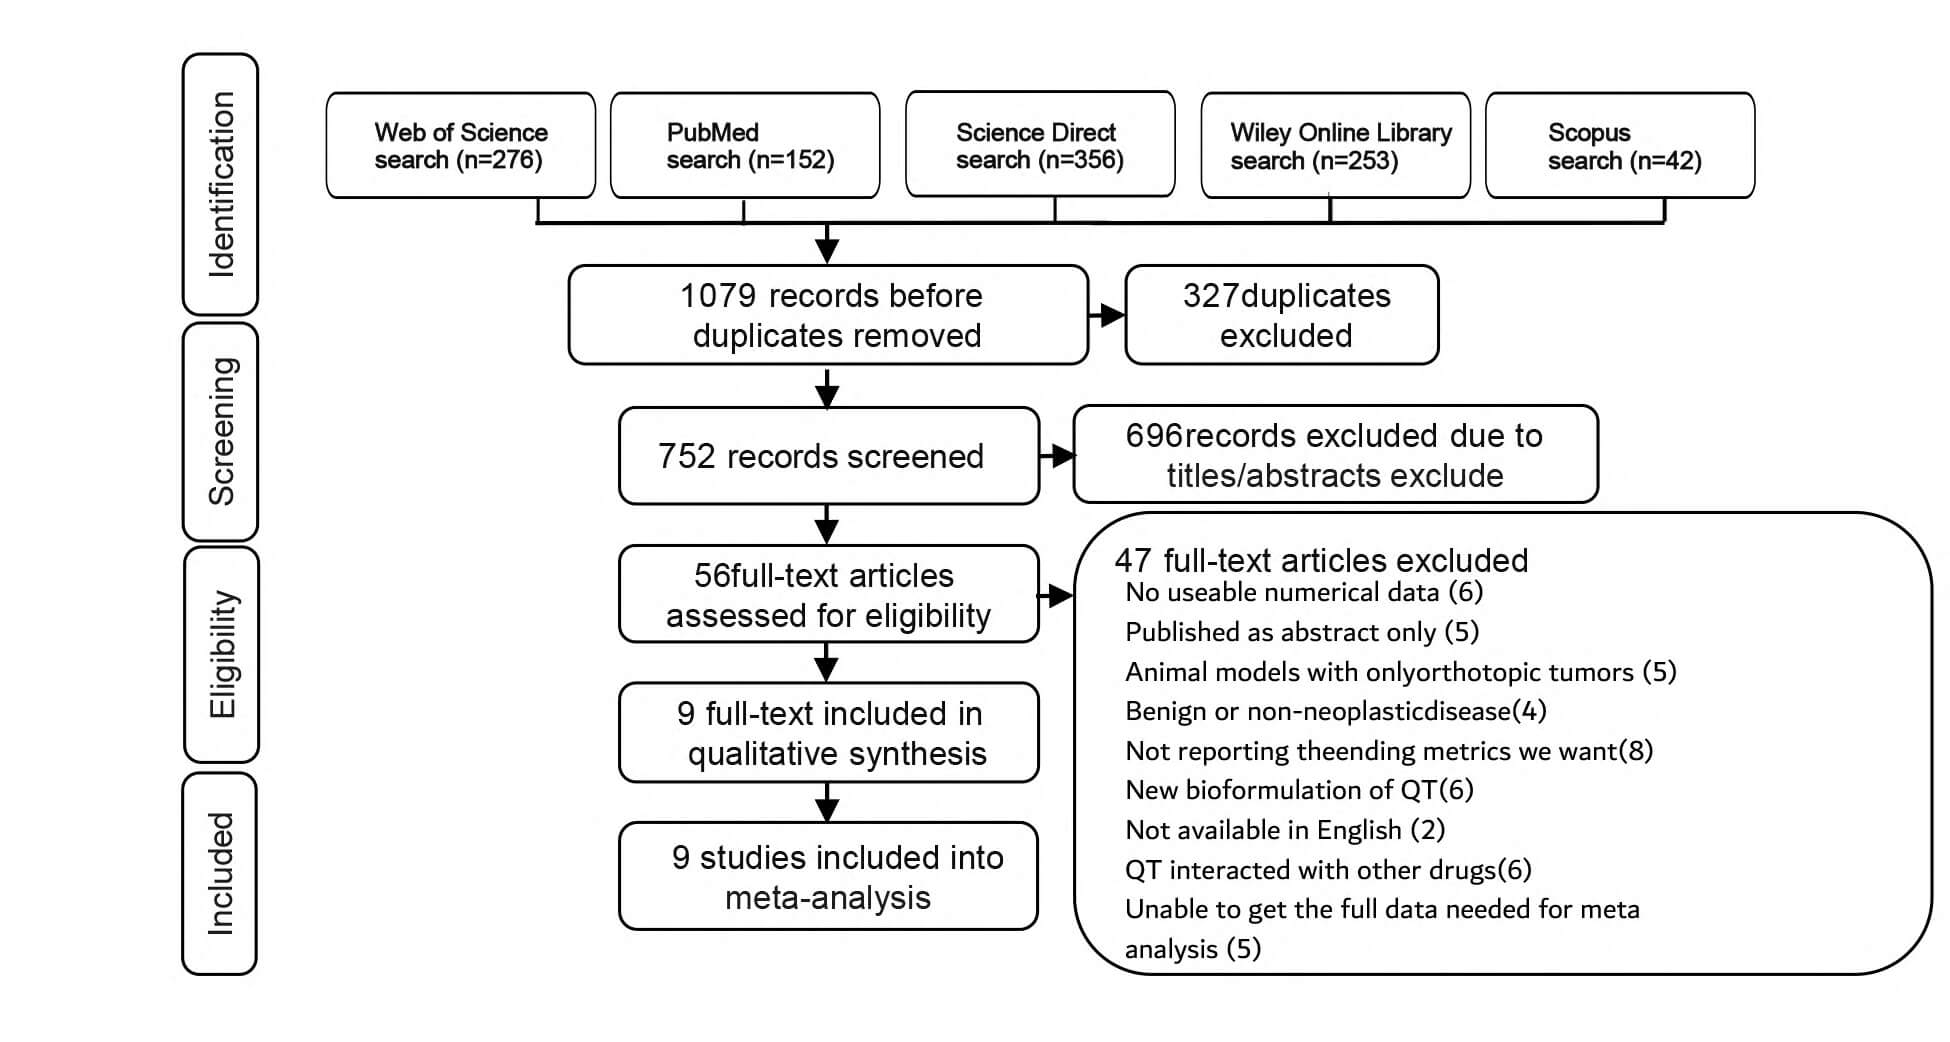
The search results yielded a total of 1079 potential articles, with 276 from the Web of Science, 152 from PubMed, 356 from Science Direct, 253 from Wiley Online Library, and 42 from Scopus. Subsequently, after the Zotero document management software identified and removed duplicate documents, leaving 752 articles whose titles and abstracts were then screened. According to the research selection criteria, 56 articles were filtered out. Among these, 47 articles were excluded, and ultimately, 9 articles were included in this study [25, 26, 27, 28, 29, 30, 31, 32, 33] (Fig. 1).
 Fig. 1.
Flow diagram of the identified, included, and excluded studies. QT, quercetin.
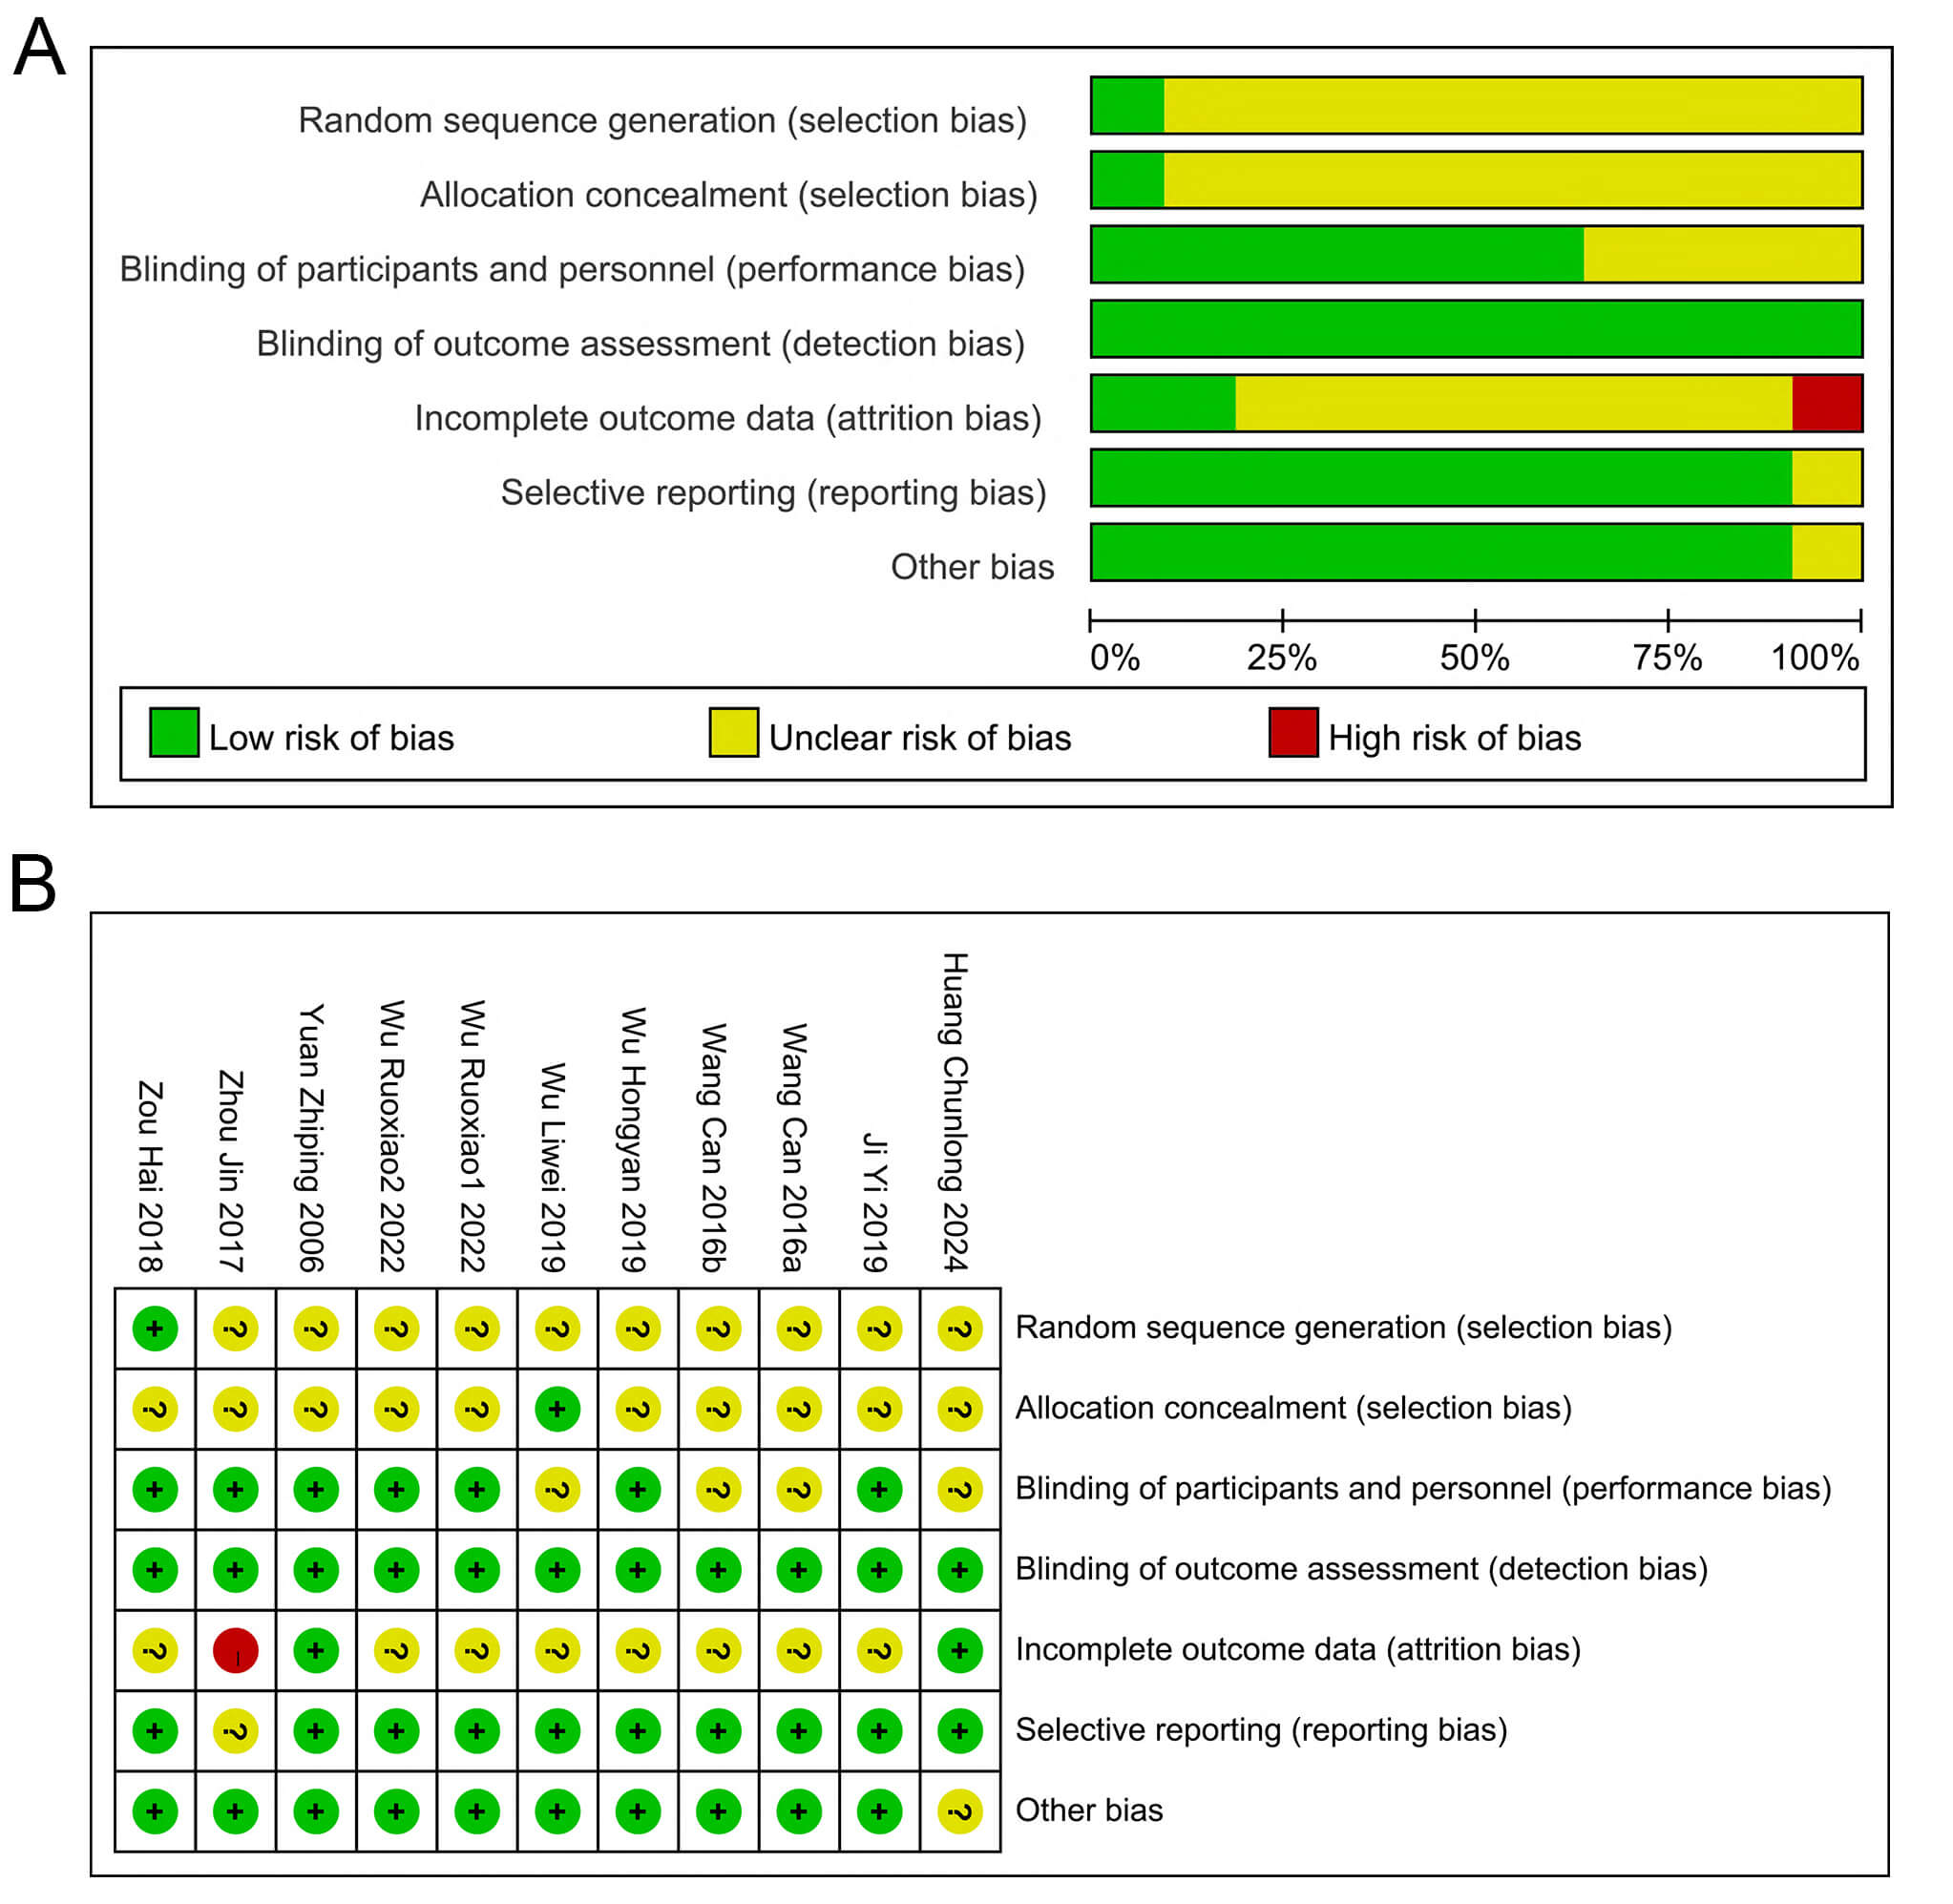
The basic data of the included relevant literature are shown in Table 1 (Ref. [25, 26, 27, 28, 29, 30, 31, 32, 33]) and Table 2. A total of 9 papers met the final inclusion criteria. The experimental animals used were nude mice or regular mice, and subcutaneous tumor models were established using liver cancer cells (e.g., HepG2, HH-7, and H22). Compared with the control group, QT was mainly administered in the form of QT solution or QT nanoparticles. The dosage of QT ranged from 10 to 150 mg/kg, and was administered intermittently or continuously through intraperitoneal injection, gavage, or intravenous injection. The study duration varied from 1 to 7 weeks. The study quality was assessed using the SYRCLE animal experiment risk assessment tool (Fig. 2). Generally, the overall quality of the included studies was moderate.
 Fig. 2.
Risk of Bias Assessment. (A) Classification of bias risk among included articles. (B) Per-article bias characteristics. ?: Unclear risk; +: Low risk; -: High risk.
| Author, year, country | Species, strain, gender, age | Model cell line | Experiment | Control | Outcome | ||||||||||
| Dosage | Frequency | Administration | Duration | Type | Mean0 | Sd0 | N0 | Mean1 | Sd1 | N1 | p | ||||
| Yuan Zhiping 2006, China [25] | Mice, BALB/C, F, 8 w | H22 | 50 mg/kg | Every 3 days for 21 days | iv | 3 w | pbs | TV | 5219.55 | 463.42 | 10 | 2146.29 | 317.13 | 10 | p |
| Wang Can, 2016, China [26] | nude mice, BALB/C, \, 4–6 w | HepG2 | 40 mg/kg | qiw | iv | 3.4 w | saline | TV | 951.65 | 61.32 | 8 | 667.72 | 54.43 | 8 | p |
| TV | 951.65 | 61.32 | 8 | 493.68 | 34.72 | 8 | p | ||||||||
| Zhou Jin, 2017, China [32] | nude mice, BALB/C, F, 6–8 w | HepG2 | 10 mg/kg | qd | ip | 1.0 w | saline | TV | 1421.75 | 91.25 | 10 | 802.12 | 123.08 | 10 | p |
| Zou Hai, 2018, China [33] | nude mice BALB/C M, 5 w | HuH-7 | 150 mg/kg | \ | gg | 7 w | pbs | TV | 4589.33 | 410.58 | 6 | 2759.38 | 324.19 | 6 | p |
| Ji Yi, 2019, China [30] | nude mice, BALB/C, M, 5–6 w | SMMC7721 | 60 mg/kg | qd | og | 1.4 w | \ | TV | 2081.31 | 198.82 | 10 | 1135.52 | 262.13 | 10 | p |
| TW | 1.42 | 0.24 | 10 | 0.65 | 0.12 | 10 | p | ||||||||
| BW | 21.04 | 0.72 | 10 | 21.09 | 1.12 | 10 | \ | ||||||||
| Wu Hongyan, 2019, China [29] | nude mice, BALB/C, F, 5–6 w | SMMC7721 | 50 mg/kg | bid | ip | 2.5 w | saline | TV | 3342.71 | 824.14 | 6 | 1610.53 | 571.24 | 6 | p |
| TW | 1.99 | 0.44 | 6 | 1.16 | 0.17 | 6 | p | ||||||||
| BW | 22.15 | 1.69 | 6 | 20.41 | 1.52 | 6 | \ | ||||||||
| Wu Liwei, 2019, China [31] | nude mice, \, \, \ | LM3 | 100 mg/kg | \ | gg | 3 w | vehicle | TV | 2512.17 | 504.16 | 5 | 1008.14 | 496.12 | 5 | p |
| BW | 24.51 | 0.61 | 5 | 23.91 | 0.51 | 5 | \ | ||||||||
| Wu Ruoxiao1, 2022, China [27] | Mice, BALB/C, M, 4 w | H22 | 25 mg/kg | qd | gg | 3 w | saline | TV | 1124.26 | 50.31 | 8 | 694.66 | 181.21 | 8 | p |
| TW | 0.74 | 0.03 | 8 | 0.57 | 0.11 | 8 | p | ||||||||
| Wu Ruoxiao2, 2022, China [27] | Mice, BALB/C, M, 4 w | H22 | 50 mg/kg | qd | gg | 3 w | saline | TV | 1124.26 | 50.31 | 8 | 422.83 | 67.14 | 8 | p |
| Huang Chunlong, 2024, China [28] | nude mice, \, M, 4 w | HuH-7 | 50 mg/kg | qd | ip | 3 w | vehicle | TV | 1634.74 | 375.33 | 5 | 0.41 | 0.12 | 5 | p |
| TW | 1.78 | 0.17 | 5 | 632.06 | 123.33 | 5 | p | ||||||||
og, oral gavage; gg, gastric gavage; ip, intraperitoneal injection; Mean0, mean value in control group (mm for tumor volume, g for tumor weight and body weight); Sd0, standard difference in control group; N0, sample size in control group; Mean1, mean in experiment (QT) group; Sd1, standard difference in QT group; N1, sample size in QT group; M, male; F, femle; \, non reported; TV, tumor volume; TW, tumor weight; BW, body weight.
| Species, strain, gender, age | Model cell line | Experiment | Control | Outcome | |||||||
| Dosage | Frequency | Administration | Duration | Type | Event0 | Total0 | Event1 | Total1 | |||
| Mice, BALB/C, F, 8 w | H22 | 50 mg/kg | Every 3 days for 21 days | iv | 3 w | pbs | MR | 10 | 10 | 5 | 10 |
| Nude mice, BALB/C, F, 6–8 w | HepG2 | 10 mg/kg | qd | ip | 1.0 w | saline | MR | 10 | 10 | 6 | 10 |
| Nude mice, BALB/C, M, 5 w | HuH-7 | 150 mg/kg | \ | gg | 7 w | pbs | MR | 6 | 6 | 3 | 6 |
og, oral gavage; gg, gastric gavage; ip, intraperitoneal injection; Event0, number of events in control group; Total0, total control sample; Event1, number of events in QT group; Total1, total experiment (QT) sample; M, male; F, femle; \, non reported; MR, mortality rate.
Nine included articles reported tumor volume changes in the experimental
(QT-treated) and control groups. Among them, Wu et al. [27] tested two
QT concentrations (25 and 50 mg/kg); their data were treated as independent sets
(Wu Ruoxiao 1, Wu Ruoxiao 2). Wang et al. [26] used two administration
forms (ordinary QT solution and QT nanoparticles); their data were also split
into independent sets (Wang Can 2016a, Wang Can 2016b). In total, 11 datasets
from the 9 articles were included. Sensitivity analyses of these 11 sets showed
no significant changes in meta-analysis results or consistency after excluding
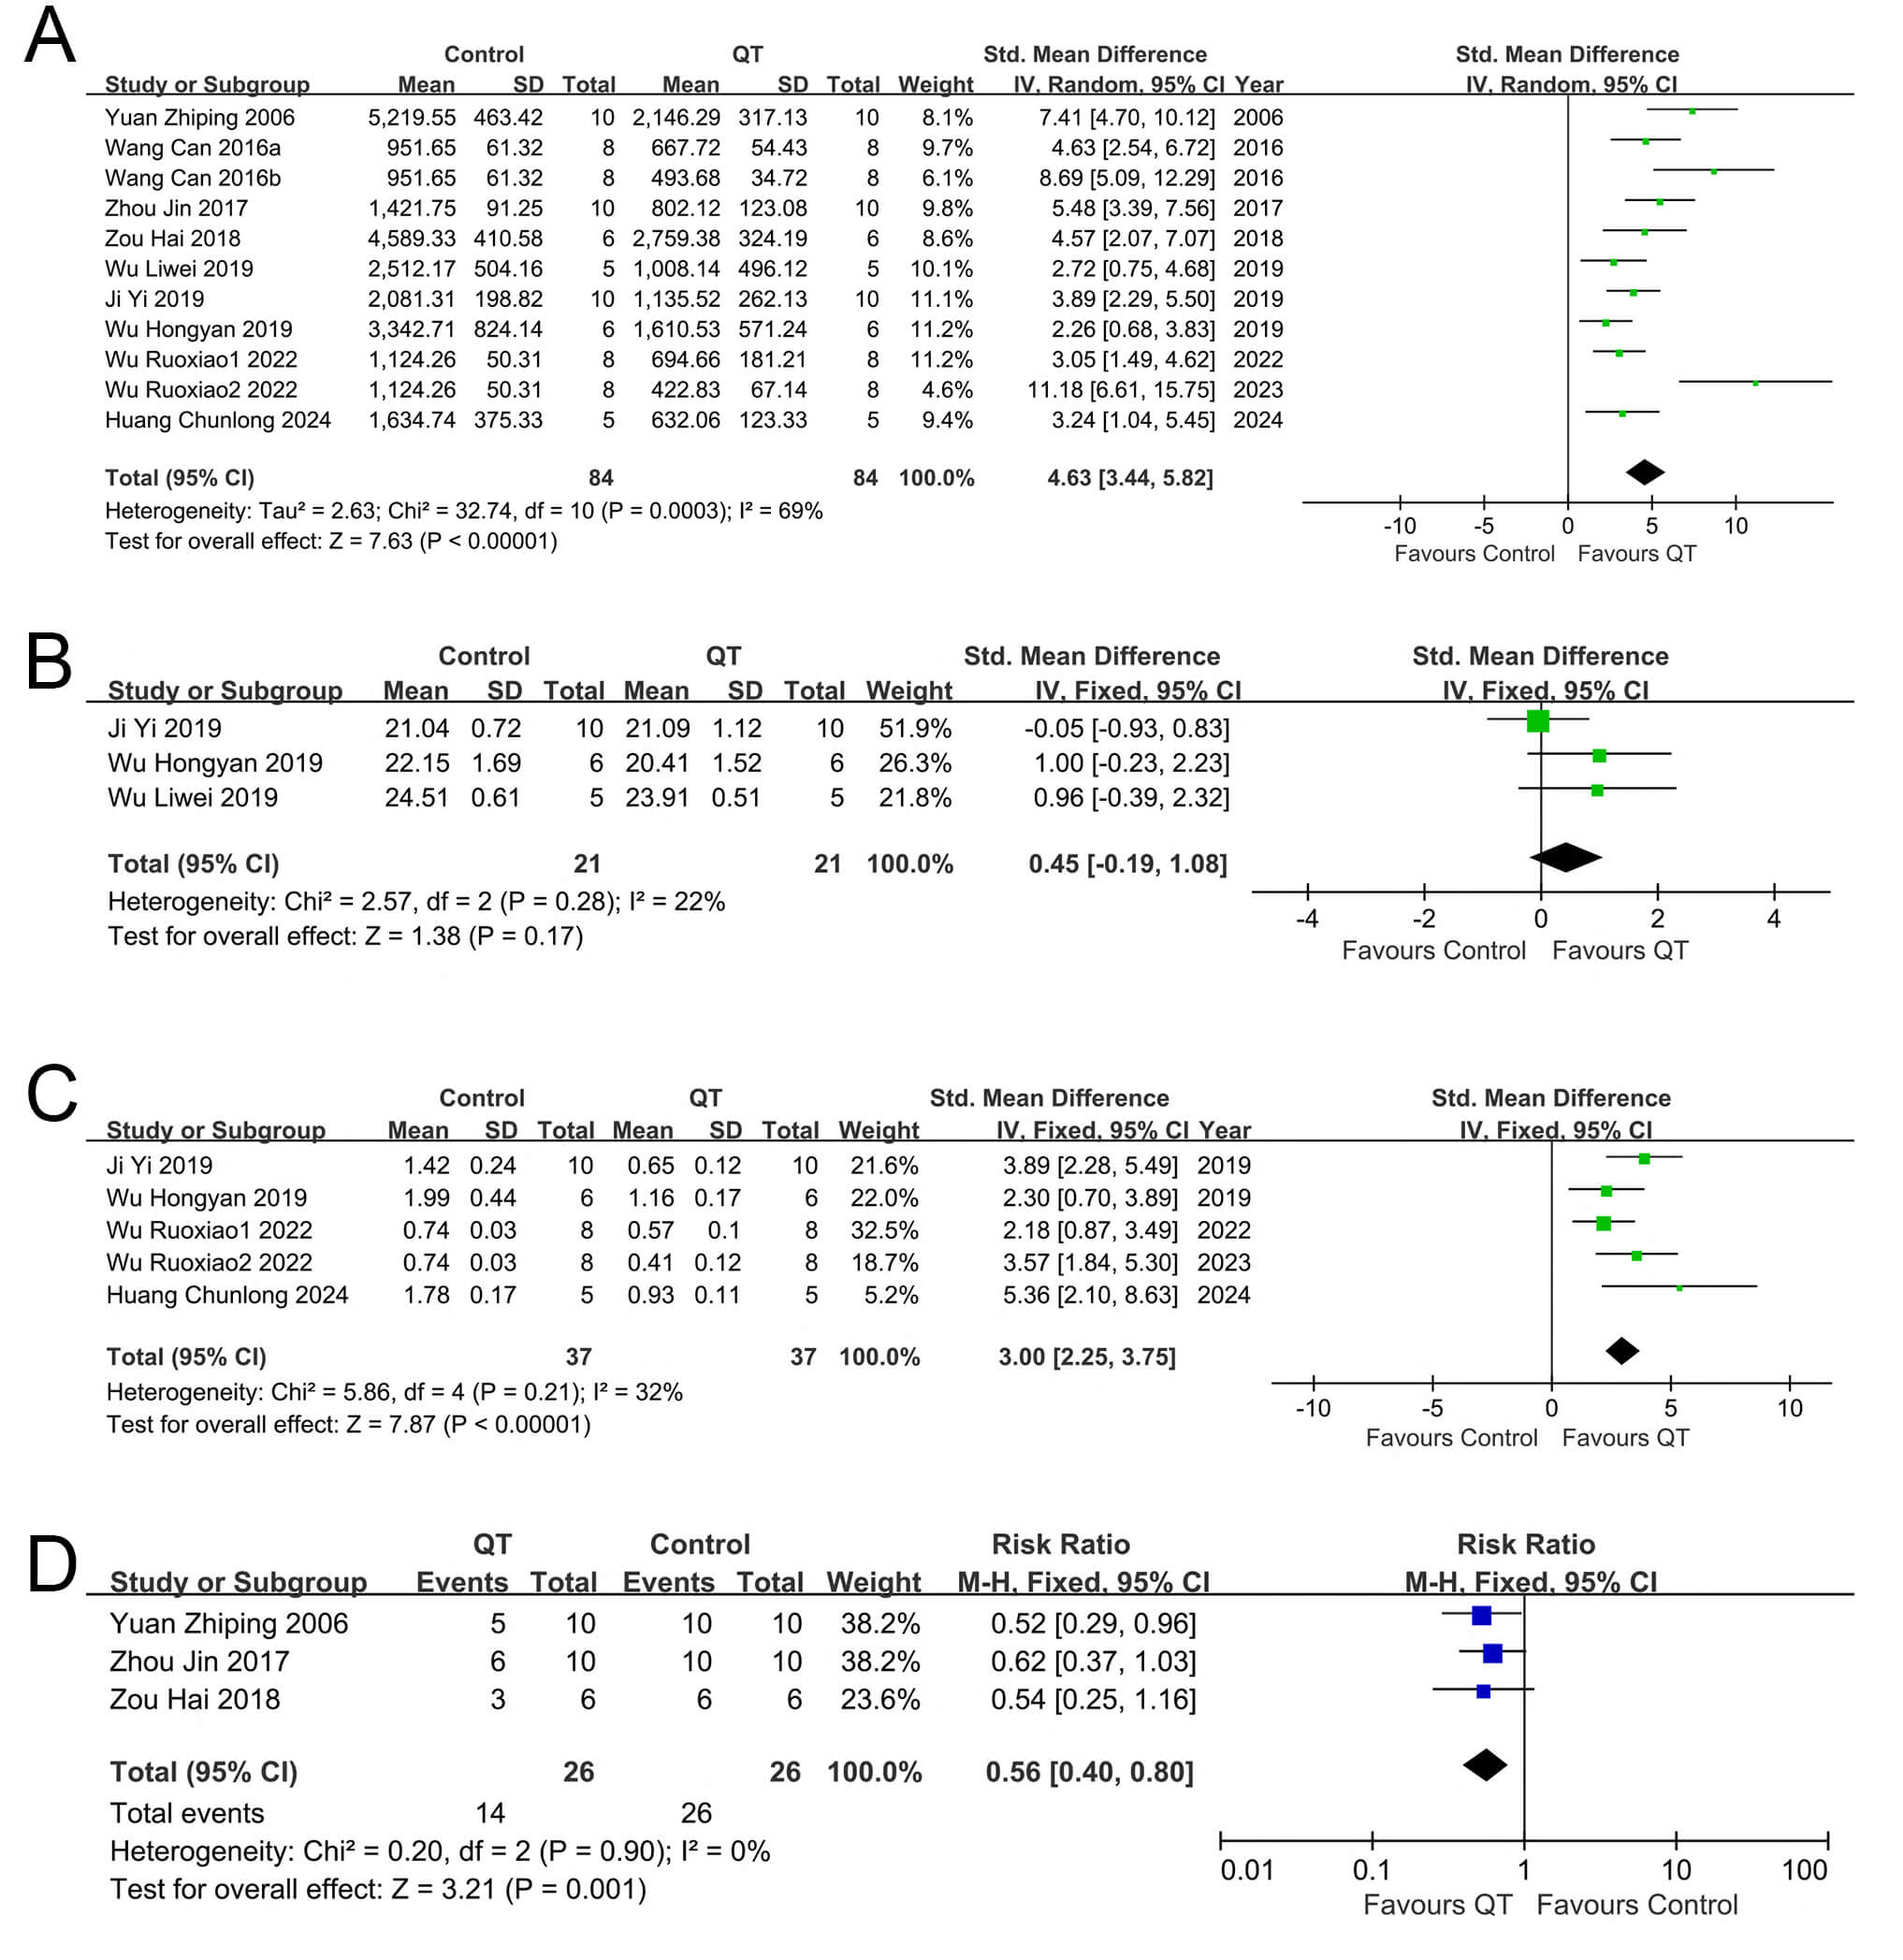
any single dataset. Pooled analysis of the 11 sets (Fig. 3A) yielded the SMD and
95% CI. Due to substantial heterogeneity (I2 = 69%), a random-effects
model was used. Compared with the control group, the QT group inhibited liver
cancer volume growth (SMD = 4.63, 95% CI: 3.44–5.82, Z = 7.63, I2 = 69%,
p
 Fig. 3.
Forest plots of tumor growth, body weight, and mortality in mice across different interventions. (A) Tumor volume, (B) Tumor weight, (C) Mice own weight and (D) Mice mortality rate.
| Subgroup analysis of tumor volume | |||||||
| Subgroup | No. of studies | SMD [95% Cl] | p-value | Heterogeneity test | |||
| Chi2 | p | I2 (%) | |||||
| All studies | 11 | 4.38 [3.26, 5.50] | 32.74 | 0.0001 | 69 | ||
| Dosage | |||||||
| 8 | 4.94 [3.51, 6.36] | 23.68 | 0.0001 | 70 | |||
| 3 | 2.90 [1.68, 4.12] | 2.37 | 0.3100 | 16 | |||
| Administration form | |||||||
| QT-NPs | 2 | 7.87 [5.71, 10.04] | 0.31 | 0.5800 | 0 | ||
| QT-Solution | 9 | 3.76 [2.77, 4.74] | 19.36 | 0.0080 | 59 | ||
SMD, standardized mean difference.
Notably, some experiments used QT nanoparticles (a potential heterogeneity
source), so we conducted subgroup analysis by administration form. The results
showed reduced within-group heterogeneity: the QT nanoparticle group had I2
= 0%, whereas the common QT group still had relatively high heterogeneity
(I2 = 59%) despite a decrease. Notably, the interaction between dosage and
administration can explain the observed results. At high doses (therapeutic,
Among the 9 articles included in our study, 4 articles [27, 28, 29, 30], which contained
five groups of data in total, reported on the changes in tumor weight within both
the experimental group and control group following QT intervention. Subsequently,
we conducted a sensitivity analysis. It was found that after excluding any group
of data from any of these articles, the remaining literature’s meta-analysis
results remained unchanged and were thus stable. When conducting a meta-analysis
on the five groups of data from these four articles (Fig. 3B), we opted for the
fixed-effects model for data synthesis. The combined results revealed that the
experimental group (with QT intervention) significantly suppressed liver cancer
weight gain relative to the control group (SMD = 3.00, 95% CI: 2.25–3.7, Z =
7.87, I2 = 32%, p
Among the 9 articles incorporated into our study, 3 articles [29, 30, 31], which contained three groups of data in total, described the weight variations of experimental mice following treatment. Changes in the body weights of mice were used to assess adverse reactions associated with QT intervention. Subsequently, a meta-analysis was conducted on the group data from these three articles (Fig. 3C). It was found that no obvious effect on body weights was observed in the QT group (SMD = 0.45, 95% CI: 0.19–1.08, I2 = 22%, Z = 1.38; p = 0.17).
Three of the nine articles included in our study provided three groups of data that described the changes in mortality [25, 32, 33]. In total, 52 mice were involved in these studies, with 26 mice in the QT group and another 26 in the control group. A meta-analysis was performed on the above-mentioned three groups of data (Fig. 3D). No significant heterogeneity was observed among the included studies, as shown by the results (p = 0.90, I2 = 0%). Subsequently, we selected a fixed model for data synthesis. The combined results revealed that the mortality rate of the QT group was lower than that of the control group (RR = 0.56, 95% CI: 0.40–0.80; p = 0.001). These findings suggest that QT is capable of reducing the mortality rate of mice with transplanted tumors.
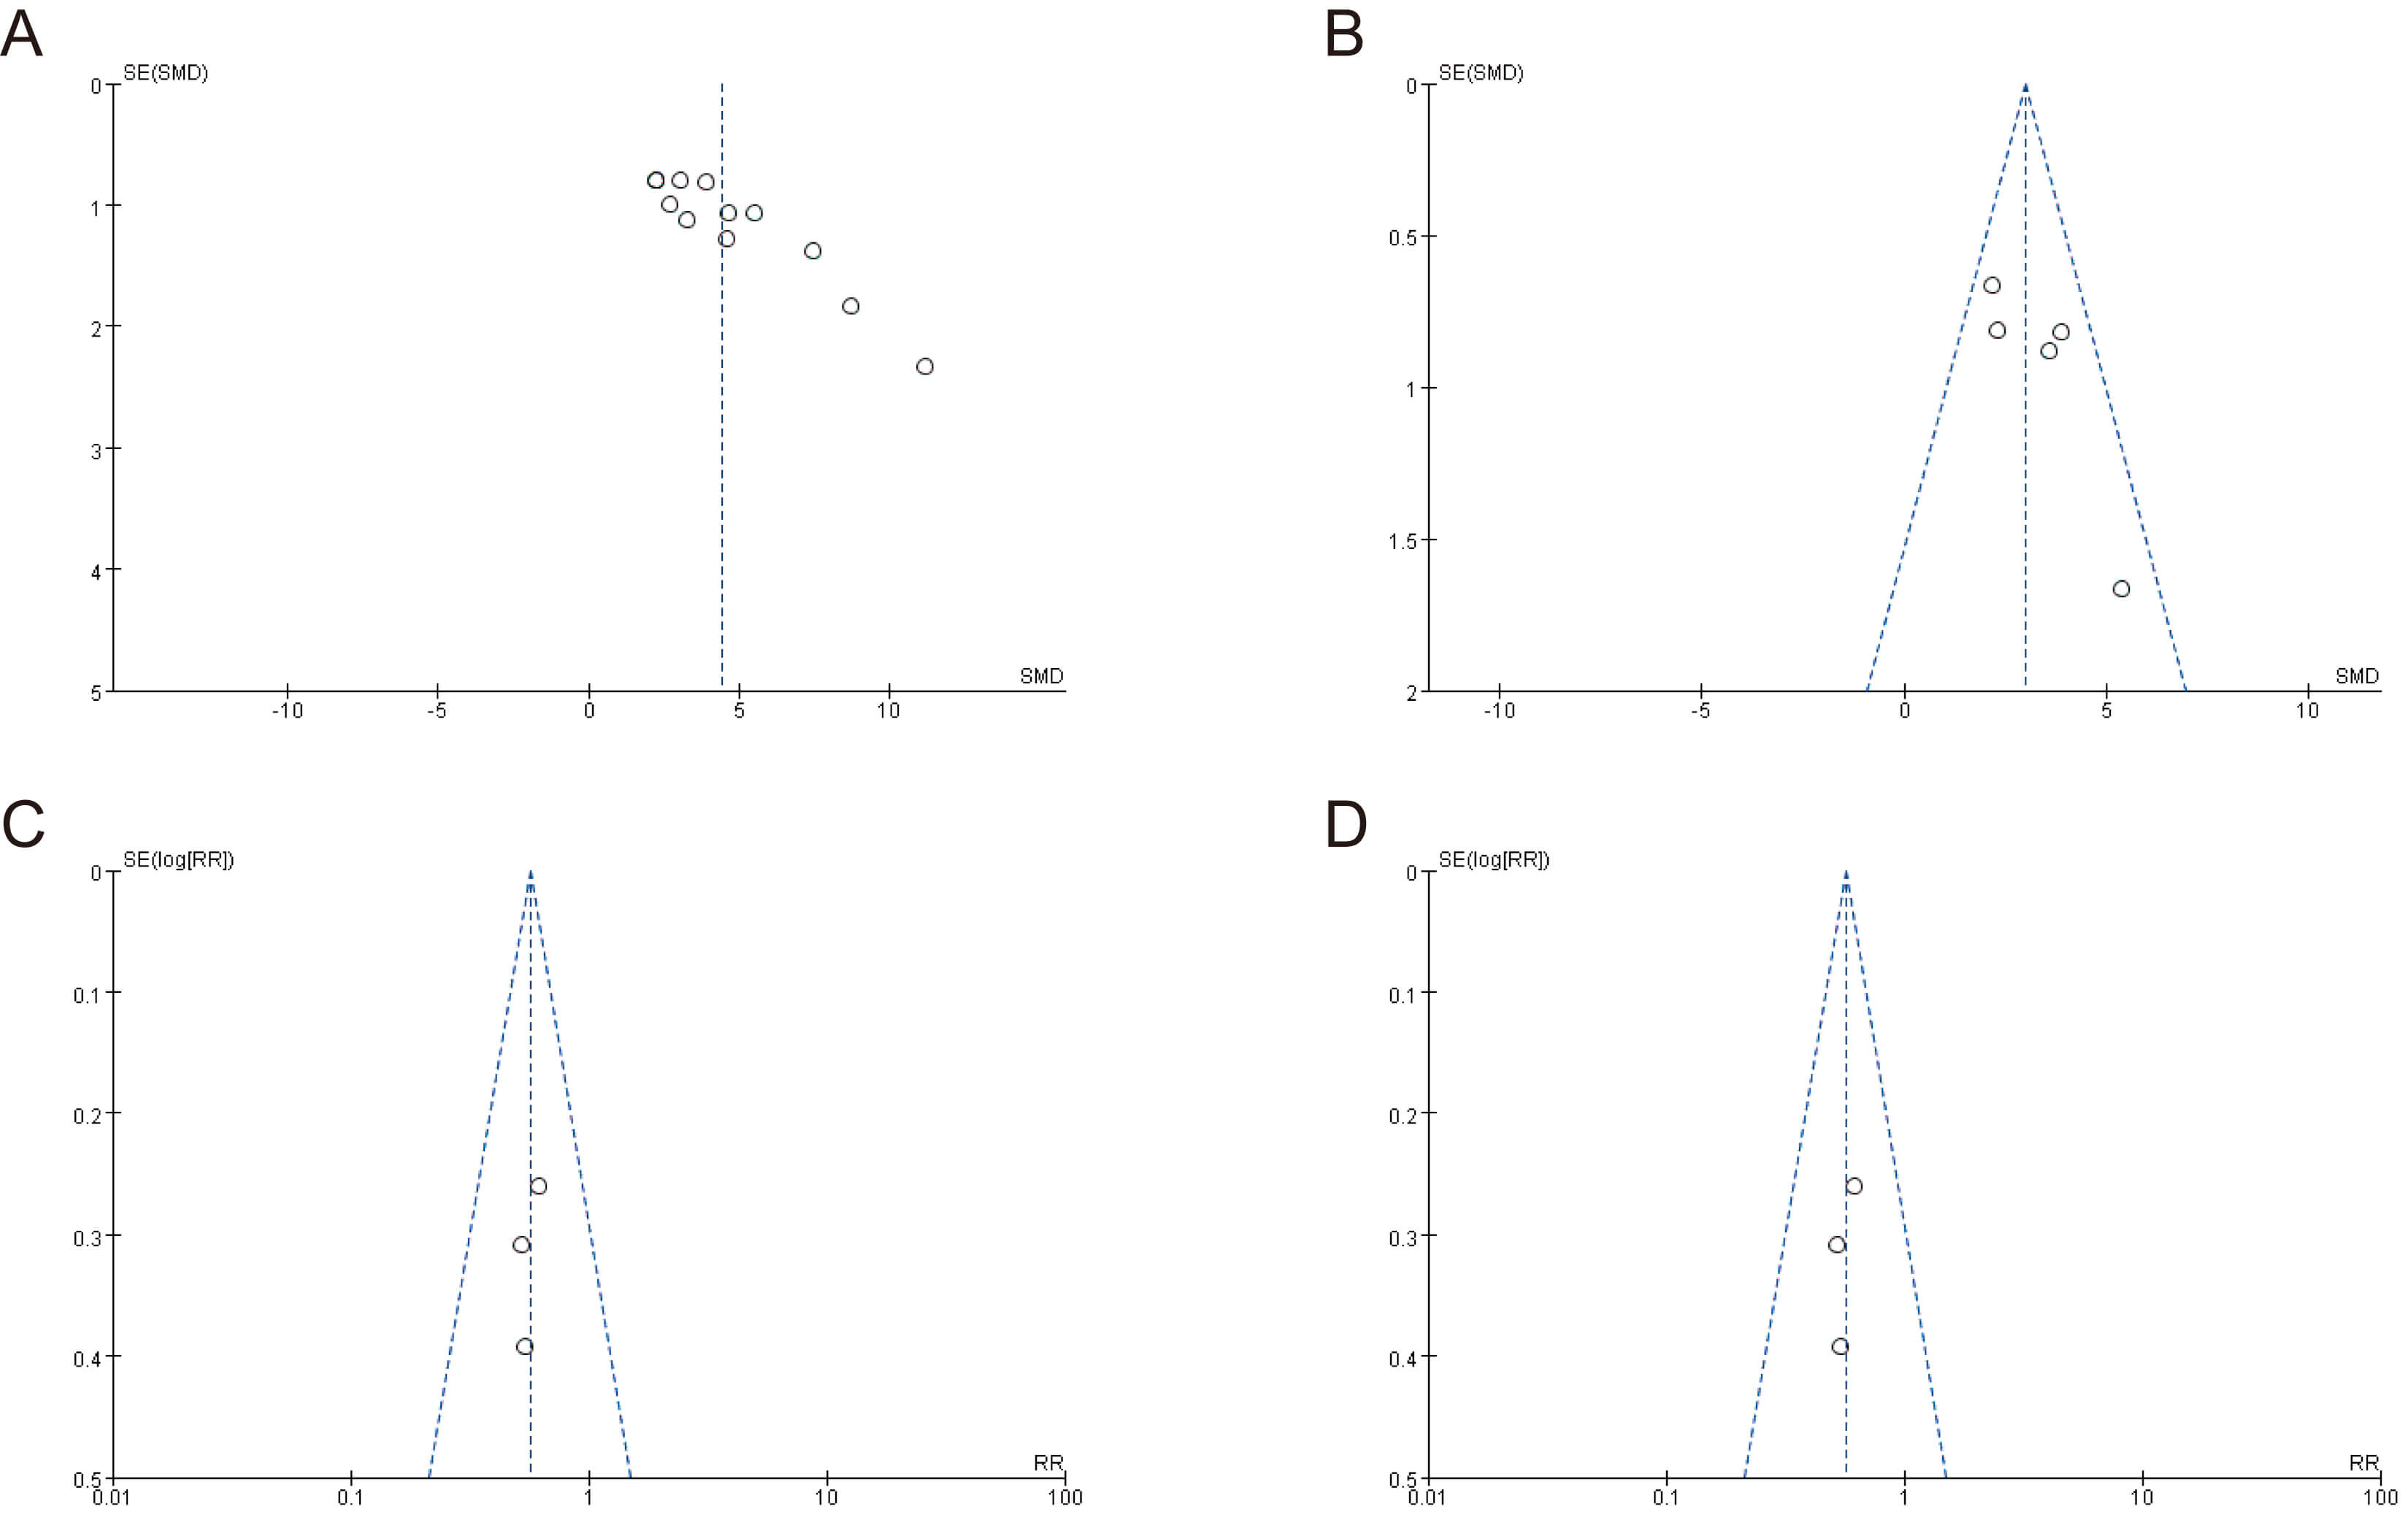
The meta-analysis results for tumor volume, tumor weight, variations in mouse
weight, and mouse mortality showed the symmetrical distribution of studies in the
upper region of the funnel plot (Fig. 4). Egger’s test was used to assess
publication bias for the four above-mentioned outcome indicators
(Supplementary Fig. 1). While the results showed no significant
publication bias for tumor weight, mouse body weight, and mortality (p
 Fig. 4.
Funnel plots for assessing publication bias. (A) Tumor volume, (B) tumor weight, (C) mouse body weight, and (D) mouse mortality rate.
First, 89 intersection targets of QT and HCC were obtained through a Venn diagram (Fig. 5A). Subsequently, the PPI network of these intersection targets was acquired using the STRING database (Supplementary Fig. 3). Finally, using Cytoscape software, the top 10 core targets of QT’s action on HCC were screened based on the degree values of the targets, including AKT1, epidermal growth factor receptor (EGFR), Proto-oncogene tyrosine-protein kinase Src (SRC), matrix metalloproteinase 9 (MMP9), glycogen synthase kinase 3 beta (GSK3B), poly (ADP-ribose) polymerase 1 (PARP1), cyclin-dependent kinase 2 (CDK2), MMP2, KDR (also known as vascular endothelial growth factor receptor 2) and insulin-like growth factor 1 receptor (IGF1R), with AKT1 being ranked first (Fig. 5B).
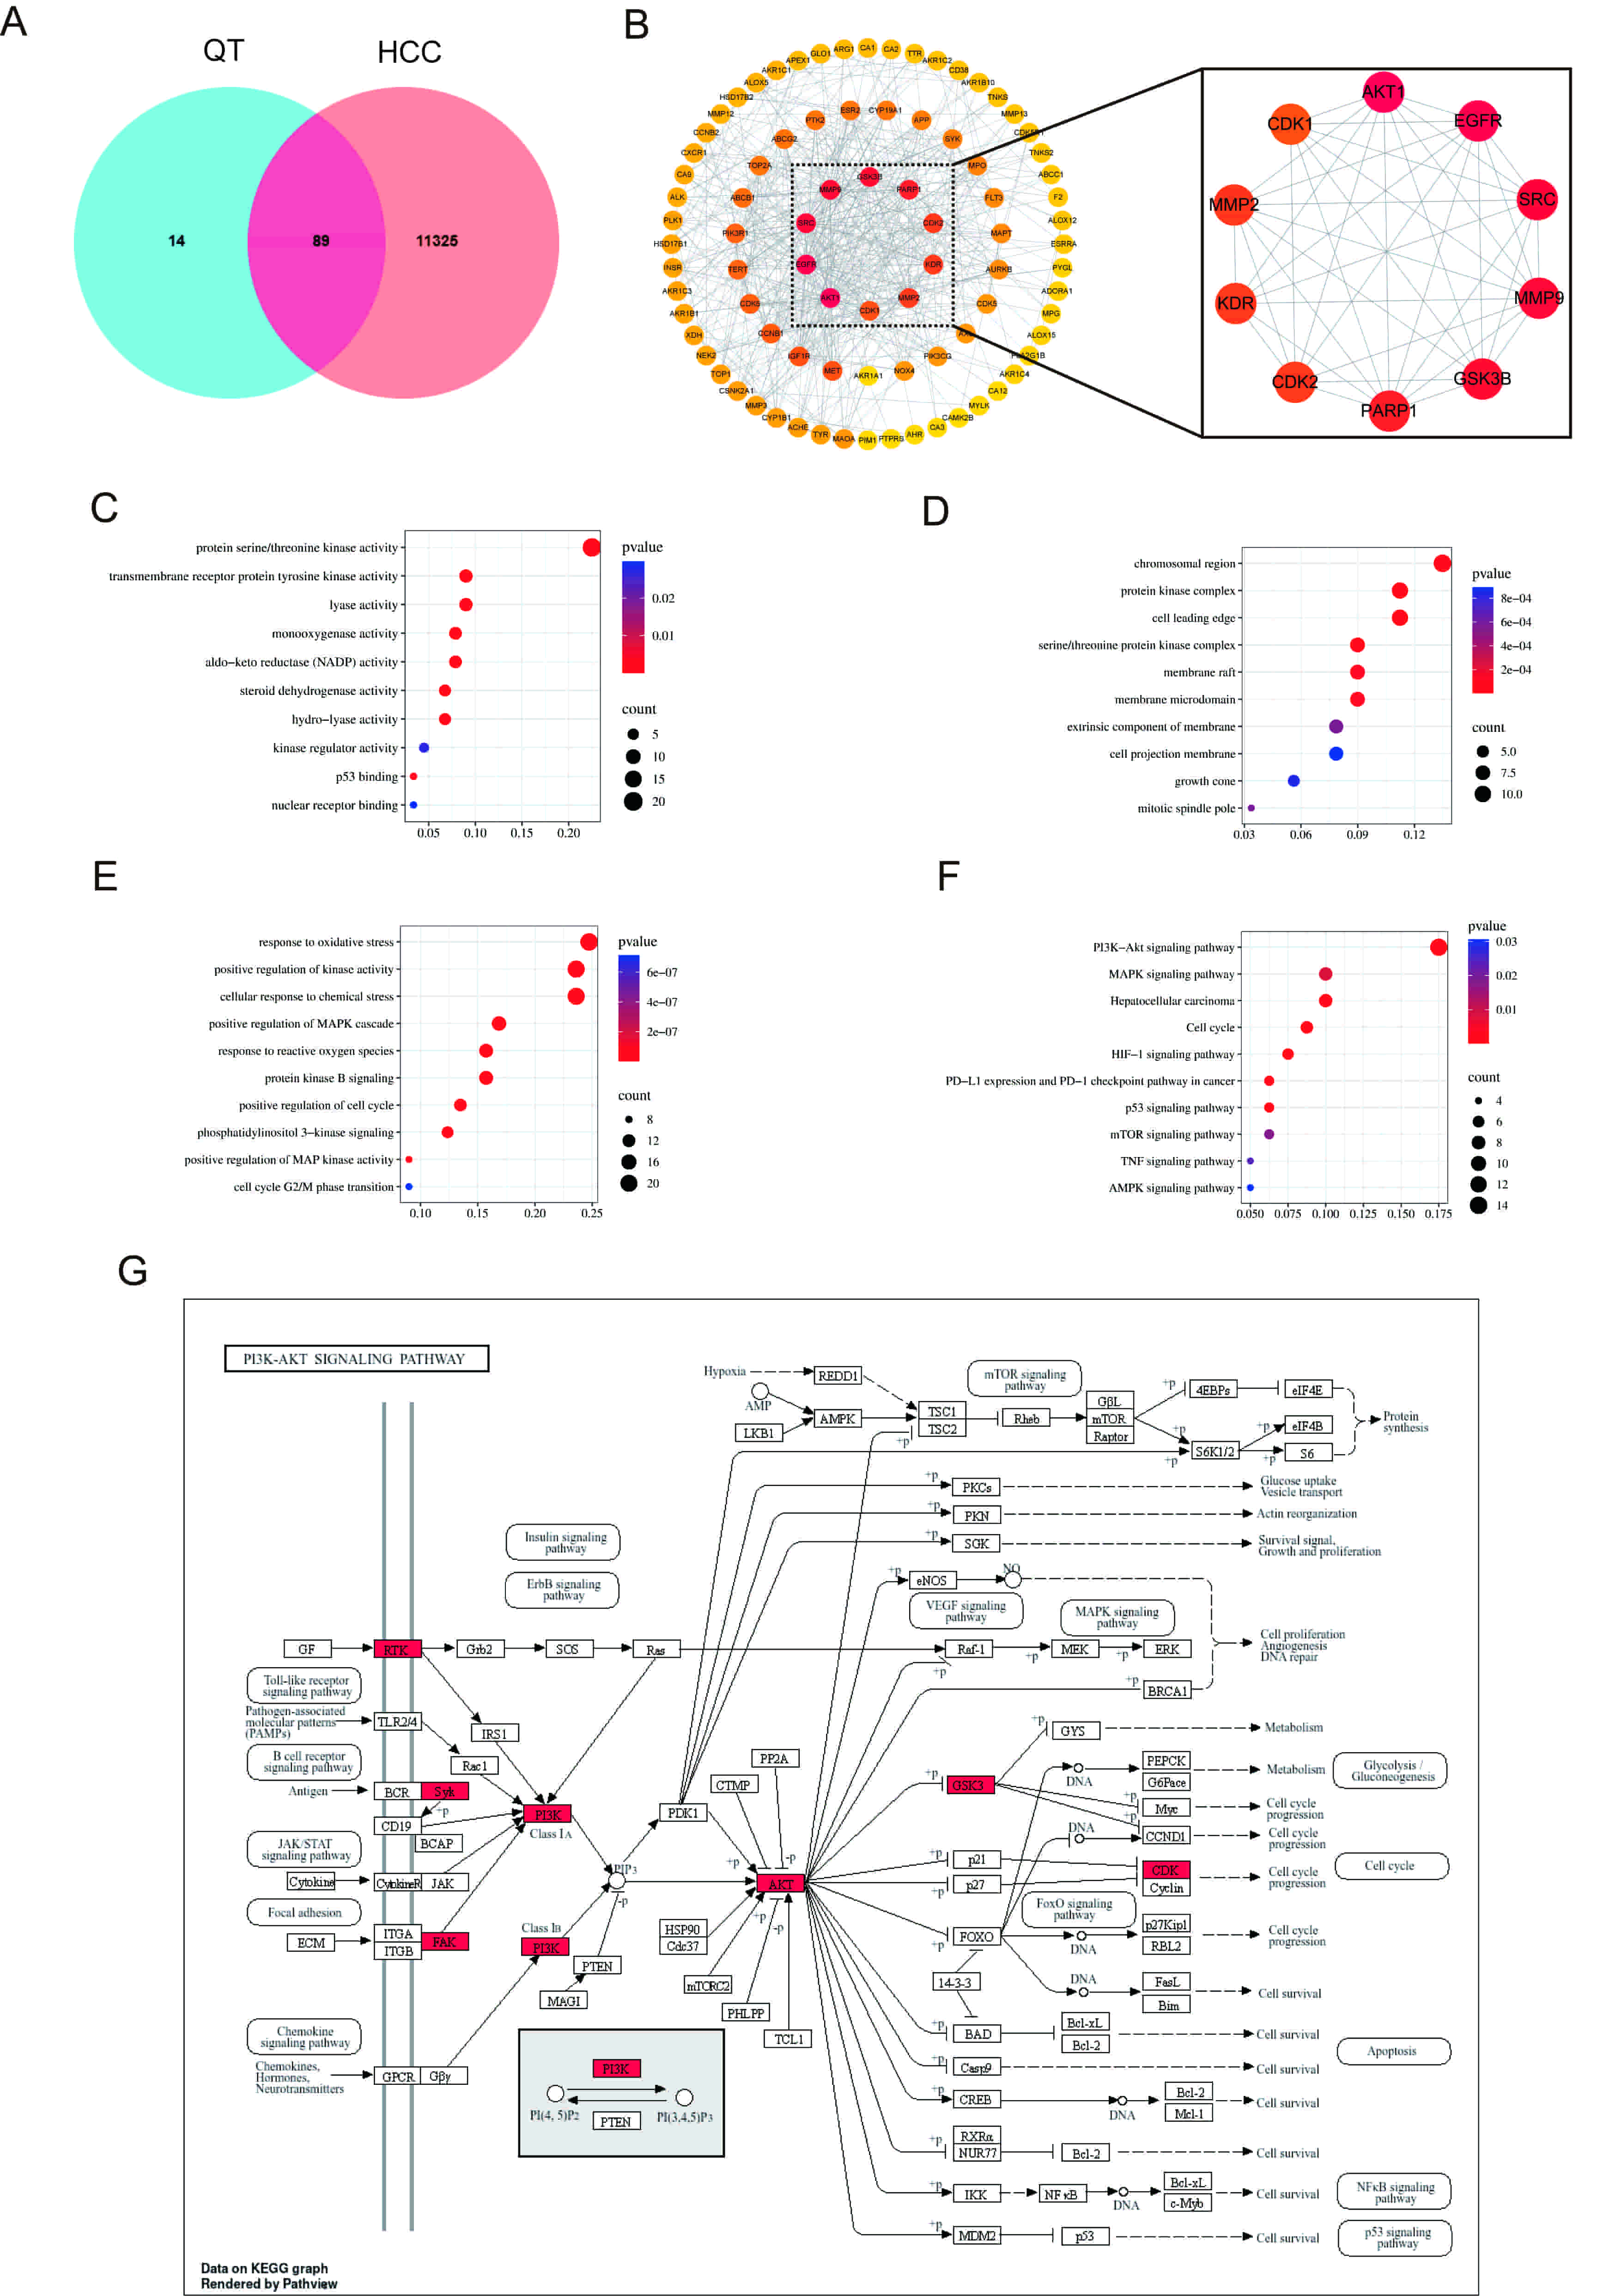 Fig. 5.
Network pharmacology analysis. (A) Venn diagram illustrating overlapping gene targets between QT and HCC. (B) Screening of key targets. (C–E) GO analysis of MF, CC and BP. (F) KEGG analysis. (G) Network diagram of the PI3K/AKT signaling pathway. HCC, hepatocellular carcinoma; GO, Gene Ontology; MF, molecular function; CC, cellular composition; BP, biological process; KEGG, Kyoto Encyclopedia of Genes and Genomes; PI3K, phosphoinositide 3-kinase; AKT, protein kinase B.
To elucidate the molecular function (MF), cellular composition (CC), and biological process (BP) of the predicted target proteins, 89 potential targets of QT for HCC treatment were subjected to GO analysis, with the top 10 items selected by p-value for visualization (Fig. 5C–E). At the BP level, enrichment was primarily observed in the response to oxidative stress, positive regulation of the mitogen-activated protein kinase (MAPK) cascade, phosphoinositide 3-kinase (PI3K) signaling, and the cell cycle G2/M phase transition. At the CC level, enrichment was mainly in the protein kinase complex, membrane raft, and membrane microdomain. At the MF level, enrichment was in protein serine/threonine kinase activity and kinase regulator activity. KEGG enrichment analysis showed (Fig. 5F) that the therapeutic effect of QT on HCC may be regulated through signaling pathways such as PI3K/AKT (Fig. 5G), MAPK, and mammalian target of rapamycin.
To explore AKT1’s binding capacity to QT, we carried out molecular docking of
the two to validate their binding (Fig. 6A,B). The findings demonstrated a
binding energy of –9.6 kcal/mol, implying that AKT1 and QT underwent spontaneous
and effective docking. The molecular docking results of EGFR, GSK3
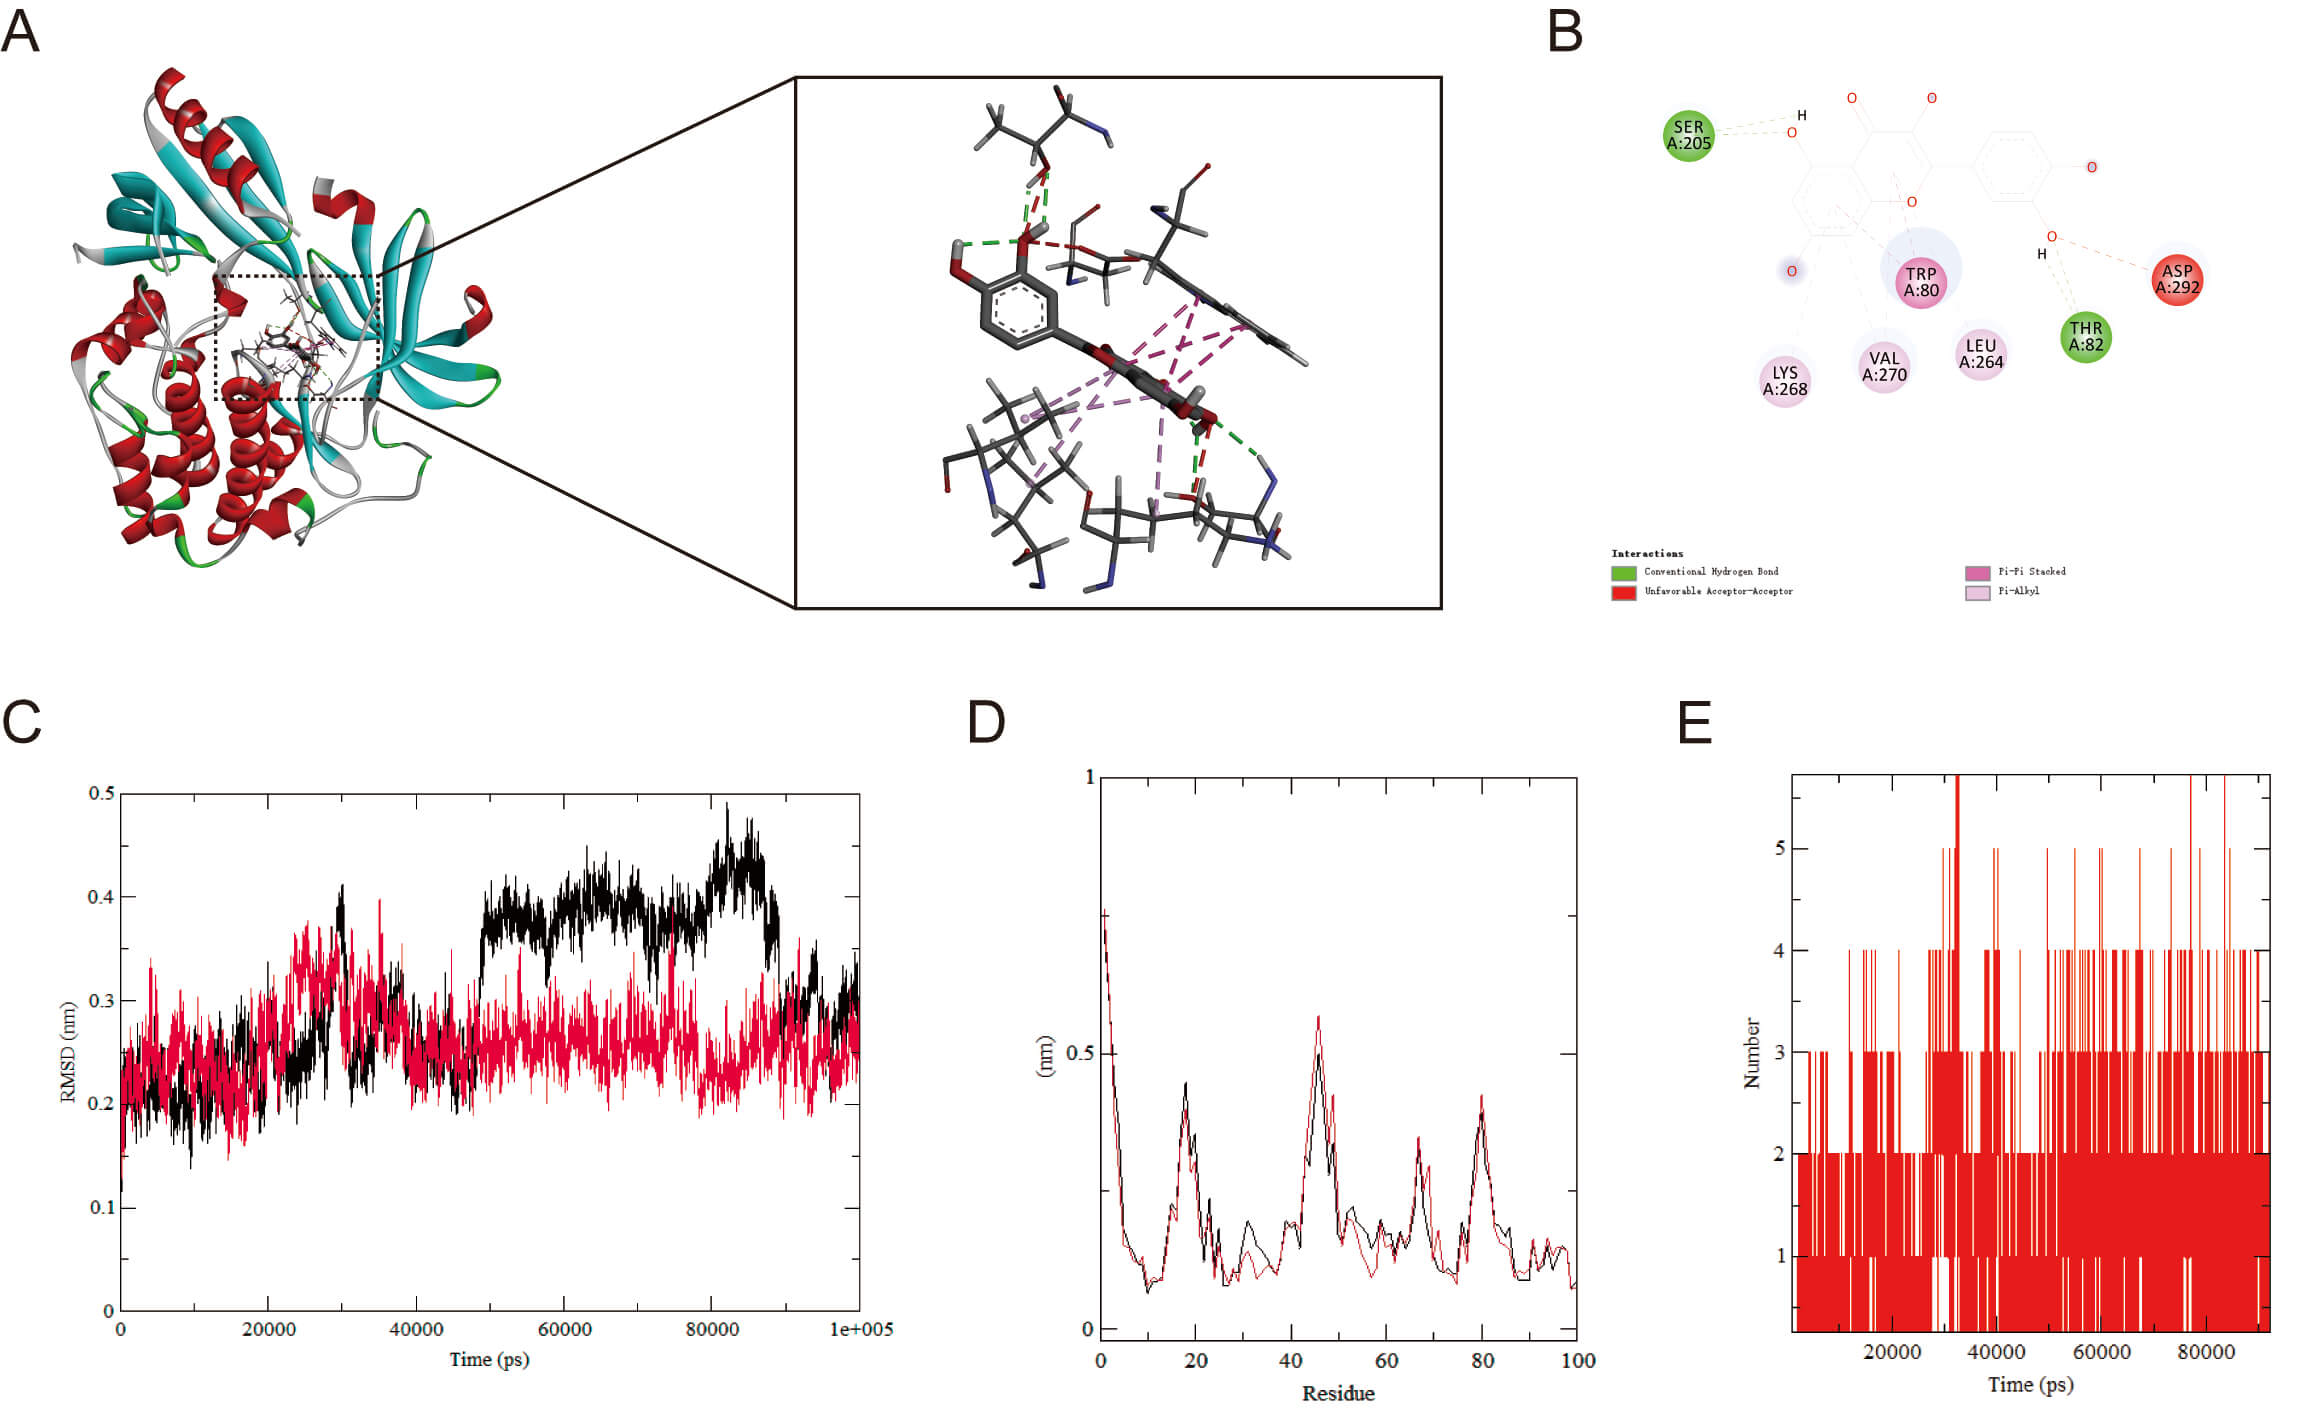 Fig. 6.
Molecular docking and MD simulation. (A) Molecular docking of AKT1 with QT (binding energies: –9.6 kcal/mol). (B) Molecular Docking 2D Structure. (C) RMSD curve of protein-ligand complexes. (D) RMSF curve of protein-ligand complexes. (E) Number of hydrogen bonds formed between AKT1 and QT. MD, molecular dynamics; RMSD, root mean square deviation; RMSF, root mean square fluctuation.
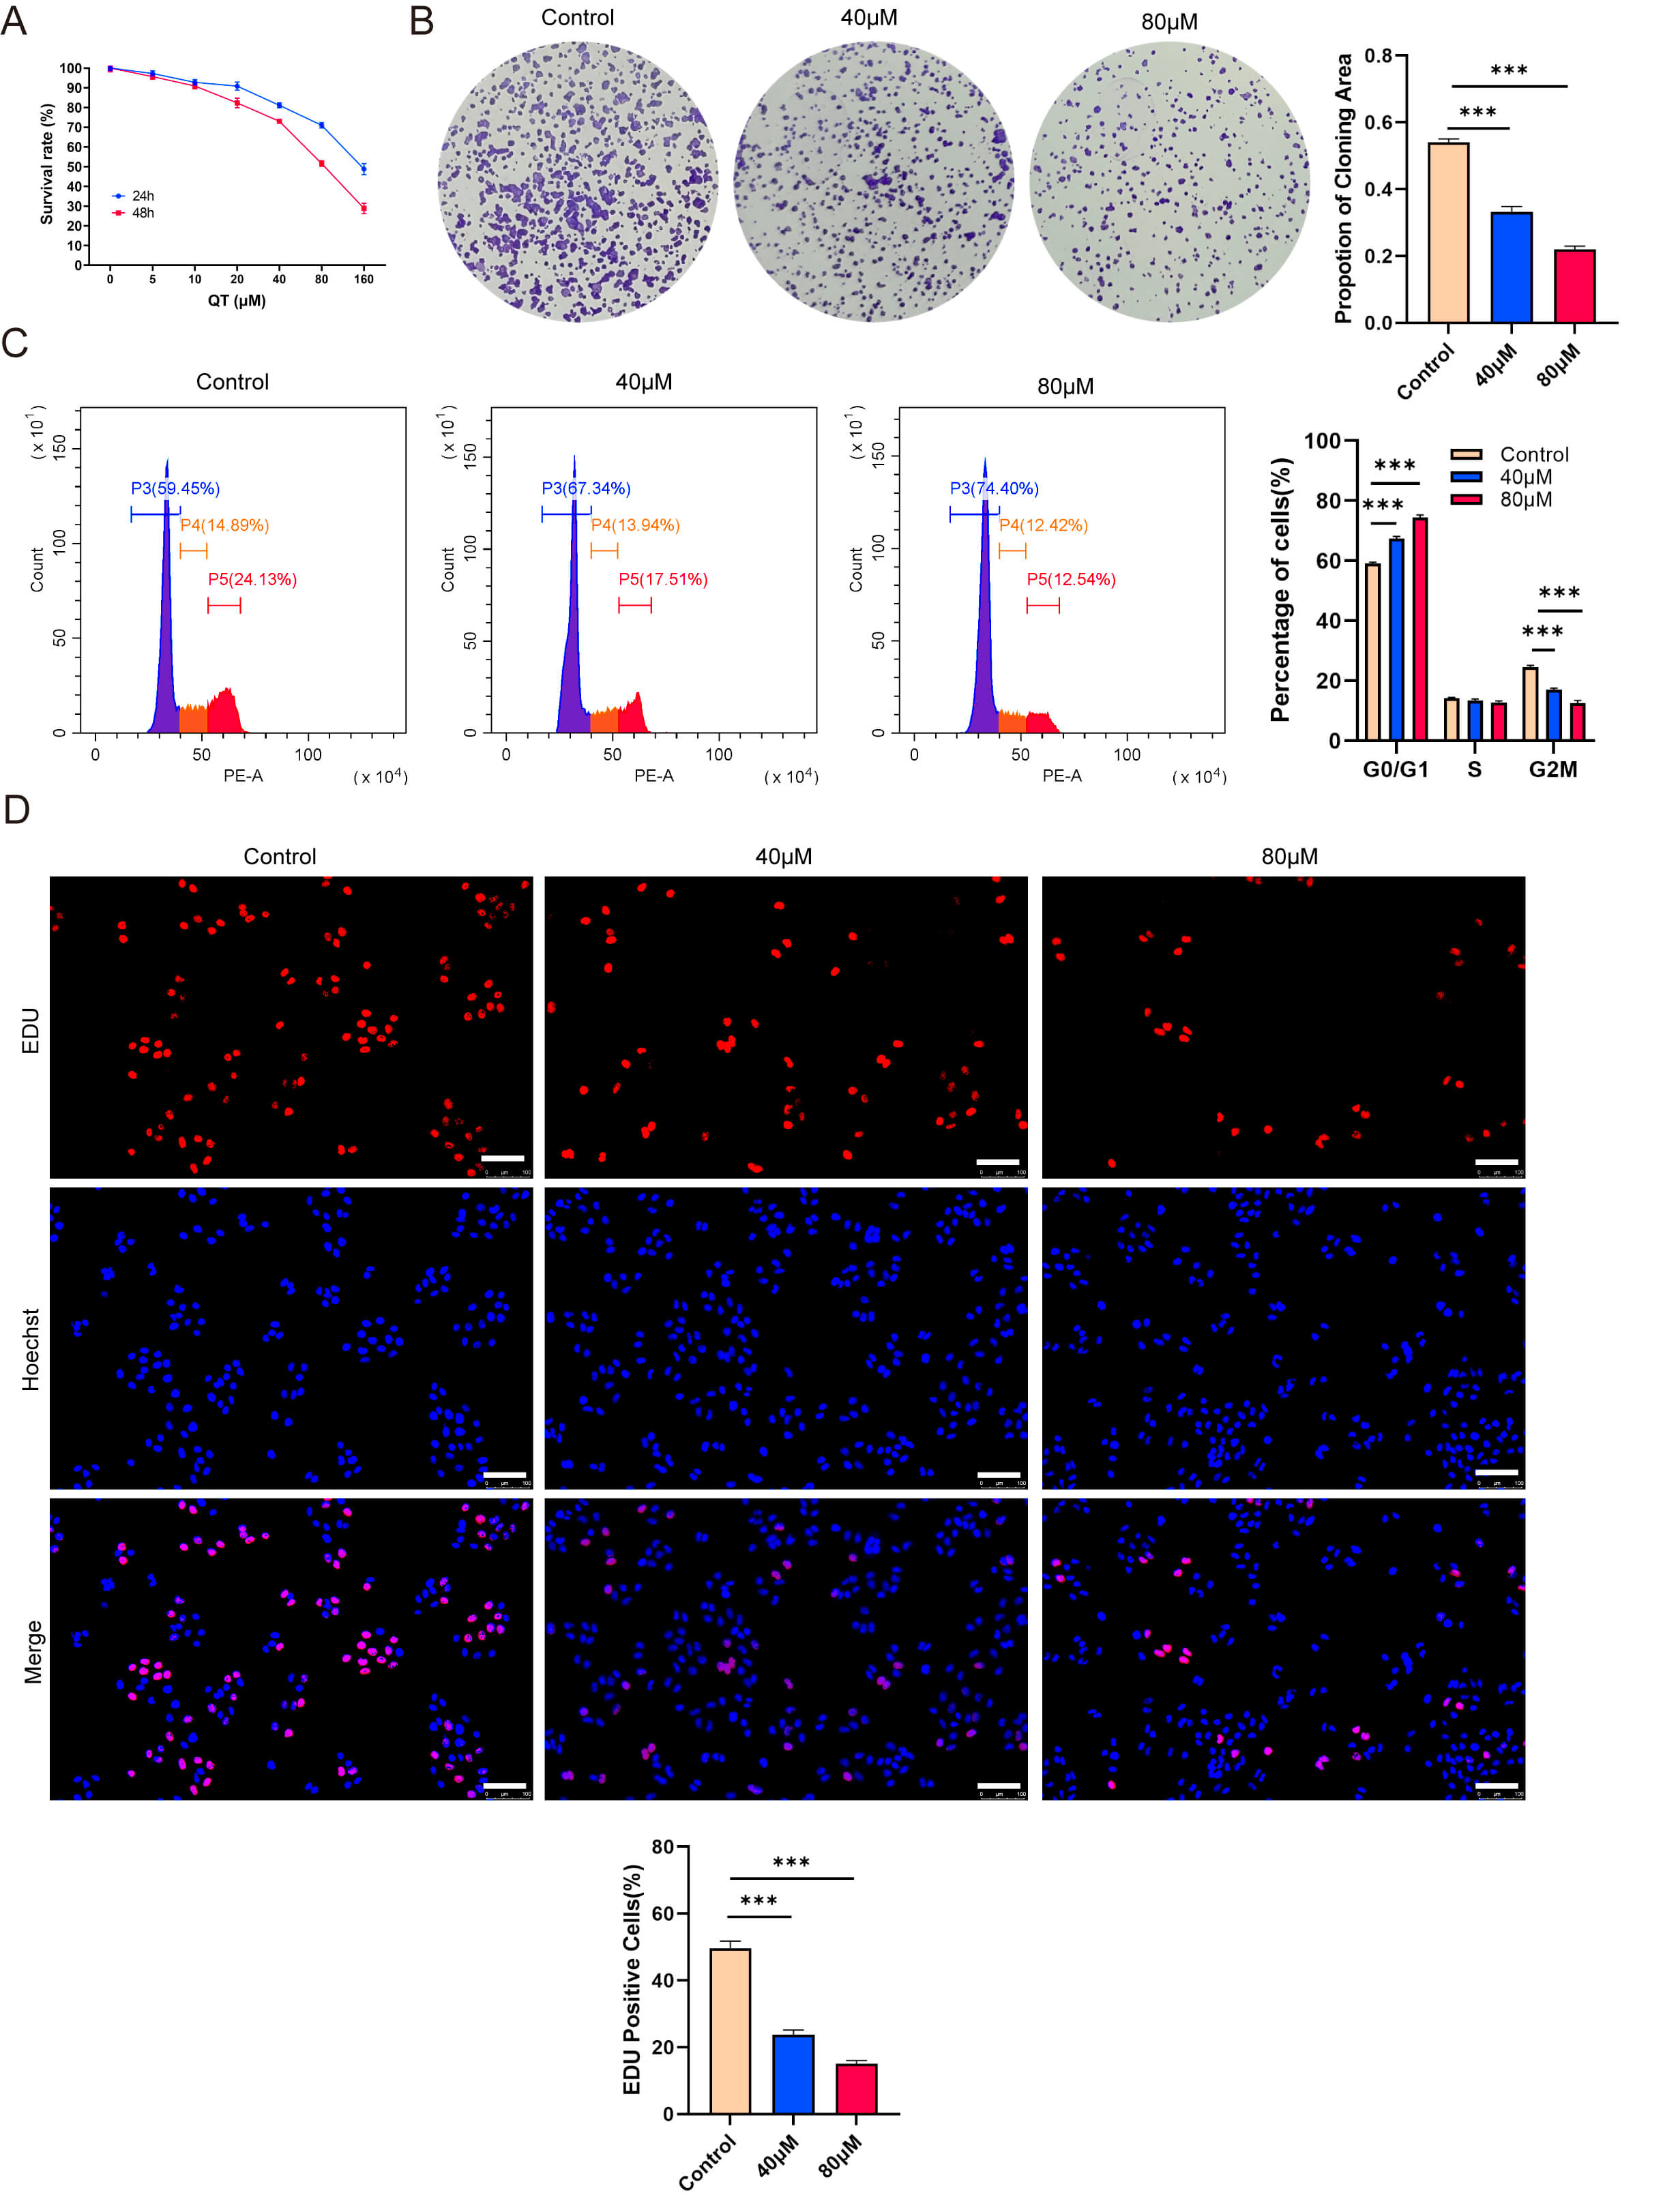
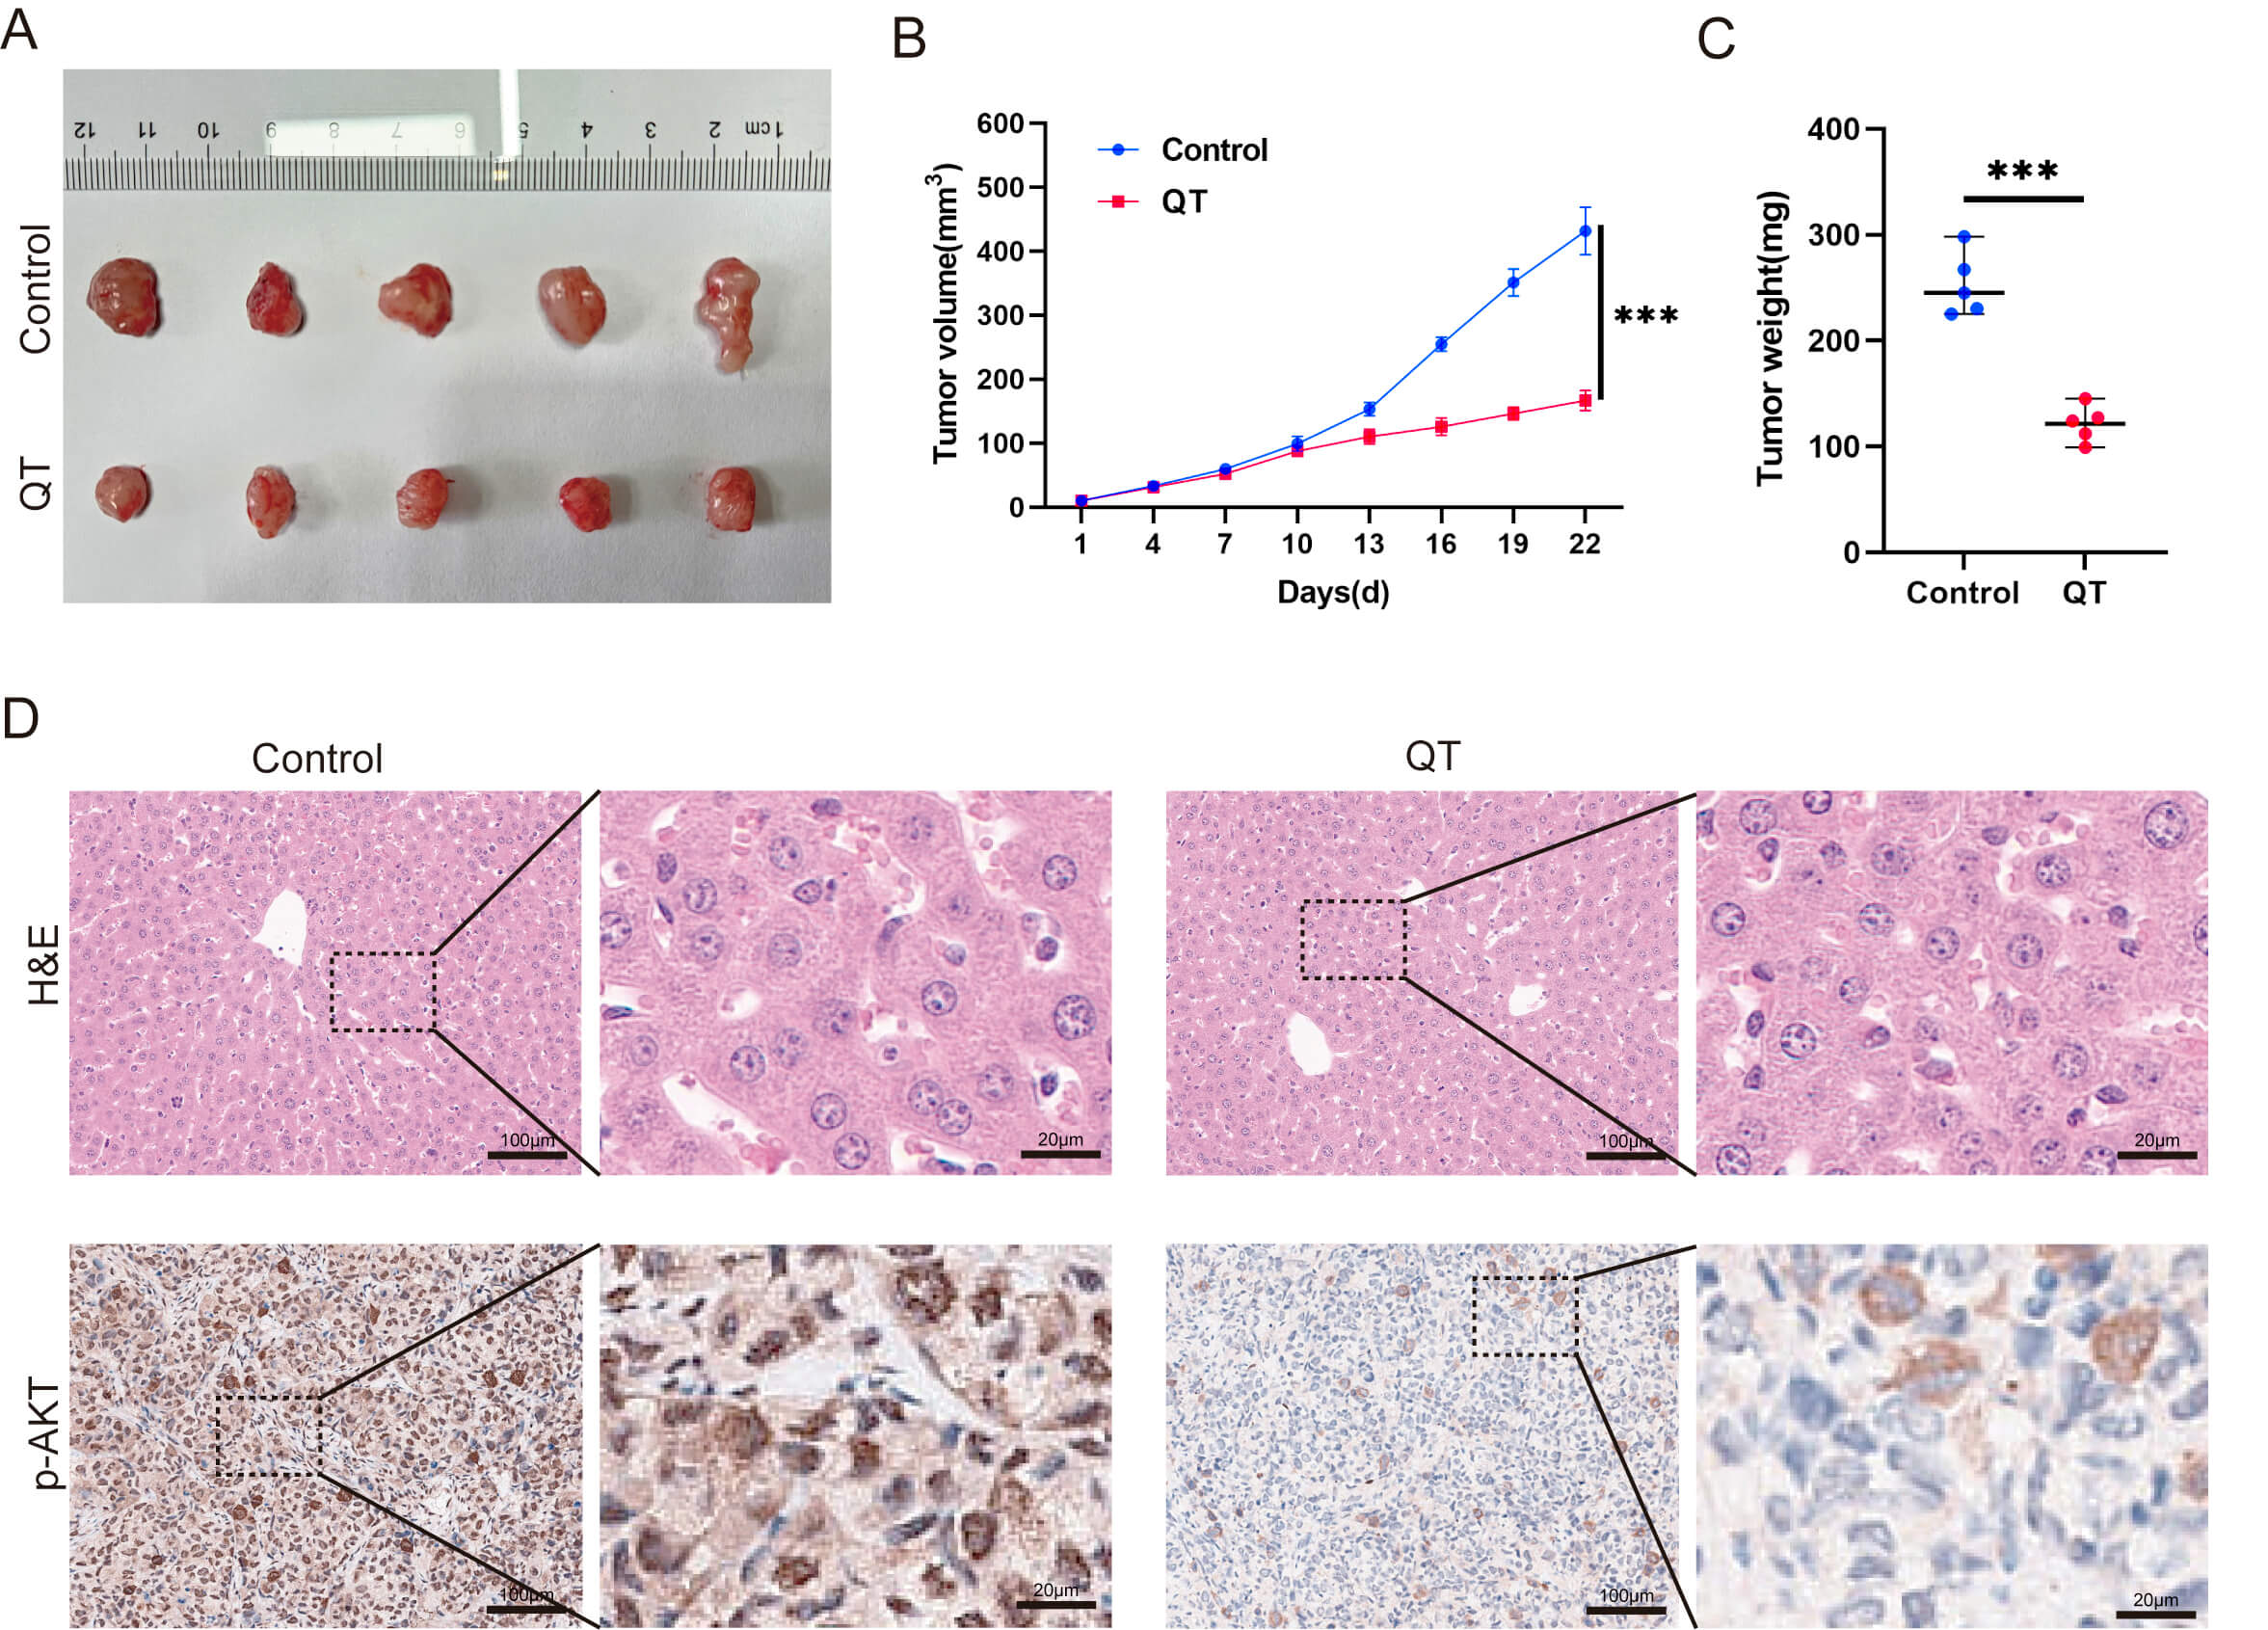
To validate the meta-analysis and network pharmacology findings, we performed in vitro experiments. First, the CCK-8 assays showed that QT inhibited the HCC cell line MHCC-97H in time- and dose-dependent manners. Treating MHCC-97H cells with 40 or 80 µM QT for 24 h resulted in ~10% and ~30% inhibition rates, respectively (Fig. 7A). Thus, these two concentrations were selected for subsequent experiments. Colony formation assays revealed that QT significantly reduced MHCC-97H colony numbers (Fig. 7B). A flow cytometry-based cell cycle analysis showed that QT induced G0/G1 phase arrest and prolonged the G2/M phase in MHCC-97H cells, indicating suppressed cell proliferation (Fig. 7C). Additionally, 5-ethynyl-2′-deoxyuridine (EdU) incorporation assays demonstrated a significant decrease in the EdU-positive rate of QT-treated MHCC-97H cells (Fig. 7D). Collectively, these results confirmed that QT inhibited MHCC-97H proliferation. To further validate QT’s anti-HCC effects, we conducted in vivo experiments using tumor-bearing mice. The results showed that both the volume and weight of subcutaneous tumors in the QT group were significantly lower than those in the control group (Fig. 8A–C). Meanwhile, hematoxylin and eosin (H&E) staining indicated no obvious liver tissue damage in the QT group (Fig. 8D), suggesting that the therapeutic QT dose exerted no significant hepatic toxicity in mice. To explore the underlying mechanism of QT’s anti-HCC action, we performed immunohistochemistry. The results revealed significantly lower expression of phosphorylated AKT in the QT group (Fig. 8D), verifying the network pharmacology findings. Thus, QT likely inhibits HCC progression by suppressing the PI3K/AKT pathway.
 Fig. 7.
Quercetin (QT) inhibits the proliferation of MHCC-97H cells
in vitro. (A) CCK-8 shows time-and dose-dependent inhibition by QT. (B)
Colony formation shows QT reduced colony numbers. (C) Flow cytometry shows QT
induced G0/G1 arrest and prolonged G2/M phase. (D) EdU shows QT decreased
EdU-positive rate. CCK-8, Cell Counting Kit-8; EdU,
5-ethynyl-2′-deoxyuridine. Scale bar: 100 µm. ***: p
 Fig. 8.
QT inhibits HCC tumors by suppressing the PI3K/AKT
signaling pathway in vivo. (A–C) Subcutaneous tumors in the QT group
were remarkably lower than those in the control group. (D) Results of H&E
staining and p-AKT IHC in the control group versus the QT group. H&E,
Hematoxylin and Eosin Staining; p-AKT, Phosphorylated Protein Kinase B; IHC,
Immunohistochemistry. Scale bar: 100 µm (main figure), 20 µm
(enlarged view). ***: p
HCC is the most common type of primary liver cancer, accounting for approximately 75–85% of cases. It is also the sixth most prevalent cancer globally and ranks third among the most lethal cancers worldwide [35]. The complex pathogenesis and molecular heterogeneity of HCC impedes its early diagnosis. Most patients are already diagnosed with unresectable hepatocellular carcinoma (uHCC), that is, advanced-stage HCC, by the time it is detected, thus losing the opportunity for surgical intervention. The current standard of care frequently involves a combination of tyrosine kinase inhibitors, immune checkpoint inhibitors (programmed cell death protein 1/programmed death-ligand 1), and interventional procedures [36, 37, 38, 39]. However, the continuous use of targeted immunotherapies can lead to cancer cells developing drug resistance through various pathways, in addition to the risk of toxicity and adverse reactions [40]. For example, the study havs shown that lenvatinib monotherapy only achieves an objective response rate of 24.1% [41]. Thus, it is necessary to develop adjuvant or alternative therapies to improve cancer treatment. Some studies have focused on exploring the antitumor effects of natural compounds on HCC. As a natural compound from TCM, QT has multiple anticancer properties, including cancer cell apoptosis, inhibiting cell growth, and reversing multidrug tumor resistance. It also enhances the effects of targeted drugs, immune drugs, and chemotherapy [42]. Nevertheless, clinical evidence on the use of QT in patients with HCC is currently lacking. We conducted a meta-analysis to systematically investigate the anticancer effects of QT on animal models of liver cancer, focusing on its anti-HCC effects and potential toxicities. This is to advance the transition of QT-based anti-HCC treatment from animal experiments to clinical applications and provide a reference for finding new ideas for the treatment of liver cancer from traditional medicine.
Our meta-analysis revealed that QT demonstrated remarkable antitumor activity in
a mouse xenograft model of liver cancer. It not only inhibited the growth of
subcutaneous tumors in mice (tumor volume SMD: 4.63, 95% CI: 3.44–5.82, Z =
7.63, p
To validate the results of our meta-analysis, a subcutaneous HCC xenograft model
was established. Compared with the control group, mice in the QT group exhibited
significantly reduced tumor weight and volume (n = 5, p
This study is among the first to integrate meta-analysis, network pharmacology, and in vivo experiments to explore the safety, efficacy, and potential pharmacological mechanisms of QT against HCC. However, this study had some limitations. First, missing outcome data from included studies were obtained via author contact or graphical digitization (GetData Graph Digitizer); despite error reduction through double-checking, these methods may have still introduced biases (e.g., author data deviations, digitization errors) which slightly compromised the reliability of the results. Second, human clinical data are insufficient to support the in vivo findings, and the safety profile of QT in humans awaits further verification. Finally, the efficacy of QT in combination with current first-line HCC therapies (e.g., atezolizumab plus bevacizumab) has not been explored.
This study preliminarily explored the effectiveness, safety, and pharmacological mechanisms of QT in treating mouse HCC. The meta-analysis, supported by our in vivo findings, suggests that QT has potential as a therapeutic agent for HCC. The compound appears to be safe, with no significant weight loss or hepatotoxicity observed in the study cohorts. However, these results must be confirmed through well-designed clinical trials. Meanwhile, we used network pharmacology analysis to reveal the multi-target and multi-pathway characteristics of QT. By identifying key targets such as AKT1, EGFR, and MMP9, and critical signaling pathways including PI3K/AKT, MAPK, and hypoxia-inducible factor 1 pathways, of which the PI3K/AKT pathway is particularly important, this research provides a strong theoretical basis for further investigation. Future research should focus on validating QT’s potential for HCC treatment through basic experiments while also improving the quality of clinical trials.
Data and materials are available from the corresponding author upon reasonable request.
ZGT, YC, YHP, YT, BS, JZ, YFZ, OL, CP, and XC contributed to the study conception and design. ZT conducted the experiment and organized the data for this study; YC, YP designed the protocol for this systematic review. YT, BS, JZ, and OL performed literature screening and data extraction; ZT and XC wrote the first draft of the manuscript; All authors contributed to editorial changes in the manuscript. All authors read and approved the final manuscript. All authors have participated sufficiently in the work and agreed to be accountable for all aspects of the work.
The animal study was reviewed and approved by the Ethics Committee of Hunan Provincial People’s Hospital, in accordance with the guidelines of the Chinese Council on Animal Care (Ethical Number: [2023]-151).
Not applicable.
This research was funded by Hunan Provincial Natural Science Foundation (NO. 2024JJ6276 and NO. 2023JJ40387); Natural Science Foundation of Changsha (NO. kq2208120); Scientific and Technological Innovation Team Project of Hunan Provincial People’s Hospital (NO. KCTG202502).
The authors declare no conflict of interest.
Supplementary material associated with this article can be found, in the online version, at https://doi.org/10.31083/FBL46289.
References
Publisher’s Note: IMR Press stays neutral with regard to jurisdictional claims in published maps and institutional affiliations.