


 , Les Hatton 2
1 Department of Biochemistry and Molecular Biology, Medical University of South Carolina, Charleston, SC 29403, USA
2 Formerly School of Computer Science and Mathematics, Kingston University, KT1 1LQ London, UK
Abstract
The nucleotide “words” (k-mers) of the genome exhibit two essentially universal properties that follow probabilistically from the Conservation of Hartley-Shannon Information (CoHSI): (1) a Zipfian rank-ordered distribution of frequencies and (2) universal inverse symmetry. Here, we address the presence of these 2 properties in the transcriptome, a question of interest given the strong and specific structure/function constraints on RNAs, especially the protein-coding (CDS) sequences.
CDS and ncRNA (non-coding RNA) databases were accessed at e!Ensembl. For determination of a power-law, statistical tests of both necessity (linearity) and sufficiency (confidence that a power-law distribution could not be rejected) were applied. Compliance with inverse symmetry was assessed by linearity and residual standard error.
The CDS and non-coding RNAs for 53 species were analyzed separately and the data presented as short movies. The results were consistent for all species analyzed, and taking the bonobo (Pan paniscus) as a representative species, the following results were obtained. For the Zipfian distribution of k-mer frequencies, statistically robust tests of both necessity (adjusted R-squared of 0.9932 and p ≤ 2.2 × 10⁻¹⁶) and sufficiency were obtained for the CDS; for non-coding RNAs the test of necessity was robust (adjusted R-squared = 0.9982 and p ≤ 2.2 × 10⁻¹⁶). Perturbations of inverse symmetry were observed in both CDS (slope = 0.91, adjusted R2 = 0.77) and non-coding RNAs (slope = 1.02, adjusted R2 = 0.84). The disruption of inverse symmetry in the CDS affected particularly the 3- and 6-mers and was shown to be associated with codon (especially stop codon) frequency in the open reading frame.
Whereas the CoHSI-predicted Zipfian distribution of k-mer frequencies was observed in both the protein-coding and non-coding RNAs of 53 species, in contrast the compliance with inverse symmetry was weaker. This weakening of compliance was seen to a greater extent in the CDS than in the non-coding portions of the transcriptome and may be associated with the necessity to maintain the integrity of the reading frame in the CDS. These results illustrate the general principle that local perturbations of an overall CoHSI-guided equilibrium state of a biological system can provide insight into the underlying causes of such perturbations.
Keywords
- transcriptome
- k-mer frequency
- Zipfian distribution
- universal inverse symmetry
- Conservation of Hartley-Shannon Information
- CoHSI
- mRNA
- non-coding RNA
The different stages by which information flows from the genome through to the fully developed organism are complex and subject to diverse evolutionary constraints. While the genome is primarily a store of information that must be faithfully replicated and transmitted inter-generationally, it must also allow for the precisely regulated activation and transcription of the genes that are engaged in both baseline cellular function, the differentiation of cells and the development of the organism.
In contrast the transcriptome (the totality of RNA in the cell) contains, in addition to the protein-coding mRNAs, a diverse collection of non-coding RNAs (ncRNA) most of which are known to have important functional roles. The ncRNA includes ribosomal RNA (rRNA), transfer RNA (tRNA), transfer RNA located in the mitochondrial genome (Mt-tRNA), small cytoplasmic RNA (scRNA), small nuclear RNA (snRNA), small nucleolar RNA (snoRNA), microRNA (miRNA), long intergenic non-coding RNAs (lincRNA) and miscellaneous other RNAs (misc RNA), documented at https://useast.ensembl.org/info/genome/genebuild/ncrna.html, accessed 08-Aug-2025.
Given the primary role of the genome as a stable store of essential information that can be accessed (through transcription) in a highly regulated manner, it came as a surprise to find that the structure of DNA conforms to near-universal patterns that were not clearly associated with these vital functions. While DNA conforms to the familiar double helical structure (stabilized by Watson-Crick (W-C) hydrogen bonding between complementary bases on the 2 strands), it also shows in its structure two universal patterns associated with a single strand of the double helix and whose significance is a matter of debate.
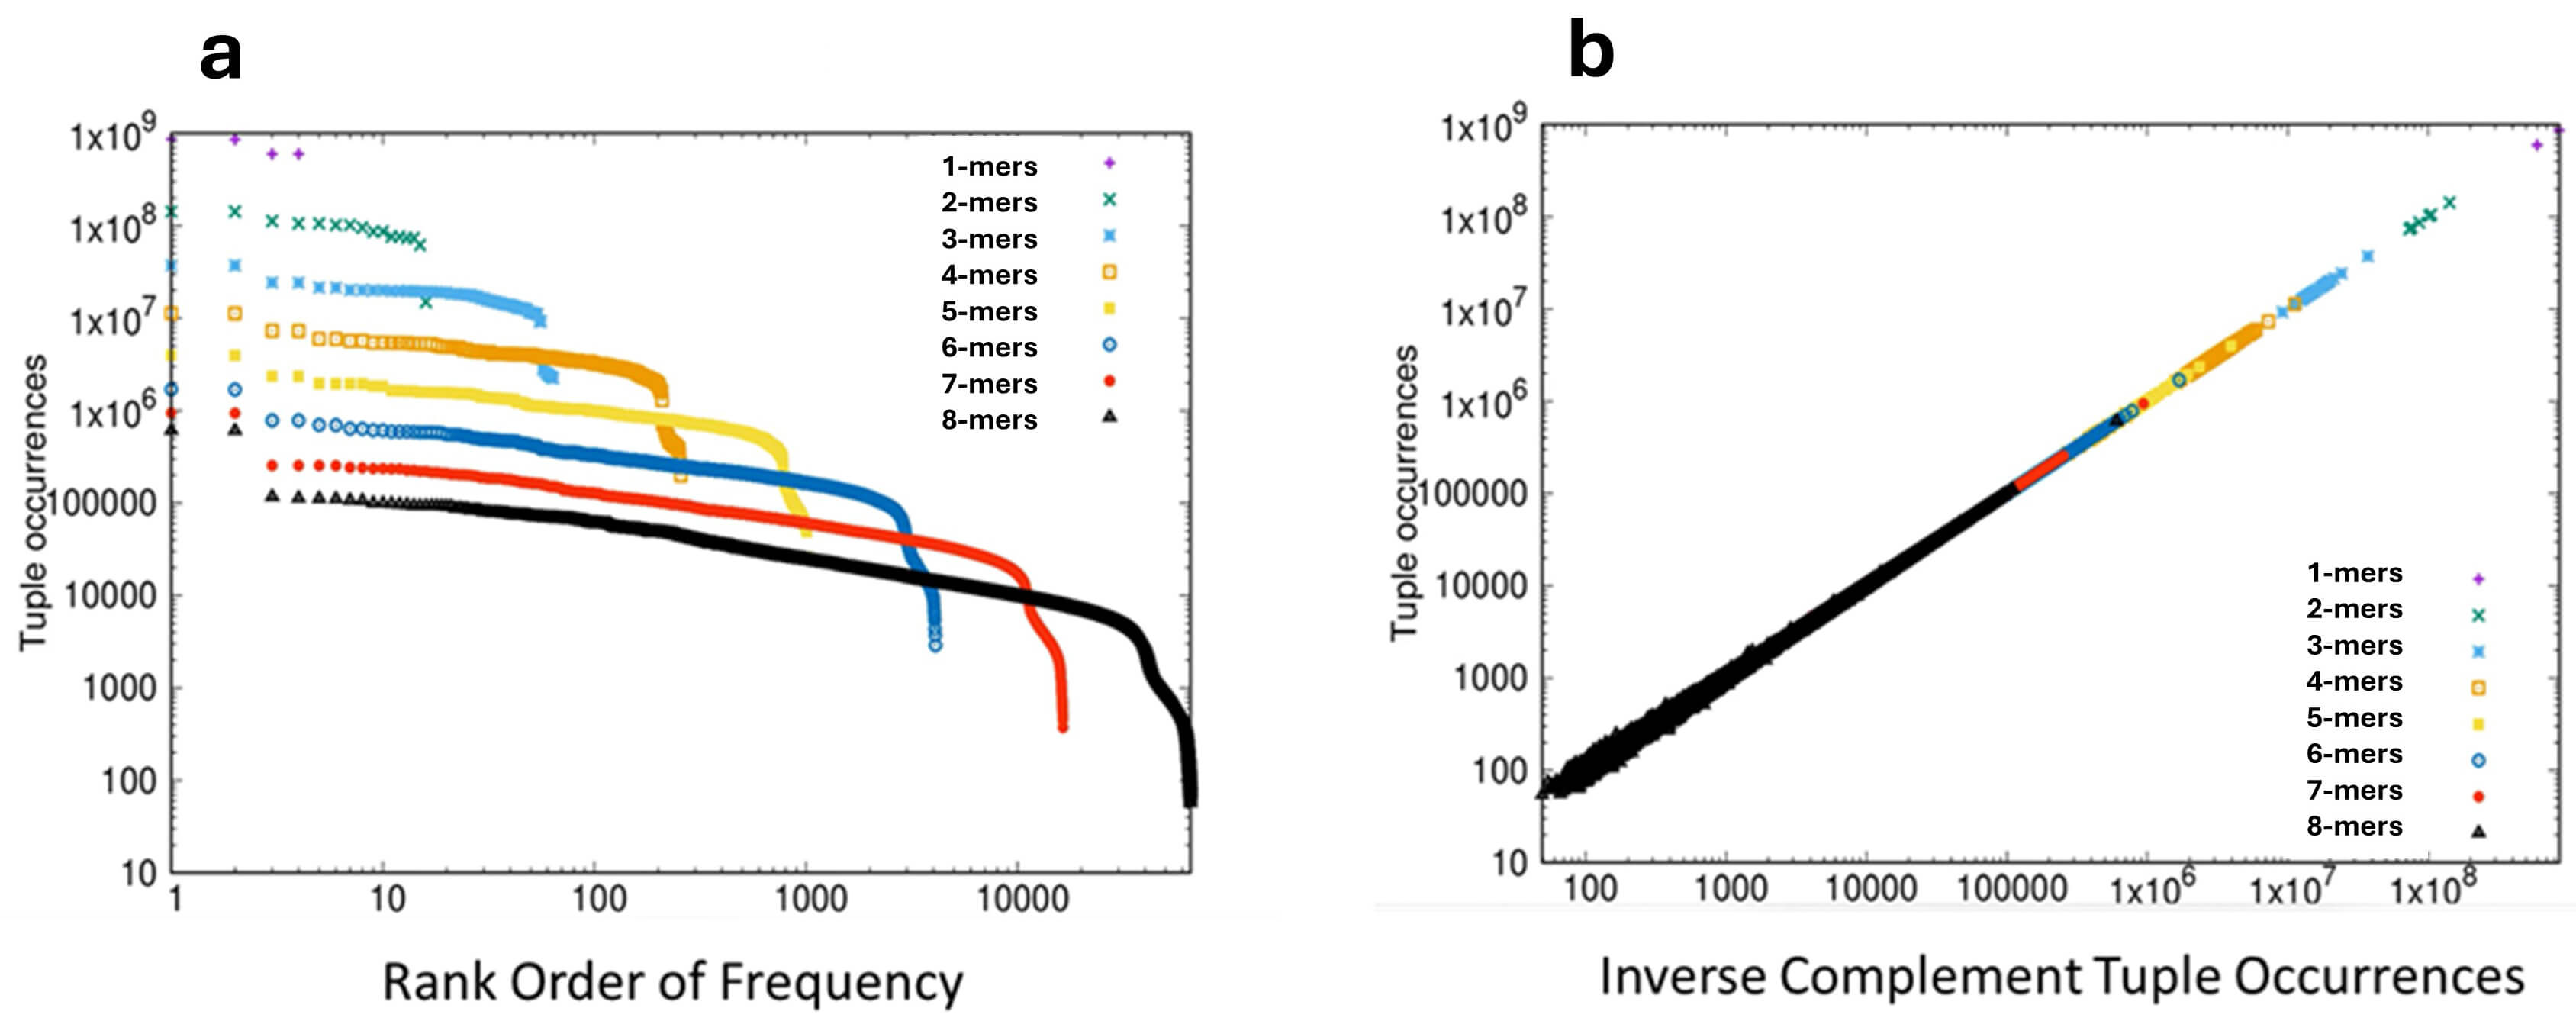
First we can consider the frequency distribution of short sequence motifs. The linear sequence of bases on a single strand of DNA can be considered as a series of short motifs or “words”, typically known as k-mers (synonymous with n-tuples). For example, the sequence AATGCC is a 6-mer, one of 4096 such possible 6-mers. If one takes a well-characterized genome and counts the frequencies of each of the possible k-mers of a given length, the observed rank-order distribution of these frequencies follows closely the mathematical form of a power-law [1] an observation associated with the work of the linguist George Zipf on word frequencies in texts [2]. When a pure power law is plotted on log-log scales a characteristic straight line is observed, and when the frequency of k-mers in a genome is plotted in rank order on log-log scales a distribution dominated by the straight line of a power law is obtained, as illustrated for the genome of the bonobo Pan paniscus in Fig. 1a.
 Fig. 1.
Frequency distribution of k-mers in the genome of the bonobo Pan paniscus. (a) The rank-ordered frequency distribution of k-mers 1–8 plotted on log-log scales. The frequency of each k-mer is plotted on the Y-axis and the rank-order of frequencies is plotted on the X-axis. Statistical analyses: Applying criteria of both necessity and sufficiency for power-laws in the region 100 to 10,000 amino acids gave the following results. For linearity, adjusted R2 = 0.9996 (p
This distribution (termed Zipfian) also displays a characteristic droop in the tail of the lowest occupied ranks, and is one of the two canonical distributions observed, essentially universally, in discrete systems [1, 3, 4]. The second intriguing property of a single strand of DNA is that of inverse symmetry. Over 50 years ago [5, 6] it was realized that the composition of a single strand of DNA showed roughly equivalent amounts of the complementary bases (i.e., G=C, A=T), an observation that was subsequently extended to complementary pairs of k-mers [7, 8, 9, 10, 11]; applying W-C rules, the inverse complementary sequence of AATGCC reads GGCATT. This phenomenon of equivalence between inverse complementary bases or k-mers on a single strand of the double helix was known originally as Chargaff’s Second Parity Rule, now abbreviated to PR2. This presence of equivalent numbers of inverse complementary k-mers on a single strand of DNA is known as inverse symmetry (sometimes Universal Inverse Symmetry) and when the frequencies of k-mers is plotted against the frequencies of their inverse complementary k-mers on the same strand, perfect inverse symmetry will give rise to a straight line plot, with a slope of unit value, as illustrated in Fig. 1b for the genome of the bonobo.
These two properties of k-mers are intimately linked; first, the Zipfian distribution of k-mer frequencies arises purely probabilistically in qualifying discrete systems from the Conservation of Hartley-Shannon Information (CoHSI) [1, 3] and then inverse symmetry follows from the imposition of W-C base pairing between the complementary strands of the DNA helix [1]. Thus, in DNA we have the interesting condition in which, despite the undoubtedly rigorous evolutionary selection that has been imposed on DNA structure and function, these two universal patterns that are the probabilistic fingerprints of CoHSI are present despite the undeniable constraints of basic biochemical structure and function, as well as the history of natural selection characterizing the myriad lineages of living organisms. What role might inverse symmetry have played in the evolution of the genome? Forsdyke [12] has suggested that although inverse symmetry may have arisen non-adaptively, early in evolution it assumed essential functional roles, for example in recombination-mediated error correction.
In contrast RNA (writ large) is at the nexus of a number of essential cellular functions for which inverse symmetry is essential. It appears integral to the structure and function of essentially all the diverse components of the transcriptome, primarily by enabling the formation of stem-loop hairpin structures and pseudoknots. These play essential roles in the secondary and tertiary structures of RNAs [13, 14] and in their interactions with other components of the cellular machinery. Despite their apparent simplicity stem-loop and pseudoknot structures are fundamental to a highly diverse range of functions. For example they have an important role in regulating the translation of mRNAs [15, 16, 17, 18] and in the programmed frameshifts in protein translation that are prominent in some viruses [19, 20]. MicroRNAs are processed from stem-loop precursor structures [21]. In evolutionary terms, Seligmann and Raoult [22] have postulated that stem-loop hairpin RNAs were essential ancestral structures to both ribosomal RNAs and the RNA viruses, and Forsdyke [12] suggests that selection for protein-coding function would have forced the migration of stem-loop structures into non-coding introns.
The hypothesis that we address in this study is that the two essentially universal properties of DNA (Zipfian k-mer frequency distribution and inverse symmetry) will (1) also be present collectively in the transcriptome but (2) that these properties will also demonstrate different degrees of compliance in the coding and non-coding RNAs. These differences should be informative of the different and diverse constraints imposed on them during evolution, with the caveat that the category of non-coding RNAs is highly diverse in structure and function. Thus we focus primarily on the mRNAs, where there is both a homogeneity of primary function (encoding proteins) and a sufficiency of data.
FASTA files for CDS and ncRNA of 53 species were downloaded from e!Ensembl at https://www.ensembl.org/info/data/ftp/index.html?redirect=no. The species whose data were analyzed are identified both in the .mp4 files and in the reproducibility deliverables for this MS.
We cannot simply assert power-law behaviour based on the property of a statistically supported straight line on a log-log plot. While statistically robust linearity is a necessary condition for the presence of a power-law [23], a criterion of sufficiency such as that described by the Clauset-Gillespie procedure poweRlaw() in R is required [24]. In this test, when a p-value greater than 0.1 is obtained, we cannot exclude the presence of a power-law.
We considered the possible relevance of Bonferroni correction (https://en.wikipedia.org/wiki/Bonferroni_correction, accessed 26-Oct-2025). However, we are extracting only one or two parameters from the same dataset and the p-values that we found are with one exception so small that they are below the minimum normally quoted by R (
The influence of CoHSI on the fine structure of the genome is seen in two linked phenomena. First, in the Zipfian rank-order of k-mer frequencies and second, in the inverse symmetry that results from the combination of the Zipfian distribution of k-mer frequencies and Watson-Crick bonding [1]. These linked phenomena were demonstrated for 178 genomes in [1] and for purposes of illustration representative results are presented here for the bonobo (Pan paniscus). The rank-ordered distribution of k-mer frequencies in the bonobo genome Fig. 1a shows a linearity that is clearest in the case of the 7- and 8-mers, where the linear region extends over 3 decades in rank order. The presence of a robust power-law in the case of the 8-mers is statistically strongly supported as documented in the legend to Fig. 1a. Considering inverse symmetry for k-mers 1–8 in the bonobo genome, this is emphatically demonstrated in Fig. 1b. Robust statistical support for the linearity of the relationship between the frequency of forward and reverse complementary k-mers is presented in the legend to Fig. 1b.
While these linked phenomena represent the CoHSI-predicted most-likely equilibrium state of k-mers in the genome, the CoHSI equilibrium is susceptible to perturbation by functional constraints and selective pressure [4]. The question that we address here is the extent to which these equilibrium properties of the genome as a whole might be perturbed in the 2 broad compartments of the transcriptome, i.e., the protein-coding mRNAs (CDS) and the non-coding ncRNAs. Whilst CoHSI exerts its influence as a purely probabilistic constraint we might expect that the evolutionary forces that have constrained the structure/function relationships of these two classes of RNAs will perturb the CoHSI equilibrium, not only to different extents, but in a manner that provides insight into specific functional constraints.
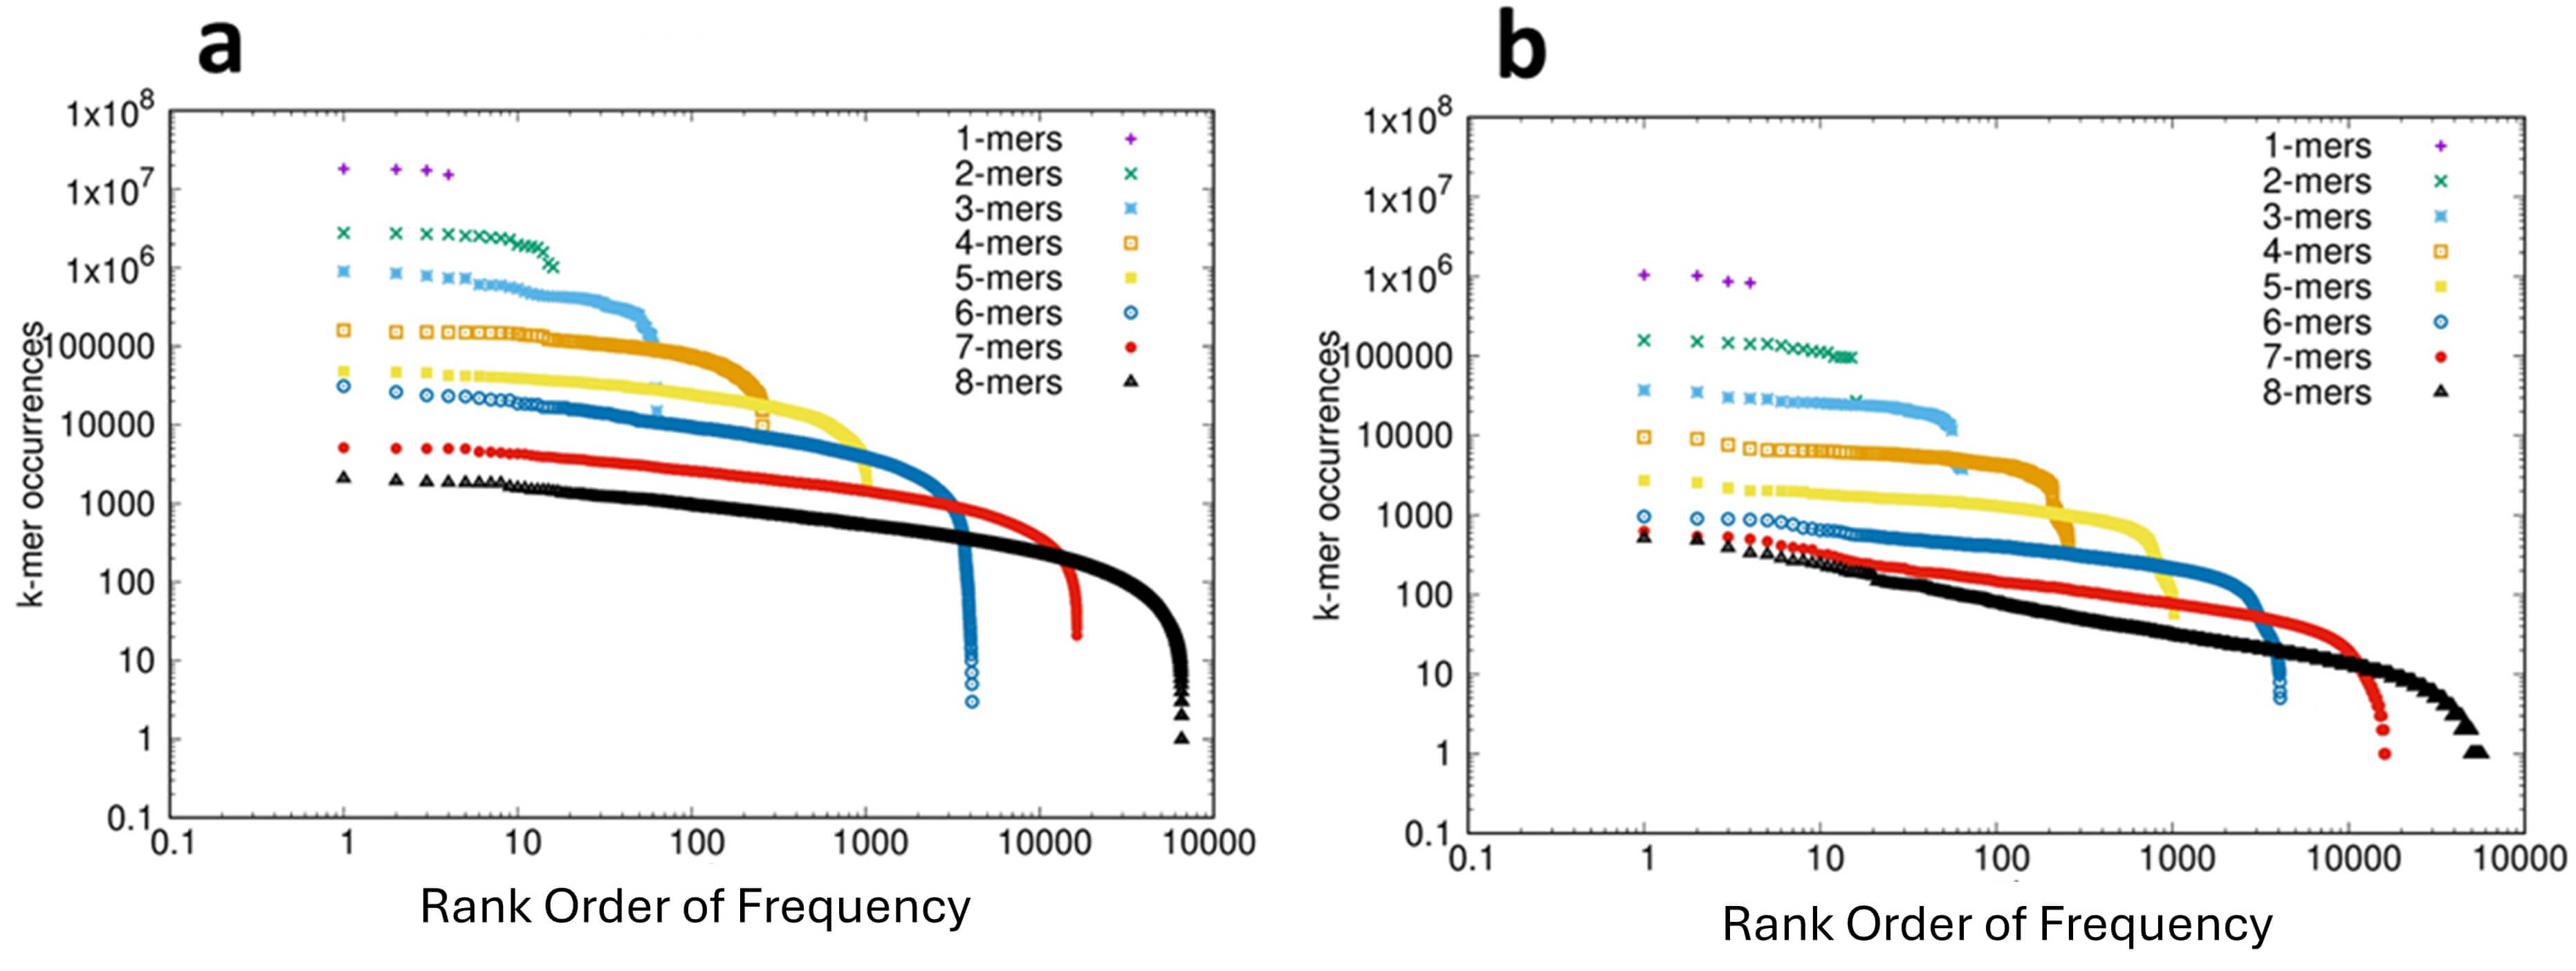
The rank-ordered distribution of k-mer frequencies for the protein-coding RNAs (CDS) and ncRNAs of 53 species were analyzed and are shown in the short movies CDS_1-8.mp4 and ncRNA_1-8.mp4, respectively, in the Supplementary Materials. For consistency we show in Fig. 2 the results for the bonobo, these results also being representative of the 53 species analyzed. The analysis of the CDS is shown in Fig. 2a and for the ncRNA sequences in Fig. 2b. In both of these distributions we see the canonical CoHSI-predicted Zipfian pattern observed in a previous analysis of over 150 genomes [1], as well as the genome of the bonobo (Fig. 1a). This distribution is dominated by a power law (extending over more than 3 orders of magnitude for the 8-mers), and statistical tests of both necessity and sufficiency (detailed in the legend to Fig. 2) provide reassurance for this interpretation in the case of the CDS. However, in the case of the ncRNAs the Clauset Gillespie test failed to exclude the possibility that the distribution was not a power-law. A likely explanation of this failure is the relatively low number of non-coding sequences, which is an order of magnitude lower than for the CDS, although other explanations cannot be excluded. The distributions shown in Fig. 2 also both illustrate the characteristic droop in the tails of the CoHSI distribution, i.e., in the ranks of lowest occupancy (c.f. Fig. 1a). This droop is inherent to the mathematics of CoHSI [3] but is typically of a greater magnitude than predicted, the potential reasons for which include the under-representation of functionally disfavored sequences.
 Fig. 2.
The Frequency Distribution of k-mers in the Coding (CDS) and Non-Coding Fractions of the Transcriptome of the Bonobo Pan paniscus. (a) The distribution of k-mers 1–8 in the coding (CDS) fraction of the transcriptome plotted on log-log scales. On the Y-axis is plotted the frequency of each of the k-mers and on the X-axis is plotted the rank-order of the frequencies. The data are shown as complementary cumulative distribution functions. Statistical analyses: The plot for 7-mers between 20 and 2000 shows an adjusted R-squared of 0.9932 and p
Next we analyzed the compliance of the protein-coding CDS and ncRNAs with inverse symmetry; 53 species were analyzed and the results are shown in the movies CDS_1-8-corr.mp4 and ncRNA_1-8-corr.mp4 in the Supplementary Materials. When the correlation between the frequency of each k-mer is examined by comparison with the frequency of the corresponding inverse complement, strong compliance with inverse symmetry results in a distribution of points close to a straight line of slope 1. Again, for consistency we show the results for the bonobo, which are representative of those for all 53 species analyzed. The results of examining the compliance with inverse symmetry for the CDS and ncRNAs of the bonobo are shown in Fig. 3, and can be compared with the results for the genome shown in Fig. 1b. While both the CDS and the ncRNAs show compliance with inverse symmetry (statistically supported in both) it can be appreciated both visually and statistically that the compliance with inverse symmetry for both CDS (adj R2 = 0.77) and ncRNAs (adj R2 = 0.84) is markedly weaker than when either is compared with the genome (adj R2 = 0.9995, c.f. Fig. 1). The compliance with inverse symmetry is also lower in the CDS than in the ncRNAs, with the spread of points above and below the line of unit slope being particularly pronounced for both 3-mers and 6-mers. The results shown in Fig. 3 are representative of those for all 53 species analyzed. The possibility that poor compliance with inverse symmetry seen with the 3-mers and (especially) 6-mers may be related to the triplet nature of codons is explored in Section 3.5 The Distribution of Codons Across Reading Frames.
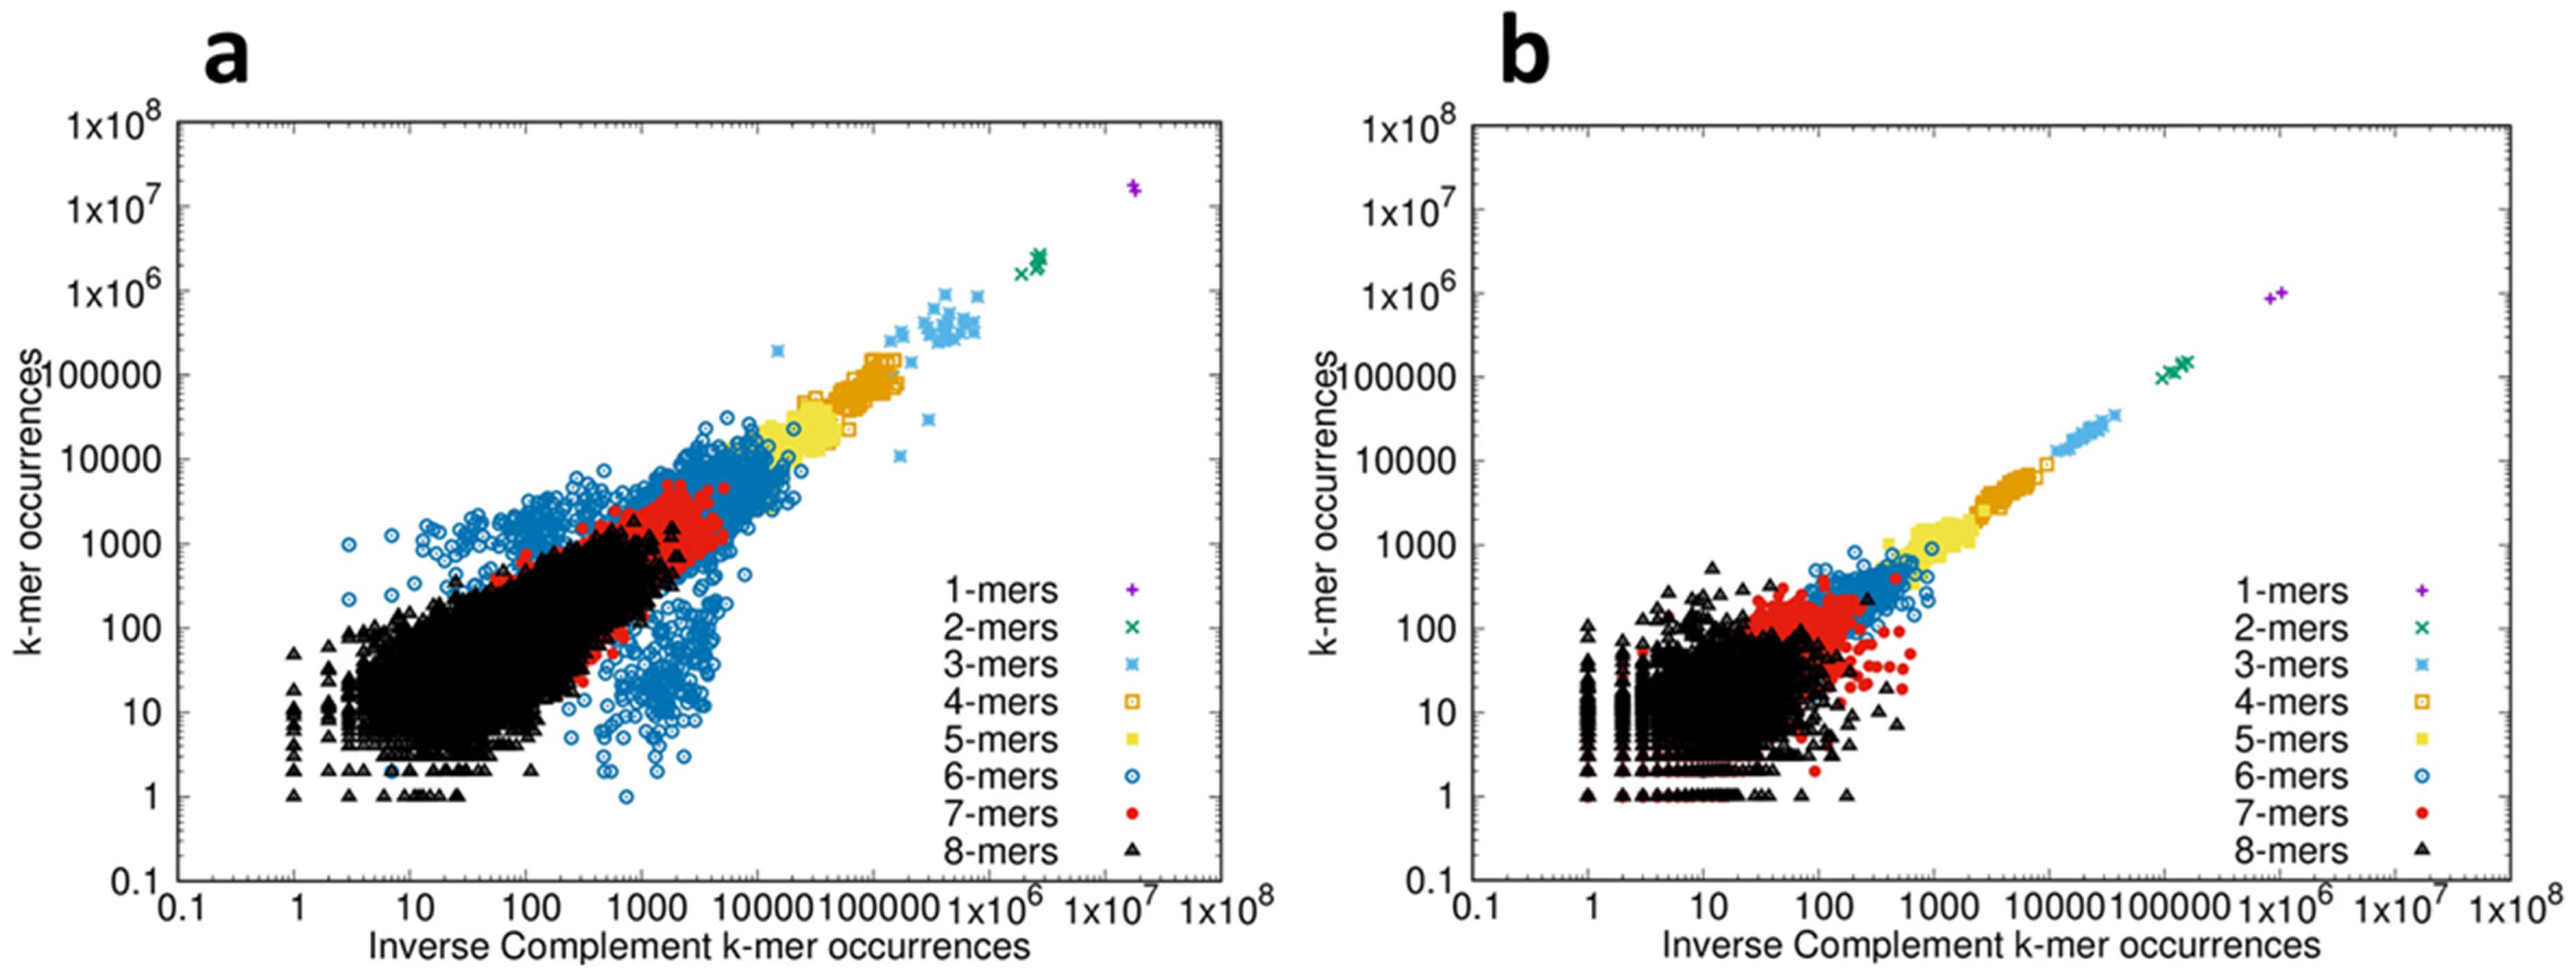 Fig. 3.
Inverse symmetry of k-mers in the transcriptome of the bonobo Pan paniscus. (a) For the coding (CDS) fraction of the transcriptome the frequency of the forward sequence of each k-mer 1–8 is plotted on the Y-axis, and the frequency of the corresponding inverse complementary sequence is plotted on the X-axis, using log-log scales. Statistical analyses: Full compliance with inverse symmetry would result in a straight line of slope 1. The slope of the line = 0.91, and the adjusted R2 = 0.77 (p
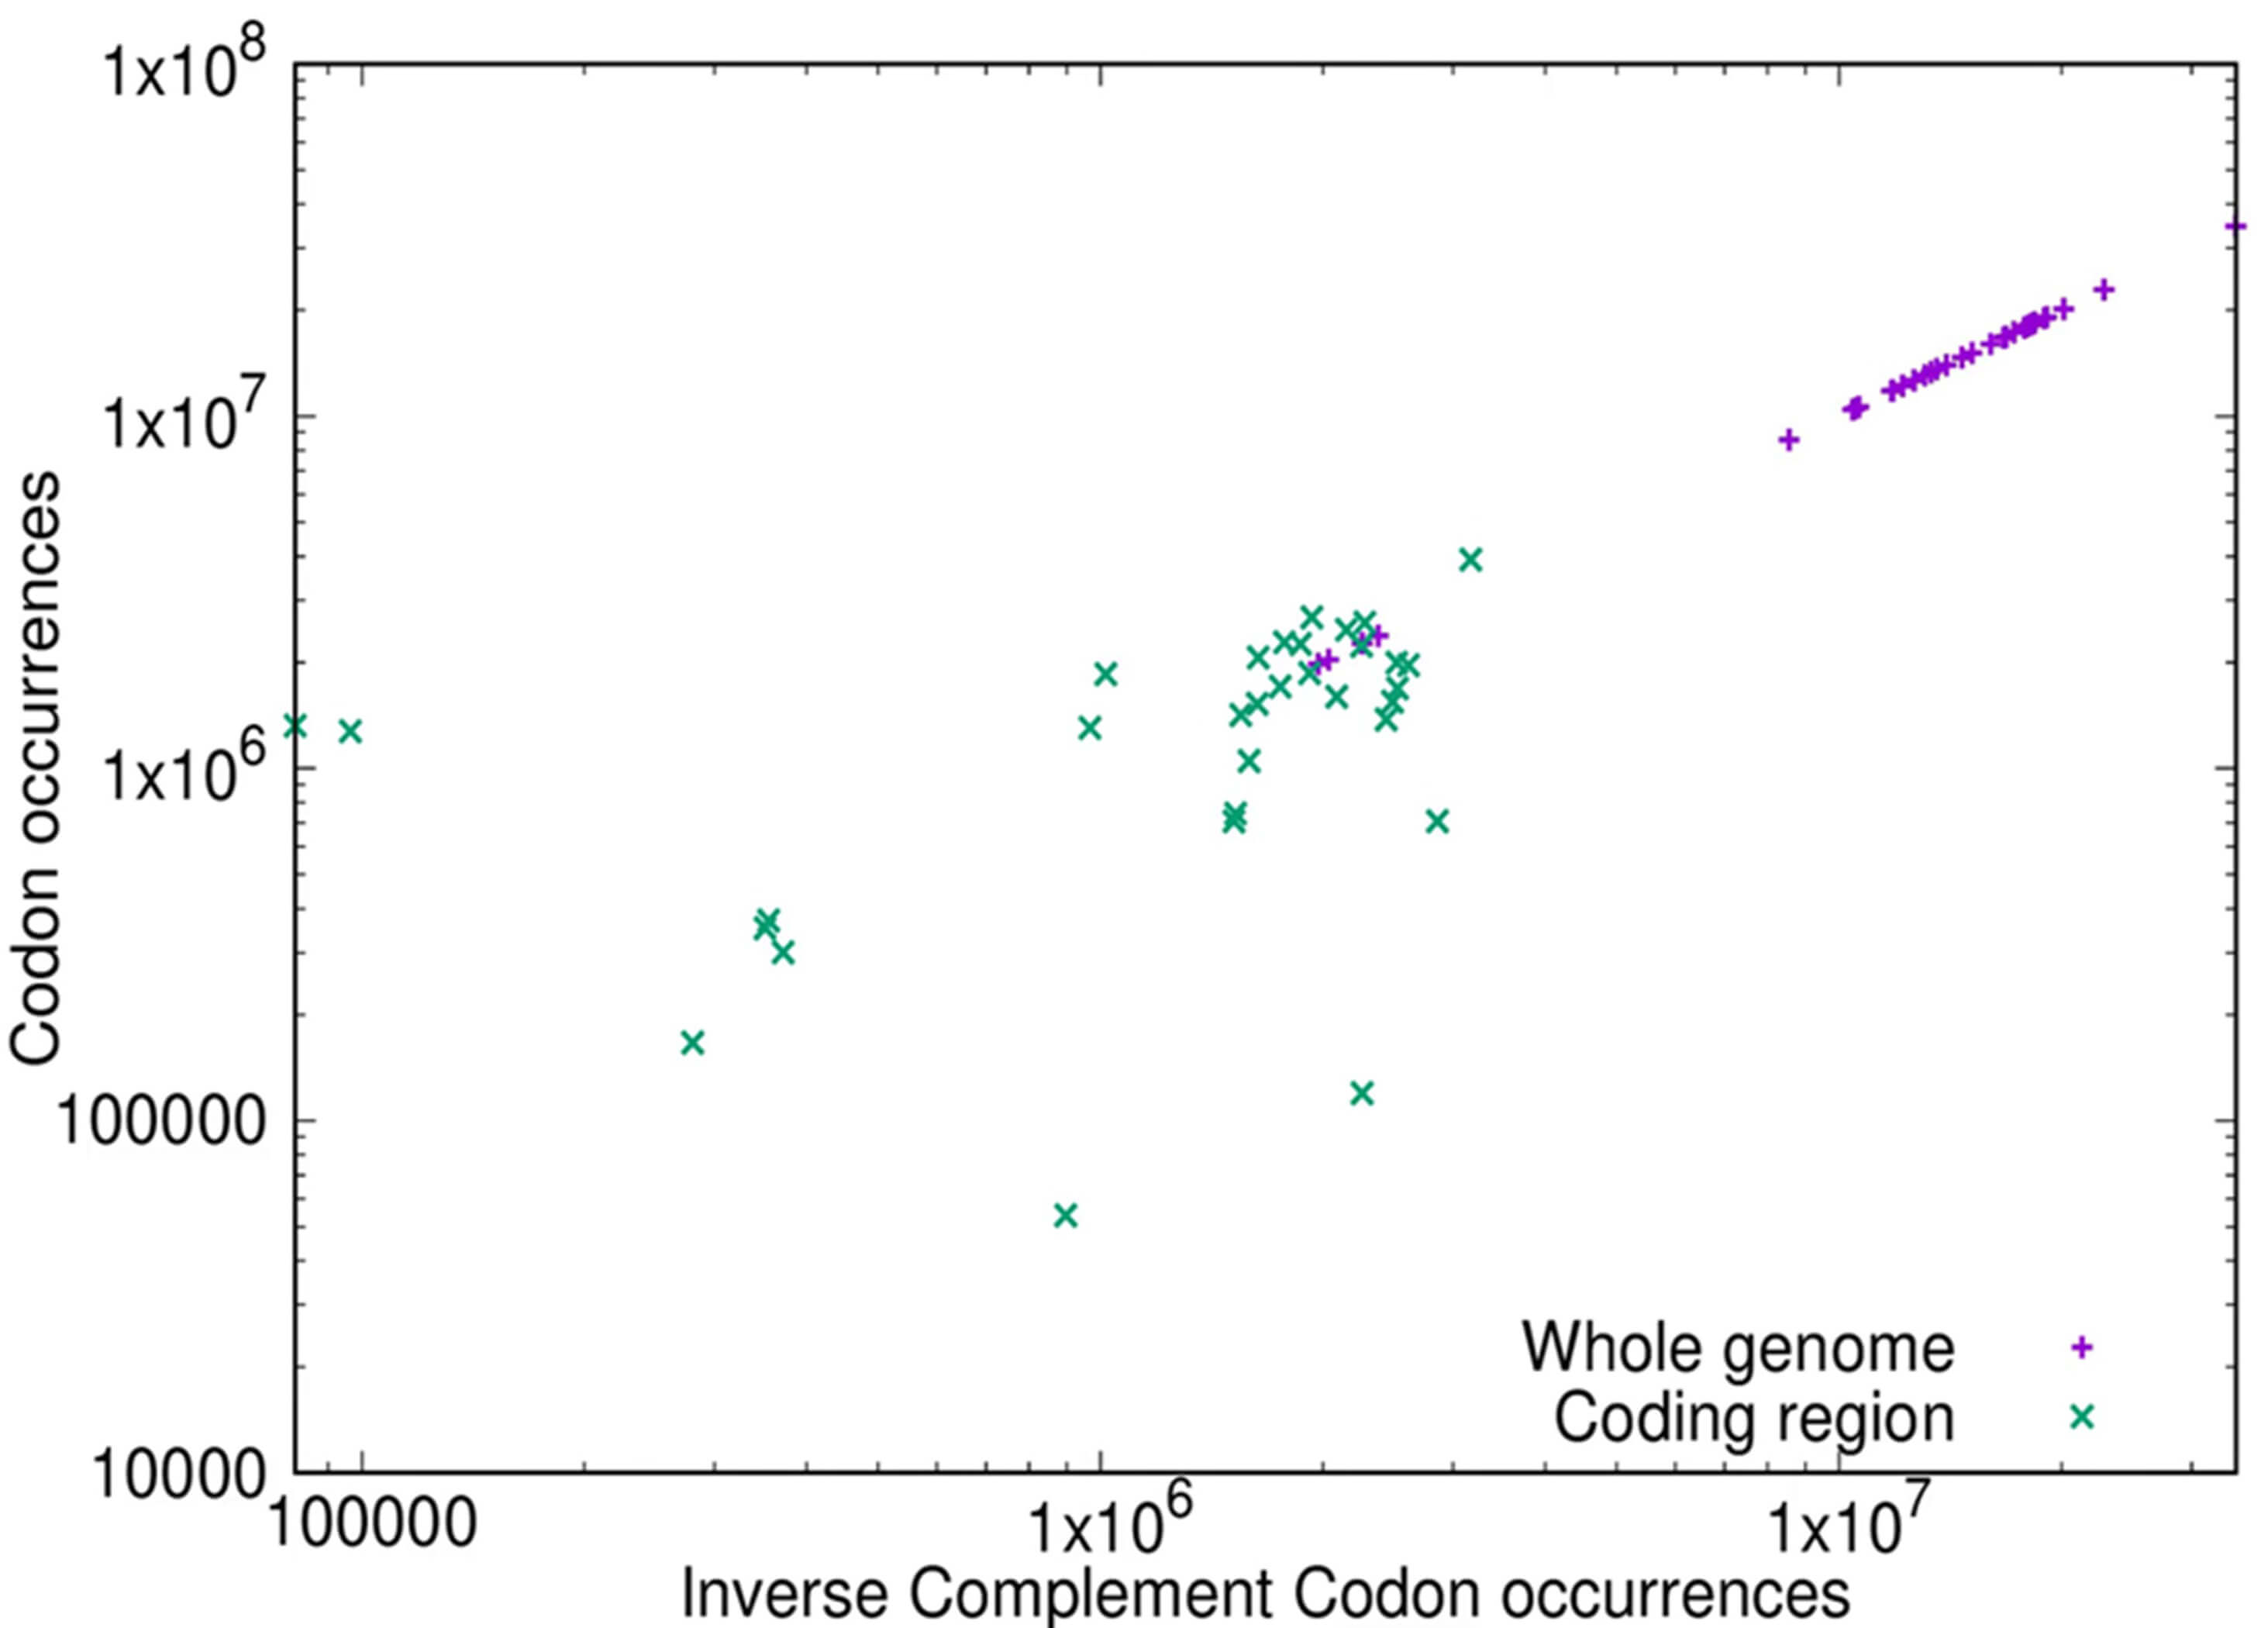
As shown in Fig. 1b for the whole genome there is strong compliance with inverse symmetry, whereas the compliance with inverse symmetry is much weaker in the protein-coding RNAs (CDS) (Fig. 3a). In order to confirm that the decay of compliance with inverse symmetry in the CDS reflects a similar status in the coding regions of the genome, we compared directly the inverse symmetry compliance of the whole genome with that of the genomic regions that encode proteins. The results of such an analysis for the bonobo genome, for 3-mers, are shown in Fig. 4. This result illustrates that whereas the whole genome, collectively, shows strong compliance with inverse symmetry as represented by unit slope (slope = 0.999921, adjusted R2 = 1.0, residual standard error = 0.00088), when the protein-coding regions are considered in isolation this compliance is substantially weaker (slope = 0.4, adjusted R2 = 0.12, residual standard error = 0.93). This result with the bonobo is representative, as shown in the movie 178-codon-coding-regions.mp4 in the Supplementary Materials. We note that the coding region of the eukaryotic genome typically constitutes only a few percent of the whole genome, and thus would be expected to perturb to only a minor degree the compliance with inverse symmetry when assessed across the whole genome.
 Fig. 4.
Comparison of inverse symmetry of 3-mers in the whole genome (purple) and the protein-coding portion of the genome (green) of the bonobo Pan paniscus. The frequency of the forward sequence of each 3-mer is plotted on the Y-axis, and the frequency of the corresponding inverse complementary sequence is plotted on the X-axis, using log-log scales. Full compliance with inverse symmetry would result in a straight line of slope 1. For the bonobo genome (purple) the slope of the line = 0.999921, the adjusted R2 = 1.0 and the residual standard error is 0.00088. For the CDS (green) the slope of the line = 0.40, the adjusted R2 = 0.12 and the residual standard error is 0.93.
It is known that compliance with inverse symmetry in the genome decays as the size of the genome decreases, a result interpreted as primarily stochastic in nature [1]. To investigate whether this effect is observable also in the transcriptome as genome size decreases the standard error of linear fit for inverse symmetry was calculated for the coding (CDS) and non-coding fractions of each of 53 transcriptomes. The results are shown, for the CDS, in Fig. 5 and for the non-coding RNAs in Fig. 6. The results for the 2 compartments of the transcriptome are quite different. For the non-coding RNA (Fig. 6) the compliance with inverse symmetry declines with genome size as seen for the full genome sequences [1], but this is not the case with the CDS (Fig. 5) in which there is an increased deviation from inverse symmetry with an increase in genome size. These results suggest that whereas inverse symmetry in the non-coding RNA may, similarly to the situation in the full genome, be subject to stochastic decay with decreasing size, this is not the case for the CDS. Strong selection for the protein-encoding function of the CDS would be a plausible explanation for these results.
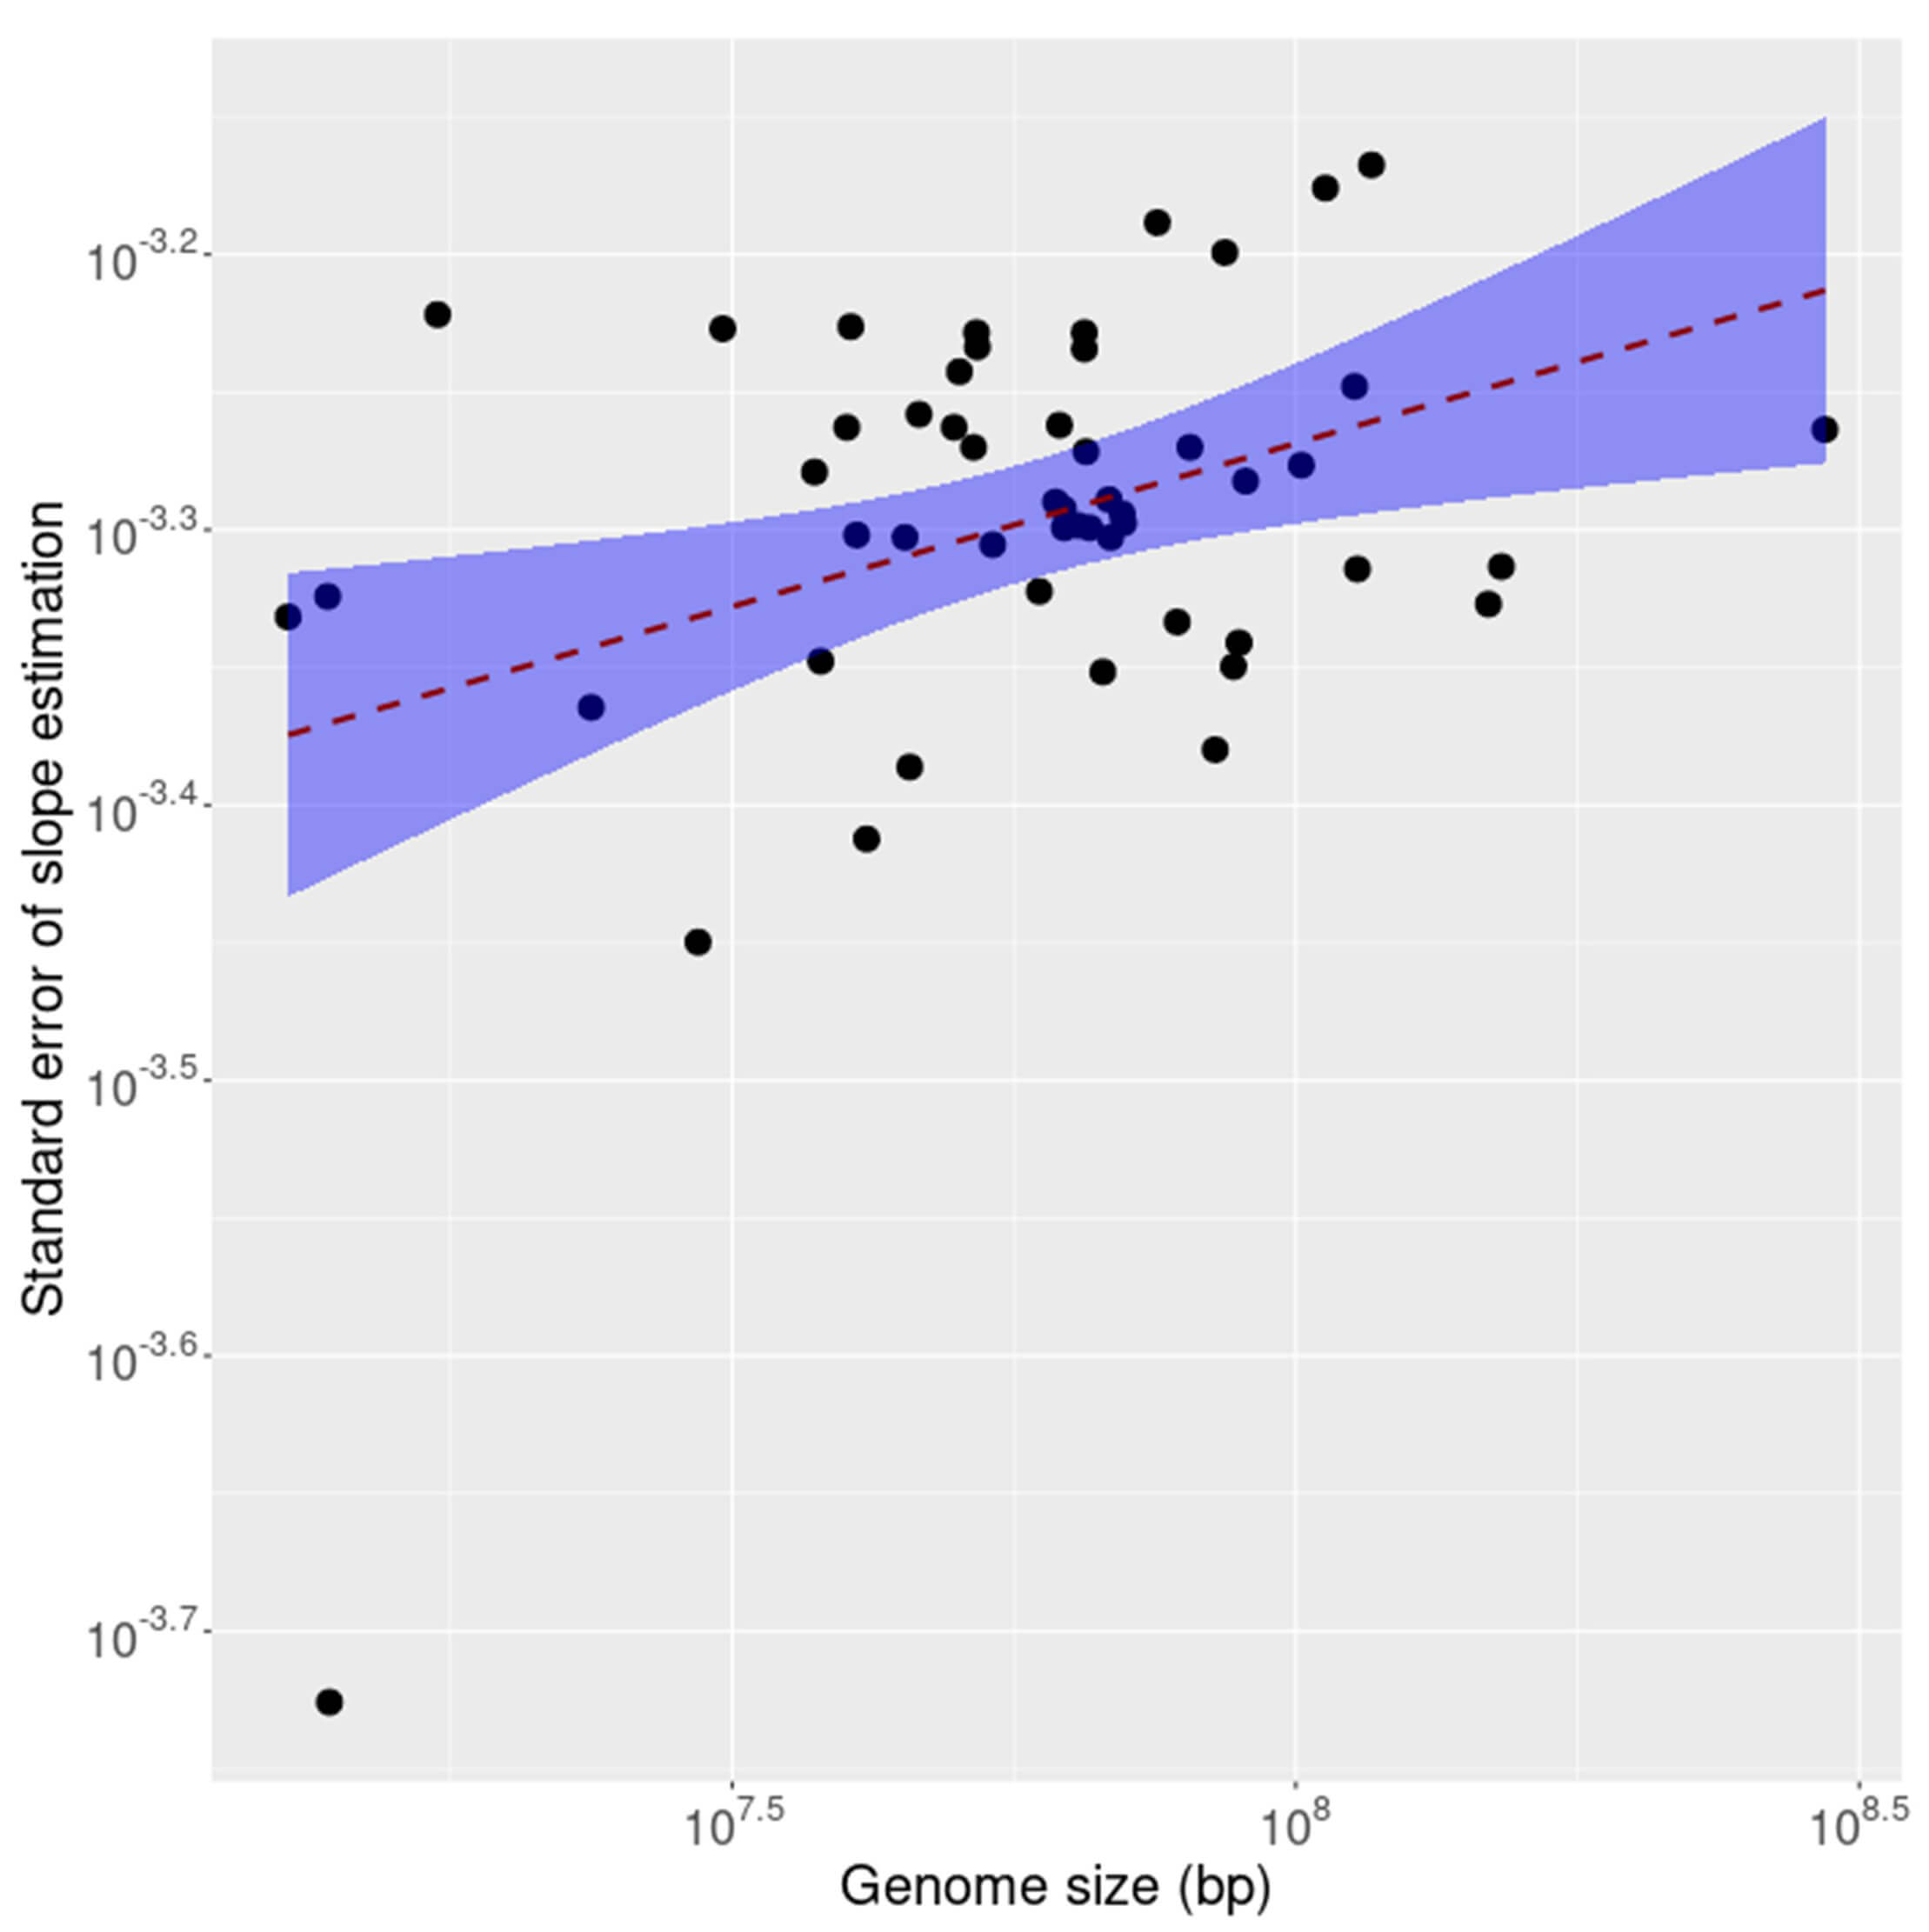 Fig. 5.
The standard error of linear fit for inverse symmetry plotted against size of the coding (CDS) fraction of each of 53 transcriptomes. The shaded region is a 95% confidence interval indicating increased standard error with increasing size.
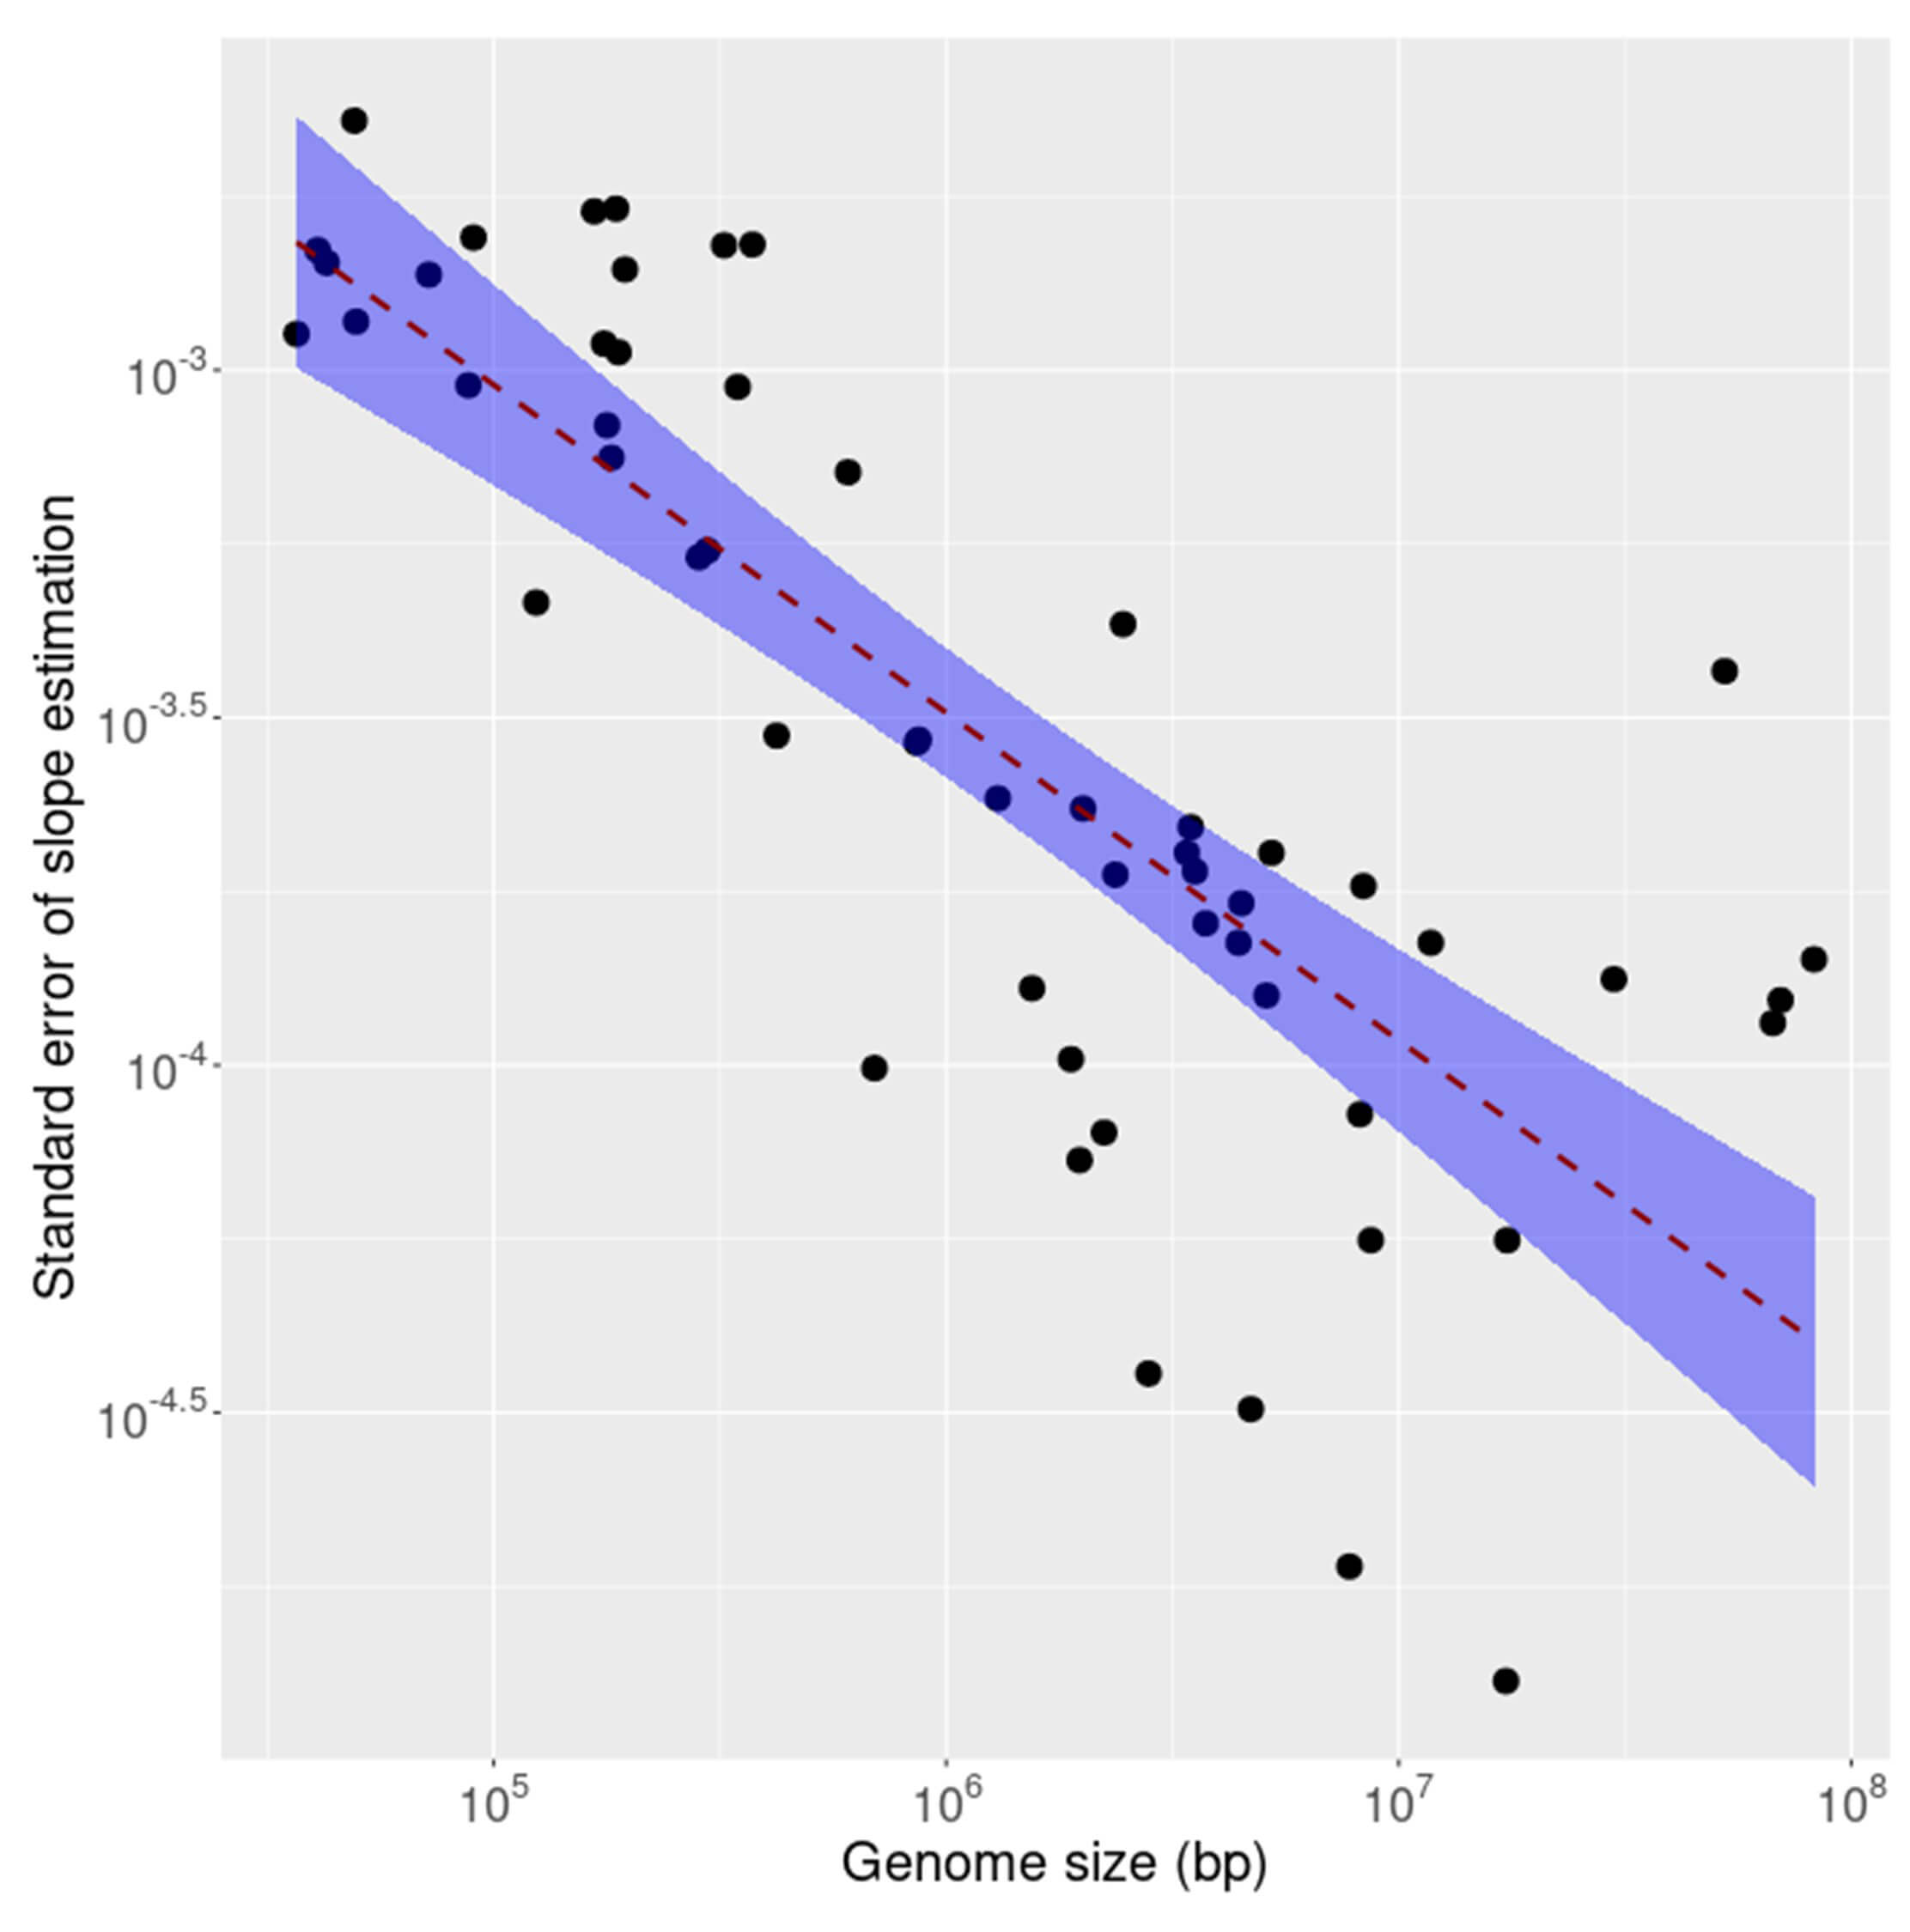 Fig. 6.
The standard error of linear fit for inverse symmetry plotted against size for the ncRNA fraction of each of 53 transcriptomes. The shaded region is a 95% confidence interval indicating marked decreasing standard error with increasing size.
A plausible explanation for the relative lack of compliance with inverse symmetry in the CDS (as compared to the total genome and the ncRNAs) is that there has been strong evolutionary pressure on the coding regions of the genome arising from the necessity to transcribe mRNAs that encode functional proteins. The coding sequence (CDS) files begin with a start codon and terminate with a stop codon and thus the concatenated CDS files for a species will be in an open reading frame throughout. Selective pressure arising from the necessity to correctly encode proteins would perturb the equilibrium state of inverse symmetry in the reading frame of the CDS but frames other than the correct reading frame would be predicted to lack such perturbations of 3-mer frequency. A comparison of codon (3-mer) distribution between the correct reading frame (ORF0) and a non-reading frame (ORF1) can therefore provide insight into the effects attributable to selection associated with protein coding function.
If the frequency distribution of each of the possible 64 codons (3-mers) is the same in both of the two reading frames analyzed then a correlation plot should show the points clustering around a straight line of unit slope. This result was observed for the ncRNAs of the bonobo (Fig. 7b), a result representative of those seen for all of the species analyzed as shown in the movie ncRNA_3_orf0-1.mp4 in Supplementary Materials. This result is also consistent with the observation that k-mer frequencies in the whole genome are essentially identical across reading frames [25]. However, when codon frequencies in the CDS were compared between the correct reading frame (ORF0) and a non-reading frame (ORF1) a weak correlation was observed, shown in Fig. 7a. These results are representative for the CDS regions of all the species analyzed, as presented in the movie CDS_3_orf0-1.mp4 in Supplementary Materials. In the CDS the majority of codon correlations form a loose cluster as opposed to the linear relationship observed with the ncRNAs, and in particular there are three codons (circled in Fig. 7a) that show particularly poor correlations; their representation in the correct reading frame (ORF0) is an order of magnitude lower than their frequency in the non-coding frame (ORF1). These three outliers are the stop codons TGA, TAG and TAA.
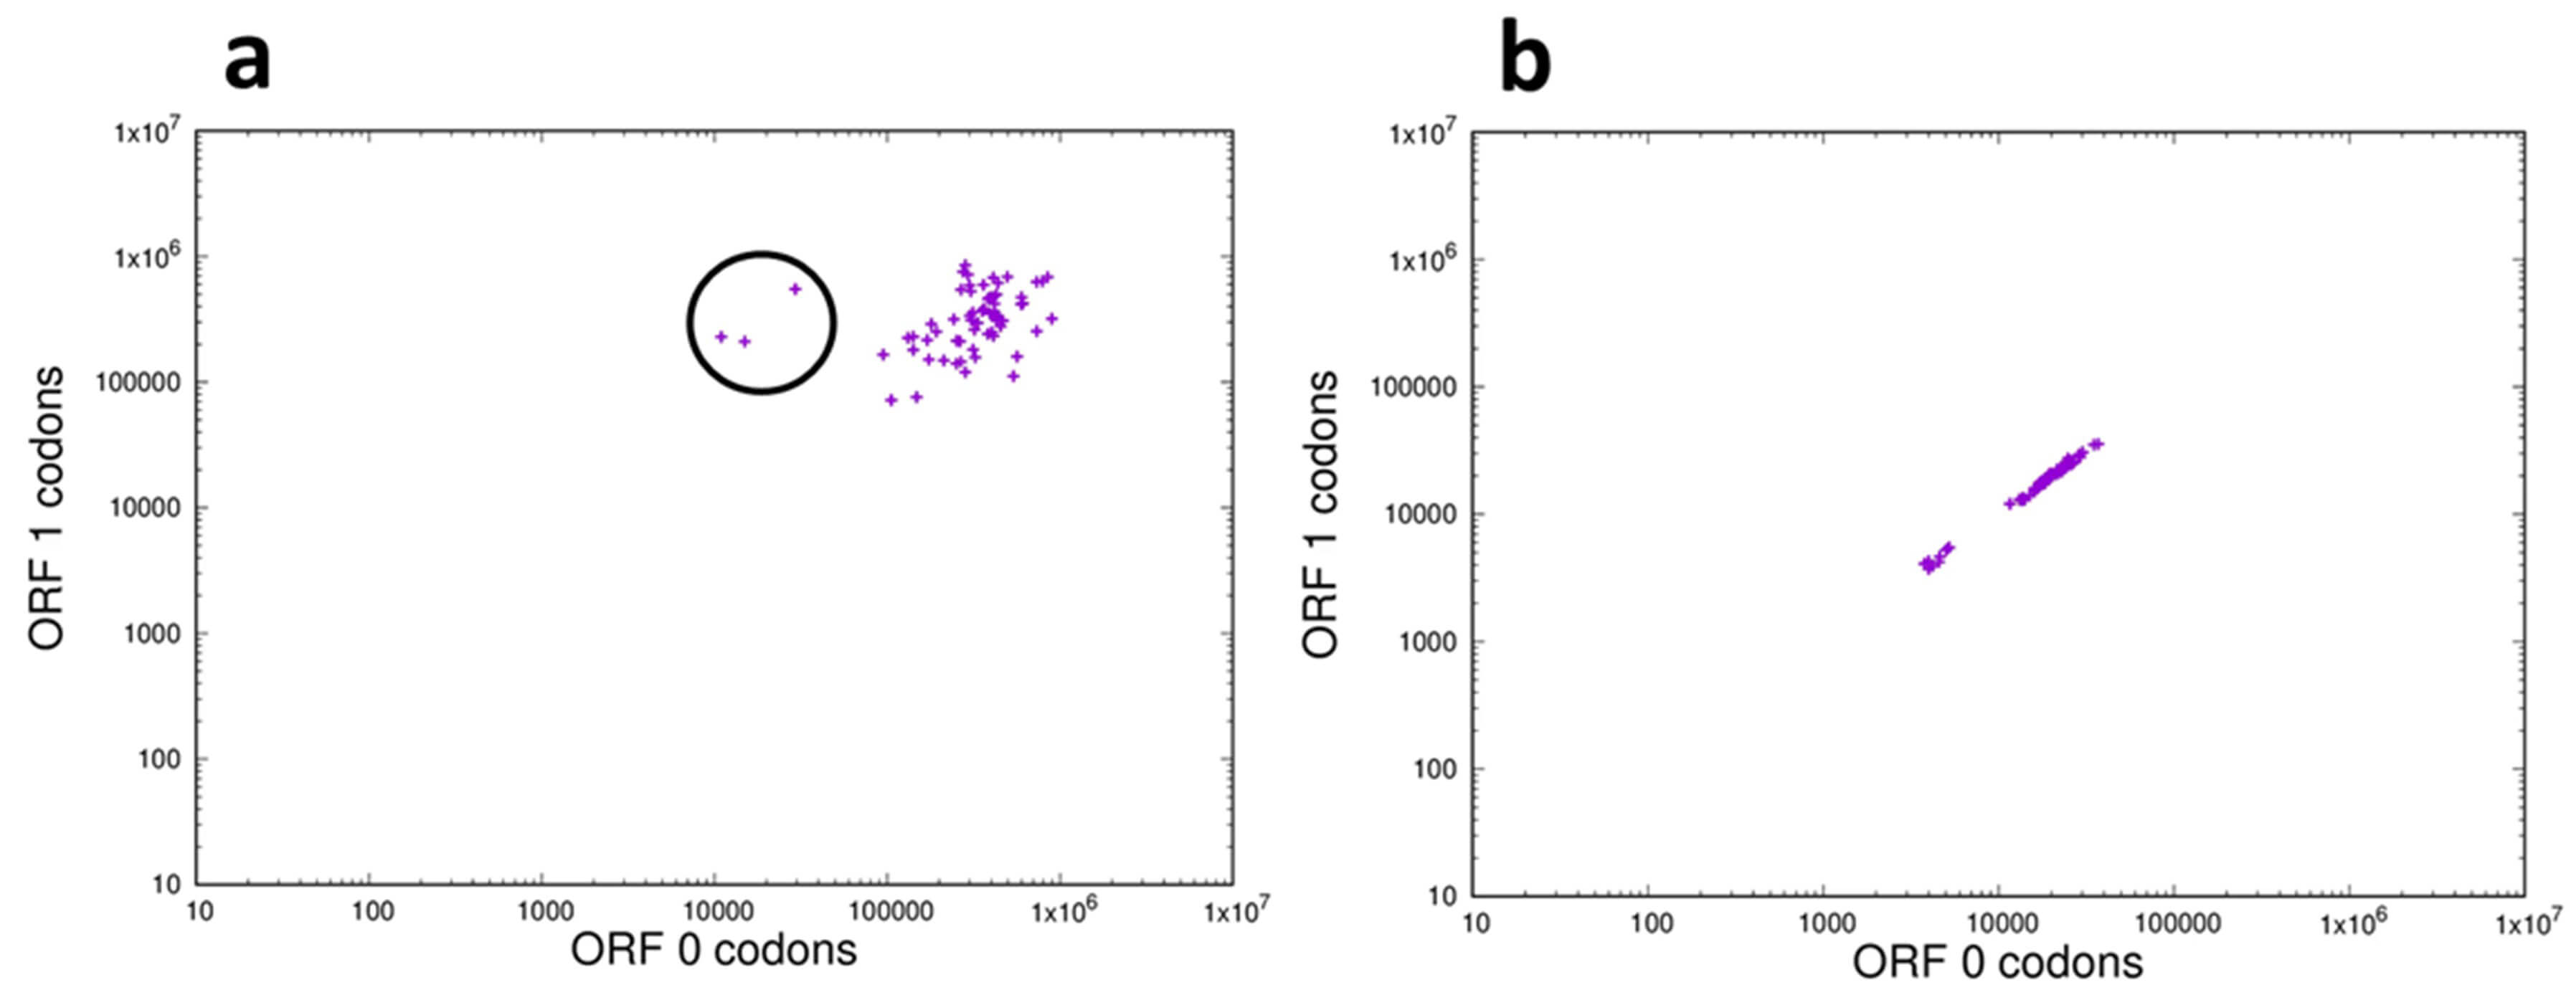 Fig. 7.
Frequency distribution of 3-mers in the correct reading frame and a non-reading frame of the transcriptome of the bonobo Pan paniscus. (a) Coding (CDS) sequences: On the X-axis is plotted the frequency in reading frame (ORF0) of each codon and on the Y-axis is plotted the frequency of the same codon in a non-reading frame (ORF1), plotted on log-log scales. The codons within the circle are the 3 stop codons TAA, TAG and TGA. (b) The non-coding fraction of the transcriptome: On the X-axis is plotted the frequency of each codon in reading frame ORF0 and on the Y-axis is plotted the frequency of the same codon in reading frame ORF1, plotted on log-log scales.
While a possible explanation for the over-representation of out-of-frame stop codons in the CDS (which is not seen in the nc-RNA) is selection against inefficient translation [26, 27] objections to this interpretation have been raised by Morgens et al. [28]. It is also possible that the representation of codons in different compartments of the transcriptome is influenced by their GC content, relevant to which is the low collective GC content of the stop codons. To address this directly we measured the GC content of the CDS and non-coding compartments of the transcriptome, the results of which are shown in Fig. 8. The CDS has a slightly higher (by less than 3%) mean GC content than does the nc-RNA, which suggests that differences in global GC content are unlikely to explain the 10-fold or greater excess of out-of-frame stop codons in the CDS.
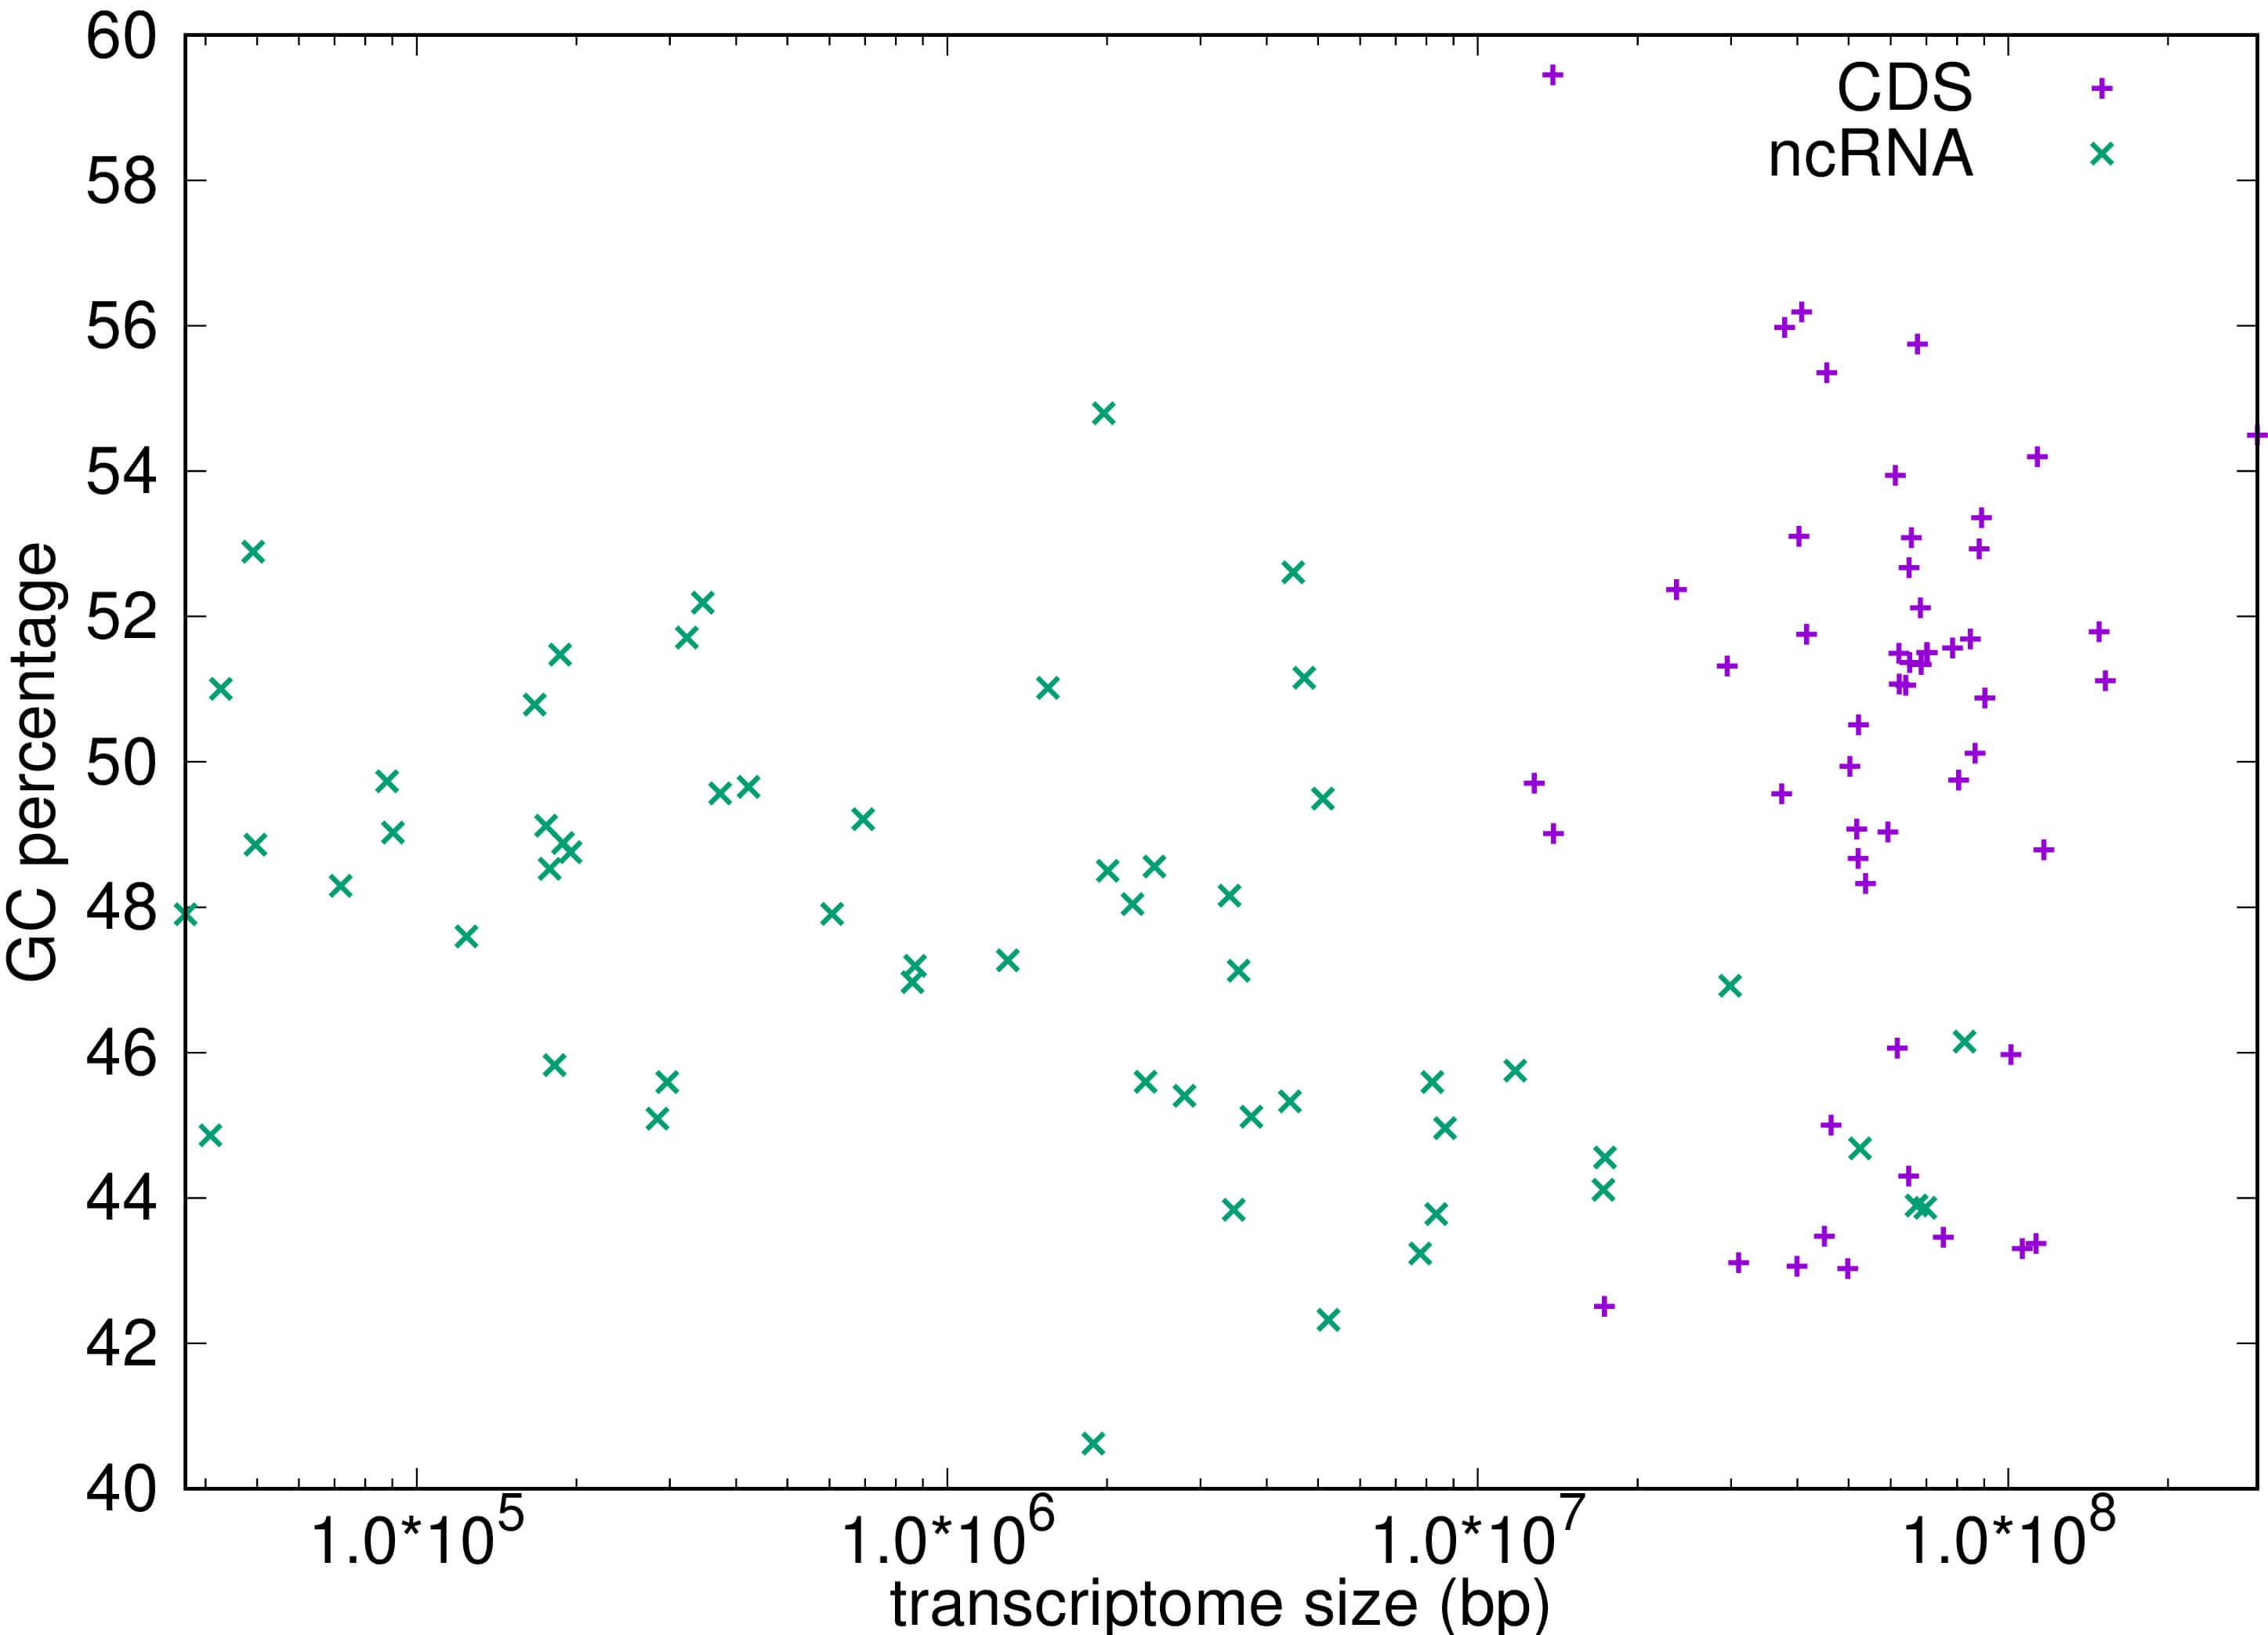 Fig. 8.
The GC ratio plotted as a percentage for both the coding (CDS) regions and non-coding (ncRNA) regions for more than 50 transcriptomes. Statistical analysis: A t-test reveals that there is a small but significant difference in means with the CDS data having a slightly higher mean of 50.068% compared with a mean of 47.520% for ncRNA, t = 3.766, p-value = 0.0002873.
CoHSI theory predicts that, purely probabilistically, discrete systems tend to an equilibrium state characterized by one of the 2 described canonical CoHSI distributions [3] both of which are dominated, albeit not completely, by a power-law. Although discrete systems tend to this equilibrium in a manner independent of specific mechanism, conditions specific to the discrete system can generate perturbations of the equilibrium that can be informative of the underlying causes [1, 4, 29, 30]. In this study we have investigated, by comparing the protein-encoding (CDS) and non-coding compartments of the transcriptome, the extent to which pressures associated with the selective constraints to maintain protein coding function may interact with the CoHSI equilibrium.
The genome is a classical discrete system (i.e., a system composed of countable pieces), the components of which are the individual nucleotides or, by extension, the nucleotide sequences or “words” that are typically called k-mers. The genome, considered as a whole, conforms to the predicted canonical Zipfian CoHSI distribution [1]; Watson-Crick base pairing between strands then generates the characteristic inverse symmetry of each strand considered separately (Chargaff’s Second Parity Rule, PR2, sometimes characterized as universal inverse symmetry) that is distinctive of genomes [5, 6, 7, 8, 9, 10, 11]. Perfect compliance with inverse symmetry can be visualized as a straight line of slope 1 in a plot of the relative frequencies of forward and inverse complementary k-mer sequences, as in Fig. 1b. We know that inverse symmetry decays as genome size decreases and k-mer length increases, a result interpreted as essentially stochastic in nature [1].
The transcriptome, as an essentially faithful RNA copy of a subset of genomic sequences, allowed us in this study to examine and quantify perturbations of inverse symmetry associated particularly with selection to maintain protein-encoding function in the CDS fraction of the transcriptome. We considered separately the protein-coding (CDS) and non-coding (ncRNA) compartments of the transcriptome, in comparison with the properties of the whole genome or of the non-transcribed portion of the genome.
Our results showed that while the frequencies of k-mers in both the ncRNA and the CDS were compatible with the CoHSI-predicted rank-ordered Zipfian distribution, departures from compliance with inverse symmetry were observable in both of these compartments of the transcriptome. These departures from compliance with inverse symmetry were small in the ncRNAs, but of considerably greater magnitude in the CDS. The characteristics of the departures from inverse symmetry in the CDS were associated most strongly with 3-mers and 6-mers, and were particularly pronounced in the correct reading frame of the CDS. A plausible interpretation of these results is that the more pronounced departures from compliance with inverse symmetry seen in the CDS are associated with the necessity to correctly encode functional proteins. We found no evidence to suggest that biases in GC content might explain these observations.
That the pressure to maintain function in the CDS was a driving factor in the departures from inverse symmetry is supported by the observation that compliance with inverse symmetry was strongly disrupted in the correct reading frame. This result is compatible with the observation that the composition of the E. coli genome is distorted for k-mer sequences up to 6 nucleotides, primarily reflecting codon usage [31]. The inverse symmetry of RNAs is associated with the formation of functionally important stem-loop structures, which sets up a tension between the selection of protein-coding mRNAs for two sets of functions that are not readily compatible; the conservation of protein-encoding functions (which would tend to degrade inverse symmetry, as we argue here) and the selection of mRNA sequences to conserve functionally important stem-loop structures (which would tend to conserve inverse symmetry). Forsdyke and Mortimer [32] reviewed this issue and concluded that the sequence of mRNAs represents a balance between these 2 selective forces, sometimes to the detriment of the protein-coding function.
More generally, the results presented here provide an additional illustration of the fact that although (under the influence of CoHSI) diverse discrete systems tend to the predicted equilibrium state, this equilibrium can be locally perturbed in a manner that provides insight into the mechanisms underlying these perturbations [1, 4, 29, 30, 33].
The genome exhibits 2 emergent global properties that follow from the constraints of CoHSI; a Zipfian rank-ordered distribution of k-mer frequencies and essentially universal inverse symmetry of the k-mers. Analyses showed that whereas both protein-coding and non-coding compartments of the transcriptome preserved the Zipfian distribution of k-mers, the inverse symmetry showed clear perturbation of the equilibrium state, especially in the CDS where the evidence suggests that this is related to strong pressure to maintain the integrity of the reading frame. These results provide an illustration of the effect that local selective pressures are able to exert in perturbing the CoHSI-guided equilibrium state of biological systems.
The reproducibility deliverables for the work described here include the references to all data, methods and source code necessary to reproduce in full the results presented and are available at https://leshatton.org/index_RE.html as a downloadable .zip file linked to this journal. Each reproducibility deliverable allows all results, tables and diagrams to be re-created individually for the paper, as well as performing verification checks on machine environment, availability of essential open-source packages, quality of arithmetic and regression testing of the outputs. Note that these packages are designed to run on Linux machines for no other reason than to guarantee the absence of any closed source and therefore potentially opaque contributions to the results.
Theoretical conception: LH, GW; Computational Methodology: LH; Design and Interpretation: GW, LH; Writing and editing: GW, LH. Both authors read and approved the final manuscript. Both authors have participated sufficiently in the work and agreed to be accountable for all aspects of the work.
Not applicable.
We thank the late Professor Robert Chapman for sharing generously of his time and expertise to review and comment helpfully on this work. We also thank our unknown reviewers for making a number of salient points which we have incorporated in the text.
This research received no external funding.
The authors declare no conflict of interest.
The following are Supplementary Data Files:
CDS_1-8.mp4; ncRNA_1-8.mp4; CDS_1-8-corr.mp4; ncRNA_1-8-corr.mp4; CDS_3_orf0-1.mp4; ncRNA_3_-orf0-1.mp4; 178-codon-coding-regions.mp4.
Supplementary material associated with this article can be found, in the online version, at https://doi.org/10.31083/FBL45912.
References
Publisher’s Note: IMR Press stays neutral with regard to jurisdictional claims in published maps and institutional affiliations.