


 , Lirong Yan 1,2,†, Yanke Li 3,*
 , Ye Zhang 1,*
1 The First Laboratory of Cancer Institute, The First Hospital of China Medical University, 110001 Shenyang, Liaoning, China
2 Department of Pharmacy, Personalized Drug Research and Therapy Key Laboratory of Sichuan Province, Sichuan Provincial People’s Hospital, School of Medicine, University of Electronic Science and Technology of China, 610072 Chengdu, Sichuan, China
3 Department of Anorectal Surgery, The First Hospital of China Medical University, 110001 Shenyang, Liaoning, China
†These authors contributed equally.
Abstract
Genes belonging to the adenylate cyclase (ADCY) family regulate various biological processes, including tumor metabolism, metastasis, angiogenesis, and immune escape. However, the functions of these genes in multiple cancers unclear.
This study analyzed the expression, prognostic value, correlation, mutation, and methylation patterns of ten genes belonging to the ADCY family across multiple cancers using multi-omics data. Additionally, the correlation between ADCY5 and immune cells, as well as the function of ADCY5 in multiple cancers were examined using single-cell data and spatial transcriptomic data.
Ten ADCY family genes were differentially expressed in most tumors and normal tissues, and their aberrant expression in multiple cancers significantly reduced patient survival. The expression level of ADCY5 was significantly correlated with the immune microenvironment. We also identified and validated the potential of ADCY5 as a potential biomarker for gastric cancer.
Our pan-cancer analysis nominates the ADCY family as a source of potential cancer biomarkers. We specifically validated ADCY5 in gastric cancer, establishing it as a promising prognostic biomarker with clinical and functional relevance, with significant implications for optimizing immunotherapy strategies and prognostic assessment in this malignancy.
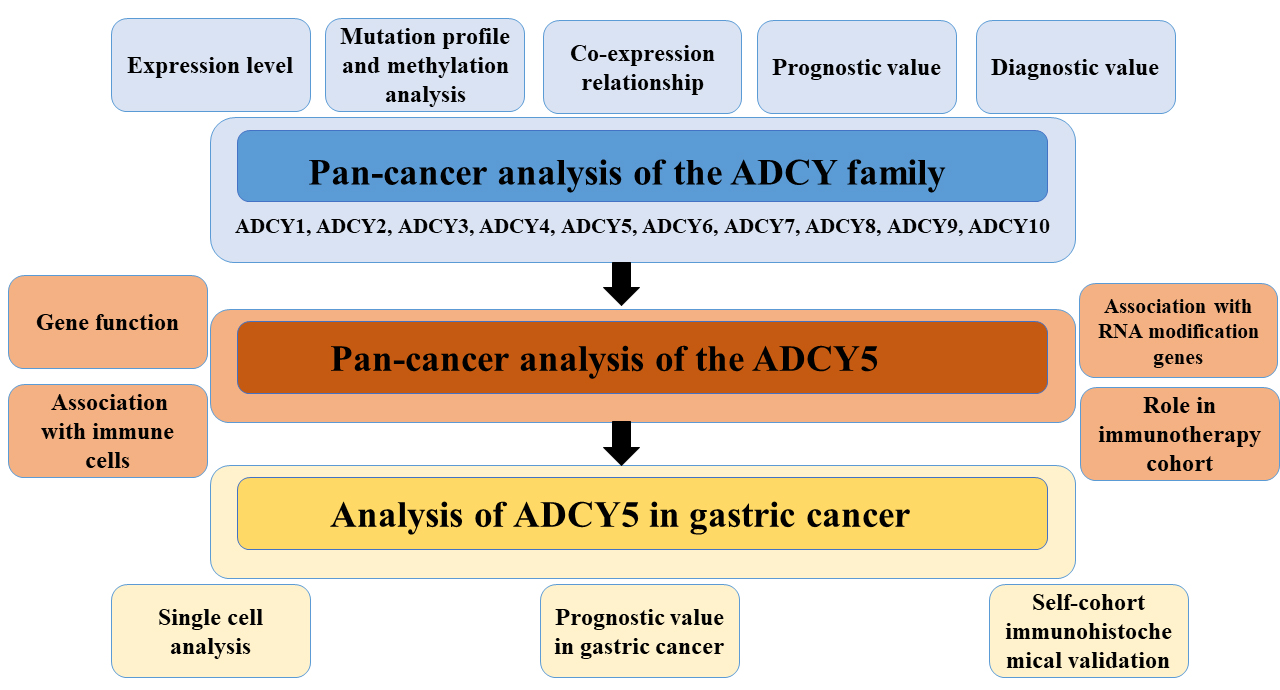
Graphical Abstract
Keywords
- multi-omics
- prognosis
- cancer
As a prevalent global health challenge, cancer is the second leading cause of death and poses a great threat to human life and health [1, 2]. Currently, the therapeutic strategies for cancer include surgery, chemotherapy, and radiation. Evolving technology has enabled the application of specific targeted and biological therapies for cancer [3, 4, 5, 6]. However, the currently employed therapeutic strategies have not markedly improved the five-year survival rate of patients with various cancer types [7, 8, 9]. Therefore, there is an urgent need to identify and develop new molecular targets for cancer therapy.
Pan-cancer analysis provides useful insights into the characteristics of genes in different tumor types [10, 11]. It can yield insights for cancer diagnosis, prevention and targeted therapy [12, 13, 14]. The elucidation of the roles of genes in cancer development can provide clues for further mechanistic studies and aid in identifying novel therapeutic targets [15, 16, 17]. Therefore, the importance of pan-cancer analysis has been recognized by more and more researchers in recent years.
Genes belonging to the adenylate cyclase (ADCY) family regulate various biological processes of cancer, such as cell proliferation, apoptosis, migration, and invasion, metabolic activity, and immune escape [18, 19, 20]. Mechanistically, activation of adenylate cyclase induces the production of Cyclic Adenosine Monophosphate (cAMP) from adenosine triphosphate, and targeting the cAMP signaling pathway can have an anticancer effect [21, 22, 23]. This is because cAMP is involved in a variety of biological activities, such as the cell cycle and cell growth [24, 25, 26, 27]. Compounds related to adenylate cyclase have been developed in a number of diseases [28, 29, 30]. Members of the ADCY family are involved in the development of different cancers.
The roles of ADCY family members in cancer have not been comprehensively examined. This study examined the expression, mutation, and correlation of ADCY family members, as well as the clinical characteristics and prognosis of patients with cancer according to the expression of ADCY family genes. Bioinformatics analyses revealed that the ADCY family members contribute to tumor progression and serve as prognostic biomarkers in certain tumor types. This study also examined the correlation of ADCY5 with immune cells in multiple cancers and its potential prognostic value in gastric cancer. Furthermore, tissues from patients with gastric cancer were subjected to immunohistochemical analysis to validate the biomarker potential of ADCY5.
Data collection and processing. The data utilized in this investigation was gathered and analyzed through resources such as The Cancer Genome Atlas (TCGA, https://portal.gdc.cancer.gov/), The University of California, Santa Cruz (UCSC, https://xena.ucsc.edu/), alongside the Xena platform. This study adhered to established TCGA and UCSC guidelines, so no ethical review or patient informed permission was necessary. Methylation data were obtained from the Gene Set Cancer Analysis (GSCA) database (https://guolab.wchscu.cn/GSCA/#/). PanCanAtlas provided copy number variation (CNV) data files for pan-cancer studies. The expression of ADCY5 in cancer was got from Genotype-Tissue Expression (GTEx) (https://www.gtexportal.org/).
RNA-Seq data (FPKM/UQ-FPKM/TPM formats) and clinical data from TCGA and GTEx
were obtained via the UCSC Xena browser to ensure data consistency and
comparability. Prior to differential expression analysis, we filtered the gene
expression matrix, retaining only genes with expression levels
Data obtained from Xena had already been uniformly processed into log2(TPM + 1) or log2(FPKM-UQ + 1) formats, and we directly utilized this standardized data for analysis. For differential analysis, we employed the R package ‘DESeq2’, which internally utilizes its own normalization method (Median of ratios). For gene set variation analysis (GSVA), we used the ‘GSVA’ R package, whose default method converts expression matrices to rank data and calculates enrichment scores.
Differentially expressed genes (DEGs) were filtered using the criteria:
In correlation analysis, we calculated Spearman correlation coefficients and performed BH correction on significance p-values.
We looked at overall survival (OS), disease-specific survival (DSS), disease-free interval (DFI), and progression-free interval (PFI). We used univariate Cox regression and Kaplan-Meier modeling to analyze ADCY5’s prognostic influence on specific prognostic types for each malignancy, and the results were presented as a heatmap. Kaplan-Meier curves were generated using the survminer program.
Spearman correlation analysis was used to detect expression correlations among ADCY family genes, and the results were presented as heatmaps. Meanwhile, the co-expression of ADCY5 and other ADCY family genes in ten tumors was investigated, and the findings were shown using the ggplot tool. The predictive usefulness of ADCY family members was confirmed by assessing their overall survival using one-way Cox regression.
Pathologic images of ADCY5 in five cancers were obtained through the Human Protein Atlas database (HPA, https://www.proteinatlas.org/).
In the gene set enrichment analysis (GSEA), we utilized Hallmark gene sets, Kyoto Encyclopedia of Genes and Genomes (KEGG) metabolic pathway gene sets, immune-related gene sets, and aging-related gene sets from the Molecular Signatures Database (MSigDB). For various tumor types, samples were stratified into high and low expression groups based on the upper and lower 30th percentiles of gene expression levels, respectively. To conduct a variance analysis, the limma package was utilized to derive the log2 fold change (log2FC) for each gene. Subsequently, all genes were ranked based on their log2FC values. TheGSEA was executed using the GSEA function from the clusterProfiler package, focusing on hallmark gene sets. Enrichment analysis for hallmark and KEGG metabolic gene sets was performed with the GSEA function in clusterProfiler, which involved calculating the enrichment score (ES) for each gene set and conducting significance testing with multiple hypothesis correction. The results were visually represented through bubble plots. To refine the gene set scoring, we applied the scale function for normalization, and subsequently, we calculated the Pearson correlation coefficients between ADCY5 genes and each respective gene set score.
In the GSVA analysis, we selected 14 functional state gene sets from the CancerSEA database (http://biocc.hrbmu.edu.cn/CancerSEA), covering diverse tumor cell behaviors such as apoptosis, invasion, and stemness. Using the z-score method from the GSVA R package, we calculated the composite z-score for each gene set across all samples. Subsequently, the scale function was applied to standardize the data and generate gene set scores. Subsequently, Pearson correlation coefficients between ADCY5 expression and each gene set score were calculated to assess functional associations.
To identify potential compounds targeting ADCY5, we performed CMap analysis. For each cancer type, the top 150 differentially expressed genes between high and low ADCY5 expression groups were selected to construct an ADCY5-related gene signature. This signature was compared against compound-induced gene expression profiles from the CMap database (https://www.broadinstitute.org/connectivity-map-cmap) using the eXtreme Sum (XSum) algorithm. Similarity scores were generated for 1288 compounds. A lower score suggests a higher potential for the compound to reverse ADCY5-driven oncogenic signatures.
We employed the Sparkle database (https://grswsci.top) to conduct correlation analyses utilizing data obtained from GSE167297 within the TISCH2 database. The TISCH2 database (http://tisch.comp-genomics.org/) serves as a repository for single-cell RNA sequencing (scRNA-seq) datasets derived from both human and mouse tumors. To assess the variations in ADCY5 expression across distinct cell types, we applied the Kruskal-Wallis rank sum test (commonly referred to as the Kruskal test). Based on the expression status of ADCY5, all cells were classified into two groups: those that were expression-positive and those that were expression-negative. Subsequently, the limma package was utilized to evaluate the differences in scoring between these two groups. We further examined various biological pathways related to immunity, metabolism, signaling, proliferation, cell death, and mitochondrial functions, employing the AUCell package for scoring these pathways.
We performed the analysis using SangerBox 3.0 (http://sangerbox.com) [21]. The TCGA Pan-Cancer dataset, retrieved from the UCSC (https://xenabrowser.net/) database and uniformly normalized, was used. Differences in gene expression were calculated for each tumor in samples at various clinical stages. The relationship between ADCY5 and immune cells was evaluated using the Pearson correlation coefficient. In addition, Tumor Mutation Burden (TMB), Microsatellite Instability (MSI) scores, and Immune Neoantigen data for each tumor were calculated using the tmb function from the R package maftools. Additionally, expression levels for the ADCY5 gene alongside 44 marker genes associated with three distinct categories of RNA modification genes were extracted from each sample. Subsequently, the Pearson correlation between ADCY5 and these RNA modification genes was analyzed. Role of ADCY5 in immunotherapy cohorts
We analyzed the role of ADCY5 in the immunization cohort using the Biomarker Exploration for Solid Tumors (BEST) database (https://rookieutopia.com/app_direct/BEST/) [31].
Space the transcriptome analysis is to use Sparkle database (https://www.grswsci.top/) and SpatialTME (https://www.spatialtme.yelab.site/) [32]. We visualized gene expression landscapes in each microregion from spatial transcriptome data. Liver hepatocellular carcinoma (LIHC) data were used from GSE203612-GSM6177612, and CRC samples were derived from publicly available data from Wu et al. [33]. The predominant cell type within each microregion was determined, and the SpatialDimPlot function from the Seurat package was employed to illustrate the maximal cellular composition of these microregions. The SpatialFeaturePlot function was used to visualize gene expression patterns across microregions, while Spearman correlation analysis assessed the relationships between cellular composition and ADCY5 expression across all spots. The visual representation of these findings was accomplished using the LINKET package.
This study has been approved by the Ethics Committee of the First Hospital of
China Medical University (Shenyang, China), and all participating subjects have
signed informed consent forms. Gastric cancer tissues were collected from
patients undergoing subtotal gastrectomy. The selection criteria for these
patients were: no other primary tumors and no prior radiotherapy or chemotherapy
before surgery. Gastric cancer and adjacent tissue specimens from all patients
were obtained surgically and subsequently subjected to independent
histopathological diagnosis by two senior gastrointestinal pathology specialists.
Concurrently, multiple clinical and pathological parameters were collected during
the study. Subsequent follow-up was conducted via telephone to collect prognostic
information, including survival status, overall survival duration, and date of
death. The clinicopathological features of the 61 gastric cancer (GC) patients in
the validation cohort are summarized in Supplementary Table 1. Follow-up
visits were scheduled every six months. Immunohistochemical (IHC) staining
techniques were employed to evaluate the protein expression levels of ADCY5
within gastric cancer tissue samples. These sections underwent a
deparaffinization process, followed by rehydration through a series of ethanol
gradients, and were subsequently incubated in an Ethylenediaminetetraacetic acid
(EDTA) solution. The activity of endogenous peroxidase was inhibited by treatment
with a 3% hydrogen peroxide solution. Tissue collagen was disrupted using 10%
normal goat serum to reduce nonspecific binding. Using ADCY5 antibody (1:300, Cat
No. 30153-1-AP, Proteintech, China) as the primary antibody, samples were
incubated at room temperature for 1 h. After washing with PBS, biotin-labeled
secondary antibody and streptavidin-horseradish peroxidase were added to the
samples, respectively, and the samples were incubated for 10 min at room
temperature each time. The samples were then stained with 3,3’-Diaminobenzidine
(DAB), dehydrated, and fixed with resin. Finally, the stained tissue sections
were observed under a microscope by two experienced pathologists. Five distinct
areas were randomly chosen from the 400
MKN-45 cells were purchased from the Cell Resource Center, Institute of Basic Medical Sciences, Chinese Academy of Medical Sciences (Beijing, China) and came with an STR identification certificate. Cells were cultured in RPMI1640 (11875093, Vivacell, USA) containing 10% FBS at 37 °C with 5% CO2. Mycoplasma contamination was ruled out using the Mycoplasma PCR Detection Kit (C0301S, Beyotime, China).
The antisense sequence of siRNA is (5′ to 3′): GCAAGAUGAUGGACACUAUTT.
The primer sequences used are: Forward: 5′-TGCTTCTGGTCGTGGCTGTC-3′,
Reverse: 5′-ACGACAGCATCGAGGACAAC-3′. Prepare a 6-well plate with a cell
density of 4.0
Cellular lysis was achieved using TRIZOL reagent (R0016, Beyotime, Wuhan,
China), which was allowed to react for a duration of 5 minutes at ambient
temperature. Following this, chloroform was incorporated, the mixture was
agitated and subsequently incubated at room temperature for another 5 minutes
before being subjected to centrifugation at 12,000 rpm for 20 minutes at 4
°C. The resultant supernatant was carefully removed, thoroughly mixed,
and combined with an equal volume of pre-chilled isopropanol. This mixture was
left undisturbed at room temperature for 10 minutes, followed by centrifugation
at 12,000 rpm for 20 minutes at 4 °C. The supernatant was then
discarded, and 1 mL of 75% ethanol was introduced to the precipitate at the
bottom of the tube, which was then washed several times. The precipitate was
subsequently resuspended and centrifuged at 12,000 rpm for 5 minutes at 4
°C. The ethanol was removed, and the precipitate was allowed to dry
completely at room temperature before the addition of 50 µL of
enzyme-free sterile water to facilitate resuspension and full dissolution. Total
cellular RNA was extracted utilizing TRIzol reagent (R0016, Beyotime, Wuhan,
China) and reverse transcribed into single-stranded complementary DNA (cDNA)
employing a PrimeScript reverse transcription reagent kit (DP117, TIANGEN) in
accordance with the manufacturer’s guidelines. For PCR amplification, the AceQ
qPCR SYBR Green Master Mix (RR047A, TaKaRa, Japan) was employed on an ABI
QuantStudio 3 PCR system (Thermo Fisher Scientific Inc., China) under specified
conditions: an initial denaturation at 95 °C for 3 minutes, followed by
40 amplification cycles consisting of 95 °C for 10 seconds, 58
°C for 20 seconds, and 72 °C for 30 seconds. The expression
data were normalized against
The assessment of cell proliferation was conducted utilizing the Cell Counting
Kit (CCK-8 Solution; A311-01/02, Vazyme, China). In summary, cells were seeded
into a 96-well plate at a concentration of
2
Kaplan-Meier analysis combined with log-rank test was used for survival
analysis. Statistical analysis was performed by R, and p
This study examined the expression and mutation of ten genes belonging to the ADCY family in cancer. As shown in Fig. 1A, the ADCY3, ADCY7, and ADCY10 expression levels in most cancer tissues were upregulated when compared with those in non-cancerous tissues. The expression of most members of the ADCY family was upregulated in kidney renal clear cell carcinoma (KIRC) and cholangiocarcinoma (CHOL). Analysis of The Cancer Genome Atlas-Gene Tissue Expression (TCGA_GTEx) data confirmed that ADCY family genes were differentially expressed between 18 tumor tissues and their matched samples (Fig. 1B).
 Fig. 1.
Expression of adenylate cyclase (ADCY) family genes in
pan-cancer species. (A) Colors represent the difference between the mean value
of the gene in the tumor group compared to the mean value in the normal group for
each cancer type. A positive difference is colored in red, while a negative
difference is colored in blue. The larger the absolute value of the difference,
the darker the color. (B) Differential expression of ADCY family genes in paired
samples. The left side is the adjacent tissue of the cancer, and the right side
is the tumor tissue from the same patient. The paired samples are connected by
line segments. ns: p
The most commonly mutated ADCY family member in the pan-cancer dataset was ADCY8, followed by ADCY2 (Fig. 2A). The ten members of the ADCY family were frequently mutated in uterine corpus endometrial carcinoma (UCEC) but less frequently mutated in thyroid carcinoma (THCA) and kidney chromophobe (KICH). Analysis of the copy number revealed deletions in ADCY1, ADCY5, and ADCY8 (Fig. 2B). The copy number variations of these genes were significantly and positively correlated with their expression levels (Fig. 2C). Additionally, the methylation levels of the ADCY1, ADCY5, and ADCY8 promoter regions were downregulated in the pan-cancer dataset. However, the methylation levels in the ADCY8 promoter were significantly upregulated in UCEC and cervical squamous cell carcinoma and endocervical adenocarcinoma (CESC) (Fig. 2D). The DNA methylation levels of the ADCY3, ADCY4, and ADCY5 promoter regions in the pan-cancer dataset were significantly and negatively correlated with their mRNA expression levels (Fig. 2E).
 Fig. 2.
Mutation and co-expression profiles of the ADCY gene family. (A) Mutation frequency map of ADCY family genes. (B) CNV frequency plot of ADCY family genes in different cancer types. (C) Correlation between CNV and mRNA expression of genes in pan-cancer. (D) Differential DNA methylation in the promoter region of ADCY family genes in pan-cancer. (E) Association between promoter methylation and mRNA expression of ADCY5. (F) Correlation between ADCY family genes in ten types of carcinomas. (G) Heatmap of co-expression between ADCY family genes in ten types of carcinomas.
Previous studies have demonstrated that ADCY members coordinate with each other to regulate critical cellular functions. The correlation of ADCY family expression was examined in ten different cancers using TCGA data. The expression of ADCY family members was strongly correlated in all these cancers (Fig. 2F). The co-expression heatmap is shown in Fig. 2G.
Next, the correlation of ADCY family members with the prognosis of different tumors was examined using univariate Cox proportional risk regression models. The dysregulation of ADCY family expression was associated with OS in patients with cancer (Fig. 3). ADCY6 and ADCY7 were associated with prognosis in up to seven cancers. The upregulated expression of ADCY10 could predict poor prognosis in adrenocortical carcinoma (ACC), KIRC, brain lower-grade glioma (LGG), mesothelioma (MESO), and UCEC. The specific predictive values of the ADCY family members for various types of cancer are shown in the Forest plots.
 Fig. 3.
One-way Cox regression analysis of prognosis of ADCY family
members in pan-cancer. Red color indicates HR greater than 1 and p
The ability of the ten ADCY family members to predict prognosis was good in the pan-cancer dataset (Fig. 4A–O), especially in colon adenocarcinoma (COAD), lung adenocarcinoma (LUAD), bladder urothelial carcinoma (BLCA), and LIHC (Fig. 4F,I,M). The specific genes with good predictive ability for different cancers were as follows: ADCY1: glioma (GBMLGG) and CHOL; ADCY3: stomach adenocarcinoma (STAD), head and neck squamous cell carcinoma (HNSC), rectum adenocarcinoma (READ), GBMLGG, CHOL, and COAD; ADCY8: LUAD, THCA, and breast invasive carcinoma (BRCA); ADCY5: BRCA, prostate adenocarcinoma (PRAD), pancreatic adenocarcinoma (PAAD), BLCA, READ, GBMLGG, CHOL, COAD, and CESC. These results suggest that the ADCY family members are excellent predictive markers for different cancers.
 Fig. 4.
Diagnostic potential of ADCY family genes across cancers. ADCY family gene prediction in (A) Breast Invasive Carcinoma. (B) Prostate adenocarcinoma. (C) Stomach adenocarcinoma. (D) Thyroid carcinoma. (E) Kidney renal clear cell. (F) Bladder urothelial carcinoma. (G) Pancreatic adenocarcinoma. (H) Lung adenocarcinoma. (I) Liver hepatocellular carcinoma. (J) Head and neck squamous cell carcinoma. (K) Prostate adenocarcinoma. (L) Glioblastoma and low-grade glioma. (M) Colon adenocarcinoma. (N) Cholangiocarcinoma. (O) Cervical squamous cell carcinoma.
To comprehensively profile ADCY5 expression, we analyzed its levels across normal tissues (from GTEx) and tumors (from TCGA). This integrated analysis revealed generally low and dysregulated ADCY5 expression in cancers of the stomach, lung, and intestine (Fig. 5A). Immunohistochemical staining further confirmed moderate to high ADCY5 protein expression in various tumor cells (Fig. 5B), consistent with transcript levels observed in five representative cancers (Fig. 5C). We next investigated the clinical relevance of ADCY5 by assessing its relationship with cancer stage, gender, and age. ADCY5 expression varied significantly with tumor stage in several cancers, including COAD, BRCA, Stomach and Esophageal carcinoma (STES), STAD, KIRC, Ovarian serous cystadenocarcinoma (OV), and Pan-kidney cohort (KIPAN) (Fig. 5D). A notable sex-based difference was observed, with male patients exhibiting significantly higher ADCY5 expression than females in COADREAD, BRCA, Sarcoma (SARC), and kidney renal papillary cell carcinoma (KIRP) (Fig. 5E). Furthermore, ADCY5 expression exhibited distinct age-associated patterns, showing a negative correlation with age in GBMLGG but a positive correlation in Thymoma (THYM), OV, and BRCA (Fig. 5F).
 Fig. 5.
Pan-cancer expression and clinical correlations of ADCY5. (A)
For comparative visualization, ADCY5 expression across tumor and normal tissues
from various organs was normalized to unitary Z-scores, and the median values for
each group were plotted. (B) ADCY5 shows moderate to high intensity staining in
different parts of the tumor cells. (C) Immunohistochemical images of ADCY5 in
the Human Protein Atlas (HPA) database. (D,E) Correlation between ADCY5
expression stage and gender. (F) Correlation between ADCY5 expression and age. *
p
The effect of ADCY5 on the OS, DSS, DFI, and PFI in the pan-cancer dataset was examined. ADCY5 upregulation predicted poor prognosis in patients with COAD, STAD, and MESO (Fig. 6A). In contrast, ADCY5 upregulation exerted protective effects in ACC, KIRC, and LGG. The specific effect of ADCY5 expression on OS in each tumor type is shown in the Forest plot (Fig. 6B). Kaplan-Meier survival analysis confirmed that ADCY5 is a prognostic biomarker for ACC, BLCA, KIRC, LGG, MESO, and STAD (Fig. 6C).
 Fig. 6.
Prognostic value of ADCY5 in pan-cancer. (A) Correlation of
ADCY5 expression level with overall survival (OS), disease-specific survival
(DSS), disease-free interval (DFI), and progression-free interval (PFI). Red
indicates risk factors (high expression is associated with poorer survival),
green indicates protective factors (high expression is associated with better
survival), gray indicates no calculations were performed or missing data, and
white indicates no significant association. Calculations were performed using
both univariate Cox and Log-rank methods. (B) Prognostic value of ADCY5 in
patients with various malignancies. The impact of individual factors on overall
survival was evaluated using univariate Cox proportional hazards models from the
R “survival” package. (C) Overall survival stratified by ADCY5 expression in six
cancer types. The blue dashed line represents the high-expression group, while
the orange dashed line denotes the low-expression group. Survival curves between
the two groups were compared using the Log-rank test, with p
To explore the potential function of ADCY5 in different types of cancers, we performed gene set enrichment analysis. GSEA analysis demonstrated the important pathways and biological functions that ADCY5 may be involved in pan-cancer (Fig. 7). Epithelial-mesenchymal transition and myogenesis were significantly enriched in the ADCY5 high expression group. We also calculated the correlation between ADCY5 and the different functional status scores of 14 tumor cells in pan-cancer, and the results showed that ADCY5 had a strong positive correlation with angiogenesis, differentiation and stemness (Supplementary Fig. 1). We performed pan-cancer GSEA enrichment analysis on the Hallmark gene set, metabolic gene set, immune-related gene set, and senescence-related gene set (Supplementary Fig. 2). In most tumors, ADCY5 was associated with prostaglandin and leukotriene metabolism in senescence, epithelial-mesenchymal transition, hedgehog signaling, B-cell differentiation, B-cell receptor signaling pathway, drug metabolism, and biocarta eicosanoid pathway. Thus, ADCY5 may exert its effects in cancers through these pathways.
 Fig. 7.
Differences in the enrichment of ADCY5 were analyzed across 50 Hallmark pathways and 83 metabolic genome datasets. Based on gene expression levels, samples were dichotomized into high- and low-expression groups (top and bottom 30%, respectively). Differential expression was analyzed with the limma package, followed by Gene Set Enrichment Analysis (GSEA) using clusterProfiler. The enrichment score (ES) for each gene set was computed, followed by significance testing and adjustment for multiple hypotheses regarding the ES values. Visualization of the results was facilitated through bubble plots. A negative normalized enrichment score (NES) denotes significant pathway enrichment in the ADCY5 low-expression group, whereas a positive NES suggests significant enrichment in the ADCY5 high-expression group. The intensity of the color represents the magnitude of the absolute value of the ES, while the degree of scatter among the bubbles correlates with the significance of the adjusted p-value.
We further analyzed the relationship between ADCY5 and response to immunotherapy in a clinical trial. In Kim cohort 2019 (anti-PD1/PD-L1), patients with a high response rate to immunotherapy had lower ADCY5 expression (Fig. 8A). Further, we performed ROC curve analysis based on ADCY5 expression to measure the predictability of ADCY5 response to immunotherapy (Fig. 8B). The area under the curve in Kim cohort 2019 (anti-PD1/PD-L1) was 0.783. In addition, survival analysis showed that anti-PD-L1-treated patients with high ADCY5 expression had shorter OS (Fig. 8C).
 Fig. 8.
Association of ADCY5 with Immunotherapy and the Tumor
Immune Microenvironment. (A) High ADCY5 expression was associated with a reduced
response rate to immunotherapy. (B) ROC curves based on ADCY5 expression in
patients in the immunotherapy cohort. (C) Patients exhibiting elevated levels of
ADCY5 expression experienced a reduced survival rate in response to this
immunotherapy treatment. (D–F) The relationship between ADCY5 expression and
tumor mutational burden, neoantigen expression, and microsatellite instability
was assessed across various cancer types. (G) The association between ADCY5
expression and the prevalence of immune-related cell populations within tumors
was analyzed. (H,I) In the spatial transcriptome map, each point corresponds to a
sequenced microregion, and colors denote different cell populations; a deeper red
hue signifies an increased ADCY5 expression within that particular spot. (J)
Spearman correlation analysis was employed to determine the relationships between
cell content and cell content, as well as between cell content and gene
expression across all identified spots. * p
TMB, MSI, and Neoantigen (NEO) are considered to have important roles in predicting tumor immunotherapy response. We observed a significant negative correlation of ADCY5 expression with TMB and MSI in more than half types of tumors (Fig. 8D,E), especially STAD, Lymphoid Neoplasm Diffuse Large B-cell Lymphoma (DLBC), and STES. ADCY5 showed a significant positive correlation with NEO in testicular germ cell tumors (TGCT) and THCA, and a significant negative correlation with NEO in THYM and READ (Fig. 8F). Spatial transcriptomics is a powerful technique that enables the simultaneous acquisition of cellular spatial localization and gene expression profiles, serving as a pivotal research tool for elucidating cellular functions within tissues and their interactions with the microenvironment. In this study, we aimed to visualize the gene expression landscapes across various microregions derived from spatial transcriptomic datasets. To achieve this, we utilized the SpatialFeaturePlot function available in the Seurat package, which allowed us to illustrate the enrichment scores corresponding to each cell type. A darker hue in the visualization indicates a higher enrichment score, reflecting an increased abundance of that specific cell type within the designated spot. At the same time, we analyzed the correlation between the cell content ADCY5 expression in all the spots was calculated (Fig. 8H–J). Highly consistent with the results we obtained using transcriptomic data: in both CRC and LIHC (Fig. 8G), The positive correlation of ADCY5 with CD4+ T cells, CD8+ T cells, and dendritic cells indicates its association with tumor immune infiltration.
To further explore potential drugs targeting ADCY5, CMap analysis was used. In a comprehensive analysis encompassing over 15 different cancer types, MK.886 emerged as the most promising compound capable of correcting the dysregulation of ADCY5 and alleviating its associated oncogenic impacts (Fig. 9A). Additionally, we identified compounds that specifically target ADCY5 across six distinct cancers, highlighting its prognostic significance in these malignancies (Fig. 9B). These results lend considerable credence to our predicted efficacy; however, additional research is warranted to clarify the mechanisms.
 Fig. 9.
Identification of potential therapeutic compounds targeting ADCY5. (A) Identification of ADCY5 target compounds by Connectivity Map (CMap) analysis. (B) Target compounds in six cancers.
Uniform Manifold Approximation and Projection (UMAP) was utilized to visualize the distribution of single-cell data following the dimensionality reduction of the GSE167297 dataset, leading to the segregation of distinct cell types based on their specific expression profiles (Fig. 10A,B). Cells were classified into two categories: expression-positive and expression-negative, contingent upon the presence or absence of ADCY5 expression. The relative proportions of each cell type were quantified between the two groups; notably, the proportion of Fibroblasts in the ADCY5-expression-positive cohort was significantly elevated compared to that in the ADCY5-expression-negative cohort (Fig. 10C). Furthermore, we analyzed the variations in ADCY5 expression across different cell types (Fig. 10D–F). We also evaluated scores associated with immune responses, metabolic processes, signaling pathways, proliferation, cell death, and mitochondria-related biological pathways, comparing the scoring discrepancies between the ADCY5 expression-negative and ADCY5 expression-positive groups (Fig. 10G). Elevated mitochondrial pathway scores in ADCY5-positive endothelial cells implicate a potential mechanistic role for ADCY5 in gastric cancer.
 Fig. 10.
Analysis of ADCY5 in single-cell data of gastric cancer. (A,B) Through the application of Uniform Manifold Approximation and Projection (UMAP) for dimensionality reduction, distinct cell populations were delineated based on their characteristic expression profiles. (C) In this analysis, the red hue denotes the group exhibiting positive expression of ADCY5, while the blue hue signifies the group with negative ADCY5 expression. (D–F) The variations in the expression levels of select genes across different cell types were evaluated utilizing the Kruskal-Wallis rank sum test (commonly referred to as the Kruskal test). (G) The scoring of biological pathways associated with immune responses, metabolism, signaling, proliferation, cellular apoptosis, and mitochondrial functions was conducted using the AUCell package. The red color represents pathway scoring increased in the ADCY5 expression-positive group (activation) and the blue color represents pathway scoring decreased in the ADCY5-positive group (inhibition).
ADCY5 upregulation predicts poor OS in patients with gastric cancer. To examine if ADCY5 can serve as a biomarker for gastric cancer, the effects of ADCY5 expression on DSS and PFI in patients with gastric cancer were examined (Fig. 11A,B). ADCY5 upregulation predicted poor prognosis in patients with gastric cancer. Additionally, ADCY5 expression could predict the prognosis of patient subgroups stratified according to clinical characteristics, including male patients, patients without Helicobacter pylori infection, and patients with completely resected tumors (Fig. 11C–E).
 Fig. 11.
ADCY5 as an independent prognostic biomarker in gastric cancer.
(A,B) DSS and PFI analysis of ADCY5 in the TCGA-STAD cohort. (C–E) The survival
value of ADCY5 in different clinical subgroups, including male patients, patients
without Hp infection, and patients with complete tumor resection. (F–H)
Association of ADCY5 expression with clinicopathologic parameters, including
T-stage and age. (I,J) To identify independent prognostic factors, we conducted
univariate and multivariate Cox regression analyses on the TCGA-STAD cohort. (K)
Development of a column-line graphical model for ADCY5. (L) Presentation of
calibration curves for the 1-year, 3-year, and 5-year intervals corresponding to
this column-line graphical model. ** p
Analysis of the correlation of ADCY5 with clinical characteristics in the
TCGA-STAD cohort revealed that ADCY5 expression in patients with stage T3 and T4
tumors was significantly higher relative to T1–T2 stage tumors (Fig. 11G). ADCY5
expression was inversely associated with patient age, showing higher levels in
the
To determine the clinical significance of ADCY5 in gastric cancer, we utilized
pathologic tissue specimens collected from 61 gastric cancer patients for the
analysis of ADCY5 expression and clinical significance. Based on the
immunohistochemical staining results (Fig. 12A), the pathological tissue samples
obtained from patients with gastric cancer were categorized into two groups: one
exhibiting high expression levels and the other demonstrating low expression
levels. Elevated ADCY5 expression predicted poorer overall survival in gastric
cancer (Fig. 12B), which further demonstrated the value of ADCY5 as a biological
marker for gastric cancer. Forest plots demonstrating the results of univariate
and multivariate regression analyses indicated that ADCY5 may be a potential and
promising marker for predicting poor prognosis in gastric cancer (Fig. 12C,D).
Despite these bioinformatics findings suggesting a link between ADCY5 and gastric
cancer progression, its specific biological function in this cancer remains
unclear. To address this, we performed in vitro functional experiments.
ADCY5 expression was silenced using siRNA-mediated gene knockdown, and the
knockdown efficiency was confirmed by quantitative real-time PCR (Fig. 12E). Cell
proliferation was assessed using the CCK-8 assay, which revealed that ADCY5
knockdown significantly suppressed the proliferation of MKN-45 cells (Fig. 12F)
(p
 Fig. 12.
Experimental validation of ADCY5 as a prognostic marker and
functional oncogene in gastric cancer. (A) Representative immunohistochemical
(IHC) of ADCY5 in gastric cancer tissues. ADCY5 Low (20
Cancer biomarkers facilitate the prediction of patient survival outcomes, contributing to early treatment and the implementation of personalized therapies [34, 35]. Publicly available data in several large databases provide a valuable resource for identifying novel treatments for cancer [36]. Bioinformatics analysis of multi-omics data can reveal the expression, mutation, prognostic value, and function of genes in different tumors, which can lead to the identification of biomarkers [37]. In this study, we conducted a comprehensive pan-cancer analysis of the ADCY gene family to systematically identify the most promising member for in-depth clinical and functional characterization. While our bioinformatics approach revealed the potential oncogenic roles of multiple ADCYs across various cancers, we chose to focus our subsequent experimental validation on ADCY5 in gastric cancer for several reasons. Firstly, our prognostic analysis consistently implicated ADCY5 in poor outcomes in STAD. Secondly, its expression correlated with key immunotherapy biomarkers, suggesting clinical relevance in GC. Therefore, the primary aim of our validation phase was to definitively establish ADCY5’s role as a biomarker in GC, which we achieved through IHC on a patient cohort and functional assays in GC cell lines. Although ADCY5 also showed prognostic value in other cancers like COAD and LIHC in silico, their experimental exploration remains a priority for future research.
To elucidate the oncogenic functions of the ADCY family, we employed a pan-cancer approach [37, 38, 39, 40]. The ADCY gene family exhibits a diverse array of functions and has demonstrated a significant involvement in various disorders, including those affecting the neurological, respiratory, and cardiovascular systems, alongside the associated diseases within these domains [28]. Furthermore, this specific group of proteins is essential in the progression of various cancer types. Research indicates that the ADCY family significantly affects the biological characteristics of cancer cells, including proliferation, migration, and apoptosis, in several malignancies, including laryngeal cancer, glioblastoma, and lung cancer [41, 42, 43, 44]. Recently, some studies have also found that this family of genes is closely related to cancer immunity [45]. Our study presents the first comprehensive pan-cancer analysis of the ADCY gene family across 33 cancer types. By integrating multi-omics data—including genomic, epigenomic, transcriptomic, single-cell, and spatial transcriptomic information—we reveal the expression patterns, mutation landscapes, prognostic value, and immune microenvironment interactions of ADCY members in cancer. Compared to previous studies focused on single cancer types, our work provides a broader perspective, identifying the potential of ADCY5 as an independent prognostic biomarker across multiple cancers [46, 47]. These findings not only fill gaps in the existing literature but also provide novel insights for developing ADCY-targeted therapeutic strategies and immunotherapy combinations, advancing precision medicine in cancer. In this study, we found that the ADCY gene family was differentially expressed in a variety of tumors compared to normal tissues, and in particular, the expression of most of the genes in the ADCY family was upregulated in KIRC and CHOL. In parallel, the prognostic evaluation of the gene family indicated a significant correlation between these genes and the outcomes of various cancers. Additionally, the ROC curves illustrated that the ADCY family exhibited strong predictive capabilities across pan-cancer tissues. Our findings and subsequent validation imply that members of the ADCY family may serve as promising diagnostic biomarkers for cancer. We further analyzed the correlation between ADCY family members. In most cancers, all ten ADCY family gene correlations were high, especially in STAD, COAD, and PRAD. This suggests that these genes may share some functional and structural similarities and that they may influence tumor development by working in concert with each other.
Diagnostic analyses showed good predictive performance of ADCY5 in a wide range of tumors. We therefore performed a separate and more in-depth analysis of ADCY5 in an attempt to understand its role in cancer development. By analyzing overall survival, disease-specific survival, disease-free intervals, and progression-free intervals in pan-cancer, we found that high ADCY5 expression predicted a poor prognosis for COAD, MESO, and STAD and that there was a significant relationship between the ADCY5 expression level and the pathological stage, gender, and age of multiple tumors. These analyses revealed ADCY5 as a potentially effective biomarker for pan-cancer with strong clinical translational capacity.
We found that ADCY5 expression levels were significantly correlated with patient response to immunotherapy and prognosis, and that ADCY5 was significantly correlated with clinically important immunotherapy-sensitive tumor biomarkers, such as TMB and MSI, at present [48, 49, 50]. ADCY5 is reportedly linked to alterations in the tumor immune microenvironment [51]. This correlation suggests that ADCY5 expression may be linked to the level of immune cell infiltration in these cancers. Therefore, we analyzed the spatial transcriptome data in combination with transcriptomic data and found that ADCY5 was significantly and positively correlated with CD4T cells, CD8T cells and DCs cells in COAD and LIHC. These correlative findings may provide new clues and directions for future studies on cancer immune-targeted therapy, particularly in understanding the role of ADCY5 in the immune microenvironment. This intriguing association raises the hypothesis that ADCY5 might be involved in modulating immune cell recruitment or function [52, 53, 54]. However, whether ADCY5 is a driver of immune exclusion or merely a passenger biomarker reflecting the overall immune state of the tumor remains an open question. Future studies using co-culture systems or conditional knockout mouse models are needed to establish causality [55, 56].
In light of the established function of ADCY5 in oncogenesis and the intricacies of its underlying mechanisms, our study elucidated the connections between the ADCY5 gene and cancer-related signaling pathways from a comprehensive pan-cancer viewpoint. This was accomplished through GSVA and GSEA of extensive datasets, yielding novel insights into the exploration of cancer-associated pathways and enhancing our understanding of the specific influences on tumor cells. These findings lay the groundwork for subsequent experimental investigations: future research endeavors could concentrate on these dimensions, facilitating the examination of the molecular mechanisms through which ADCY5 exerts its effects across various malignancies, as well as the formulation of therapeutic strategies. Additionally, our investigation identified that MK.886, imatinib, and MS.275 have the potential to counteract ADCY5-mediated carcinogenesis, thus offering innovative perspectives for developing targeted therapeutic approaches in oncology. Ultimately, we focused on the impact of ADCY5 on gastric cancer prognosis. A prognostic analysis of public datasets as well as our own cohort of gastric cancer patients confirmed a significant association of ADCY5 on gastric cancer prognosis. This suggests that ADCY5 is a promising biomarker for predicting poor prognosis in gastric cancer. Data obtained from single-cell analyses of gastric cancer have also highlighted the possible biological roles of ADCY5.
Despite the thoroughness of our analysis, this investigation is not without its limitations, which warrant recognition. Firstly, our results are predominantly based on publicly accessible datasets, including TCGA and GTEx. Although these databases are indispensable, the amalgamation of data from diverse platforms and cohorts may lead to the introduction of batch effects and technical discrepancies. To address this potential bias, we adopted several strategies: we utilized uniformly pre-processed data (log2(TPM + 1)) obtained from the UCSC Xena browser and implemented the ‘ComBat’ algorithm for explicit batch correction when consolidating the expression matrices from TCGA and GTEx. Nevertheless, unmeasured confounding factors that are characteristic of retrospective bioinformatics studies cannot be entirely excluded. Secondly, and of greater significance, our research firmly establishes associations between ADCY5 expression and patient prognosis, immune infiltration, and therapeutic response; however, it does not establish causative relationships. The correlative nature of our data suggests that ADCY5 may either be a driver of these malignant characteristics or simply a passenger biomarker that reflects the underlying tumor state. Consequently, the definitive functional and mechanistic roles of ADCY5 across various cancers remain to be clarified. Future investigations should focus on experimental studies aimed at establishing causality. This includes utilizing in vitro models with CRISPR/Cas9 or RNAi-mediated knockdown/knockout of ADCY5 in different cancer cell lines (e.g., from gastric cancer, colorectal cancer, and liver hepatocellular carcinoma) to rigorously evaluate its influence on proliferation, invasion, and response to immunotherapy. Additionally, in vivo validation through genetically engineered mouse models will be essential to confirm the causal involvement of ADCY5 in tumorigenesis and immune modulation within a complex tumor microenvironment. Such mechanistic insights will be vital for translating our findings into targeted therapeutic interventions.
Our study conducted a systematic pan-cancer analysis of the ADCY gene family, revealing that ADCY5 is a potential prognostic biomarker associated with poor survival outcomes in specific cancers such as COAD, STAD, and MESO. Experimental validation in gastric cancer tissues supports its clinical relevance, while multi-omics data integration suggests ADCY5 may participate in immune regulation and potential response to immunotherapy. These findings highlight the biological significance of ADCY members in cancer progression and provide avenues for further investigation of targeted therapeutic strategies, including exploration of compounds like MK-886. This work contributes to a deeper understanding of ADCY dynamics and may inform future personalized treatment approaches.
TMB, Tumor mutation burden; ADCY, adenylate cyclase; NEO, Neoantigen; MSI, Microsatellite instability; ssGSEA, Single-sample gene set enrichment analysis; TCGA, The Cancer Genome Atlas; BRCA, Breast cancer; PA, Pulmonary adenocarcinoma; OS, Overall survival; DFS, Disease-free survival; PFI, Progression-free interval; DFI, Disease-free interval; PRAD, Prostate adenocarcinoma; CHOL, Cholangiocarcinoma; STAD, Stomach adenocarcinoma; KIPAN, Pan-kidney cohort; UVM, Uveal melanoma; SARC, Sarcoma; LAML, Acute myeloid leukemia; DLBCL, Diffuse large B cell lymphoma; ESCA, Esophageal carcinoma; HNSC, Head and neck squamous cell carcinoma; LIHC, Liver hepatocellular carcinoma; LUAD, Lung adenocarcinoma; LUSC, Lung squamous cell carcinoma; KIRC, Kidney renal clear cell carcinoma; KIRP, Kidney renal papillary cell carcinoma; READ, Rectum adenocarcinoma; THCA, Thyroid carcinoma; UCEC, Uterine corpus endometrial carcinoma; DLBC, Lymphoid neoplasm diffuse large B-cell lymphoma; PAAD, Pancreatic adenocarcinoma; PCPG, Pheochromocytoma and paraganglioma; THYM, Thymoma; TGCT, Testicular germ cell tumors; DSS, Disease-specific survival; GBMLGG, Glioblastoma and low-grade glioma; LGG, Brain lower-grade glioma; KICH, Kidney chromophobe; EAC, Esophageal adenocarcinoma; CESC, Cervical squamous cell carcinoma; SKCM, Skin cutaneous melanoma; BLCA, Bladder urothelial carcinoma; COAD, Colon adenocarcinoma; MESO, Mesothelioma; OV, Ovarian serous cystadenocarcinoma.
All data generated or analyzed during this study are included in this published article. The data used to support the findings of the present study are available from the corresponding author upon request.
YZ and YKL designed the research; YZZ performed the research; LRY and YZZ contributed new reagents or analytic tools; LRY analyzed the data; LRY and YZZ wrote the paper. All authors contributed to editorial changes in the manuscript. All authors read and approved the final manuscript. All authors have participated sufficiently in the work and agreed to be accountable for all aspects of the work.
The First Hospital of China Medical University’s ethics committee examined (Approval No.: [2020]2020-166-2) and approved all investigations involving human subjects. To take part in this study, the patients/participants gave their written informed consent. The study was carried out in accordance with the guidelines of the Declaration of Helsinki.
Not applicable.
This work was supported by the National Natural Science Foundation of China (No. 82073244), Shenyang Youth Science and Technology Innovation Talent Project (RC200267).
The authors declare no conflict of interest.
Supplementary material associated with this article can be found, in the online version, at https://doi.org/10.31083/FBL45527.
References
Publisher’s Note: IMR Press stays neutral with regard to jurisdictional claims in published maps and institutional affiliations.