


 , Zhitong Bing 4,5, Yongxiu Yang 1,2,*
 , Kehu Yang 3,6,7,*
1 The First Clinical Medical College of Lanzhou University, 730000 Lanzhou, Gansu, China
2 Department of Obstetrics and Gynecology, The First Hospital of Lanzhou University, Key Laboratory of Gynecologic Oncology of Gansu Province, 730000 Lanzhou, Gansu, China
3 Evidence-Based Medicine Center, School of Basic Medical Sciences, Lanzhou University, 730000 Lanzhou, Gansu, China
4 Institute of Modern Physics, Chinese Academy of Sciences, 730000 Lanzhou, Gansu, China
5 Advanced Energy Science and Technology Guangdong Laboratory, 516000 Huizhou, Guangdong, China
6 Evidence-based Social Sciences Research Center, School of Public Health, Lanzhou University, 730000 Lanzhou, Gansu, China
7 Key Laboratory of Evidence Based Medicine and Knowledge Translation of Gansu Province, 730000 Lanzhou, Gansu, China
Abstract
Claudins (CLDNs), key components of tight junctions, are dysregulated in various cancers. However, the roles and therapeutic potential of specific CLDN family members-particularly CLDN6, CLDN9, and CLDN10-in ovarian cancer (OC) remain incompletely defined. To address this gap, we conducted a comprehensive analysis of the CLDN family to identify novel diagnostic and prognostic biomarkers as well as potential therapeutic targets for OC.
Gene expression profiles and corresponding clinical data from The Cancer Genome Atlas ovarian cancer cohort (TCGA-OV) and two Gene Expression Omnibus (GEO) datasets (GSE18520, GSE26712) were analyzed. Differential expression of CLDN genes between OC and normal tissues was evaluated using R with appropriate bioinformatics packages (e.g., limma). Logistic regression models were employed to calculate odds ratios (ORs), and receiver operating characteristic (ROC) curves were generated across all datasets to identify consistently dysregulated CLDNs associated with OC. Prognostic hazard ratios (HRs) for these CLDNs were extracted from the Kaplan-Meier Plotter (KM Plotter) database and synthesized using a random-effects model to assess their associations with overall survival. Intersection analysis was performed to identify CLDNs exhibiting both significant differential expression and prognostic significance. Candidate targets underwent comprehensive validation, including single-cell RNA sequencing (scRNA-seq) to characterize cell-type-specific expression patterns. Notably, Key findings regarding CLDN6 were further validated by immunohistochemistry (IHC) on an independent tissue microarray (TMA), as well as functional assays in OC cell lines following siRNA-mediated knockdown. These included transwell invasion, wound healing (scratch) test, and measurements of mitochondrial depolarization, reactive oxygen species (ROS) accumulation, cell cycle arrest, and apoptosis.
CLDN6, CLDN9, and CLDN10 were consistently and significantly upregulated in OC compared to normal tissues across all datasets. Single-cell RNA sequencing revealed that CLDN6 and CLDN10 were predominantly expressed in malignant epithelial cell subsets, a pattern associated with aggressive tumor phenotypes. Meta-analysis of HRs showed that HR >1 in CLDN6 and HR <1 in CLDN10. Although CLDN10 is highly expressed in tumor cells, its hazard ratio (HR) is less than 1, and the underlying mechanism of this gene remains unclear. Experiments have confirmed that CLDN6 is closely associated with tumor invasion. Computational analysis, meta-analysis, and single-cell data collectively confirm that only CLDN6 is a clearly defined gene closely associated with tumor progression, a finding subsequently validated by experimental results. Notably, the combined signature comprising CLDN6, CLDN9, and CLDN10 exhibited superior diagnostic performance, with higher area under the curve (AUC) values in ROC analysis, compared to individual CLDNs or established OC biomarkers such as carbohydrate antigen 125 (CA125), human epididymis 4 (HE4), carcinoembryonic antigen (CEA), and alpha-fetoprotein (AFP). The signature also showed enhanced prognostic discrimination, as indicated by time-dependent ROC analysis. Protein overexpression of these targets was validated by IHC and Western blot. Functional assays further demonstrated that siRNA-mediated knockdown of CLDN6 significantly inhibited the proliferation of OC cells, promoted cell apoptosis, increased production of ROS, induced G1 phase arrest, inhibited cell invasion and migration in vitro. Furthermore, western blot analysis identified that knockdown of CLDN6 repressed the Wnt/β-catenin pathway. Nude mice experiments indicated that CLDN6 knockdown in OC cells dramatically suppresses the tumor growth and lung metastasis in vivo.
CLDN6, CLDN9, and CLDN10 are critically involved in the pathogenesis and progression of OC. A biomarker panel combining these three claudins demonstrates superior diagnostic and prognostic performance compared to individual markers and established clinical biomarkers such as CA125 and HE4. Notably, functional evidence indicates that CLDN6 plays a pivotal role in regulating malignant phenotypes, highlighting its potential as a novel therapeutic target. These findings collectively support the clinical utility of the CLDN6/9/10 axis as both a non-invasive biomarker signature and a promising avenue for targeted intervention in ovarian cancer.
Keywords
- claudins
- ovarian cancer
- migration
- biomarker
- Wnt signaling
Cancer remains a major global public health challenge. Ovarian cancer (OC) is the fifth leading cause of cancer-related death among women, underscoring the urgent need for improved clinical management [1]. While targeted therapies—such as PARP inhibitors—have emerged as promising treatment strategies, their efficacy is often limited by significant intratumoral and intertumoral heterogeneity. Consequently, there is a pressing need to discover robust biomarkers for early detection and prognosis, and to develop precision medicine approaches that can overcome therapeutic resistance in ovarian cancer [2, 3].
Claudins, key transmembrane components of tight junctions (TJs), are highly expressed in both benign and malignant ovarian tumors [4]. TJs, along with adherens junctions (AJs) and gap junctions, play essential roles in maintaining cell-cell adhesion, epithelial cell polarity, and regulating paracellular permeability [5, 6]. TJs are composed of integral membrane proteins—including occludin and claudins—as well as cytoplasmic scaffolding proteins such as zonula occludens-1 (ZO-1), ZO-2, and ZO-3 [7]. Occludin, a four-transmembrane-domain protein, localizes specifically to tight junctions, whereas ZO-1, ZO-2, and ZO-3 belong to the membrane-associated guanylate kinase (MAGUK) family and serve as adaptor proteins that link transmembrane components to the actin cytoskeleton. These proteins assemble at sites of cell-cell contact, where they mediate TJ formation and establish selective diffusion barriers. Tight junctions between epithelial cells are dynamically regulated, and accumulating evidence suggests that disruption of TJ integrity and loss of epithelial barrier function are closely linked to tumor initiation, progression, and metastasis [8].
Dysregulation of Claudin genes—comprising 27 known members that exhibit cell- and tissue-specific expressions—is implicated in diseases affecting multiple organs, including the kidney, intestine, lung, ovary, and mammary gland. Altered expression or genomic loss of claudins has been associated with tumorigenesis across diverse cancer types. Notably, overexpression of Claudin 1 (CLDN1), CLDN3, CLDN4, CLDN10, and CLDN18 has been reported in various malignancies, whereas downregulation or deletion of CLDN1, CLDN5, and CLDN7 is linked to aggressive phenotypes in prostate cancer, breast cancer, and other tumors [9]. Claudins display distinct expression patterns within individual organs, with different tissues expressing unique combinations of claudin isoforms. The interactions among these isoforms are thought to govern the structural integrity and ion selectivity of TJs. As transmembrane cell surface proteins, claudins typically show strong membranous immunostaining in tumor cells when overexpressed, with minimal cytoplasmic signal. Importantly, aberrant delocalization of claudins from the plasma membrane—a common feature in transformed epithelial cells—is associated with increased migratory and invasive capacity in ovarian cancer [10, 11]. Cumulative evidence indicates that the expression profiles of the 24-member claudin family are highly specific to organ and tissue context, highlighting their potential as diagnostic and therapeutic targets.
Aberrant expression of claudin genes has been implicated in a wide range of organ-specific diseases, particularly in the kidney [12], intestine [13], lung [14], ovary [15], and mammary gland [16]. The spectrum of claudin alterations includes upregulation, downregulation, gene deletions, and epigenetic silencing—either individually or in combination. Regardless of the specific type of dysregulation, perturbations in claudin function are increasingly recognized as key contributors to tumorigenesis, with distinct roles shaped by the identity of the affected CLDN isoform and the tissue context. For example, loss or reduced gene expression of Claudin is associated with tumor progression in instances such as liver cancer, lung cancer, prostate cancer, breast cancer, esophageal cancer, stomach cancer, colorectal cancer, and other tumors [17, 18, 19, 20, 21, 22].
In contrast, overexpression of Claudin-1 has been consistently reported in several malignancies, including oral squamous cell carcinoma [23], colon cancer [24], and malignant melanoma [25]. Notably, both CLDN1 and CLDN2 are frequently upregulated in colorectal cancer, suggesting a potential cooperative role in disease pathogenesis [26, 27].
Multiple studies have demonstrated overexpression of CLDN3 and CLDN4 in various malignancies, including prostate, pancreatic, breast, uterine, and ovarian cancers [28]. In liver and thyroid cancers, CLDN10 is upregulated, whereas CLDN18 overexpression has been reported in pancreatic cancer [29, 30]. In contrast, downregulation of specific claudins is also implicated in tumorigenesis. For example, reduced expression or deletion of CLDN1 gene is associated with esophageal, lung, liver, invasive breast, gastrointestinal, ovarian, and cervical tumors. In prostate cancer, low levels of CLDN1 and CLDN5 correlate with aggressive disease features. Similarly, diminished CLDN7 expression is observed in head and neck carcinoma and ductal breast carcinoma, where it often predicts poor outcomes. Notably, co-occurring dysregulation of multiple claudins contributes to tumor initiation and progression; for instance, concurrent high CLDN4 and low CLDN7 expression levels have been identified as independent predictors of triple-negative breast cancer metastasis [31]. Furthermore, although CLDN3 and CLDN4 are frequently overexpressed in prostate cancer, reduced expression of CLDN1 and CLDN7 is inversely associated with tumor malignancy [32]. Together, these findings highlight the complex and context-dependent roles of claudin family members during tumor progression, underscoring the importance of further investigating their functional and clinical relevance in ovarian cancer.
In ovarian cancer, differential expressions of Claudin genes, including CLDN3, CLDN4, CLDN6, and CLDN7, have been observed and are implicated in tumor invasion and metastasis. Notably, CLDN6 is frequently overexpressed in ovarian cancer tissues, making it a promising therapeutic target. This potential is supported by the clinical efficacy of anti-CLDN6 monoclonal antibodies in testicular germ cell tumors. Emerging evidence further highlights the feasibility of targeting CLDN6 with antibody–drug conjugates (ADCs) and radionuclide-based therapies for the treatment of ovarian cancer.
Our study leveraged multi-omics data from The Cancer Genome Atlas (TCGA) and Gene Expression Omnibus (GEO), complemented by meta-analyses and single-cell RNA sequencing, to investigate the association between CLDN6, CLDN9, and CLDN10 expression and clinicopathological characteristics in ovarian cancer patients. By integrating single-cell sequencing and bulk transcriptome analysis, we demonstrate that a combined expression signature of these three genes significantly correlated with key clinical parameters and exhibits strong potential as a biomarker panel for early and accurate diagnosis of ovarian cancer. These findings provide a foundation for developing improved diagnostic strategies and novel therapeutic targets.
Gene expression profiles data from TCGA and GEO databases were retrieved for analysis. The GSE18520 and GSE26712 datasets (https://www.ncbi.nlm.nih.gov/geo) were obtained from GEO. GSE18520 included 10 normal tissues and 53 ovarian cancer samples, while GSE26712 comprised 10 normal ovarian tissues and 185 ovarian cancer samples. Clinical data from TCGA (https://www.cancer.gov/ccg/research/genome-sequencing/tcga/studied-cancers)—including patient age, clinical stage, pathological grade, lymph node and vein infiltration, vascular invasion, and survival outcomes—were extracted from the database and linked to 620 tumor samples and 10 normal samples. Due to the significant disparity in the number of tumor samples and normal samples in the TCGA database, calculations such as the odds ratio (OR) may introduce substantial bias. Therefore, TCGA data is primarily utilized in the field of tumor genomic analysis. Additionally, single-cell sequencing data from GSE184880, consisting of 7 ovarian tumor tissues and 5 adjacent non-tumor tissues, were incorporated into the integrative analysis.
We initially screened 14 ovarian cancer gene expression datasets from GEO,
including GSE3149, GSE9891, GSE26712, GSE14764, GSE15622, GSE18520, GSE19829,
GSE23554, GSE26193, GSE27651, GSE30161, GSE51373, GSE63885, and GSE65986. Among
these, only GSE18520 and GSE26712, along with TCGA dataset, included matched
normal and tumor tissue samples and were therefore selected for downstream
analysis. For each of the three datasets, univariate logistic regression analyses
were performed in R to evaluate the association between CLDN gene expression
(dichotomized at the median) and disease status (tumor vs. normal). Odds ratios
(ORs) and corresponding p-values were calculated, and genes showing
statistically significant associations (p
Using DEcenter, we identified significantly elevated expression of claudins in ovarian tumor tissues compared to normal tissues. To further examine the expression patterns of CLDN genes at single-cell resolution, we analyzed a publicly available scRNA-seq dataset (e.g., GSEXXXXXX) downloaded from GEO, preprocessing the data with the Seurat package in R [33]. Quality control was performed by excluding cells with fewer than 200 or more than 10,000 detected genes, as well as those with greater than 5% mitochondrial read content. Additionally, only genes expressed in at least three cells were retained for downstream analysis. The filtered data were normalized and corrected for batch effects before undergoing dimensional reduction. Principal component analysis (PCA) was conducted to capture major sources of variation, and the top principal components were used as input for Uniform Manifold Approximation and Projection (UMAP) to generate a two-dimensional embedding for visualization. Cell clusters were identified using the FindClusters algorithm, and their identities were annotated by comparing cluster-specific expression profiles to reference bulk RNA-seq datasets from Blueprint and ENCODE, using the SingleR package (Dvir Aran lab, Israel) [34]. Finally, the expression patterns of target genes—including CLDN6, CLDN9, and CLDN10—were examined across distinct cell populations to determine their cellular context and potential functional roles.
To further explore the functional roles of CLDN6, CLDN9, and CLDN10 in OC at the transcriptome level, we dichotomized tumor samples into high- and low-expression groups based on the median expression level of each gene. Gene Ontology (GO) and Kyoto Encyclopedia of Genes and Genomes (KEGG) pathway enrichment analyses were then performed using the clusterProfiler R package. To investigate intercellular communication patterns at single-cell resolution, we applied the “CellChat” R package and the CellchatDB human database (https://rdrr.io/github/sqjin/CellChat/man/CellChatDB.human.html) to infer ligand–receptor-mediated signaling networks. Overlapping enriched pathways identified across multiple CLDN-associated analyses were selected for further evaluation. Finally, Gene Set Enrichment Analysis (GSEA, v4.3.2, Broad Institute, Cambridge, MA, USA, https://www.gsea-msigdb.org/gsea) was conducted to assess the enrichment of these candidate pathways in high-versus low-expression groups, thereby evaluating the functional impact of CLDN6, CLDN9, and CLDN10 expression on key biological processes.
ROC curves and corresponding area under the curve (AUC) values were generated for a multi-gene signature combining CLDN6, CLDN9, and CLDN10, and compared with those of established clinical biomarkers—including carbohydrate antigen 125 (CA125), human epididymis 4 (HE4), carcinoembryonic antigen (CEA), and alpha-fetoprotein (AFP)—in three independent datasets.
All 8 tissue samples were collected from the Gynecology Department Specimen Repository of the First Hospital of Lanzhou University. The present study received ethical approval from the First Hospital of Lanzhou University. Written informed consent approving this study was obtained from each patient.
The human ovarian epithelial carcinoma cell lines OV-90 and SK-OV-3 were obtained from the Cell Bank of Type Culture Collection of the Shanghai Institute of Biochemistry and Cell Biology, Chinese Academy of Sciences (Shanghai, China). The luciferase-expressing SK-OV-3 (Luc1) cell line was purchased from Meisen Chinese Tissue Culture Collections (Zhejiang, China). All cells were cultured in Dulbecco’s Modified Eagle Medium (DMEM; Invitrogen, Waltham, MA, USA), supplemented with 10% fetal bovine serum (FBS) and 1% penicillin-streptomycin solution (both from Invitrogen). Cells were maintained at 37 °C in a humidified atmosphere containing 5% CO2 and were routinely passaged when reaching approximately 80% confluence. All cell lines were validated by STR profiling and tested negative for mycoplasma.
Specific small interfering RNAs (siRNAs) targeting CLDN6, CLDN9, and CLDN10, along with a non-targeting siRNA as a negative control (NC), were synthesized by GenePharma (Shanghai, China). For stable knockdown, a lentiviral vector encoding short hairpin RNA (shRNA) against CLDN6 was also obtained from GenePharma. Transient transfections were performed in OV-90 and SK-OV-3 cells using Lipofectamine 2000 (Invitrogen) according to the manufacturer’s instructions. Knockdown efficiency was validated 48 hours post-transfection by RT-qPCR, and cells were subsequently harvested for functional assays. To generate stable CLDN6-knockdown OV-90 (Luc1) cells, lentiviral particles were used to infect target cells, followed by puromycin selection. The resulting cell line was employed to establish both subcutaneous xenograft tumors and experimental lung metastasis models in immunodeficient mice.
Total RNA was extracted from cultured cells using TRIzol reagent (Invitrogen), according to the manufacturer’s instructions. One microgram of total RNA was reverse-transcribed into cDNA using the miScript II Reverse Transcription Kit (218161, Qiagen, Germantown, MD, USA). Quantitative real-time PCR (qPCR) was performed using the miScript SYBR Green PCR Master Mix (Qiagen) on an ABI Prism 7900HT Sequence Detection System (Applied Biosystems). Each reaction was carried out in a final volume of 20 µL and included 40 cycles of amplification under the following thermal cycling conditions: 95 °C for 3 min (initial activation), followed by 95 °C for 15 sec, 58 °C for 30 sec, and 72 °C for 7 min per cycle. The relative mRNA expression levels were calculated using the 2-ΔΔCq method, with GAPDH or ACTB used as endogenous reference genes.
Primer sequence:
CLDN6 F: 5′-TGTTCGGCTTGCTGGTCTAC-3′
R: 5′-CGGGGATTAGCGTCAGGAC-3′
CLDN9 F: 5′-ATGCAGTGCAAGGTGTACGA-3′
R: 5′-ATCAGGCCAAGGTCGAAAGG-3′
CLDN10 F: 5′-CTGTGGAAGGCGTGCGTTA-3′
R: 5′-CAAAGAAGCCCAGGCTGACA-3′
GAPDH F: 5′-ACAACTTTGGTATCGTGGAAGG-3′
R: 5′-GCCATCACGCCACAGTTTC-3′
Formalin-fixed, paraffin-embedded tissue sections (4 µm thickness) were deparaffinized in xylene and rehydrated through a graded ethanol series (100%, 95%, and 70%) for 5 minutes each. Antigen retrieval was performed via heat-induced epitope retrieval (HIER) using a pressure cooker at 120 °C for 15 minutes in Tris-EDTA buffer (10 mM Tris, 1 mM EDTA, pH 8.0). Endogenous peroxidase activity was blocked with 3% hydrogen peroxide for 10 minutes at room temperature. Sections were incubated overnight at 4 °C with the primary antibody (CLDN6 1:200, 75055; CLDN9 1:500, 192398; CLDN10 1:400, 52234), followed by incubation with a horseradish peroxidase (HRP)-conjugated secondary antibody (Goat Anti-Rat IgG (H+L), 1:4500, AS106, ABCLonal, Wuhan, Hubei, China). Immunoreactivity was visualized using 3,3′-diaminobenzidine (DAB) as chromogen, and nuclei were counterstained with Gill’s Hematoxylin III (Carl Roth). The antibodies for CLDN6/CLDN9/CLDN10 are all provided by Abcam Company (Cambridge, UK). After brief bluing in distilled water, sections were dehydrated and mounted with EcoMount (Biocare Medical) for microscopic examination.
For the wound healing assay, cells were seeded at a density of 1
For the Transwell migration assay, a polycarbonate membrane insert with an
8 µm pore size (Corning) was used. Ovarian cancer cells (5
Total proteins were extracted from ovarian cancer tumor tissues, matched adjacent non-tumor tissues, and OC cell lines. Equal amounts of protein lysates were separated by SDS-PAGE and transferred onto polyvinylidene fluoride (PVDF) membranes. After blocking with 5% non-fat milk in Tris-buffered saline containing 0.1% Tween-20 (TBST) for 1 hour at room temperature, membranes were incubated overnight at 4 °C with primary monoclonal rabbit antibodies against the target protein (e.g., anti-CLDN6, 1:1000, 75055). Following three washes with TBST, membranes were incubated with horseradish peroxidase (HRP)-conjugated goat anti-rabbit IgG secondary antibody (1:4500, AS106, ABCLonal) for 1 hour at room temperature. After additional TBST washes, protein bands were visualized using an enhanced chemiluminescence (ECL) detection reagent according to the manufacturer’s instructions.
Apoptosis was assessed using an Annexin V-FITC/Propidium Iodide (PI) apoptosis detection kit (AP101, MultiSciences, Hangzhou, Zhejiang, China), according to the manufacturer’s instructions. Briefly, harvested cells were washed once with cold phosphate-buffered saline (PBS), then resuspended in Annexin V Binding Buffer. Aliquots of 100 µL cell suspension were incubated with 5 µL Annexin V-FITC and 5 µL PI for 15 minutes at room temperature (approx. 25 °C) in the dark. Following staining, 400 µL of Annexin V Binding Buffer was added directly to each sample without washing to maintain cell viability and prevent loss of early apoptotic cells. Samples were analyzed within 1 hour by flow cytometry using a Longcyte flow cytometer (C2060, Challenbio, Beijing, China). Fluorescence signals were detected in the FL1 (FITC) and FL2 (PI) channels. Data were processed using FlowJo v10 software (BD Life Sciences, Franklin Lakes, NJ, USA), with apoptotic cells defined as Annexin V-positive (early and late apoptosis). All experiments were performed in biological triplicate.
Cells were harvested, washed in PBS, and fixed in cold 70% ethanol for 30
minutes at 4 °C. Fixed cells were washed and stained with propidium
iodide (MultiSciences) for 15 minutes in the dark. Samples were analyzed
immediately using a flow cytometer. DNA content was measured (
Cells were harvested, washed in PBS, and resuspended in warm culture medium.
JC-1 dye (final concentration: 5–10 µM; MultiSciences) was added,
and cells were incubated for 15–30 minutes at 37 °C in the dark. Cells
were washed with PBS, resuspended, and analyzed immediately by flow cytometry.
Fluorescence was detected in the FL1 (green monomers, low
Cells were harvested, washed with PBS, and incubated with 10 µM DCFH-DA (2′,7′-dichlorodihydrofluorescein diacetate; Beyotime, Shanghai, China) for 30 minutes at 37 °C in the dark. After washing, cells were resuspended in fresh medium and incubated for 15 minutes at 37 °C to allow hydrolysis of DCFH-DA to DCFH. Reactive oxygen species (ROS) oxidized non-fluorescent DCFH to fluorescent DCF. Samples were analyzed immediately by flow cytometry. Data were analyzed using FlowJo software. Experiments were performed in triplicate.
Female nude mice (4–6 weeks old) were randomly assigned to subcutaneous
xenograft tumor and lung metastasis model groups. CLDN6-knockdown OV-90 cells
were injected subcutaneously or via the tail vein. Each mouse received a
subcutaneous inoculation of 2
The DECenter platform was used to analyze transcriptomic differences and
identify gene expression disparities between cancerous and adjacent non-tumor
tissues. Additionally, differential gene expression analysis was conducted using
the limma package in R, with results considered statistically significant at
By integrating transcriptomic data from TCGA and two GEO datasets (GSE18520 and
GSE26712), we identified multiple differentially expressed CLDN genes across
cohorts. In the TCGA cohort, 9 CLDN genes were significantly upregulated and 13
were downregulated; in GSE18520, 12 were upregulated and 5 were downregulated;
and in GSE26712, 8 were upregulated and 3 were downregulated (Fig. 1).
Cross-dataset integration revealed five CLDN genes—namely CLDN4,
CLDN6, CLDN9, CLDN10, and CLDN16—that were
consistently upregulated and significantly associated with ovarian cancer status
(odds ratio
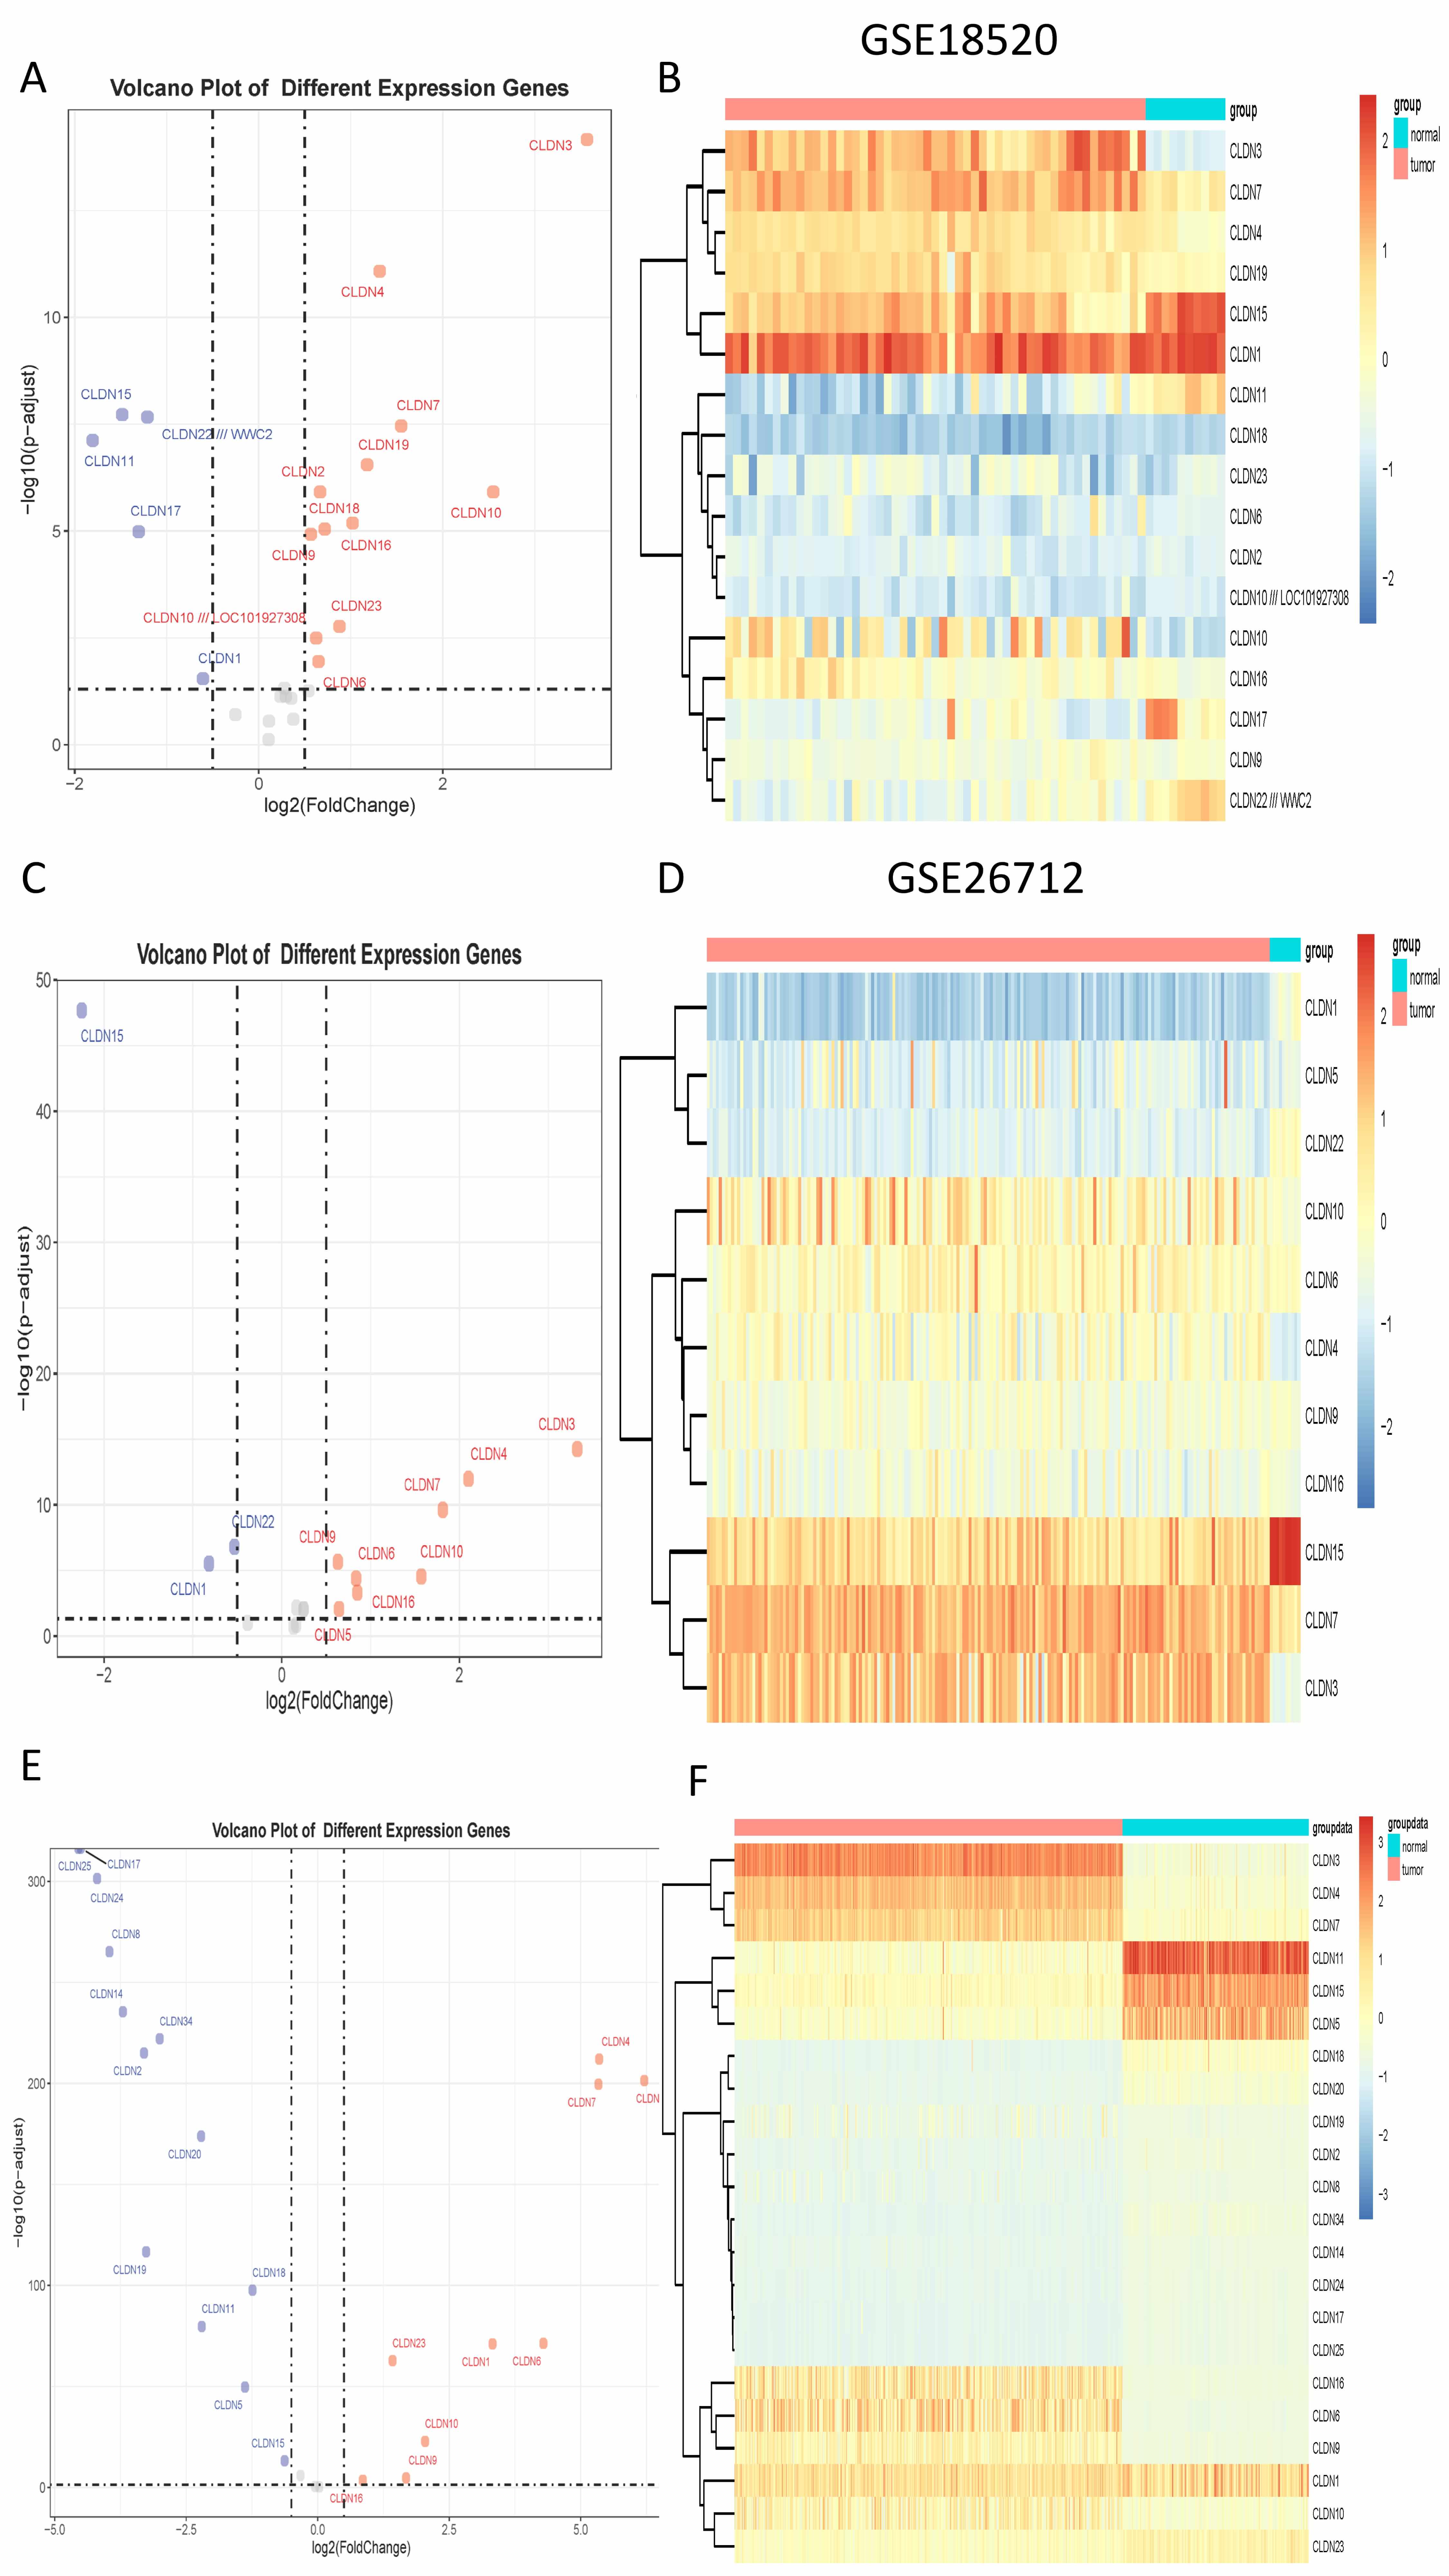 Fig. 1.
The differential expression of Claudin genes. (A) The volcano plot displays differential expression in GSE18520. (B) The heatmap displays differential expression in GSE18520. (C) The volcano plot displays differential expression in GSE26712. (D) The heatmap displays differential expression in GSE26712. (E) The volcano plot displays differential expression in TCGA. (F) The heatmap displays differential expression in TCGA. TCGA, The Cancer Genome Atlas.
| CLDN | Datasets | OR | p value |
| CLDN4 | GSE18520 | 7.155 | 0.011 |
| CLDN4 | GSE26712 | 4.205 | 0.001 |
| CLDN6 | GSE18520 | 6.563 | 0.046 |
| CLDN6 | GSE26712 | 4.256 | 0.000 |
| CLDN9 | GSE18520 | 7.576 | 0.000 |
| CLDN9 | GSE26712 | 9.870 | 0.000 |
| CLDN10 | GSE18520 | 2.251 | 0.003 |
| CLDN10 | GSE26712 | 4.997 | 0.000 |
| CLDN16 | GSE18520 | 3.401 | 0.001 |
| CLDN16 | GSE26712 | 4.558 | 0.000 |
OR, odds ratios; CLDN, Claudins.
Survival analysis using the Kaplan-Meier Plotter database, combined with
meta-analysis, revealed that high expression of CLDN1, CLDN2, CLDN6, CLDN9, and
CLDN10 showed high expression in tumors. The genes CLDN1,
CLDN2, CLDN6, CLDN9, and CLDN10 all
demonstrate high expression in tumors. However, findings from
different studies and researchers vary: some indicate these genes are risk
factors associated with shorter patient survival, while others suggest the
opposite. Therefore, a meta-analysis is required to integrate and evaluate data
from different studies and datasets, in order to validate which genes are more
likely to be risk genes. Fig. 2 shows a Meta-analysis of different CLDN gene
families. The results showed that CLDN2 and CLDN10 showed HR
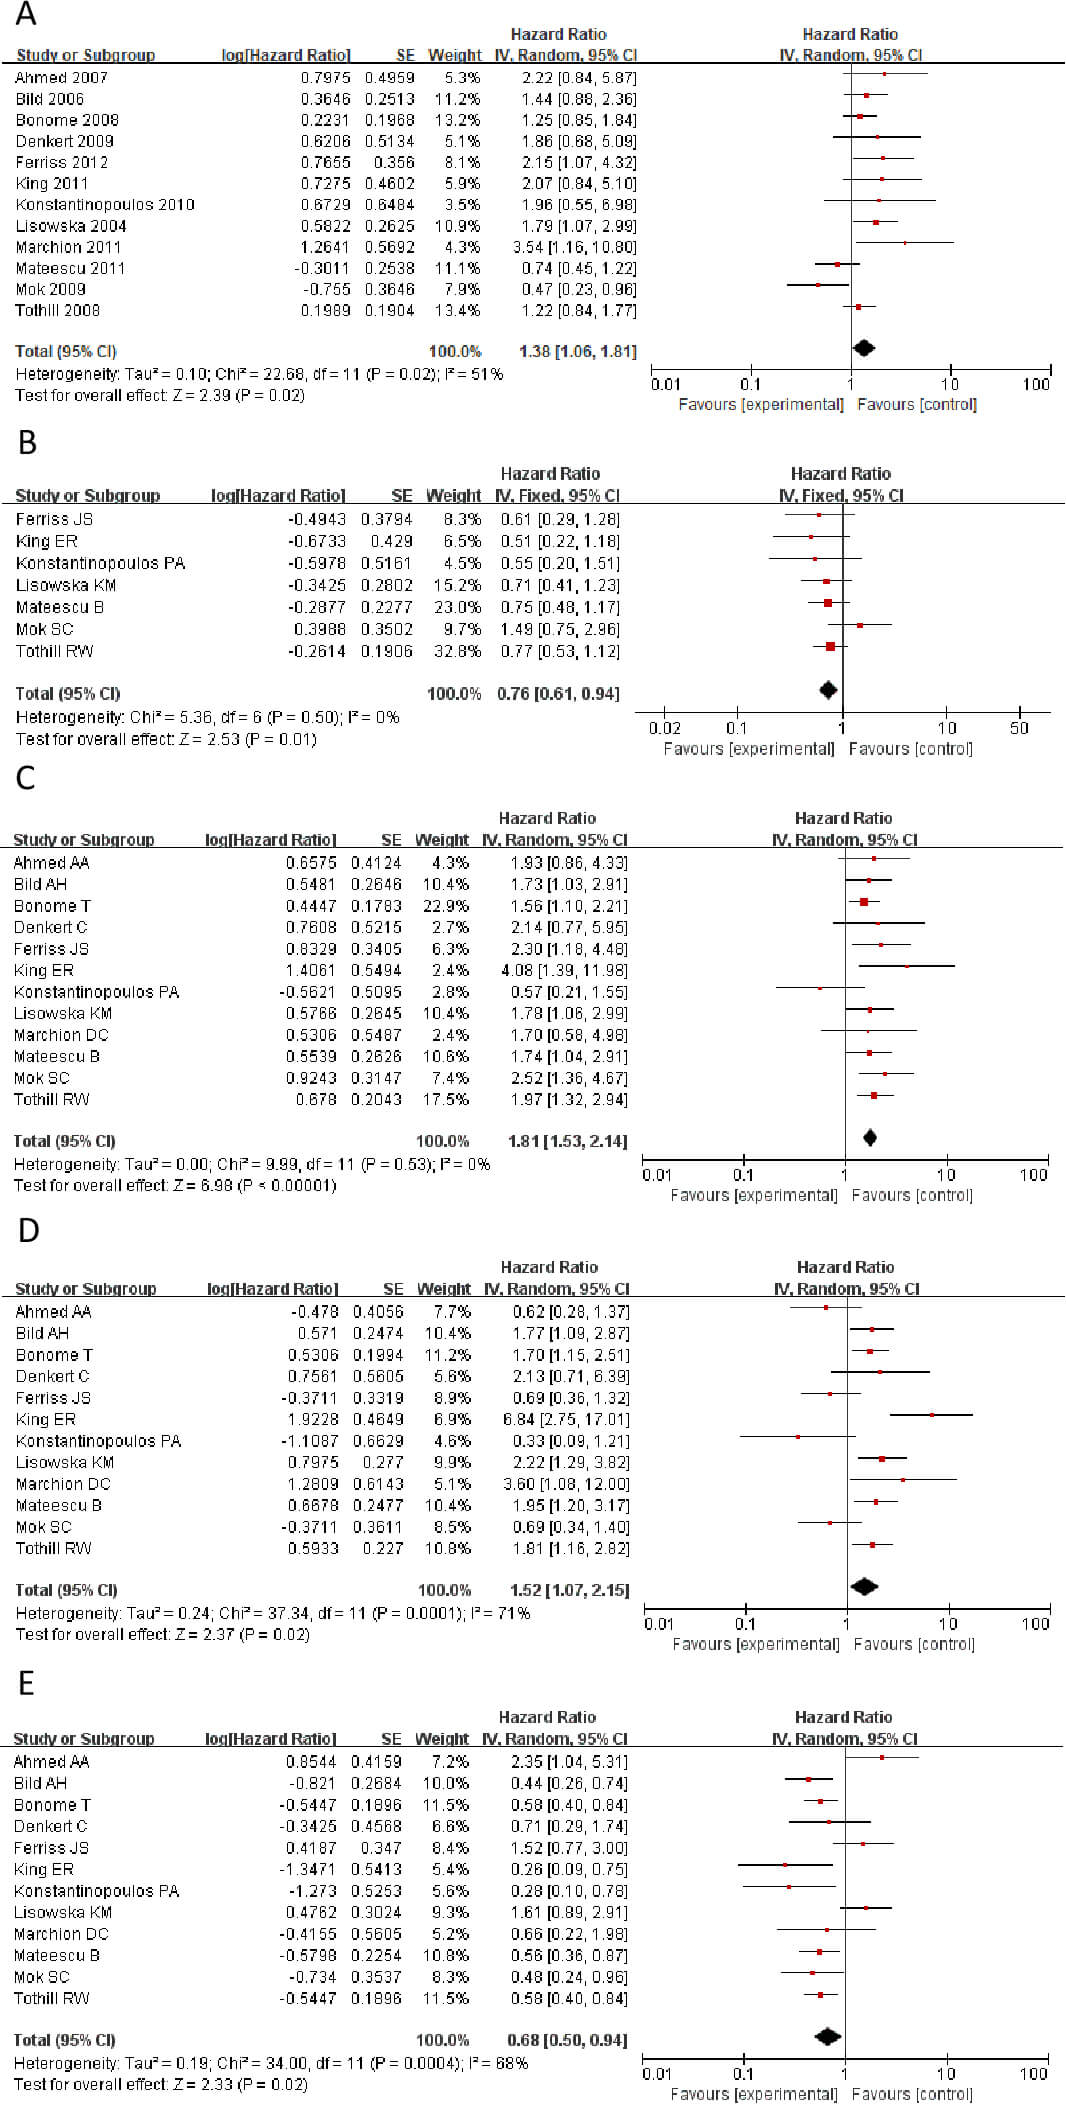 Fig. 2.
Statistically significant hazard ratio (HR) values for CLDN genes. (A) CLDN1. (B) CLDN2. (C) CLDN6. (D) CLDN9. (E) CLDN10. CLDN, Claudins.
We calculated the HR values and p-values of CLDN1, CLDN2, CLDN6, CLDN9, and CLDN10 in different datasets within the GSE database, respectively. Then, Cox regression was employed to analyze the significance of different CLDN genes of HR in OC (Table 2). The results revealed marked contradictions in CLDN2, which was therefore subsequently excluded from further analysis. CLDN6, 9, and 10 demonstrated consistent associations across different study analyses, indicating enhanced reliability of these genes in subsequent investigations.
| CLDN | Datasets | HR | p value |
| CLDN1 | GSE18520 | 0.47 | 0.034 |
| CLDN1 | GSE26712 | 1.25 | 0.25 |
| CLDN2 | GSE18520 | 1.49 | 0.25 |
| CLDN6 | GSE18520 | 2.52 | 0.0025 |
| CLDN6 | GSE26712 | 1.56 | 0.012 |
| CLDN9 | GSE18520 | 0.69 | 0.29 |
| CLDN9 | GSE26712 | 1.70 | 0.0066 |
| CLDN10 | GSE18520 | 0.48 | 0.04 |
| CLDN10 | GSE26712 | 0.58 | 0.0038 |
Through the TCGA and GSE dataset, we analyzed the differential expression of
CLDN family genes in tumor and normal tissues, identified significantly highly
expressed genes, and calculated the odds ratios (OR) of CLDN genes with
statistical significance. Additionally, we collected literature and performed a
meta-analysis to assess the heterogeneity of HR for the CLDN family across
different studies, identifying CLDN family genes with pooled HR values greater
than 1 or less than 1. Furthermore, using the GSE dataset, we conducted Cox
regression analysis to further examine CLDN family genes with HR values greater
than 1 or less than 1 and significant associations (p
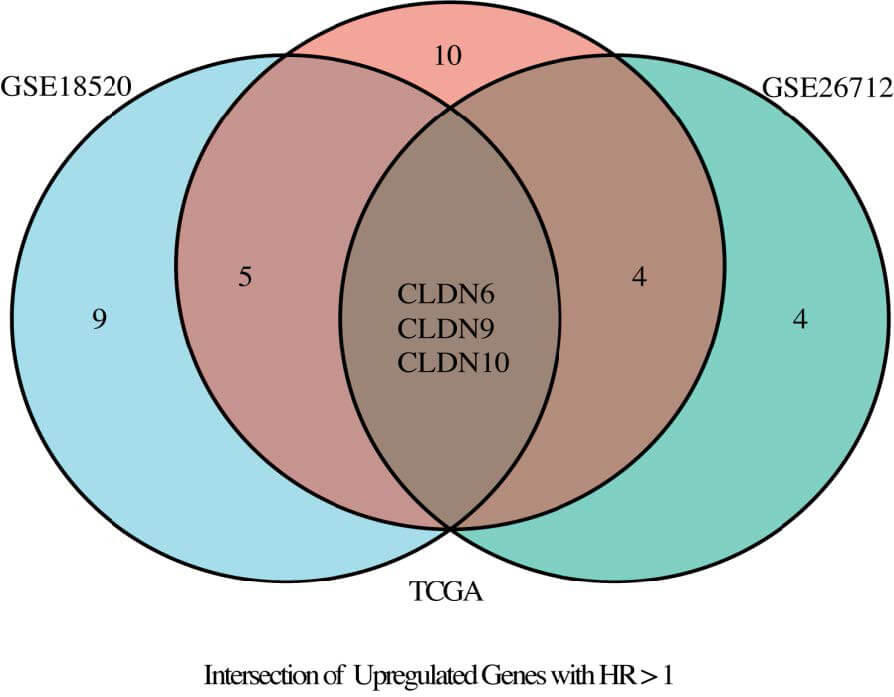 Fig. 3.
Venn diagram illustrating the intersection of TCGA, GSE18520, and GSE26712 datasets.
In the diagnosis of ovarian cancer, there are four classic serum biomarkers:
CA125, HE4, CEA, and AFP. This study plans to compare three CLDN family genes
screened from public datasets with these classic serum biomarkers. The expression
data of the three CLDN genes will be integrated to form a composite diagnostic
and prognostic indicator for comparison and analysis. To prioritize candidate
biomarkers, we implemented a three-dimensional screening strategy integrating
odds ratio (OR), hazard ratio (HR), meta-analysis and area under the curve (AUC)
values. We have established the following criteria for selecting the CLDN family
genes: (1) OR
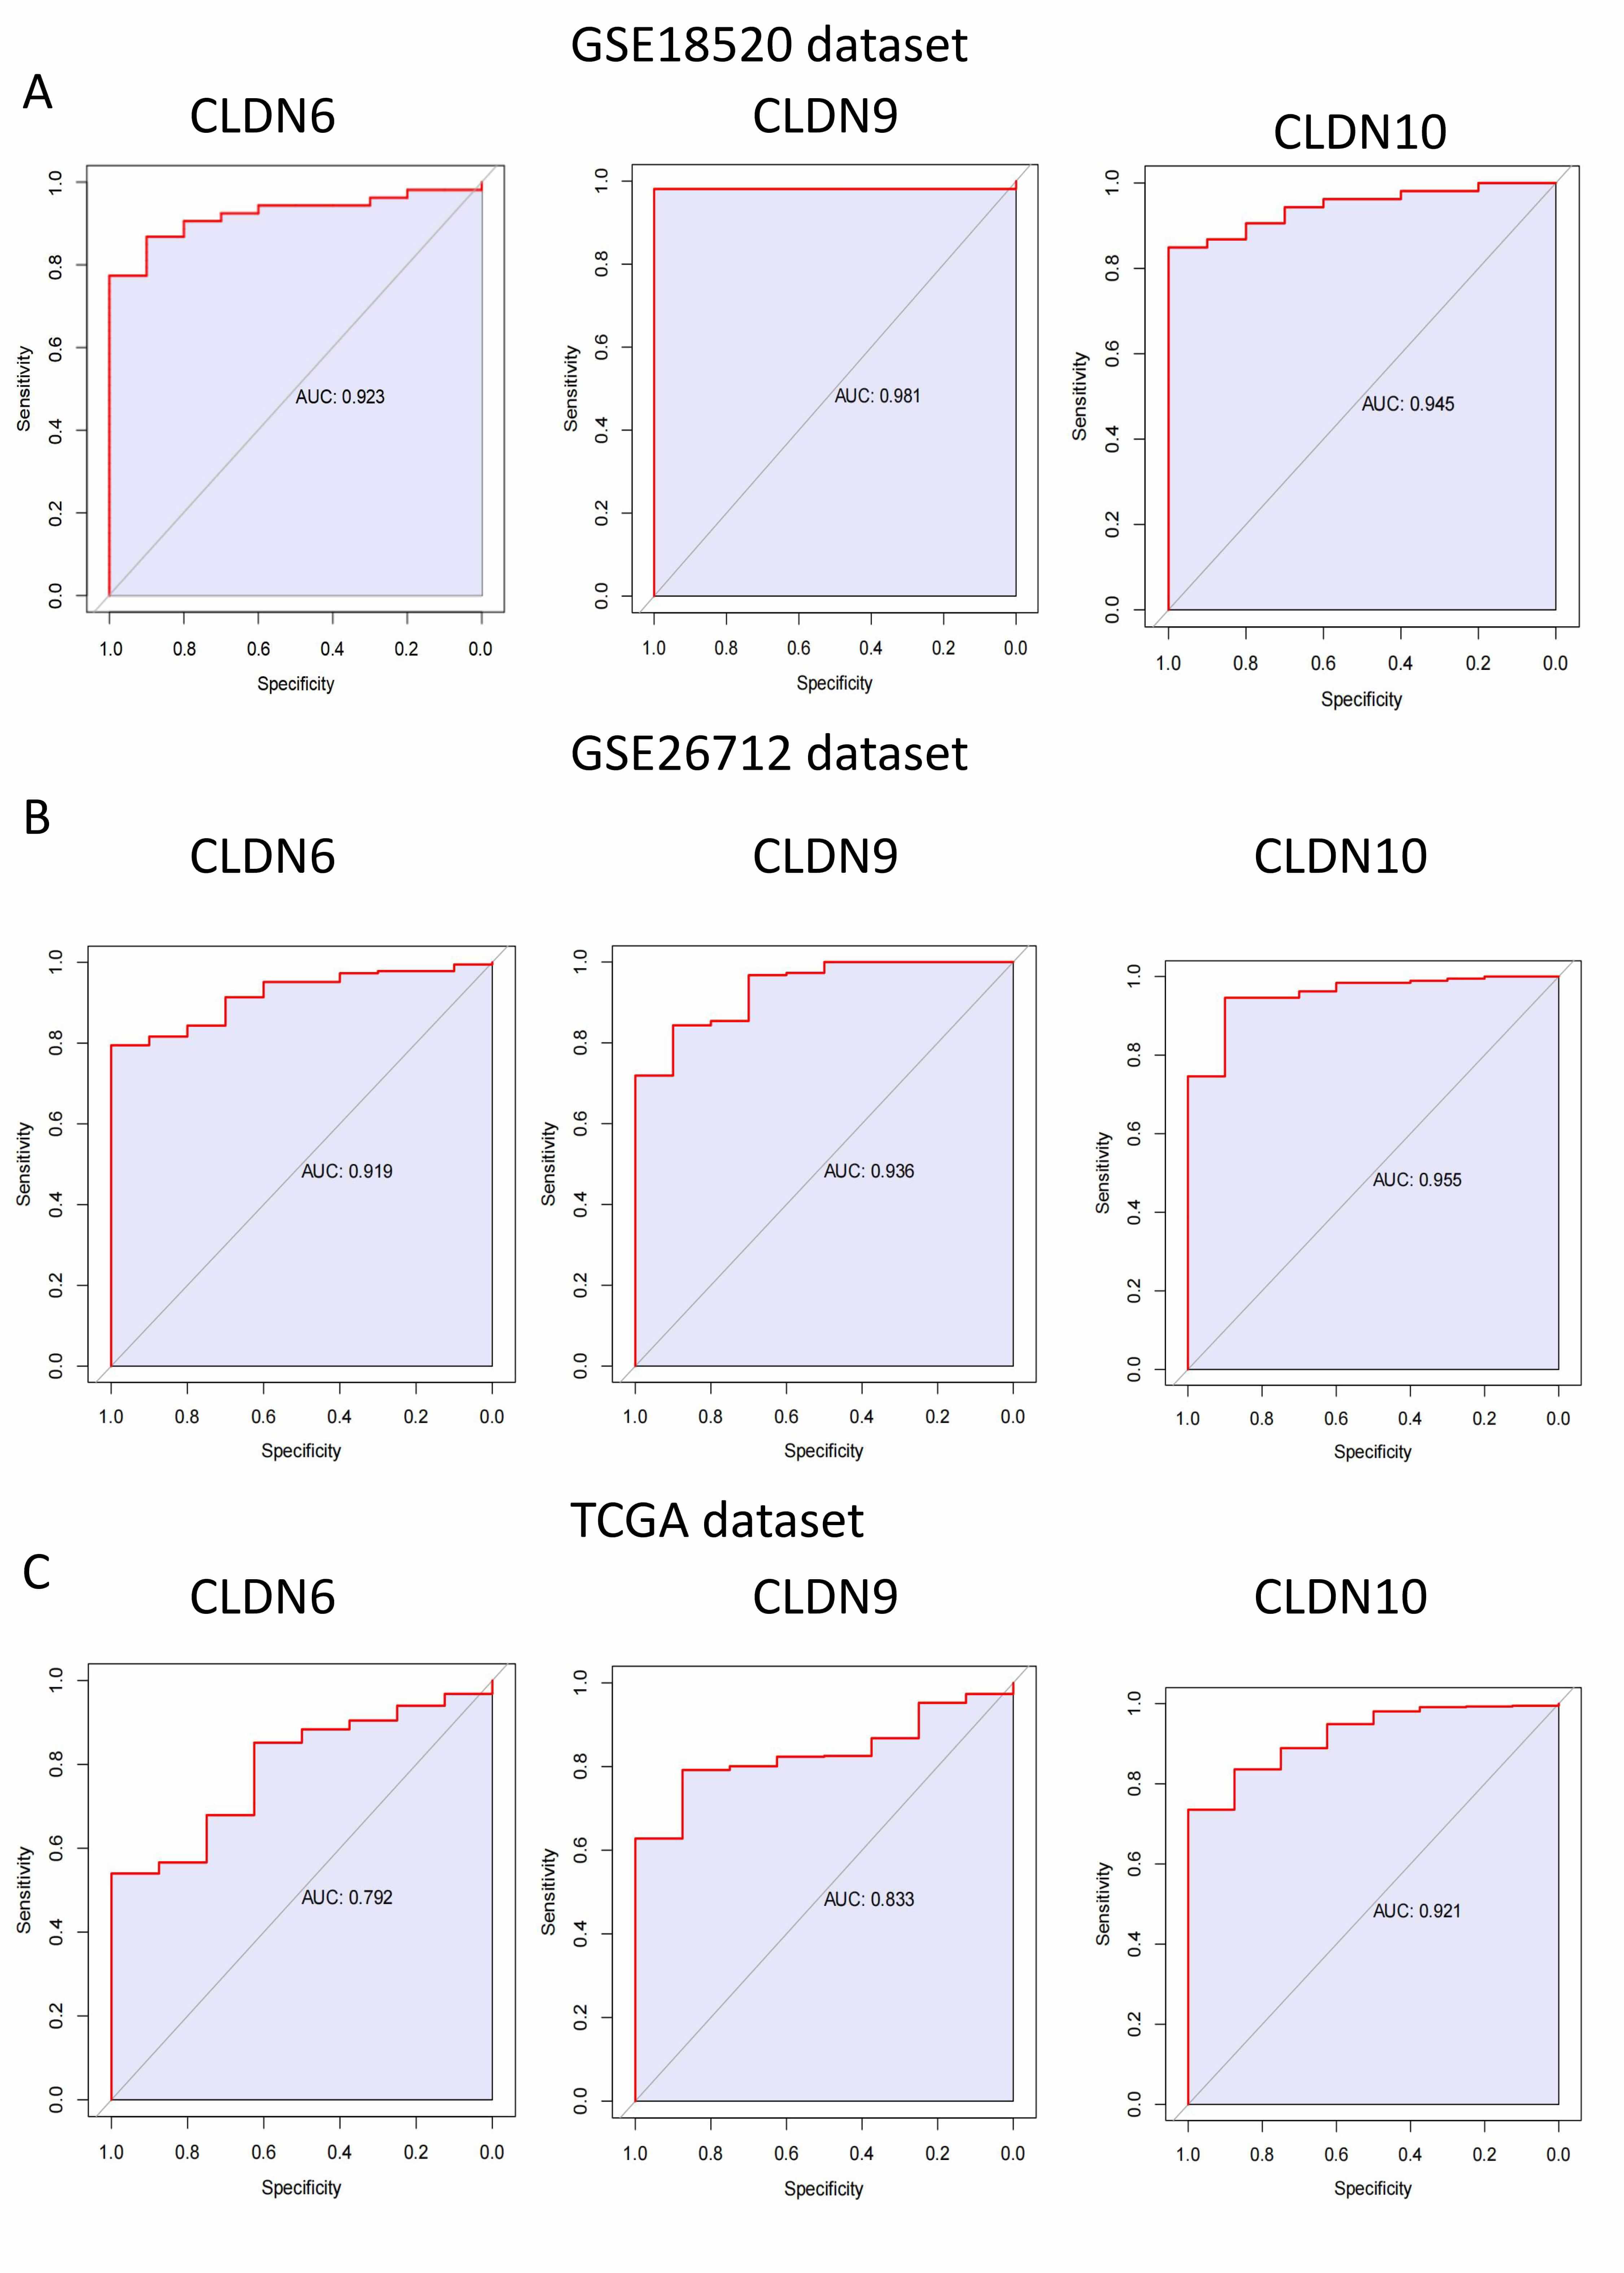
First, we performed ROC curve analysis for CLDN6, 9, and 10 in different
datasets separately, and the results showed that their AUC
 Fig. 4.
The area greater than 0.7 under ROC curve of CLDN family in GSE18520, GSE26712 and TCGA dataset. (A) GSE18520 dataset. (B) GSE26712 dataset. (C) TCGA dataset. ROC, receiver operating characteristic.
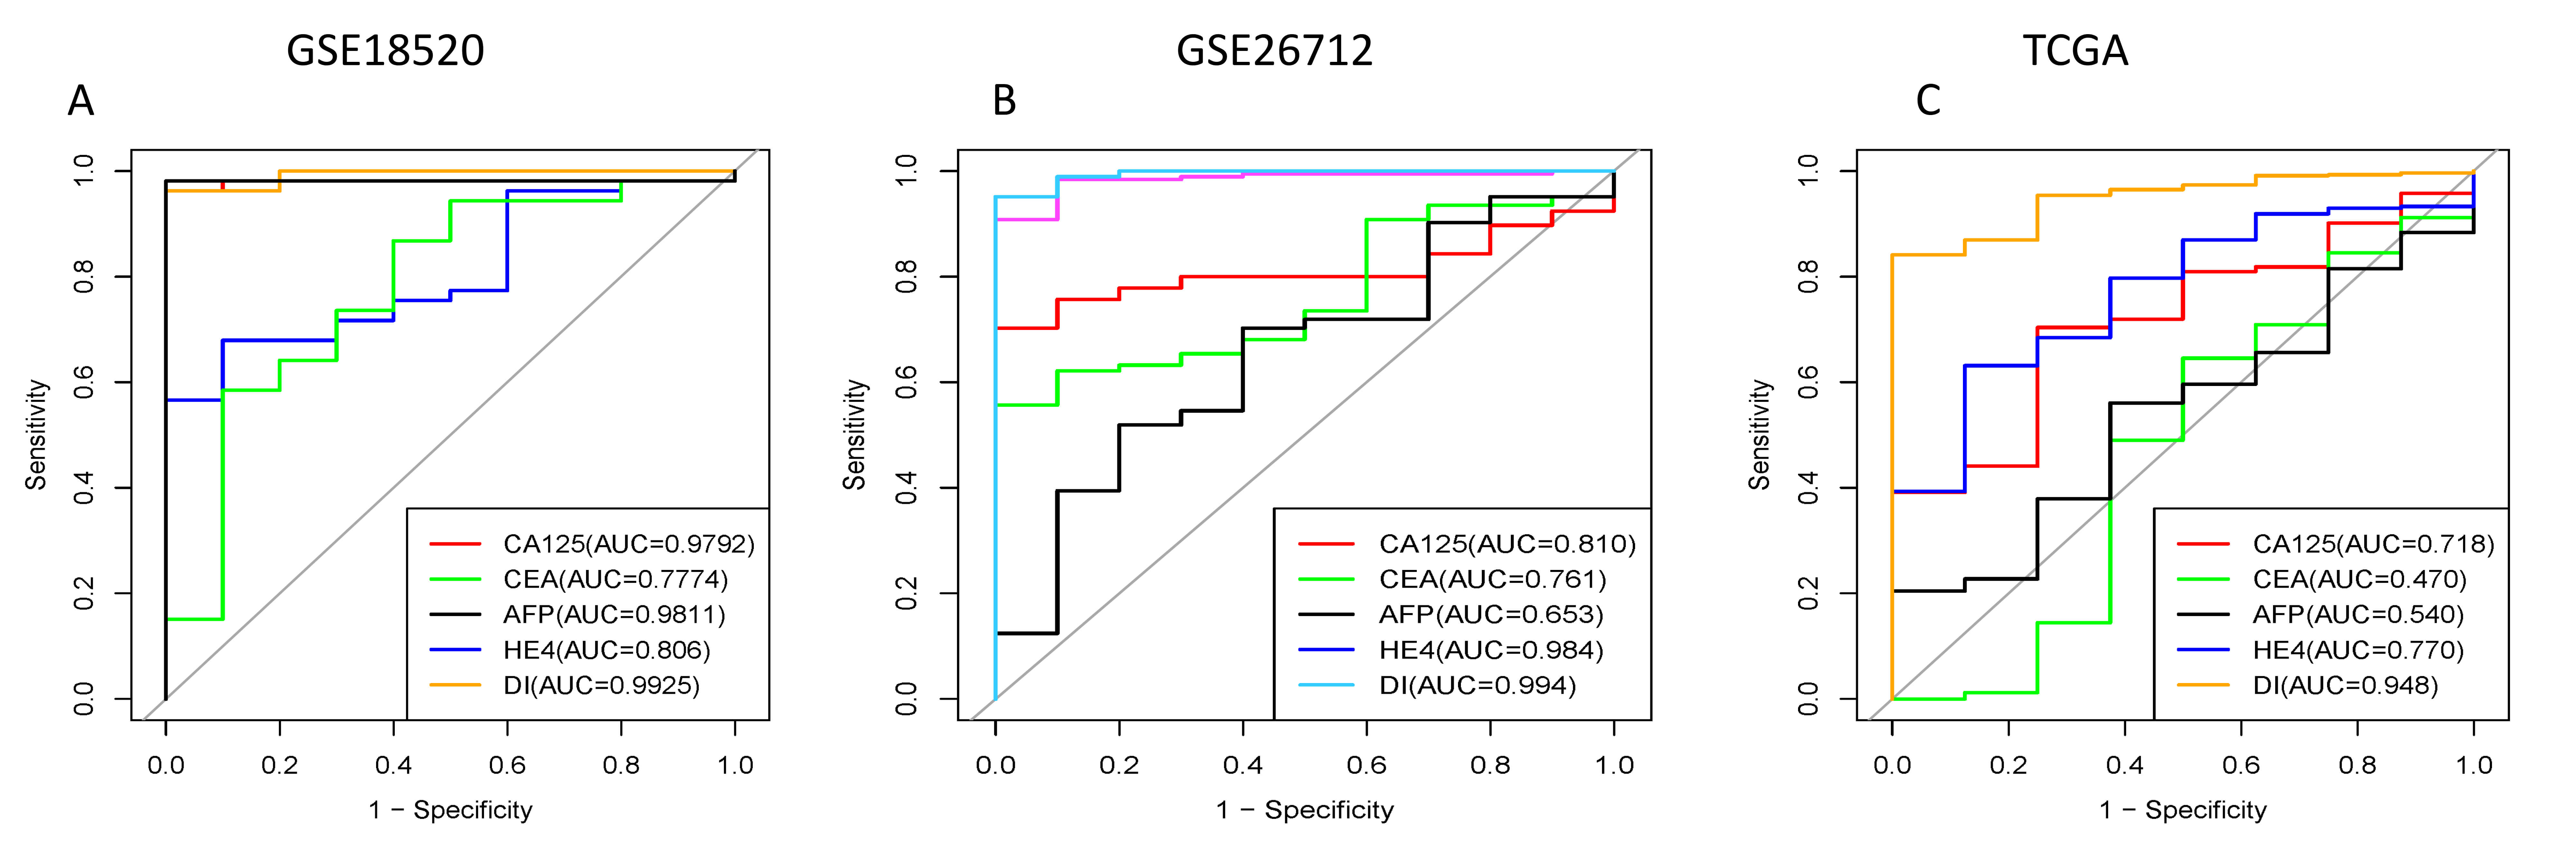
diagnosis index (DI) =
In this formula,
 Fig. 5.
The areas under ROC curves of our three combined genes and existing gynecological tumor markers in GEO database and TCGA. CA125, CEA, AFP, HE4 are currently available gynecological tumor markers. DI represents a combination of CLDN genes. (A) GSE18520 dataset. (B) GSE26712 dataset. (C) TCGA dataset. GEO, Gene Expression Omnibus; CA125, carbohydrate antigen 125; CEA, carcinoembryonic antigen; AFP, alpha-fetoprotein; HE4, human epididymis 4; DI, diagnosis Index.
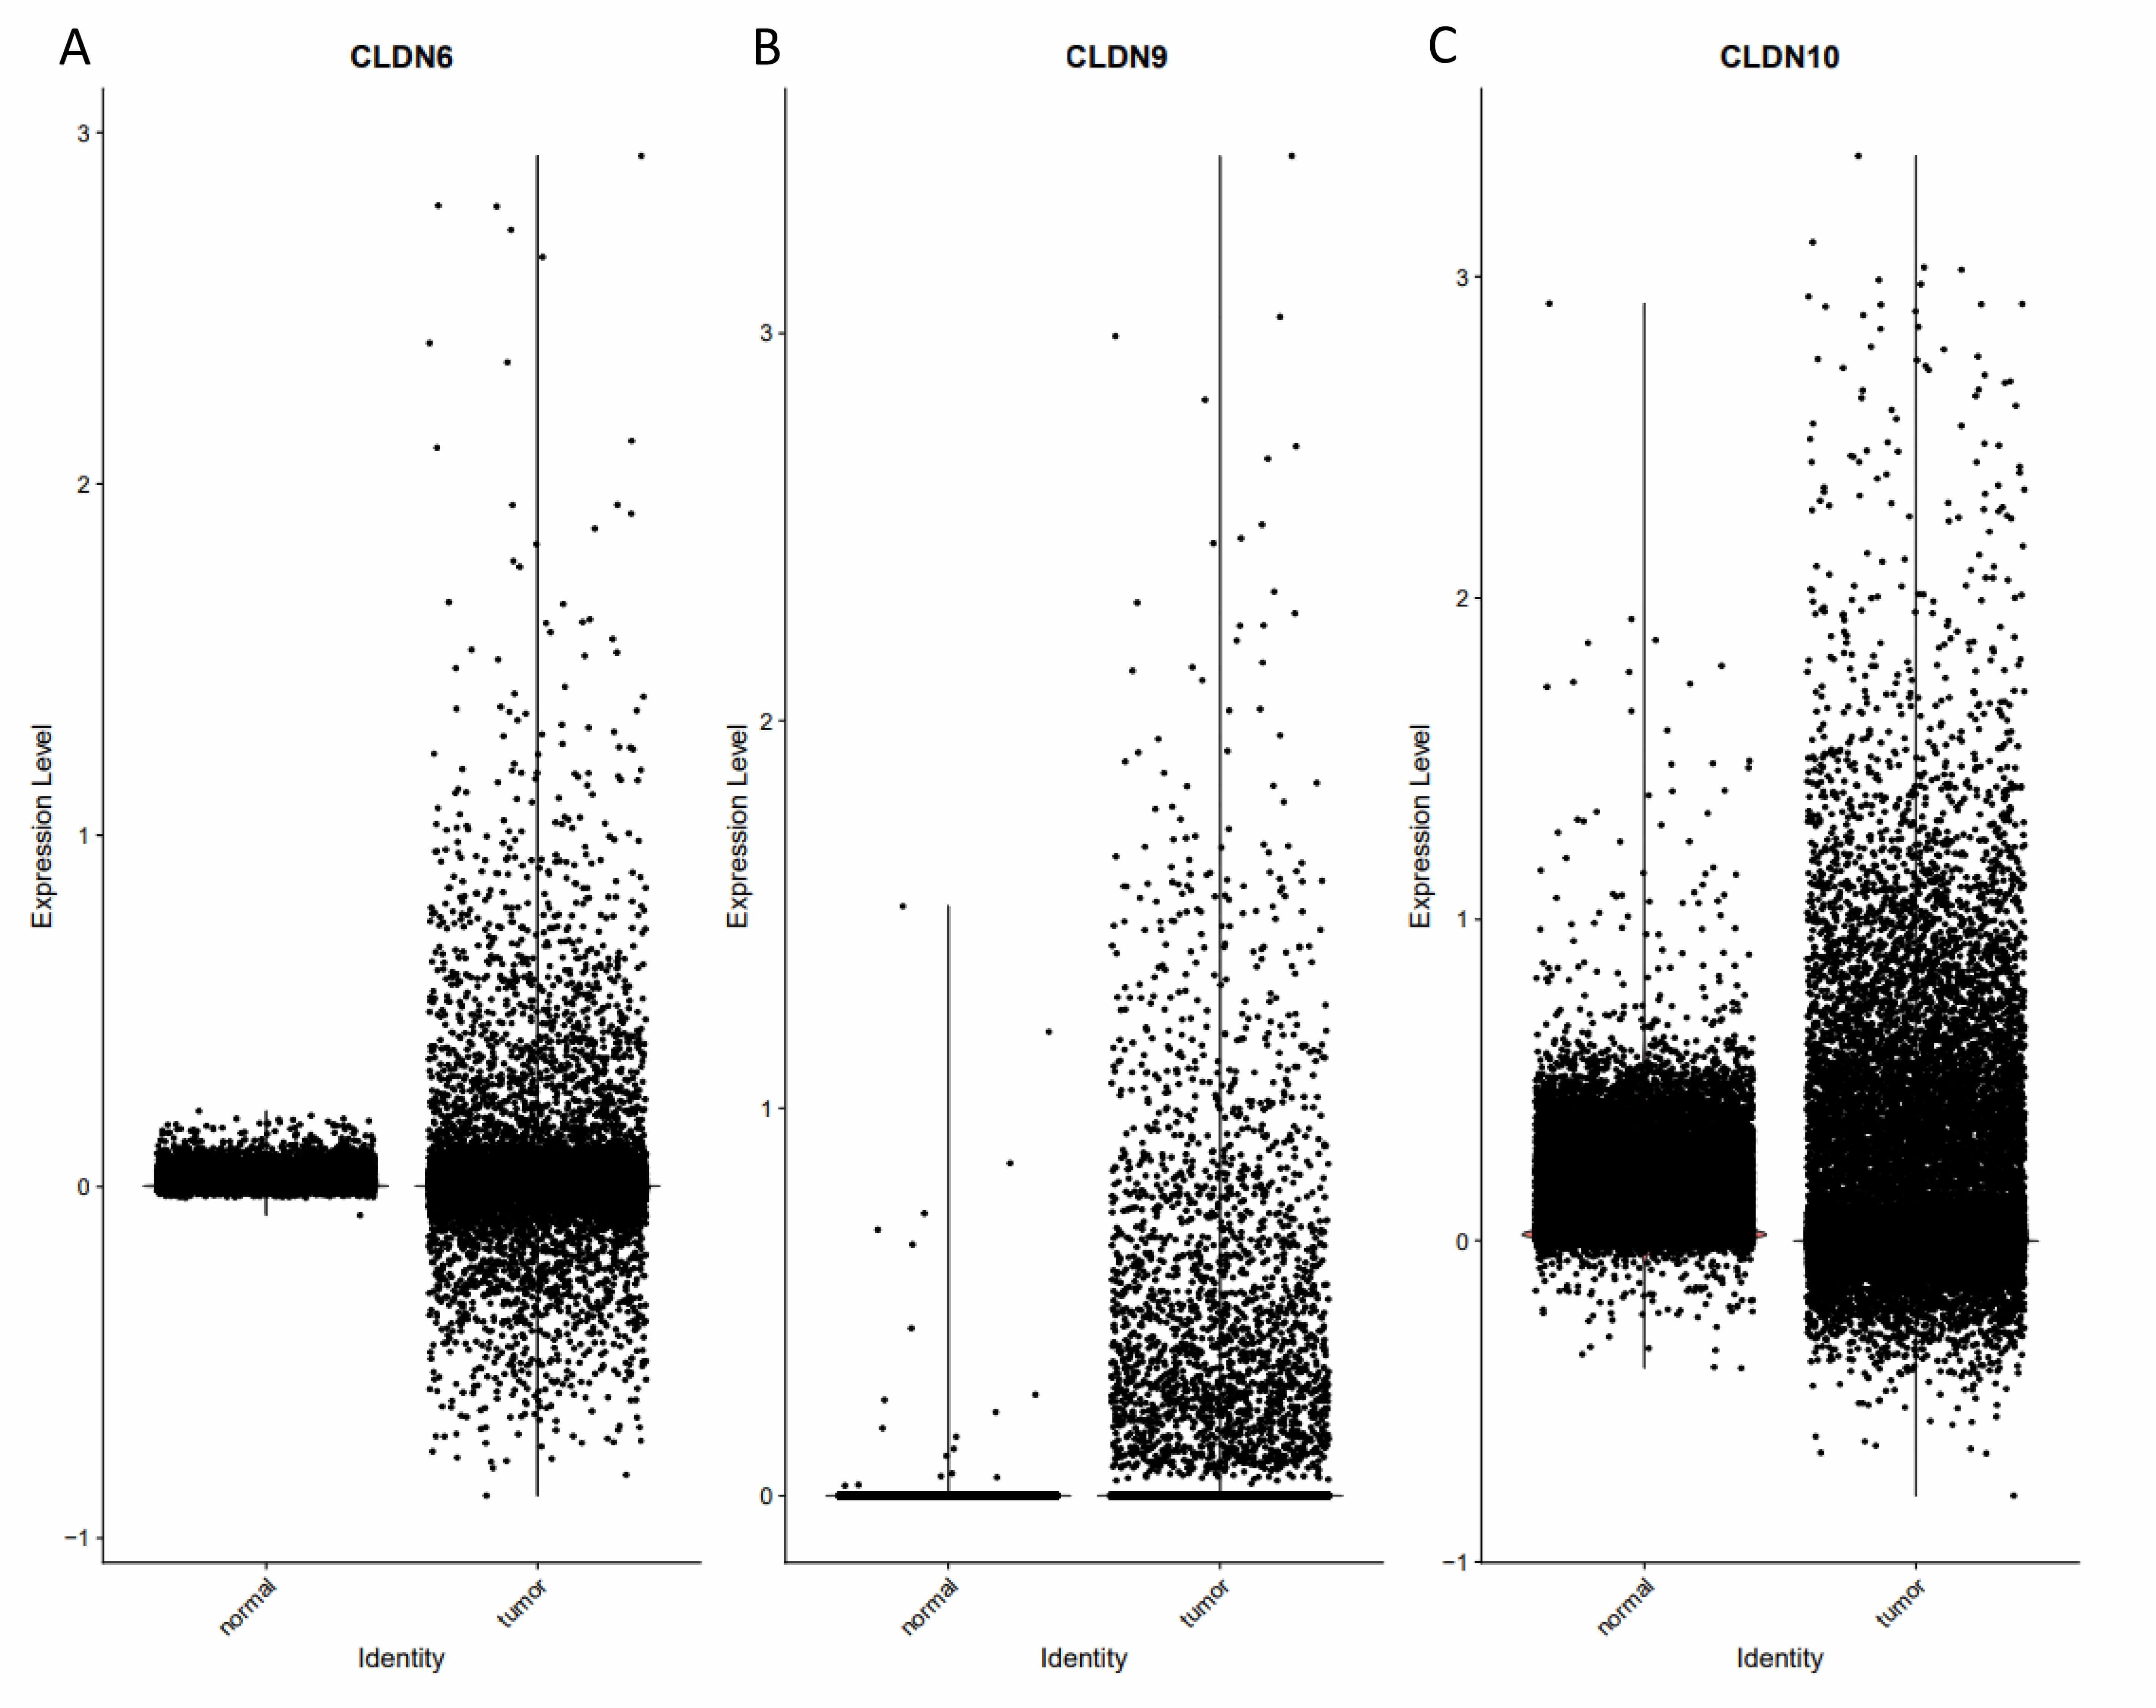
Single-cell sequencing reveals cell type-specific mechanisms. Spatial expression
localization: CLDN6/9/10 are highly expressed in the malignant epithelial cell
subpopulation and are highly co-localized with the tumor core region (Fig. 6).
Inter-cellular ligand-receptor analysis shows that CLDN6/9 activate the
Wnt/
 Fig. 6.
The function and expression of Claudin proteins were validated at the single-cell level. (A) The expression of CLDN6 differs between normal tissues and tumors. (B) The expression of CLDN9 differs between normal tissues and tumors. (C) The expression of CLDN10 differs between normal tissues and tumors.
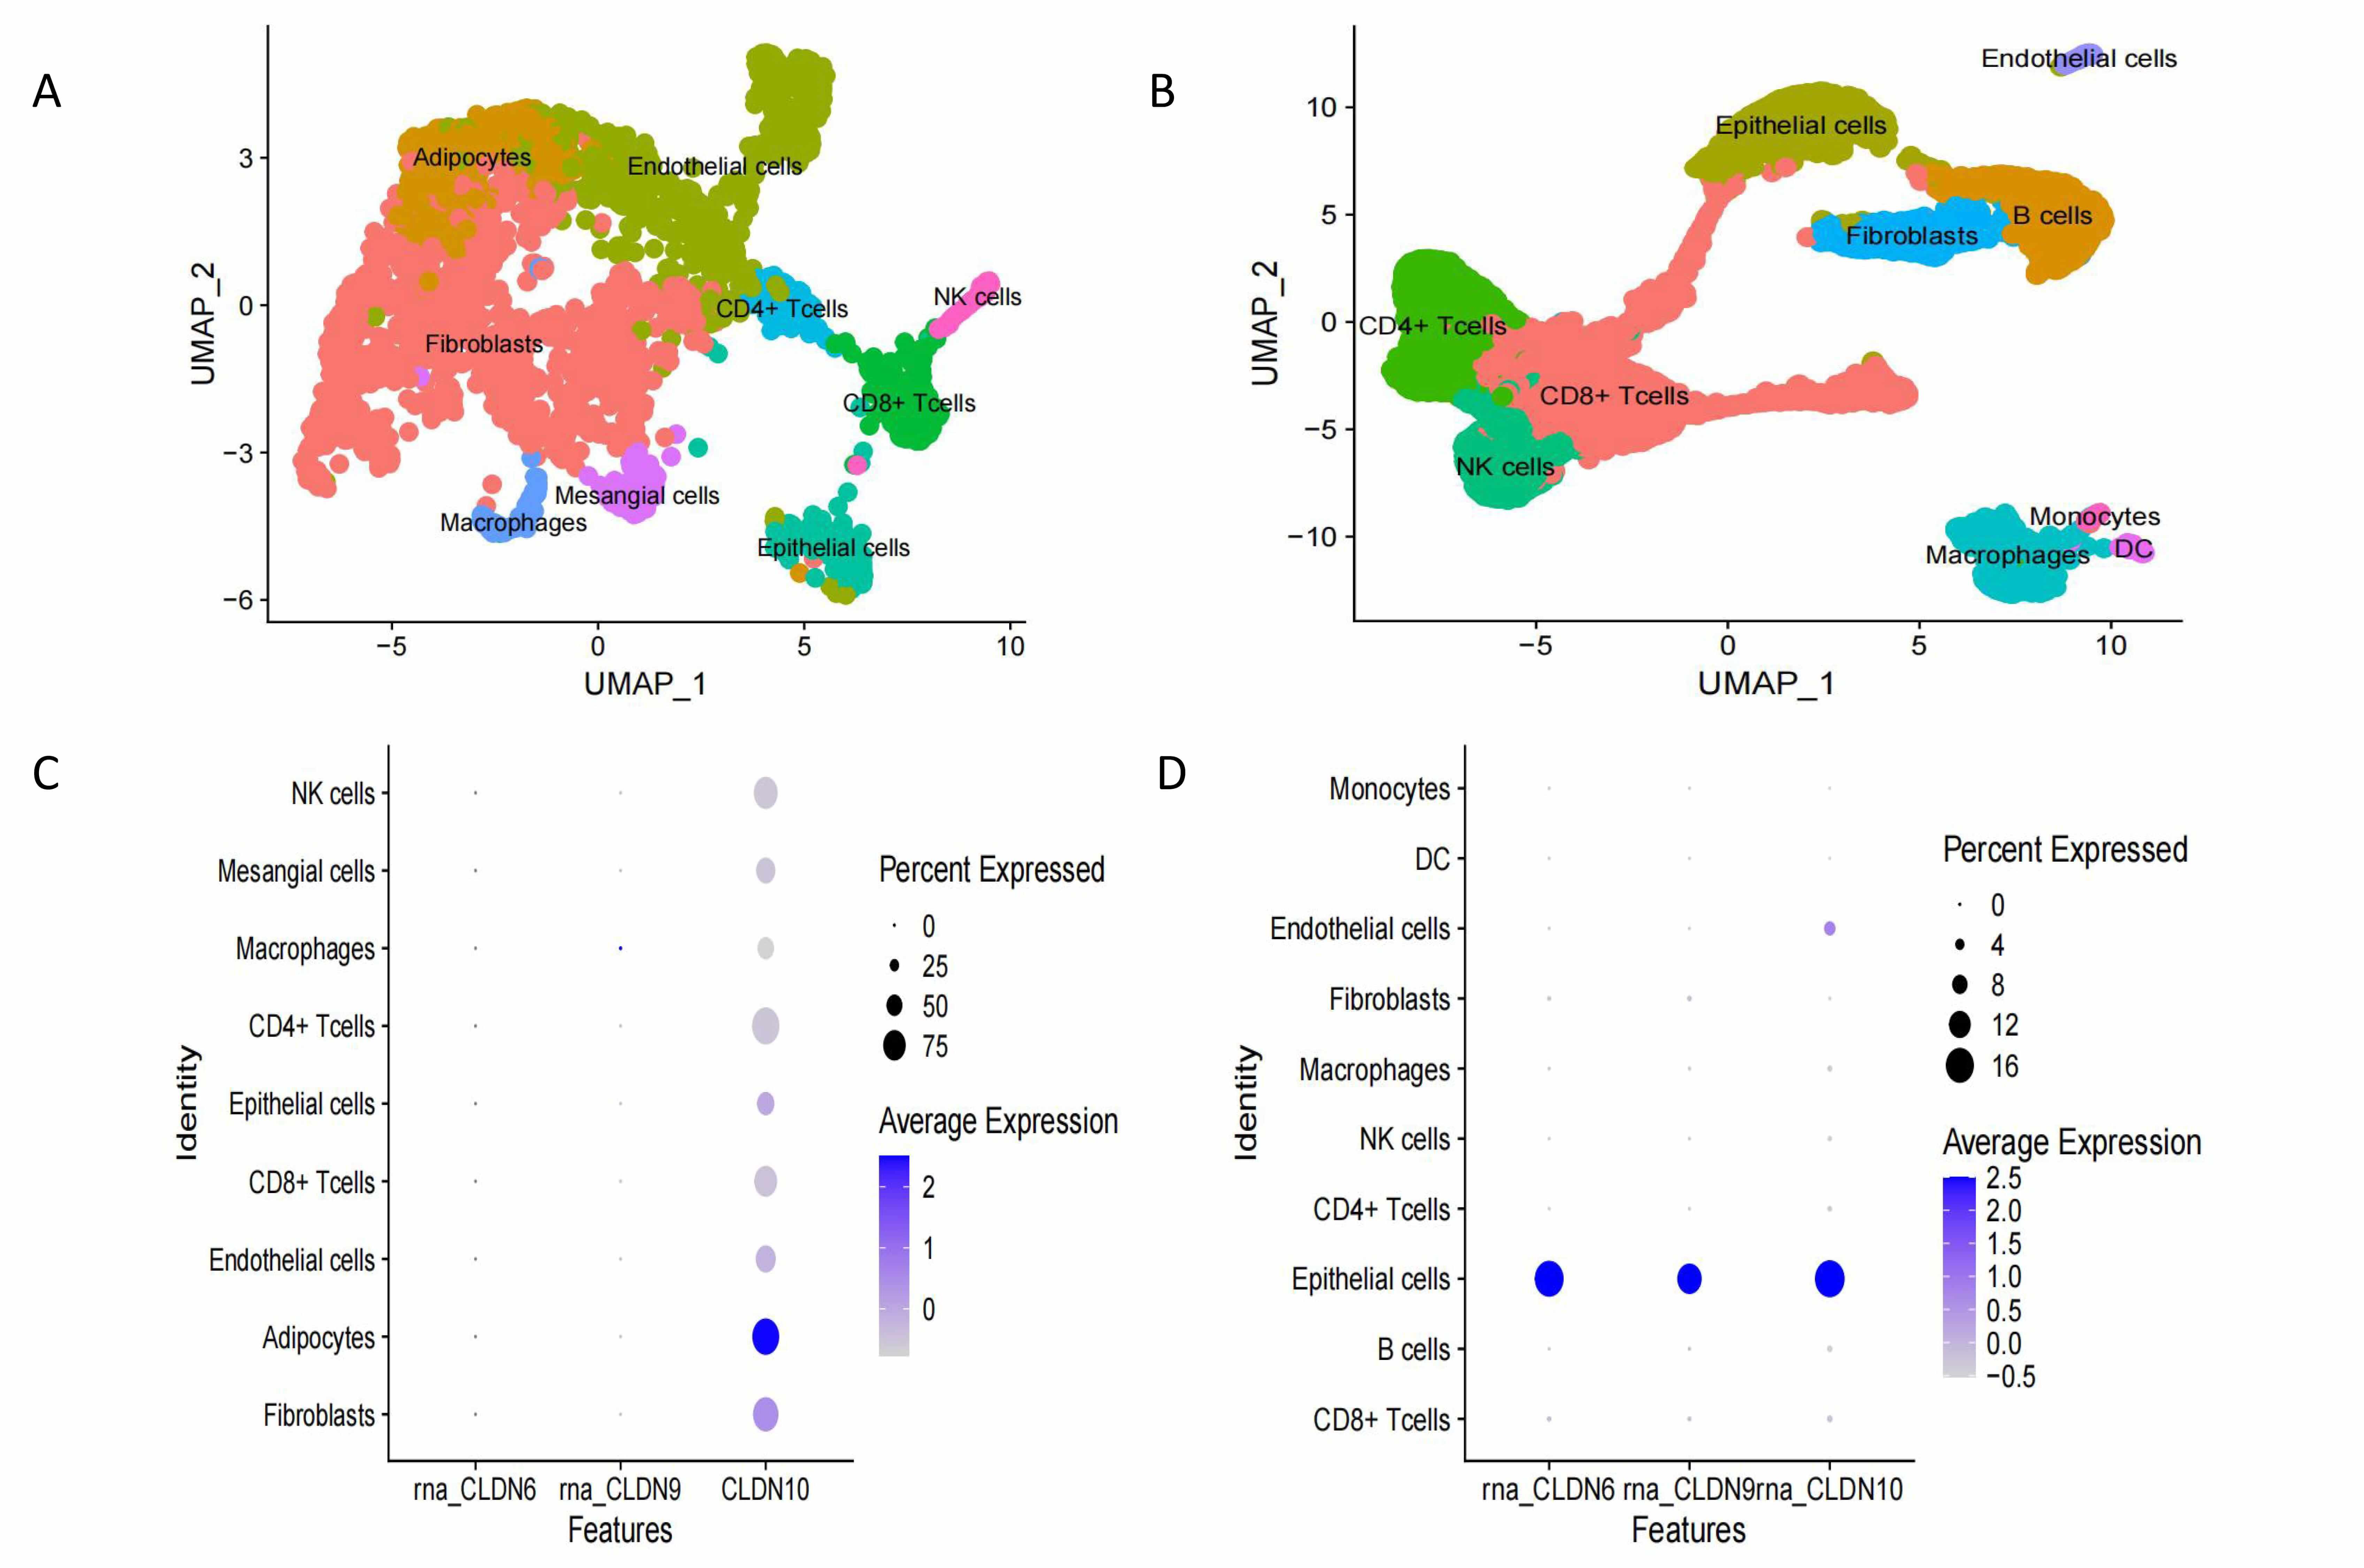 Fig. 7.
Expression levels of CLDN6, CLDN9 and CLDN10 in different cells in normal and tumor tissues. (A) UMAP visualizes the composition in normal ovarian tissue. (B) UMAP visualizes the composition in ovarian tumor tissue. (C) The expression of Claudin proteins in normal cells. (D) The expression of Claudin proteins in ovarian cancer cells. UMAP, Uniform Manifold Approximation and Projection.
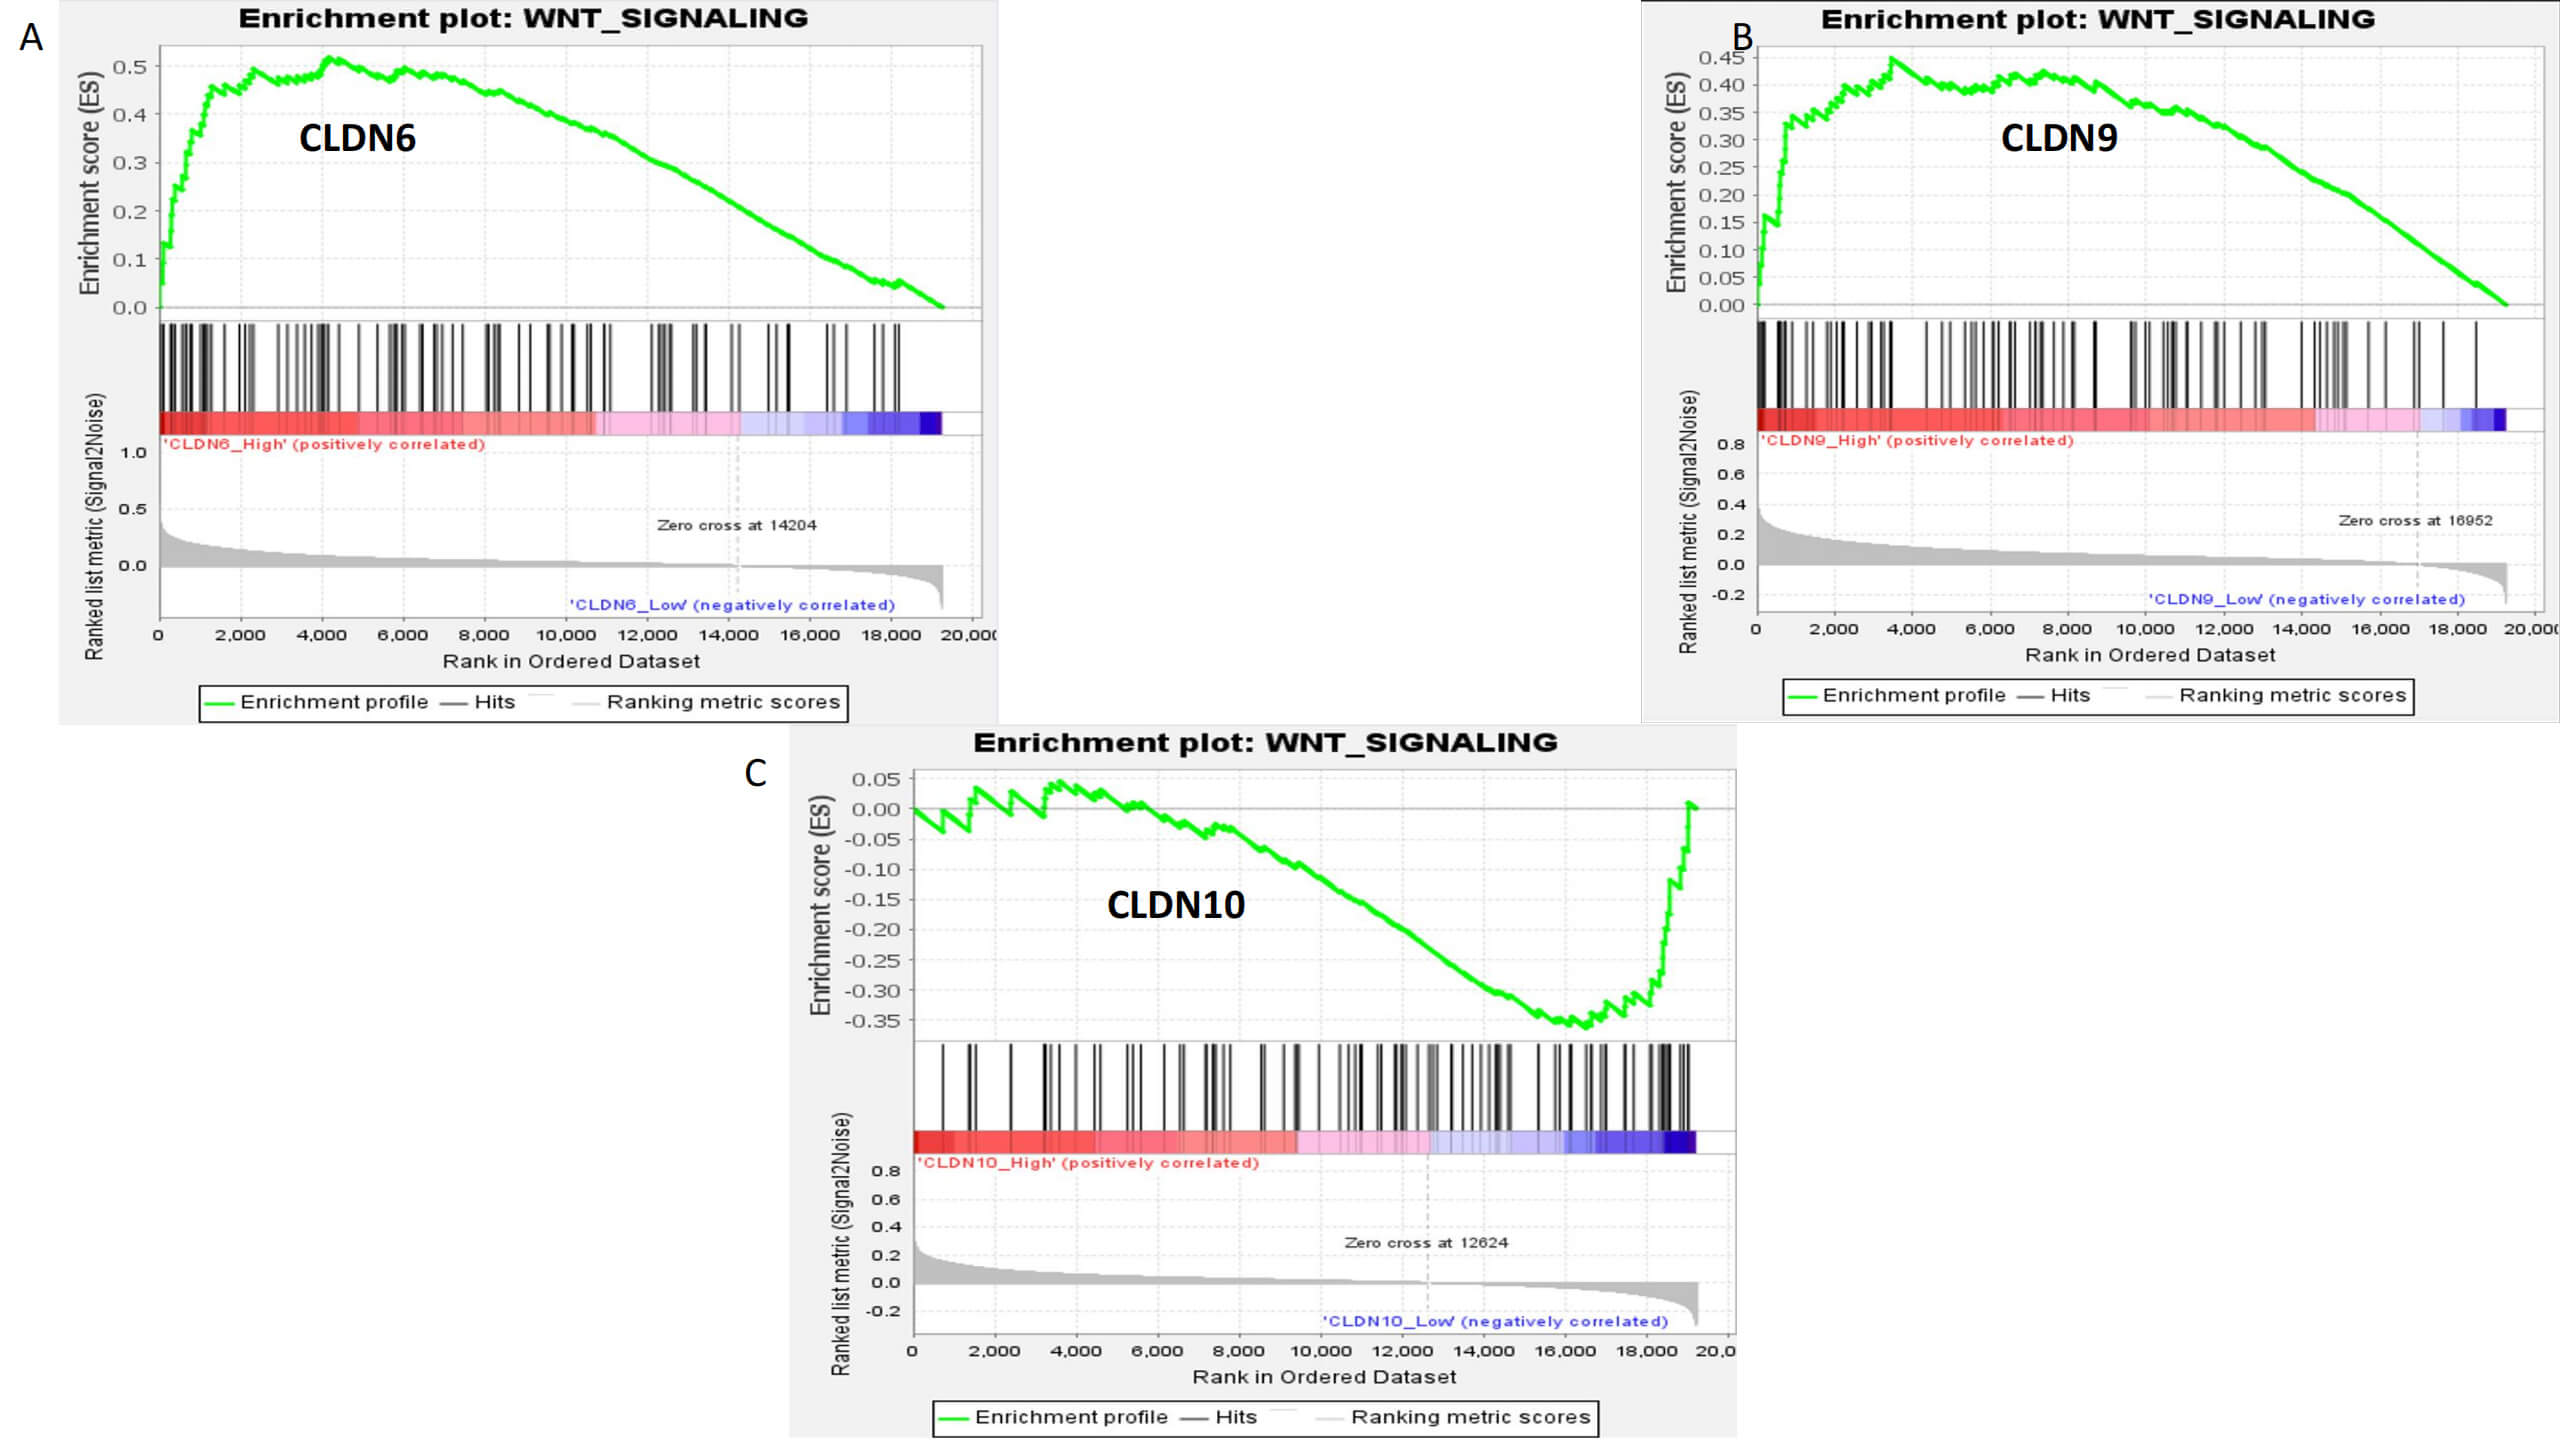 Fig. 8.
Gene Set Enrichment Analysis (GSEA) enrichment analysis of CLDN6, CLDN9, and CLDN10. (A) CLDN6. (B) CLDN9. (C) CLDN10.
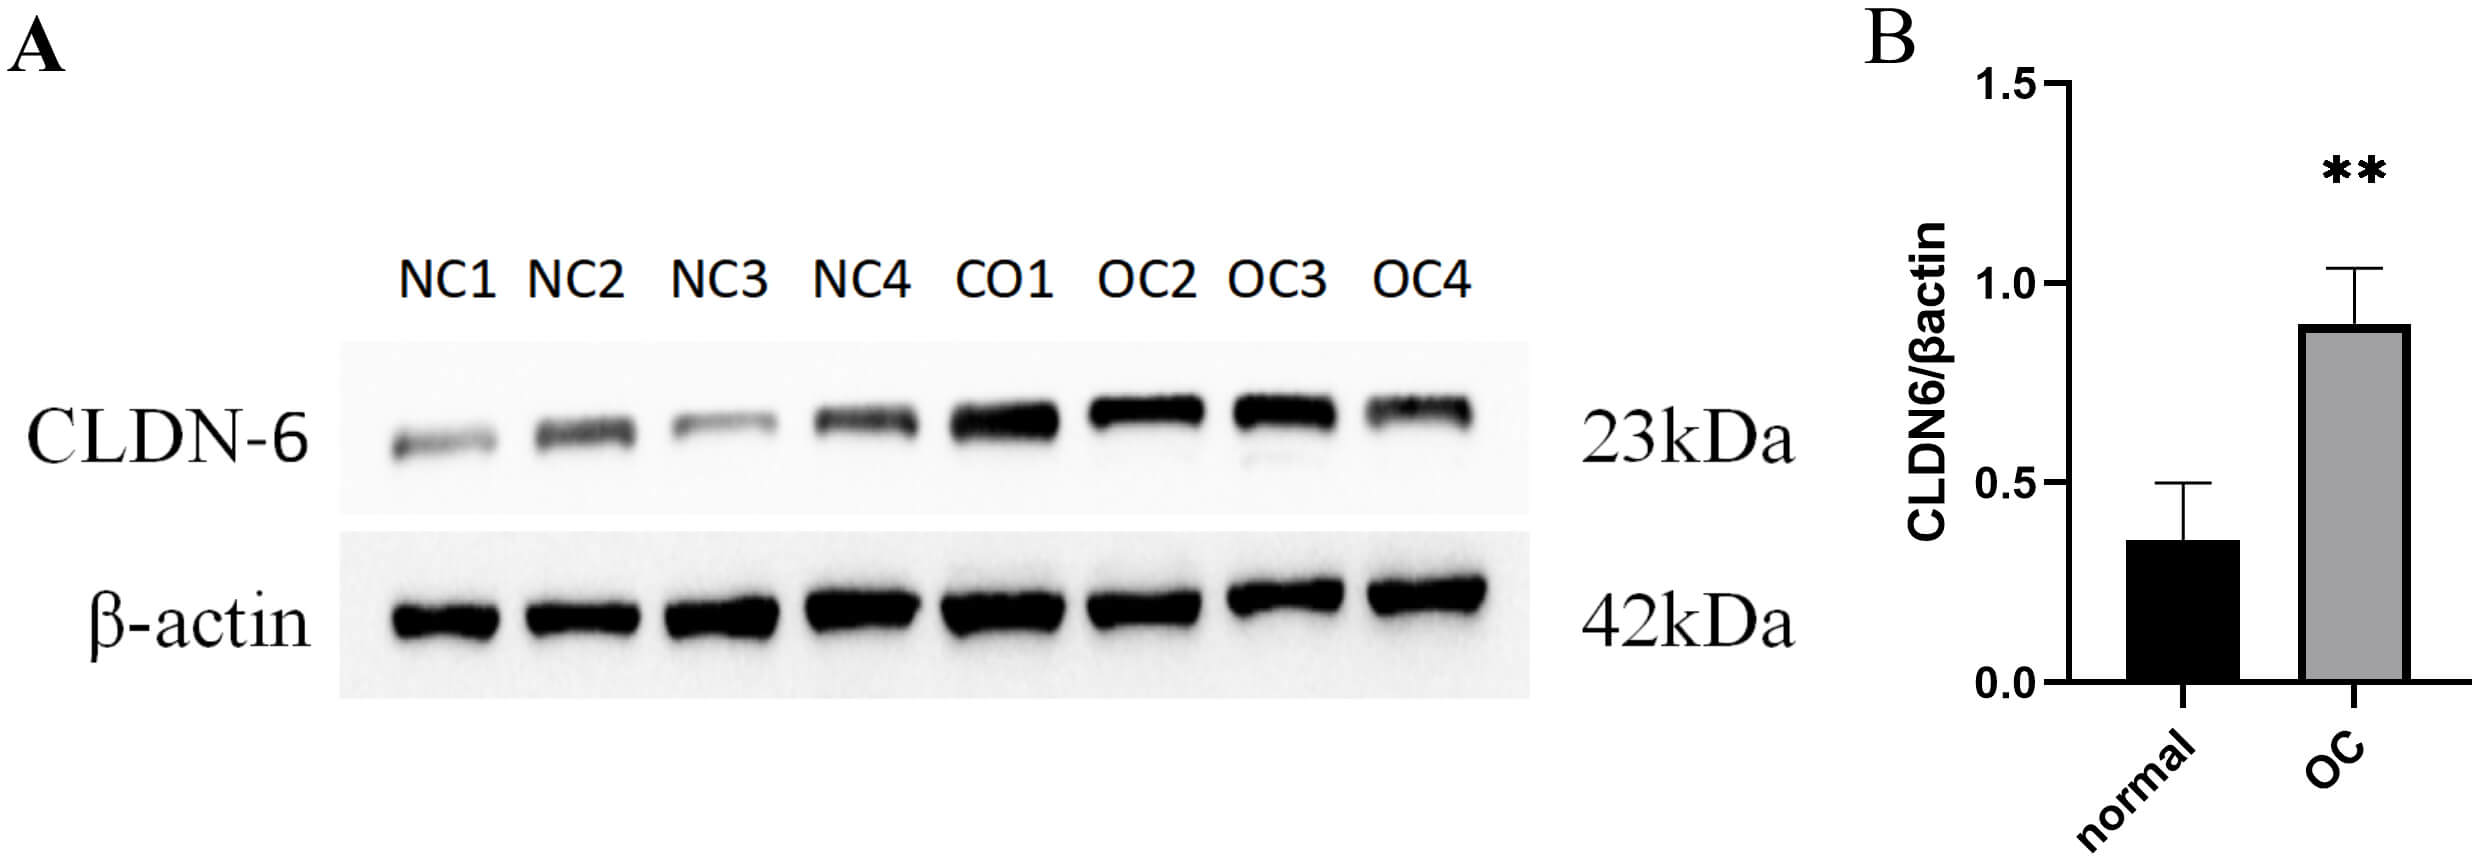
IHC and PCR results confirmed unanimously: The expression levels of CLDN6, CLDN10 proteins and their mRNAs in ovarian cancer tissues were significantly higher than those in normal tissues (Fig. 9). Western Blot results showed that ovarian cancer tissues had a higher CLDN6 expression in comparison to normal tissues (Fig. 10).
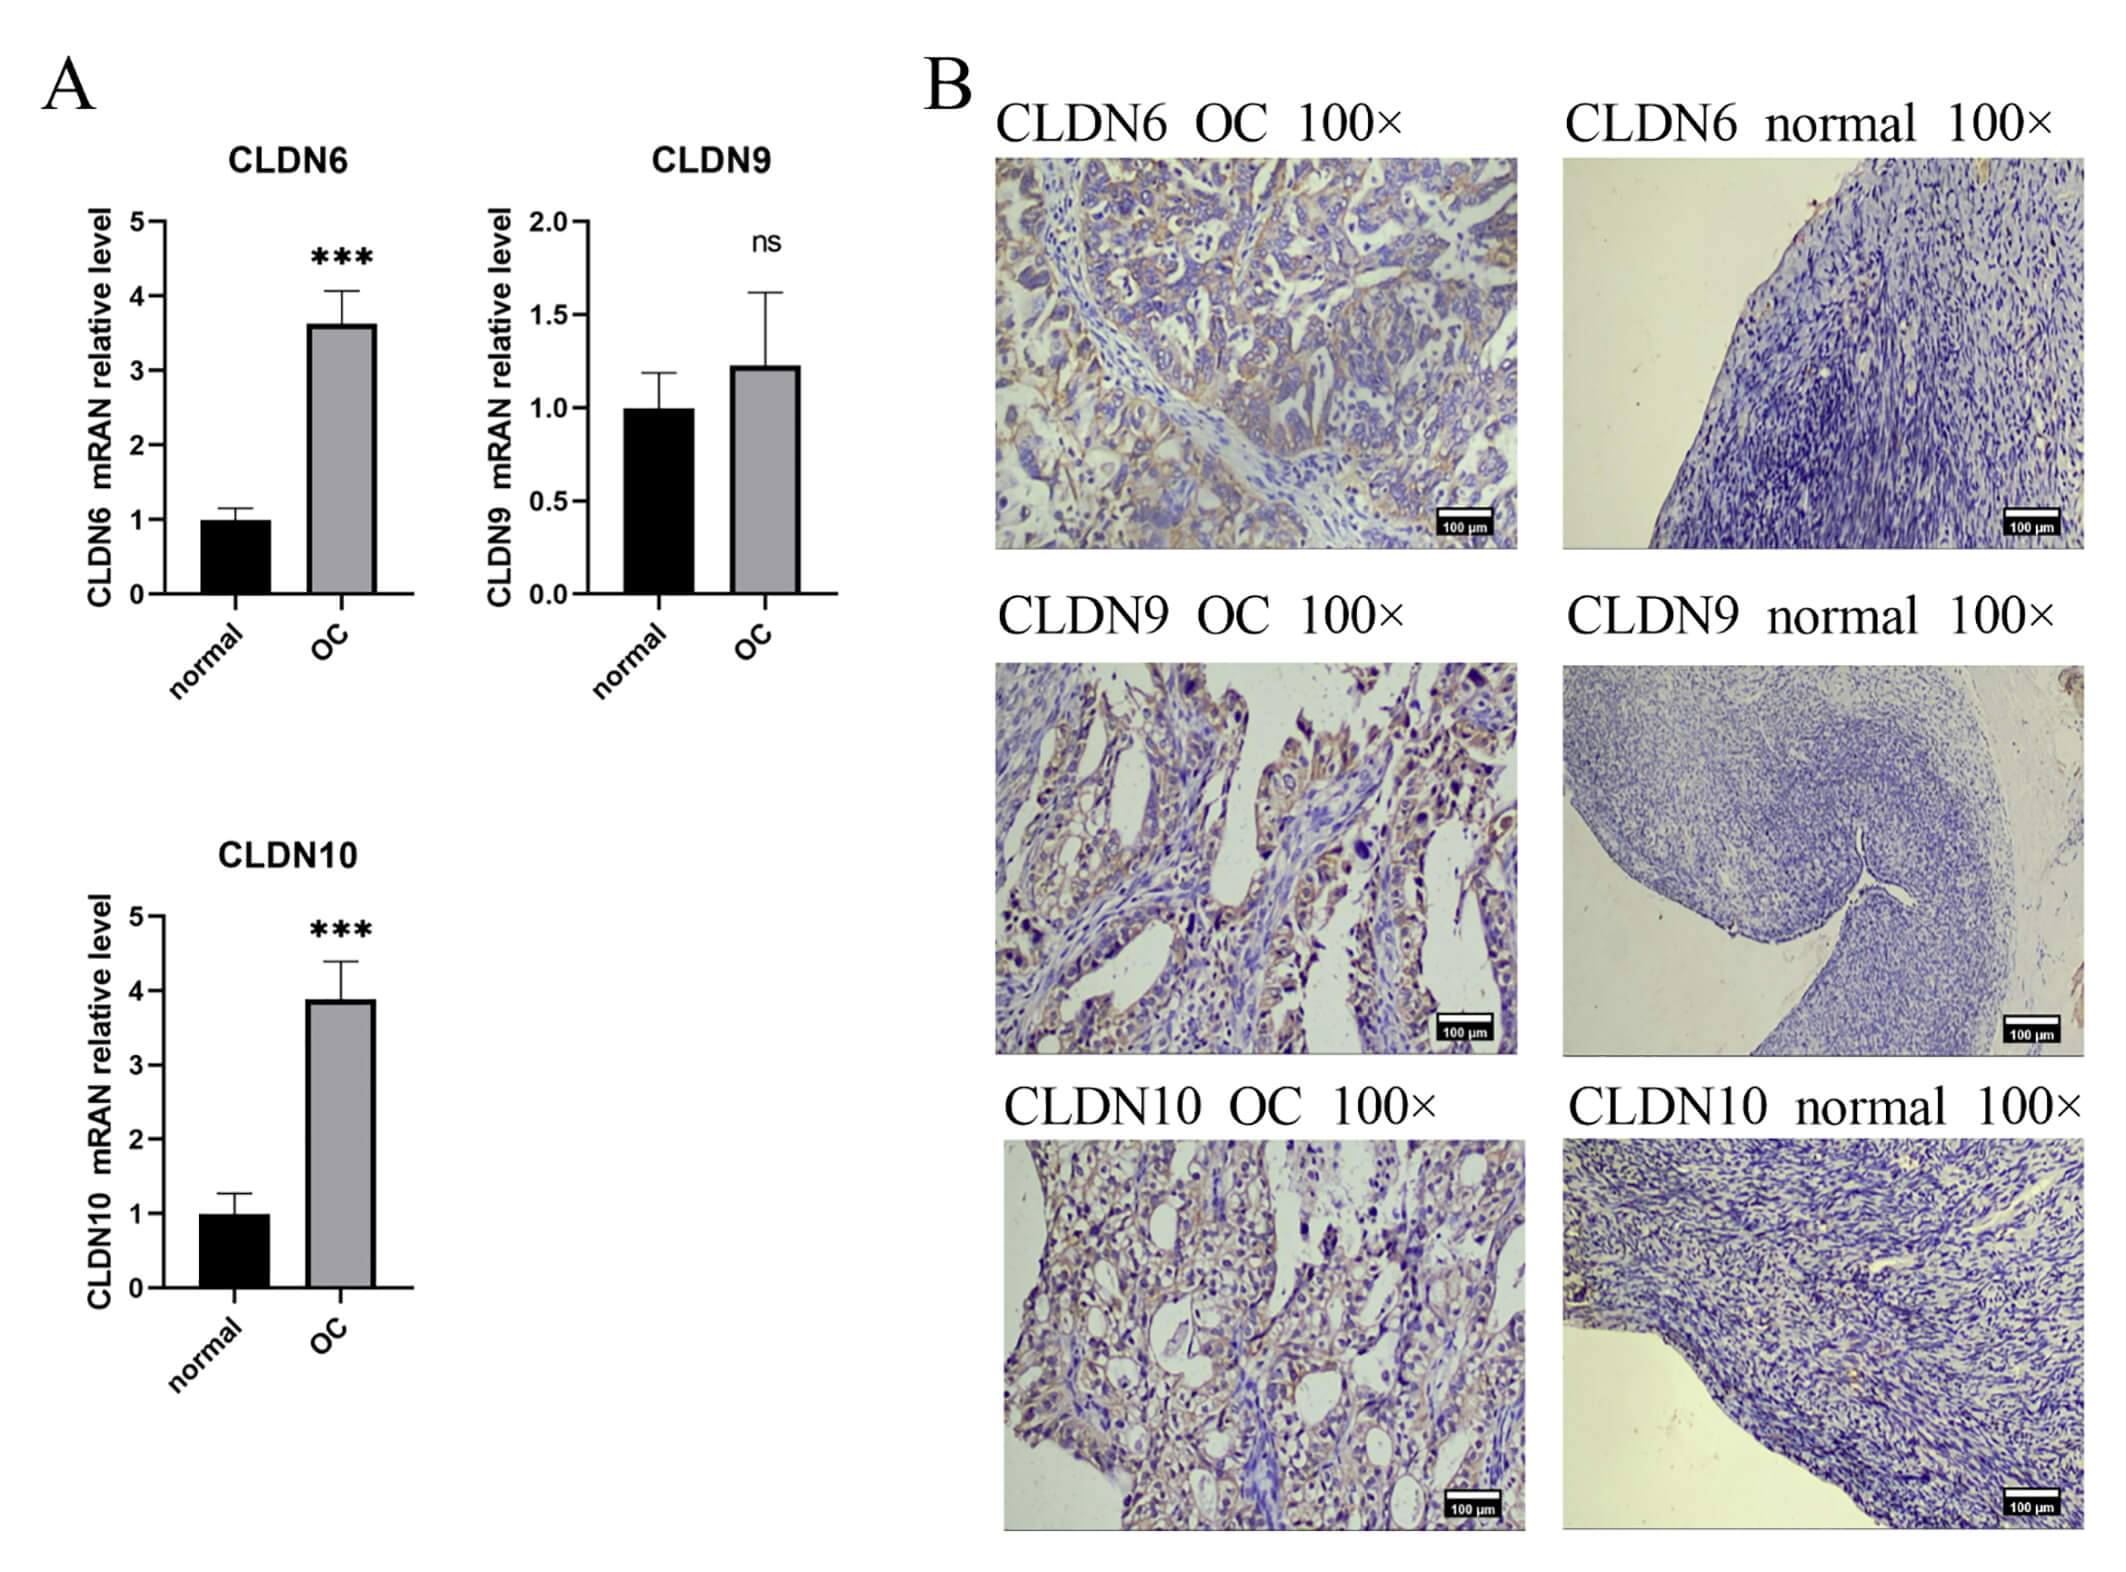 Fig. 9.
The expression of CLDN6, CLDN9, CLDN10 in clinical tissue
samples. (A) Gene expression between OC and normal tissues using RT-PCR,
***p
 Fig. 10.
The protein expression of CLDN6 in clinical tissue
samples. (A) Gene expression between normal and OC tissues using Western-blot.
(B) Quantitative expression of CLDN6 in normal ovarian tissue and OC tissue, **
p
To verify the functional driving role of CLDN6, CLDN9 and CLDN10, a gene knockdown experiment was conducted on the OV-90 and SK-OV-3 cell lines. si-CLDN10-2/3, si-CLDN9-2/3, si-CLDN6-1/3, were selected as the best silencing siRAN and used in subsequent experiments (Fig. 11A). The CCK8 and transwell experiments further demonstrated that reducing CLDN6 expression, rather than CLDN9 and CLDN10, could notably suppress cell proliferation and migration (Fig. 11B–D). Therefore, we decided to focus on CLDN6.
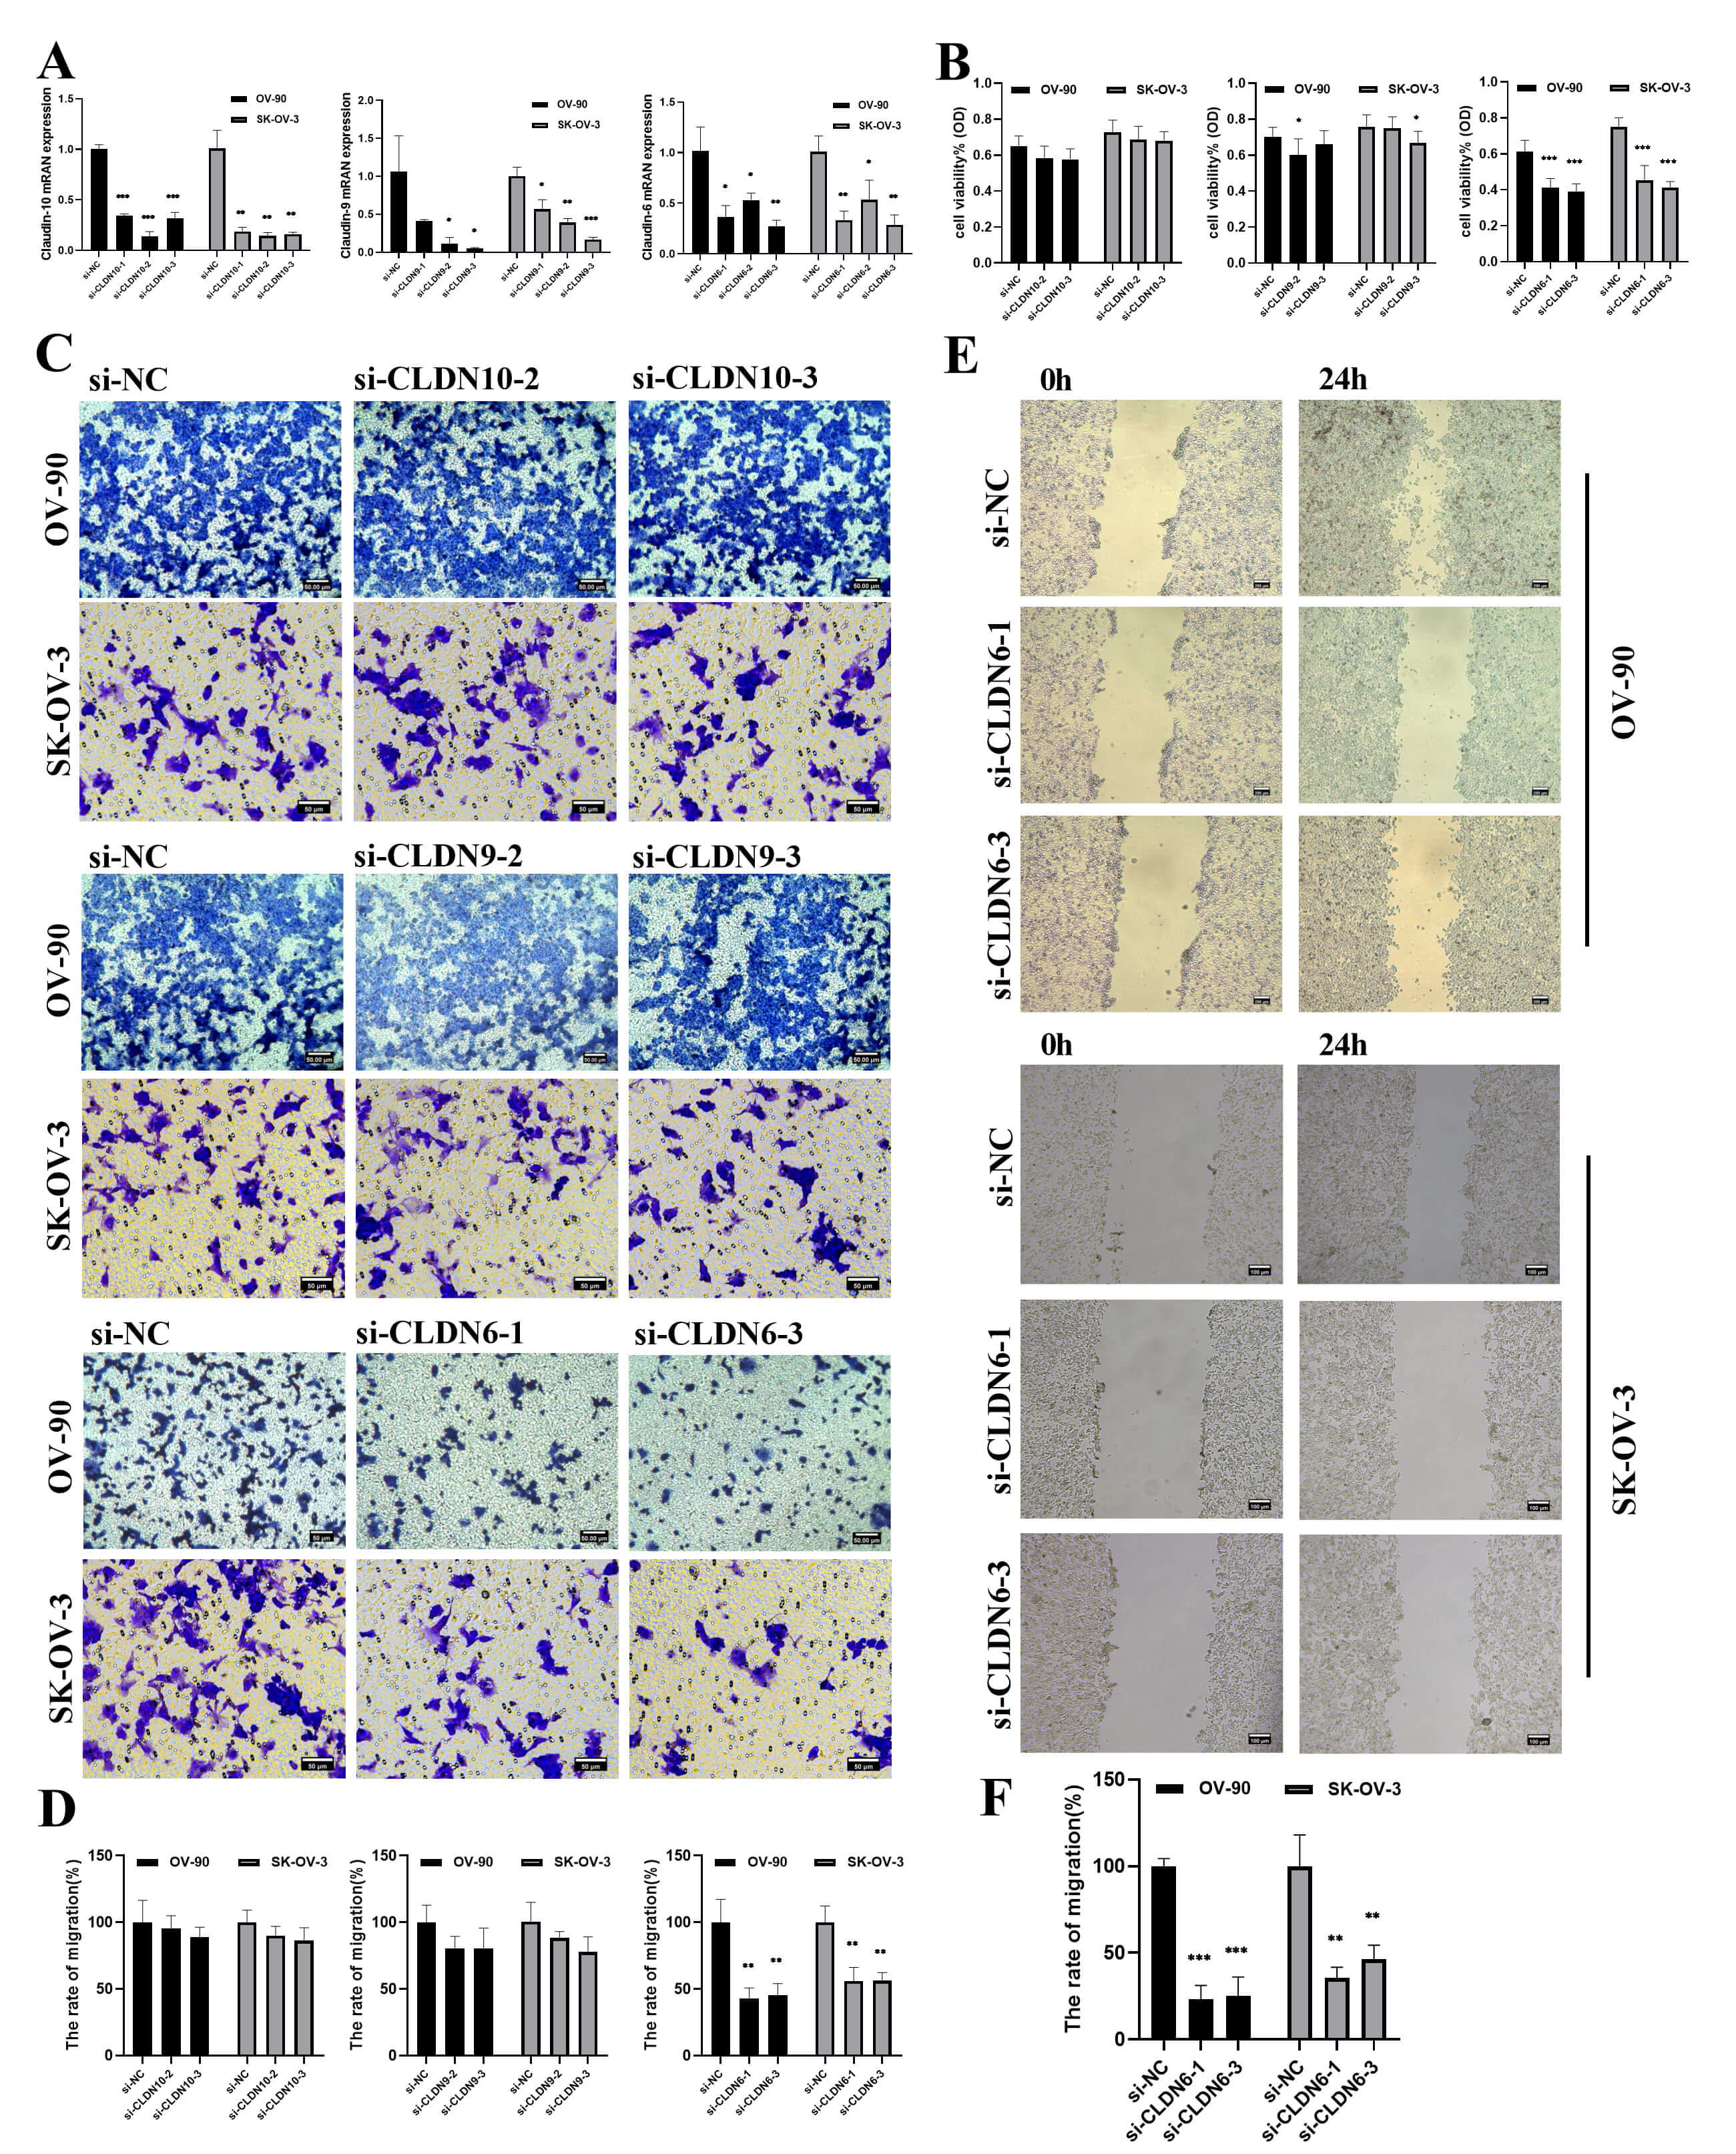 Fig. 11.
The effect of CLDNs knockdown on OC cells proliferation and
migration. (A) Determination of knockdown efficiency of CLDN9, CLDN6 and CLDN10
in OV-90 and SK-OV-3 cell lines by qPCR. (B) The effect of knocking down CLDNs on
the proliferation of the OC cells. (C) The effect of knocking down CLDNs on the
transwell chamber migration of the OC cells. Scale bar = 50 µm. (D)
Statistics of transwell chamber migration experiment results. (E) The effect of
knocking down CLDN6 on the scratch migration of OV-90 and SK-OV-3 cells. Scale
bar = 100 µm. (F) Statistical scratch test results. *p
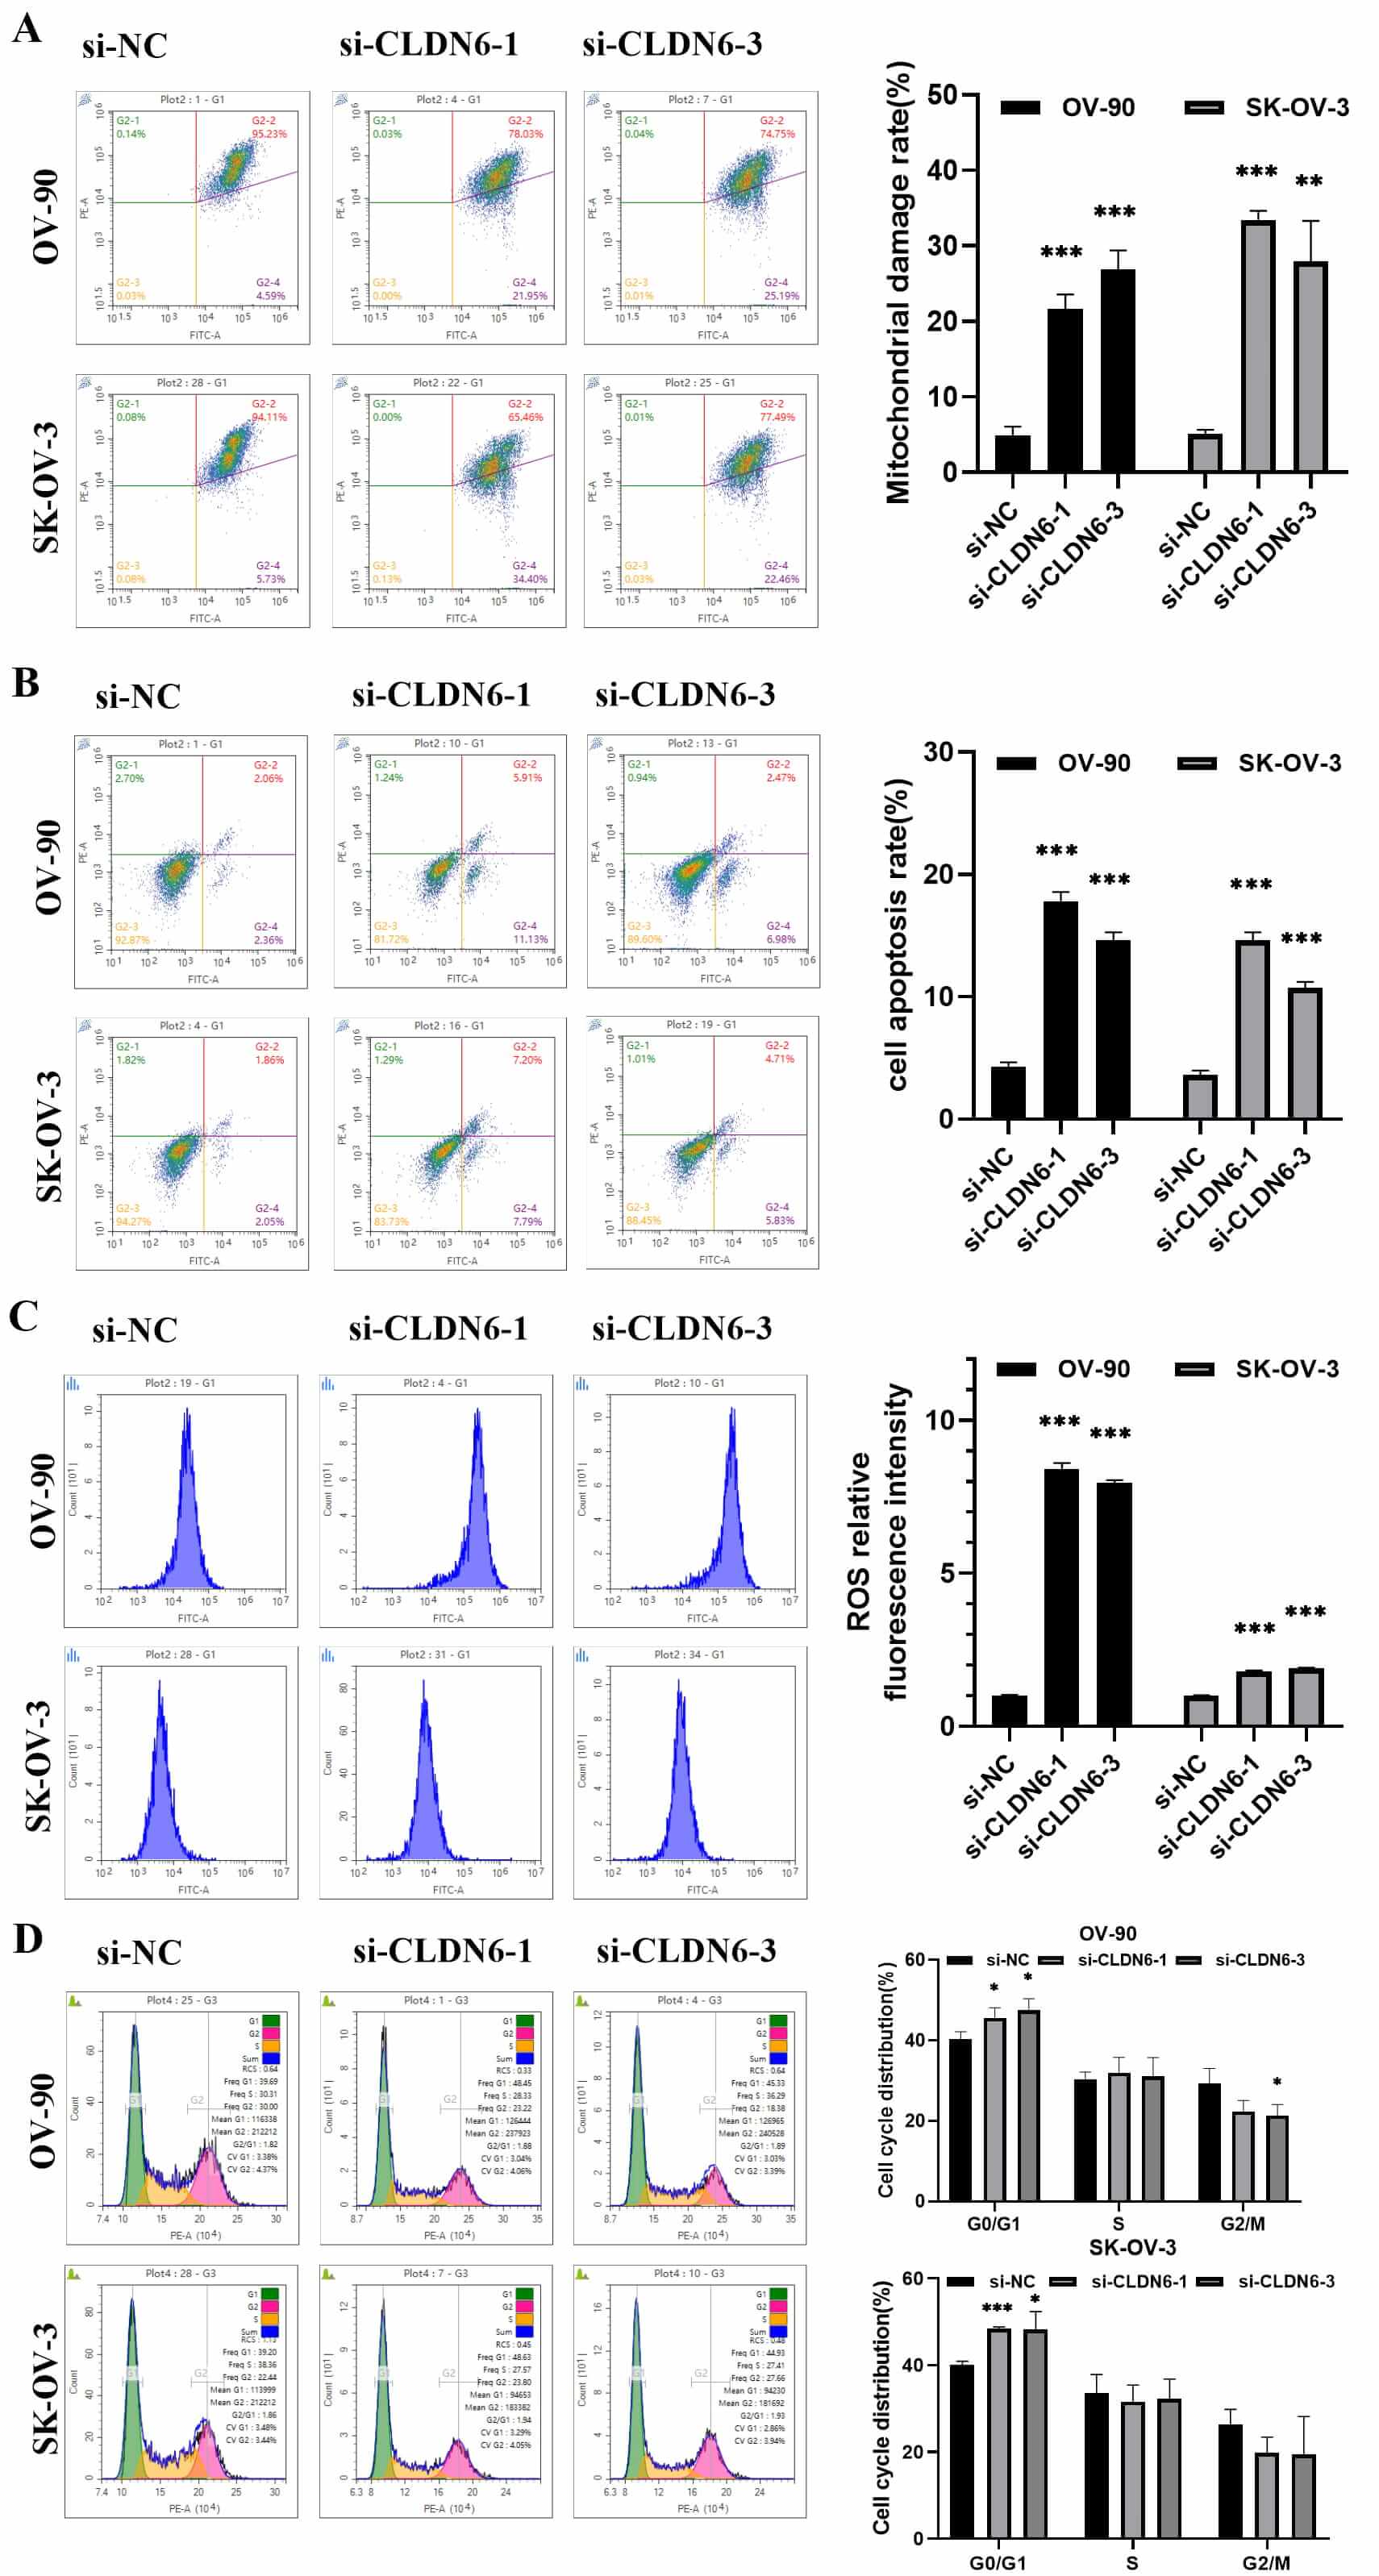
Next, a series of in vitro experiments showed that diminishing CLDN6
expression significantly reduced the wound-healing ability (Fig. 11E–F),
promoted mitochondrial depolarization and cell apoptosis, induced ROS
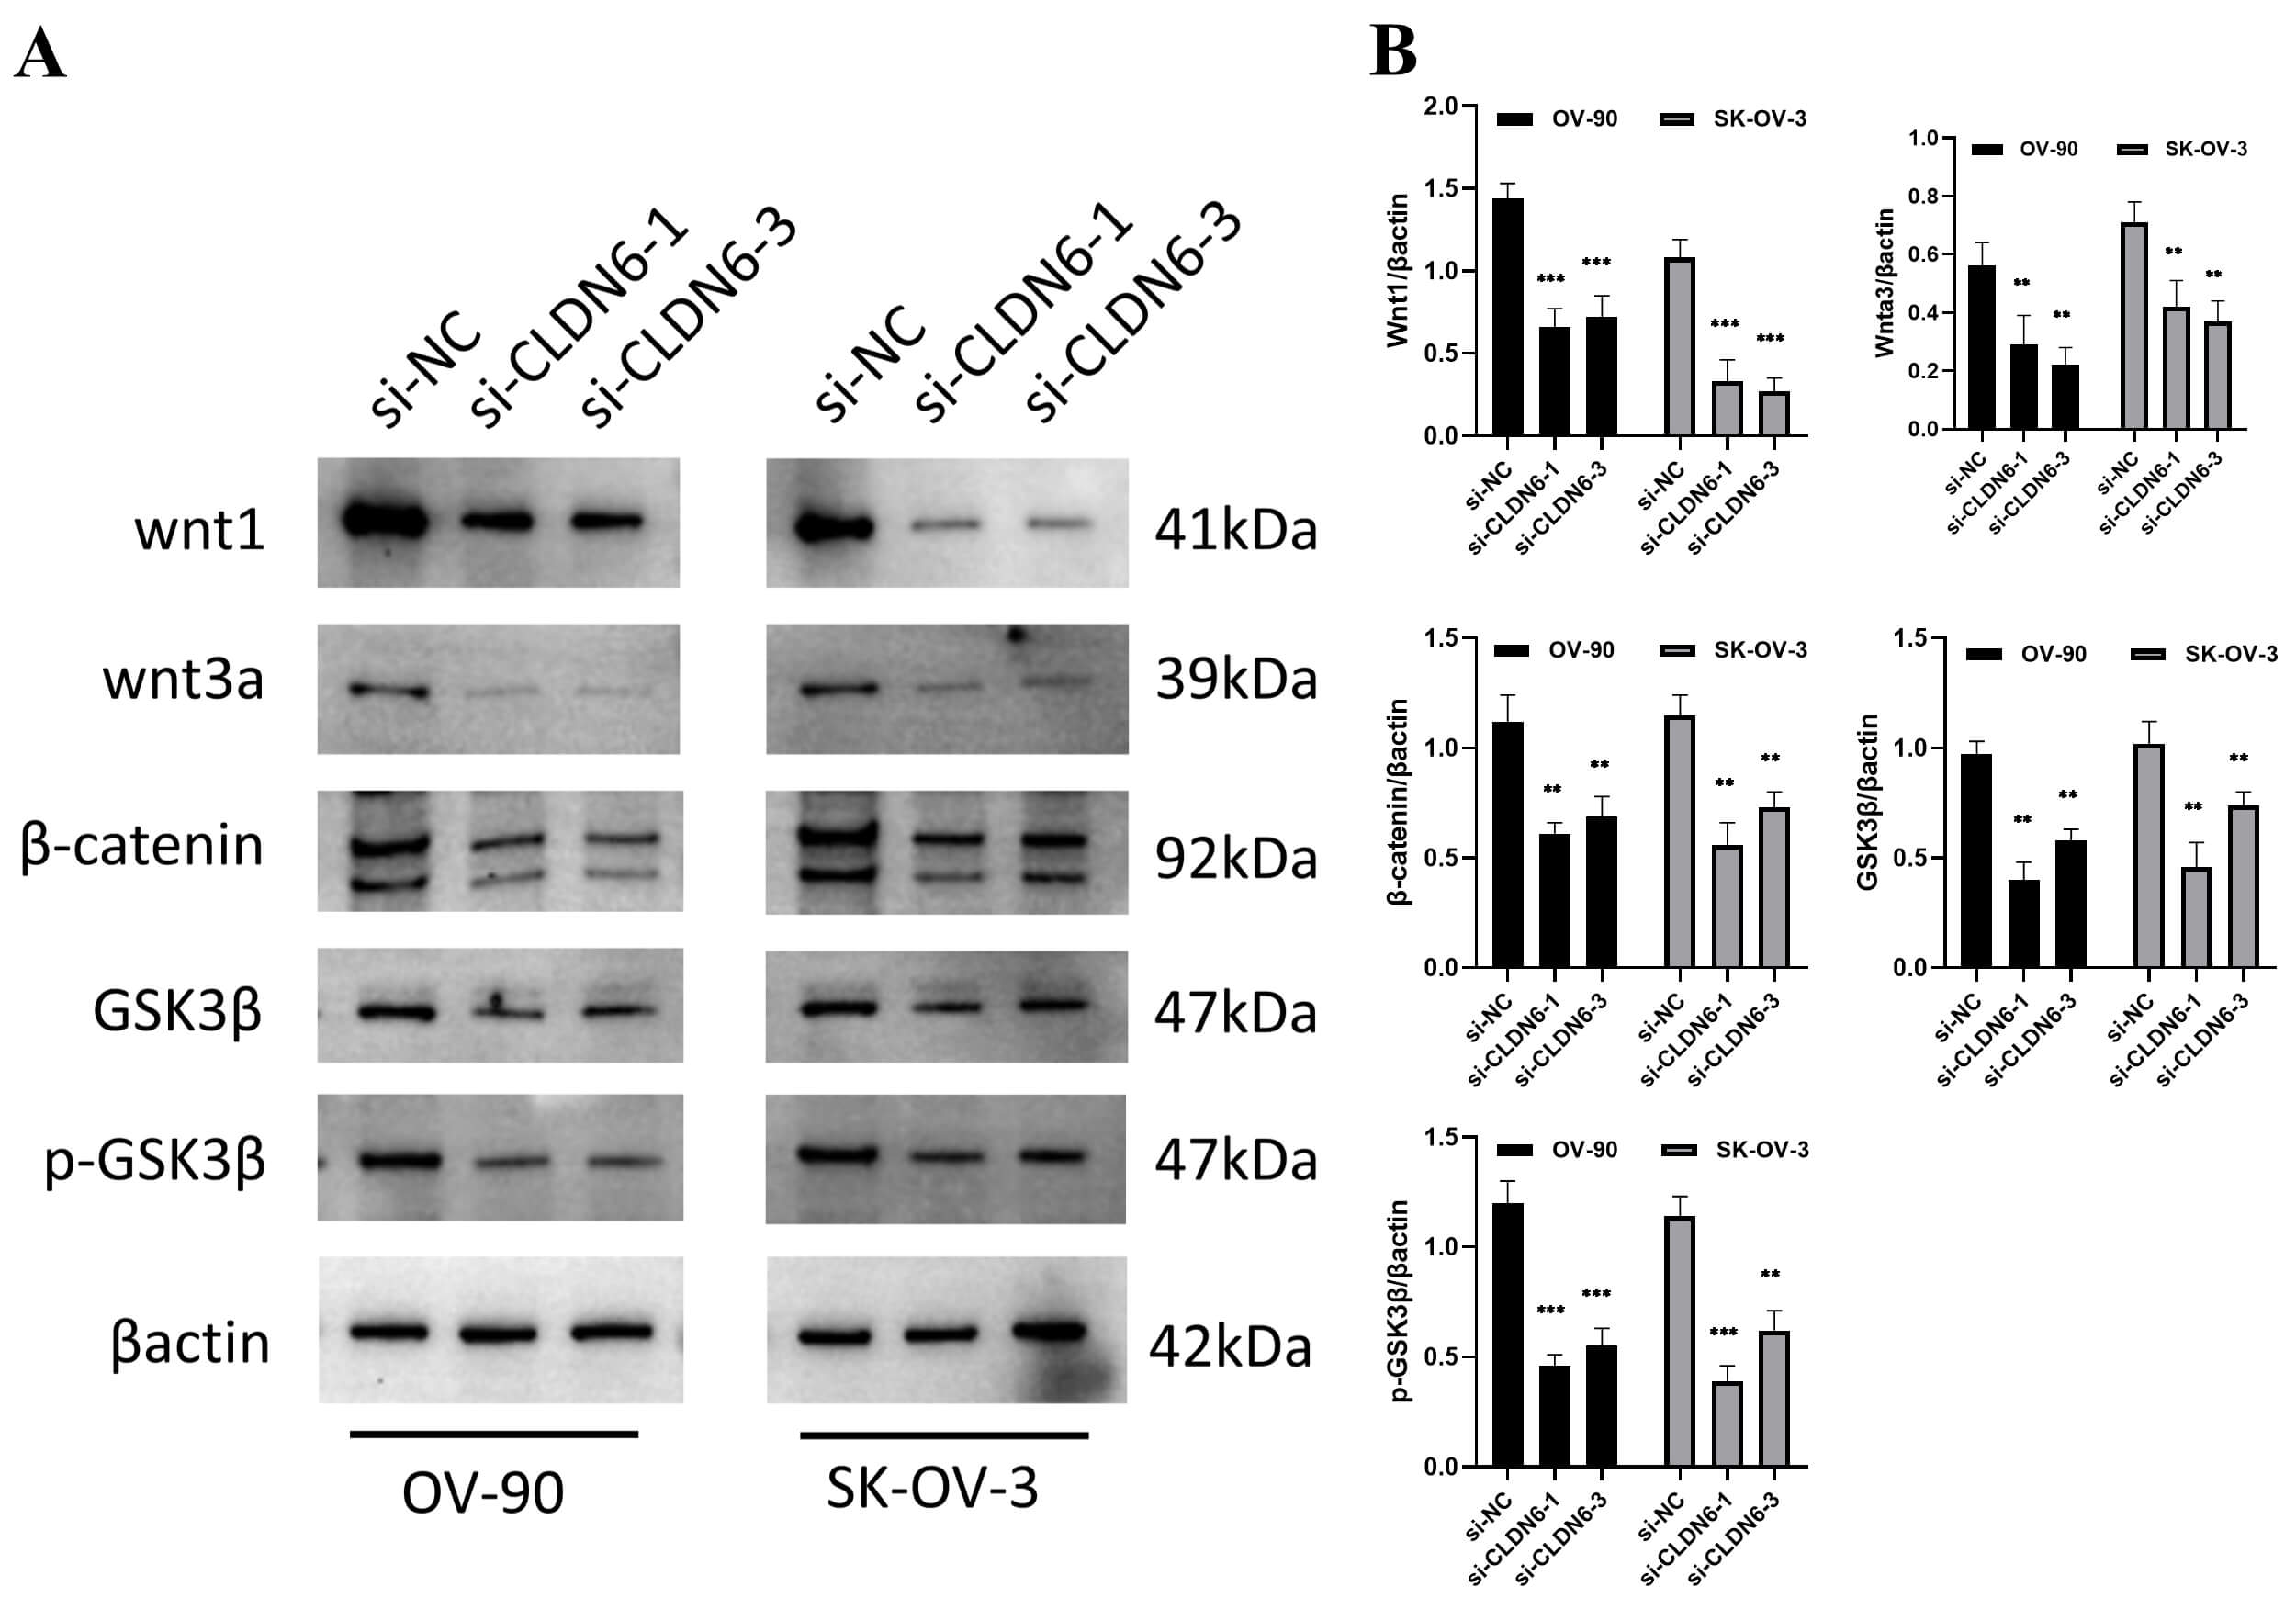
accumulation and partial G1 arrest in OC cell lines (Fig. 12A–D). The Western
blot results showed that interfering with the expression of CLDN6 affected the
protein expression of Wnt/
 Fig. 12.
Analysis of the effect of CLDN6 on OC cells by flow cytometry.
(A) The mitochondrial membrane potential of OV-90 and SK-OV-03 cells were
detected by flow cytometry and Statistics of experiment results. (B) Flow
detection of cell apoptosis rate and data analysis. (C) Accumulation of ROS in
cells and statistics of ROS relative fluorescence intensity experiment results.
(D) Detection of cell cycle arrest was performed by flow cytometry. *p
 Fig. 13.
The protein expression of the Wnt/
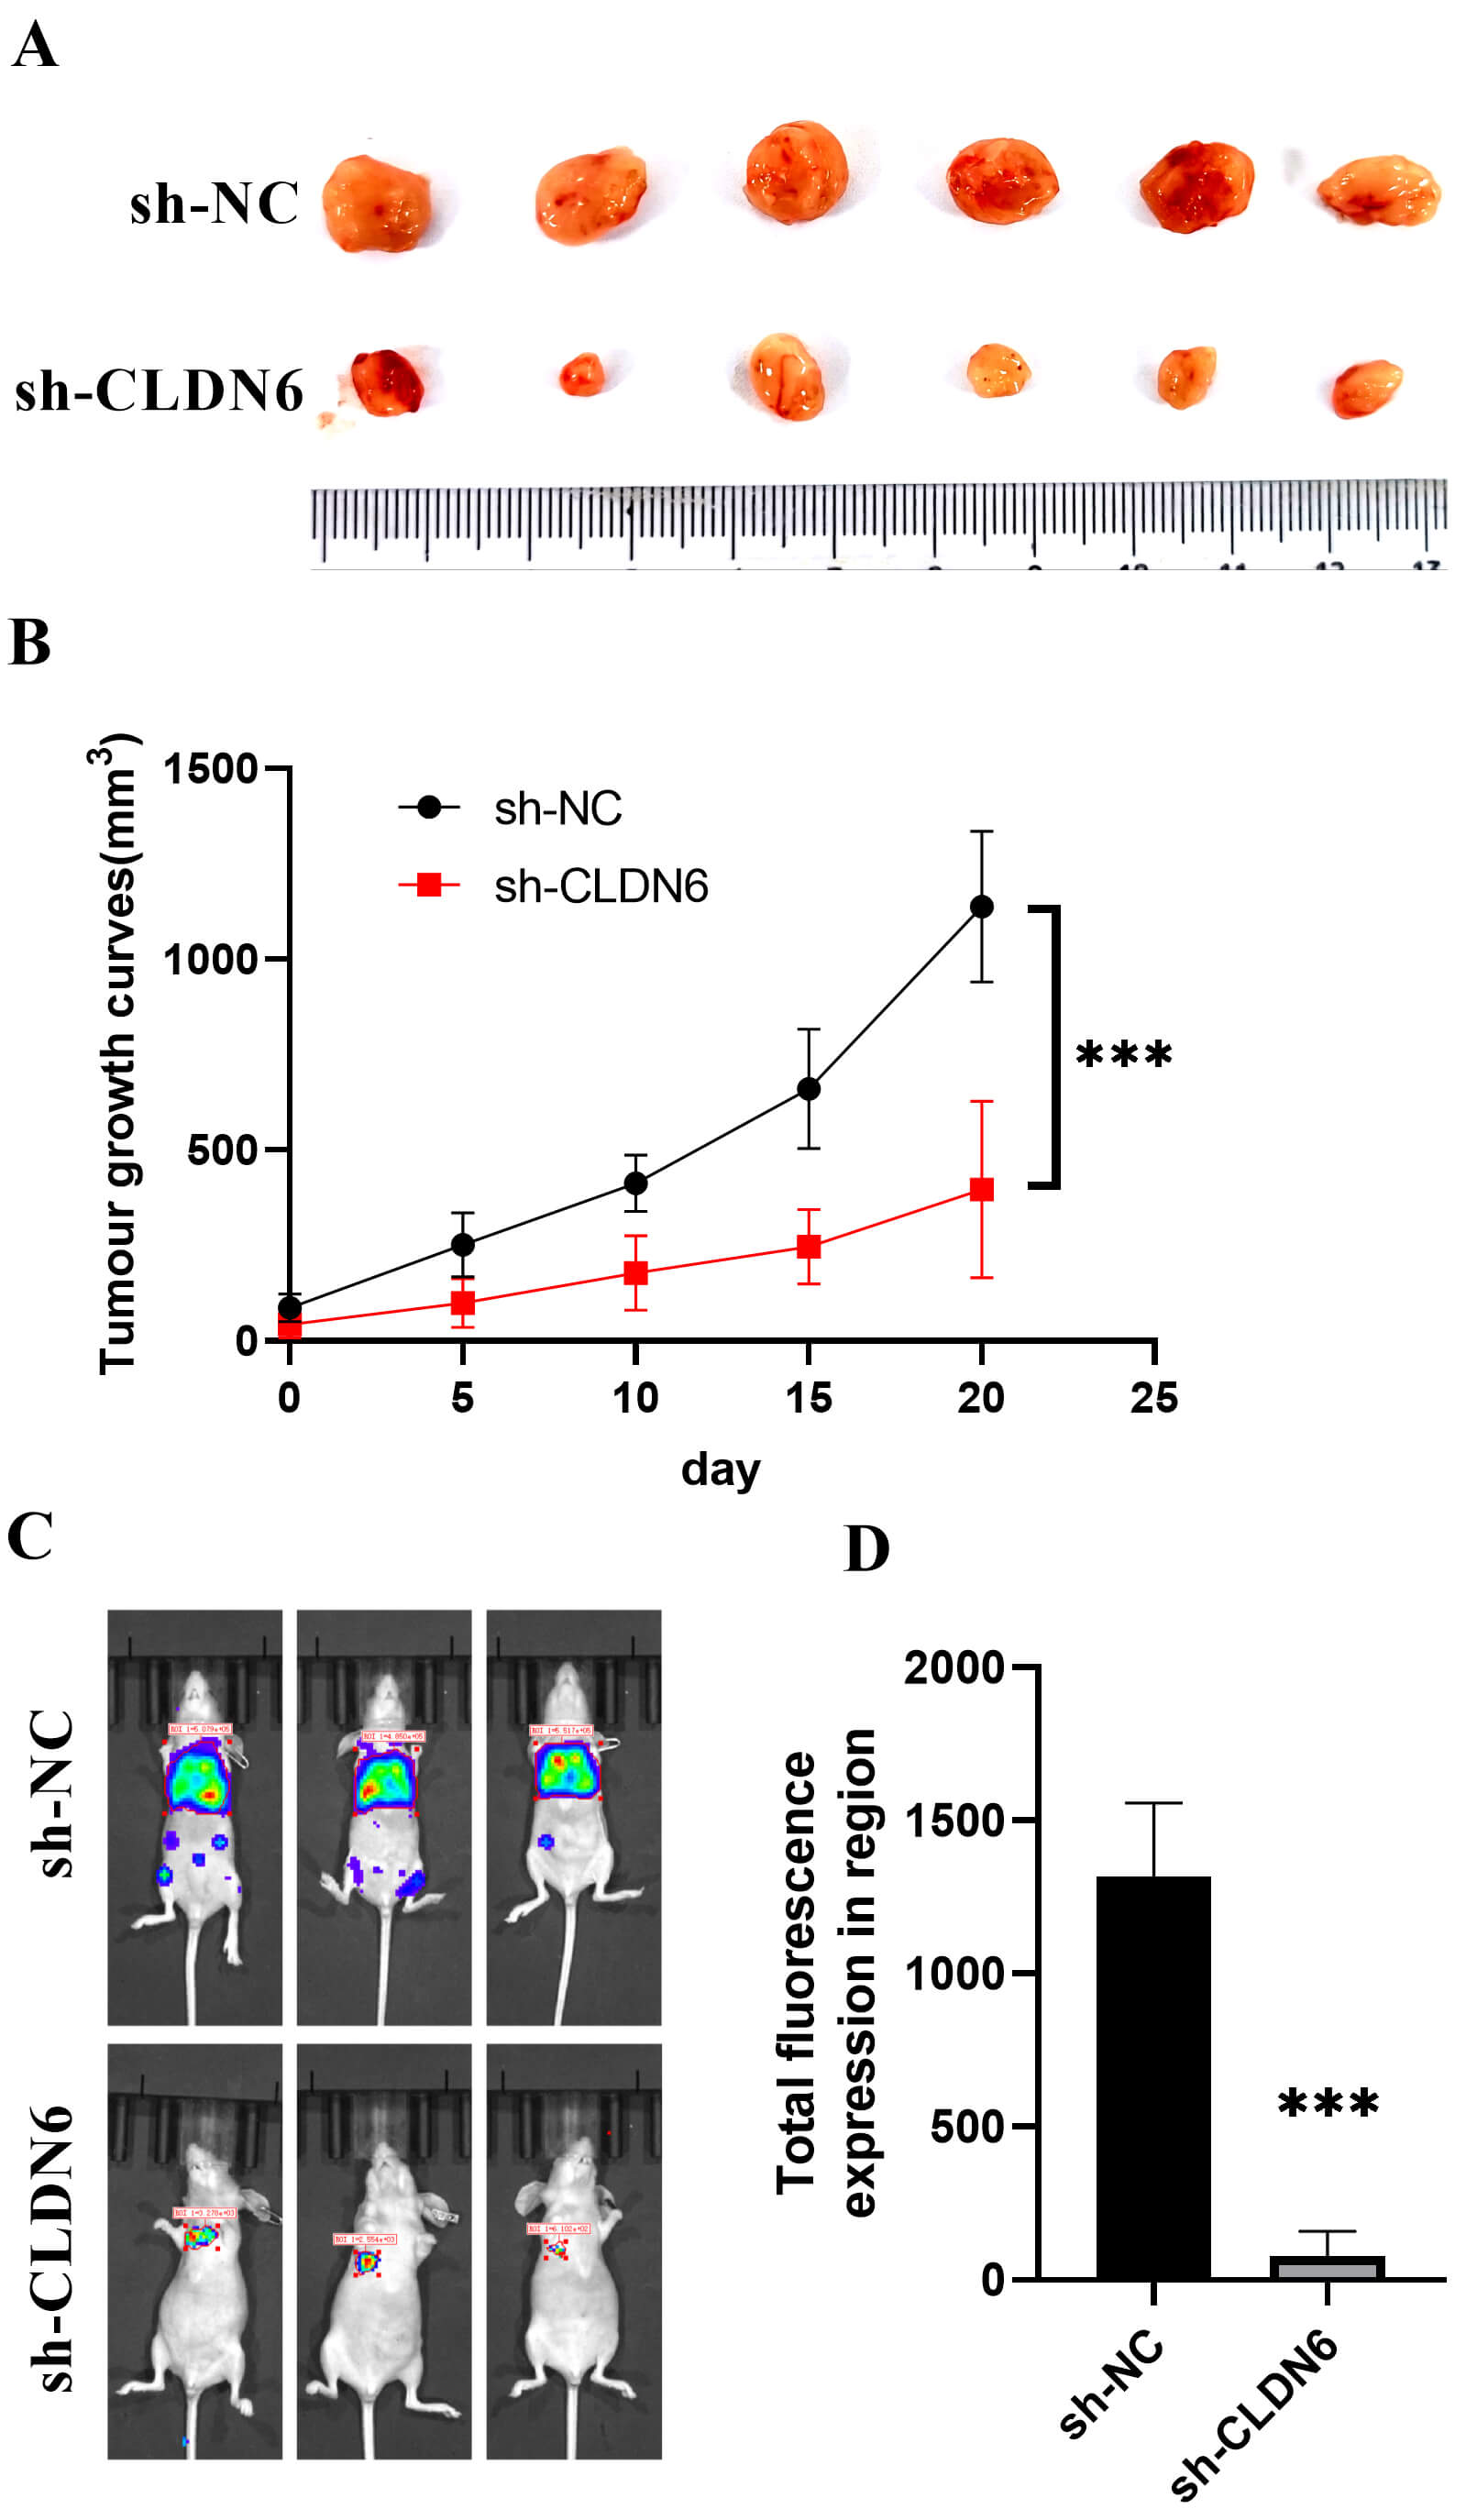
 Fig. 14.
In vivo experiments. (A) Subcutaneous tumor. (B)
Tumor growth curve. ***p
Ovarian cancer, the most lethal gynecologic malignancy, is frequently diagnosed at advanced stages due to nonspecific clinical manifestations and a lack of reliable early biomarkers—leading to its recognition as the “silent killer” [35]. This highlights an urgent need for novel diagnostic markers and therapeutic targets. Our study has identified CLDN6, CLDN9, and CLDN10 as critical contributors to OC pathogenesis through integrated multi-omics analysis.
In this study, CLDN6, CLDN9, and CLDN10 exhibited distinct and consistent
expression patterns in ovarian cancer across multiple datasets. To assess their
prognostic significance, HRs for all claudin family genes were derived from Cox
proportional hazards models using data from TCGA, GSE18520, and GSE26712, with
significantly associated genes identified through meta-analysis and forest plot
visualization. Subsequently, odds ratios (ORs) were estimated via logistic
regression in R to evaluate associations with tumor status, and claudin genes
with p
By integrating transcriptomic data from The Cancer Genome Atlas ovarian cancer cohort (TCGA-OV) and two independent GEO datasets (GSE18520 and GSE26712), we demonstrated that CLDN6, CLDN9, and CLDN10 are consistently upregulated in ovarian cancer tissues across all cohorts. Their combined expression signature exhibits superior diagnostic performance, with an area under the ROC curve (AUC) of 0.993, outperforming conventional biomarkers including CA125, HE4, CEA, and AFP. High expression of these genes is significantly associated with worse overall survival, a finding validated through meta-analysis using the Kaplan-Meier Plotter (KM plotter) database. This multidimensional screening approach robustly identifies CLDN6, CLDN9, and CLDN10 as central biomarkers in ovarian cancer.
Based on these findings, we performed further validation using single-cell RNA
sequencing data and confirmed that CLDN6, CLDN9, and CLDN10 were significantly
upregulated in tumor tissues compared to matched non-tumor ovarian tissues. This
observation is consistent with a previous study by Peipei Gao et al.
[37], which reported elevated expression of these genes in ovarian cancer [38].
At single-cell resolution, these genes exhibited tumor-restricted expression
patterns, being predominantly enriched in malignant epithelial cells—the cell
type of origin for over 90% of ovarian carcinomas [39]. Notably,
ligand–receptor interaction analysis suggested that CLDN6 and CLDN9 are
associated with activation of the Wnt/
Finally, we experimentally validated these findings. Immunohistochemistry and Western blotting confirmed protein-level overexpression of CLDN6, CLDN9, and CLDN10 in clinical ovarian cancer specimens. CLDN6 knockdown led to mitochondrial depolarization, ROS accumulation, apoptosis (Figs. 12,13), and a greater than 50% reduction in cell migration and invasion (Fig. 11). These results demonstrate that CLDN6 plays a central role in regulating ovarian cancer cell survival and motility. Notably, early-phase clinical trials of CLDN6-targeting ADCs have shown promising efficacy in ovarian cancer [13, 33], while CLDN18.2-directed therapies are under investigation in related malignancies [14, 41]. Together, our data support the development of CLDN6, CLDN9, and CLDN10 as actionable targets for next-generation therapeutic strategies, including ADCs and siRNA-based interventions.
Our study has several limitations. First, the analysis lacks detailed stratification by FIGO stage and histological subtype, which may affect the generalizability of our findings. Additionally, the functional targeting effects of CLDN6, CLDN9, and CLDN10 have not yet been validated in vivo. Future studies should confirm the diagnostic and prognostic roles of these genes in a prospective ovarian cancer cohort. Furthermore, it will be important to investigate the distinct therapeutic vulnerabilities—such as differential regulation of the Wnt signaling pathway—associated with each claudin family member across molecular subtypes of ovarian cancer.
This study identifies CLDN6, CLDN9, and CLDN10 as promising biomarkers and functional mediators in ovarian cancer with three key features. First, their combined expression constitutes a novel diagnostic signature that outperforms established biomarkers such as CA125 and HE4. Second, these genes act as key drivers of ovarian cancer progression, promoting tumorigenesis through modulation of the Wnt signaling and mitochondrial apoptosis pathways. Third, they are specifically enriched in malignant epithelial cells, and experimental knockdown of CLDN6 significantly inhibits tumor cell viability and invasion in vitro. Together, the CLDN6/9/10 axis represents a promising target for both early detection and precision therapy of ovarian cancer.
ACC, Adrenocortical carcinoma; AUC, Area under the curve; BLCA, Bladder urothelial carcinoma; BRCA, Breast invasive carcinoma; CESC, Cervical squamous cell carcinoma and endocervical adenocarcinoma; CHOL, Cholangiocarcinoma; CCLE, Cancer cell line encyclopedia; COAD, Colon adenocarcinoma; COAD/READ, Colon adenocarcinoma/Rectum adenocarcinoma esophageal carcinoma; DSS, Disease-specific survival; DFI, Disease-free interval; DLBC, Lymphoid neoplasm diffuse large B-cell lymphoma; ESCA, Esophageal carcinoma; FAP, Fibroblast activation protein-
The datasets used and analysed during the current study are available from the corresponding author on reasonable request.
YW, ZB, YY, and KY designed the project. YW, ZB, performed in vitro and in vivo studies. YW and ZB performed bioinformatics analysis. YW performed histopathological analysis. YW and ZB wrote the paper. YY and KY supervised all research. All authors contributed to editorial changes in the manuscript. All authors read and approved the final manuscript. All authors have participated sufficiently in the work and agreed to be accountable for all aspects of the work.
The human study included experimental procedures were approved by the Ethics Committee of The First Hospital of Lanzhou University (approval No.: LDYYLL-2024-497). A written consent was signed by the patients or their families/legal guardians and the research process was in compliance with the Helsinki Declaration. The animal experiments were approved by Ethics Committee of The First Hospital of Lanzhou University (approval No.: LDYYLL-2024-805). All procedures for animal studies were approved by the Institutional Animal Care and Use Committee of The First Hospital of Lanzhou University and conformed to the ARRIVE guidelines for the care and maintenance of laboratory animals.
The authors would like to thank the reviewers for their suggestions.
This work is supported by the Hospital Fund of the First Hospital of Lanzhou University (ldyyyn2020-68).
The authors declare no conflict of interest.
References
Publisher’s Note: IMR Press stays neutral with regard to jurisdictional claims in published maps and institutional affiliations.