


 , Satoshi Kishigami 1,2,*
1 Graduate School of Life and Environmental Sciences, Integrated Graduate School of Medicine, Engineering, and Agricultural Sciences, University of Yamanashi, 400-8510 Kofu, Japan
2 Center for Advanced Assisted Reproductive Technologies, University of Yamanashi, 400-8510 Kofu, Japan
Abstract
Sperm represent a heterogeneous population crucial for male reproductive success. Additionally, sperm undergo dynamic changes during maturation and capacitation. Despite these well-established processes, the complex nature of sperm heterogeneity and membrane dynamics remains elusive. The composition of phospholipids in the sperm membrane changes dynamically during maturation, with their release occurring during capacitation. This study aims to investigate the heterogeneity and dynamic changes in the sperm membrane during maturation and capacitation towards fertilization by visualizing these membrane dynamics.
Sperm were collected from the cauda epididymis or testis of Institute of Cancer Research (ICR) male mice and stained with MemBright dye (commercial name: MemGlow™-560, MG-560), a fluorogenic live-cell membrane probe. Staining was performed either before, during, or after incubation for capacitation. In pre-staining experiments, sperm were stained with MG-560 before capacitation and then incubated to induce capacitation. Acrosome-reacted sperm were assessed after staining with peanut agglutinin FITC (PNA-Lectin FITC). Stained sperm were observed using fluorescence or confocal microscopy.
MG-560-stained sperm from the epididymis before capacitation showed four staining patterns: head-midpiece-tail (HMT), head-midpiece (HM), head (H), midpiece (M) positive, or totally negative, with ratios remaining unchanged during capacitation (30.5%, 29%, 11.3%, 3.7%, and 25.5%, respectively). In contrast, all testicular sperm were negative for staining. Pre-stained sperm exhibited an increased number of HM and M patterns over time, whereas the number of HMT-stained sperm decreased. Consistently, spontaneous acrosome-reacted sperm were detected predominantly in HM- or M-stained sperm. After in vitro fertilization (IVF) using pre-stained sperm, zona pellucida-attached sperm were mostly negative for staining. Finally, all sperm detected in the perivitelline space were only negative.
Mature sperm membranes stained with MG-560 exhibited heterogeneous and dynamic changes during the capacitation and fertilization process. MG-560 staining identified sperm with the potential to undergo the acrosome reaction, and these MG-560-positive sperm eventually became negative as they penetrated the zona pellucida for fertilization. Thus, the MG-560 staining patterns likely reflect the physiological state and potential of the sperm. These findings provide new insights into sperm heterogeneity and dynamics, and this staining method may also prove useful for assessing sperm quality.
Keywords
- capacitation
- acrosome reaction
- sperm membrane
- sperm evaluation
- fertilization
Mammalian development begins with fertilization, which requires the fusion of a sperm with an egg to form a zygote. However, testicular sperm after the transformation of spermatids are immotile and lack the ability to fertilize egg. The sperm are endowed with motility and fertilizing ability in the epididymis, a process known as sperm maturation as the final step of spermiogenesis. Further, after mating, the sperm undergo capacitation within the female reproductive tract as a preparation process of the sperm for hyperactivation, the acrosome reaction and fusion with the egg. These series of physical, physiological, and biochemical changes in sperm are essential for normal fertilization [1]. On the other hand, the discovery of capacitation by Austin and Chang and the successful in vitro capacitation of sperm are major steps toward the realization of in vitro fertilization (IVF) [2].
Assisted reproductive technologies (ART) continue to evolve, and over the past four decades, more than 8 million babies have been born worldwide through in vitro fertilization (IVF) [3]. Infertility affects approximately 15% of couples globally, accounting for 48.5 million couples. Male factor infertility is solely responsible for 20–30% of cases and contributes to 50% of all infertility cases. The decline in male reproductive health has become a significant concern in recent years, with an estimated 30 million men worldwide affected by infertility [4]. To perform ART, sperm quality is important, which is assessed by the basic examination of human semen in terms of such as semen volume, sperm concentration, sperm motility, and normal sperm forms as shown in the 6th edition of the World Health Organization (WHO)andrology laboratory manual [5].
The quantity and quality of sperm are closely involved in male fertility, which can be impacted by external and internal factors including nutrients and genetic variation [6, 7]. Sperm are not a homogeneous population but sperm heterogeneity and diversity even within a male and between males exist [8]. Therefore, in ART, sperm morphology assessment has been one of the most popular and important tests for fertility [9, 10]. Selecting sperm for intracytoplasmic sperm injection based on factors such as morphological characteristics is also a crucial theme [11, 12]. New selection methods of sperms for ART have been developed such as Physiologic intracytoplasmic sperm injection (PICSI) and selection with hyaluronic acid using the ability of mature sperm to bind to hyaluronic acid selection and the integration of the motile sperm organelle morphology examination (MSOME) into the Intracytoplasmic Sperm Injection (ICSI) method allows a high-magnificence micro-injection (IMSI) [13]. However, the success rate of ART generally remains below 50% per cycle. As a result, most patients undergo multiple cycles to achieve a live birth [14]. Therefore, a new method to evaluate spermatozoa is needed. In laboratory, spermatozoa are evaluated by various stains, including viability, acrosomal integrity, capacitation status and DNA status of spermatozoa. Unfortunately, these commonly used laboratory assays often do not fit these criteria and have not correlated well with the fertilizing ability of the spermatozoa [15].
During capacitation, sperm change their swimming pattern and the lipids that make up their plasma membrane change substantially [16]. The final stage of capacitation is the acrosome reaction, which is important to fuse with the egg plasma membrane [17]. Capacitation is triggered by the exclusion or removal of membrane cholesterol. Low cholesterol/phospholipids ratio is important for fertilization. So, the capacitation medium often contains albumin as a cholesterol receptor [18]. On the other hand, it has been also shown that the removal of phospholipids induces capacitation and subsequent reactions [19]. However, the dynamics and heterogeneity of sperm membrane including phospholipids during capacitation is not clear yet. Elucidating these dynamics can expect to help us understand the complex physiological changes that sperm undergo to acquire fertilization ability, and contribute to developing new methods for sperm assessment and selection in ART.
In this study, we aimed to achieve two main objectives using a fluorescent dye to detect phospholipids in live sperm: to visualize the heterogeneity and the dynamics of the sperm plasma membrane towards fertilization, and to elucidate the relationship between the membrane dynamics in sperm and fertilization ability.
Institute of Cancer Research (ICR) strain female and male mice, aged 8–12 weeks, were purchased from Shizuoka Laboratory Animal Center (SLC) Inc. (Hamamatsu, Japan). The mice were maintained in an SPF room (25 °C, a relative humidity of 50%, and a 14/10-hour light-dark cycle). Mice were fed ad libitum with a standard pelleted diet and allowed free access to distilled water. All the animal experiments were approved by the Animal Experimentation Committee at the University of Yamanashi, Japan, (protocol number A4-10) and conducted in accordance with the ethical guidelines.
After euthanasia of mice by cervical dislocation, sperm were collected from testis or cauda epididymis in human tubal fluid (HTF) medium. To induce capacitation, sperm from caudal epididymis were incubated in HTF medium at 37 °C, 5% CO2 condition for the indicated time.
MemGlow™ 560 (MG-560, Cytoskeleton Inc., Denver, CO, USA) was used at a final concentration of 50 nM to stain the sperm plasma membrane for 15 minutes at room temperature (23–25 °C) under light-shielded conditions. Simultaneously, Hoechst 33342 (2.5 µg/mL, AdipoGen Life Science Inc., Basel, Switzerland) was used to stain the nuclei. Both reagents were diluted in HTF medium, and sperm were observed using fluorescence microscopy (BZX-810; Keyence, Osaka, Japan).
Acrosome-reacted sperm were assessed using peanut agglutinin FITC (PNA-Lectin FITC, vector laboratories Burlingame, CA, USA) [20]. Sperm were collected in 100 mL of human tubal fluid (HTF) medium and incubated for 0–120 minutes at 37 °C under 5% CO2 in air. The sperm were treated with PNA-Lectin FITC (20 µg/mL) at room temperature (23–25 °C) for 20 minutes. HTF medium was used for reagent dilution, and sperm were observed using fluorescence microscopy (BZX-810; Keyence, Osaka, Japan).
To induce superovulation, female mice were intraperitoneally injected with 7.5
IU of pregnant mare serum gonadotropin (PMSG; ASKA Pharmaceutical Co. Ltd.,
Tokyo, Japan), followed 48 hours later by an injection of 7.5 IU of human
chorionic gonadotropin (hCG; ASKA Pharmaceutical Co. Ltd.). 14 to 17 hours after
hCG injection, cumulus–oocyte complexes (COCs) were collected from the oviducts
into fertilization drops, with 200 µL of HTF used as the fertilization
drop. Sperm were incubated in HTF at 37 °C under 5% CO2 in air.
After incubation, sperm suspension was introduced into the fertilization drop
containing oocytes, with a final sperm concentration of approximately 1
Statistical analyses were performed using JMP Pro software version 17.0 (SAS
Institute Inc., Cary, NC, USA). Results are expressed as means or means
MG-560 is a fluorogenic membrane probe with an emission spectrum of 570 nm when reaching the plasma membrane (PM). It enables homogeneous and selective staining of the PM, with some preference for specific cell types, such as neurons [21]. After live epididymal mature sperm from cauda epididymis were stained with MG-560 for 15 minutes, various clearly defined staining patterns were observed. Each part of the sperm that was evenly stained corresponded to the head (H), midpiece (M), or tail (T) (Fig. 1A) As a result, the stained sperm were categorized into five groups: whole sperm (HMT), head and midpiece (HM), head only (H), midpiece only (M), and not stained (negative) 30.5%, 29%, 11.3%, 3.7%, and 25.5%, respectively (Fig. 1A). The ratios of these staining patterns did not change over time during incubation for capacitation (Fig. 1B). Interestingly, the tail was the least likely region to be stained. Additionally, the ratios of these staining patterns varied between males. These data suggest that MG-560 staining preference is dependent on specific sperm regions and remains stable throughout capacitation.
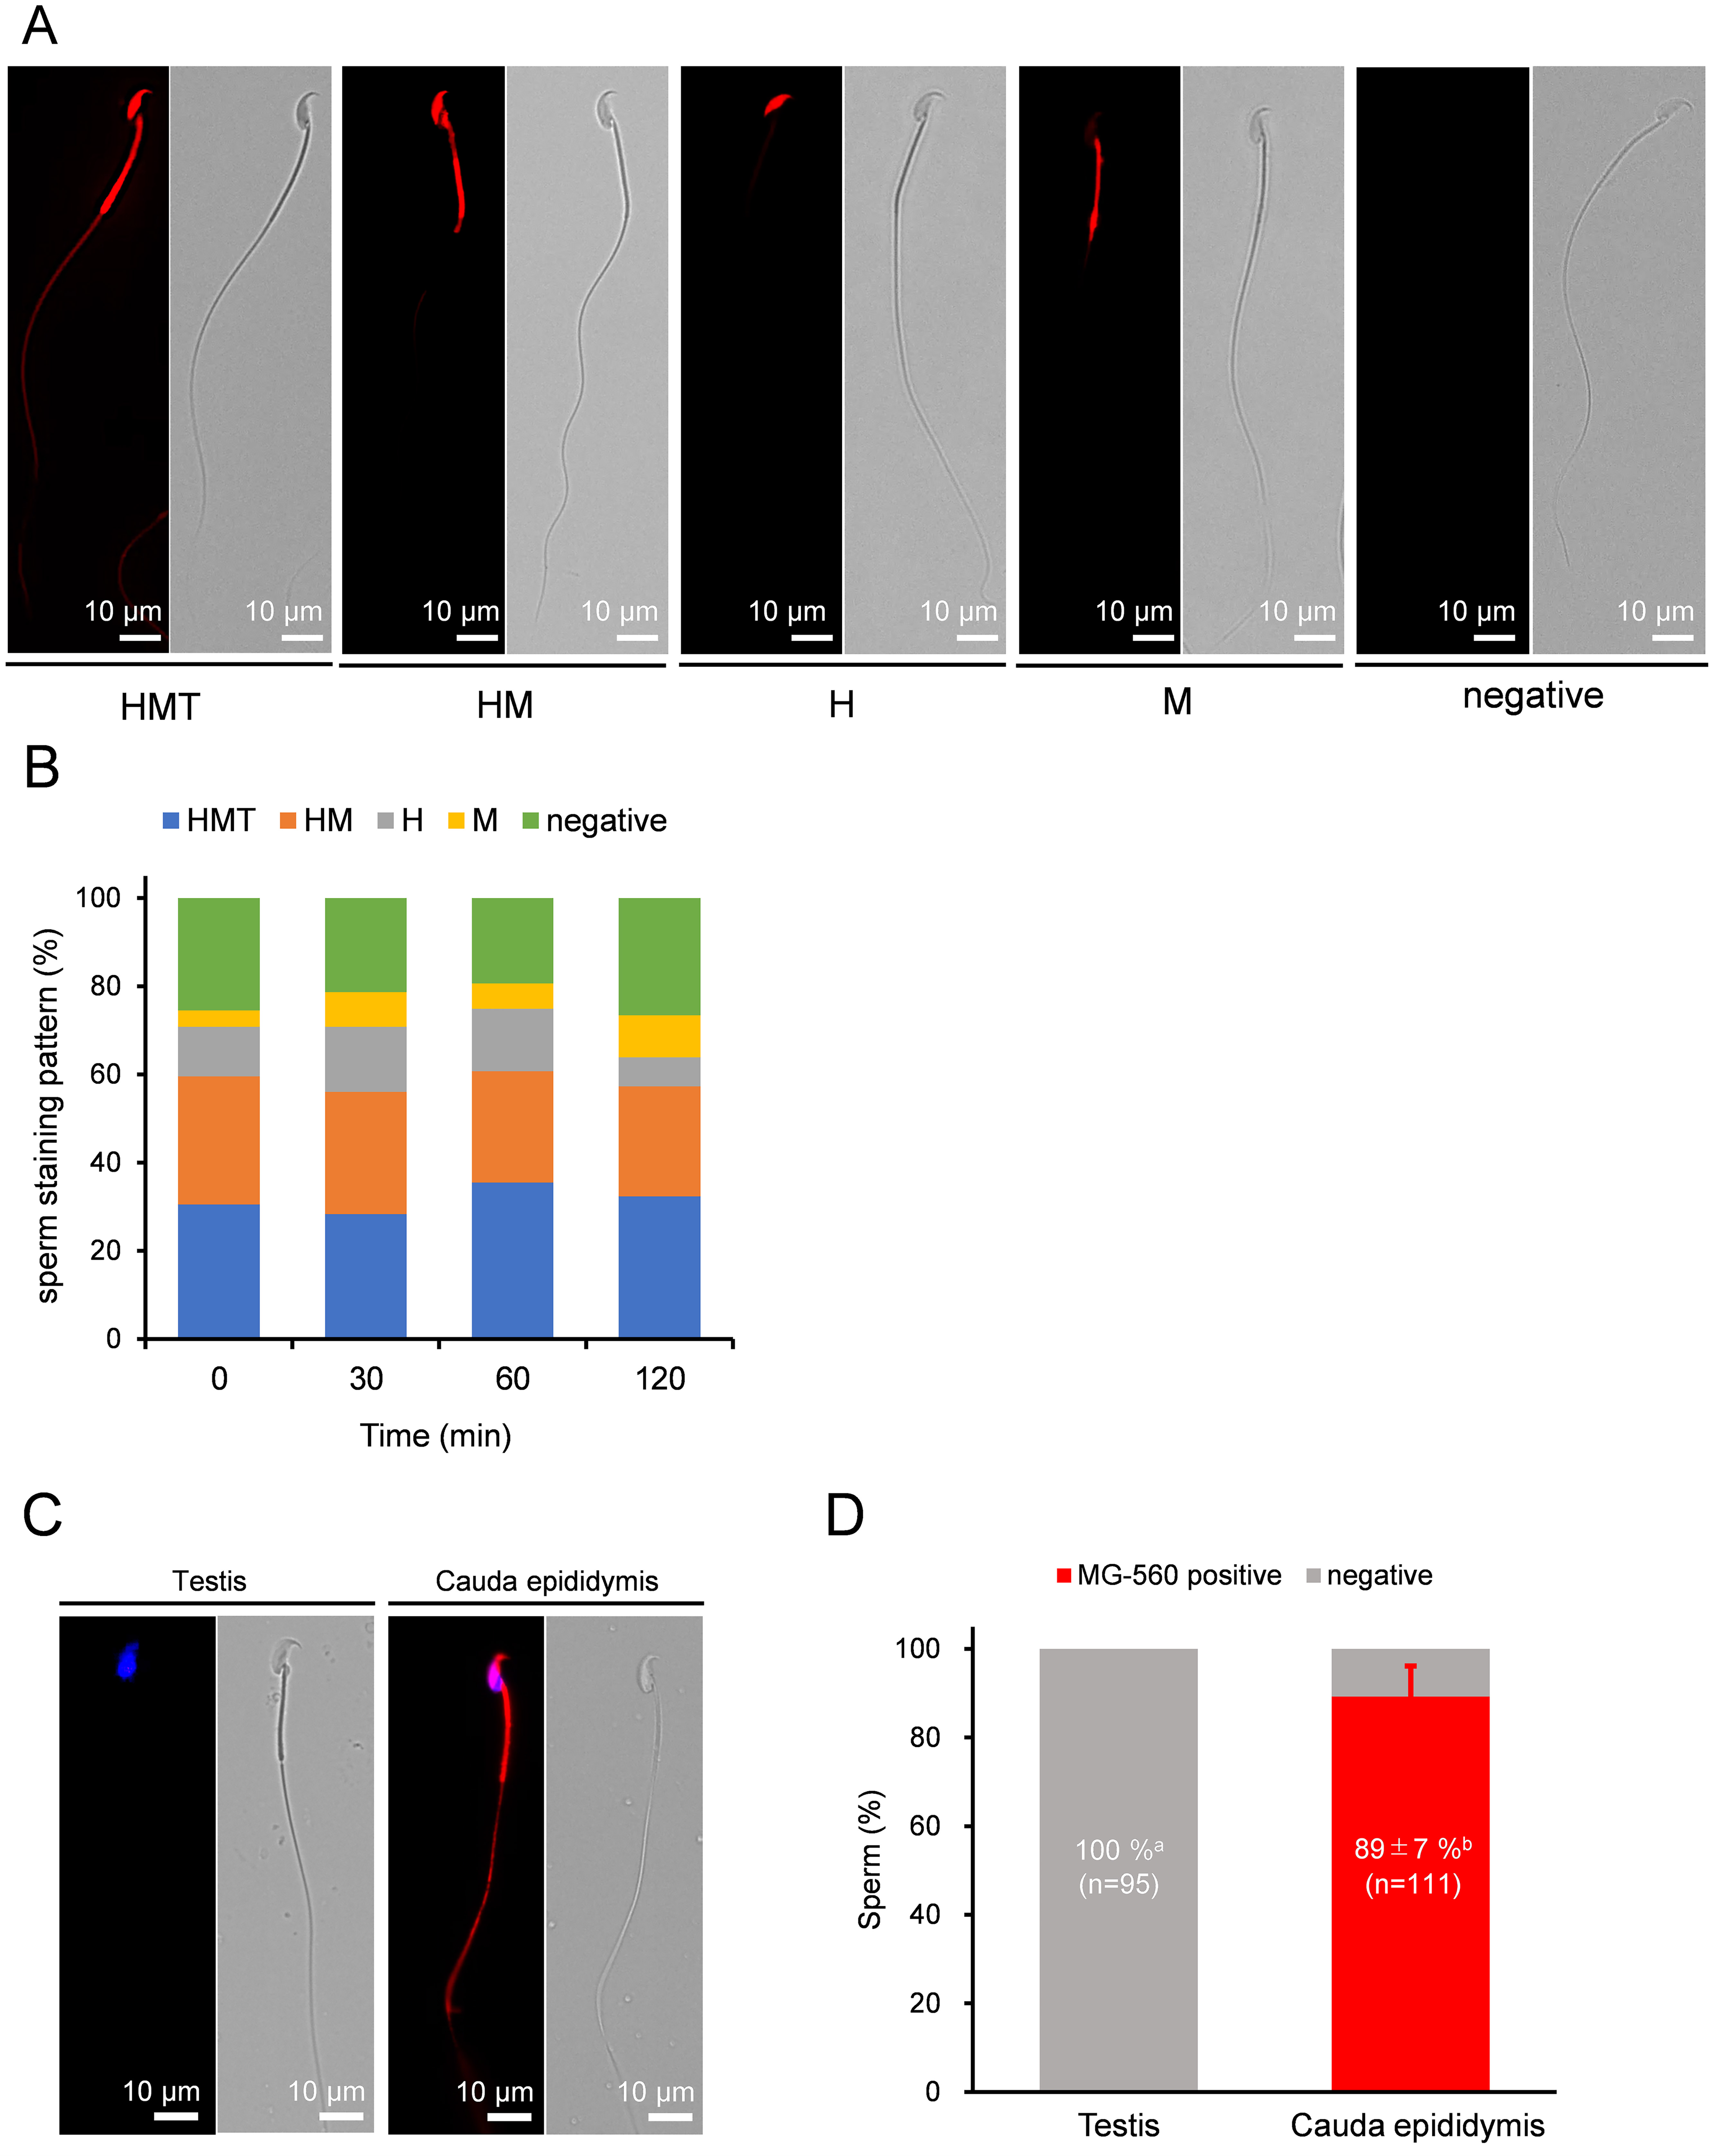 Fig. 1.
MG-560 staining patterns and dynamics of sperm. (A)
Representative fluorescent images of sperm staining patterns with MG-560 after
incubation. These patterns were classified into five groups: whole stained
pattern (HMT), head and midpiece stained pattern (M), head-only stained pattern
(H), midpiece-only stained pattern (M), and unstained pattern (negative). The scale
bar represents 10 µm. (B) The stacked bar graphs represent sperm staining
patterns with MG-560 after each incubation time. The percentage of each stained
pattern was calculated using the following equation: number of sperm with each
stained pattern/total number of examined sperm
Next, we stained immature sperm from the testis with MG-560. Unexpectedly, none of the testicular sperm were stained (Fig. 1C,D), indicating that sperm acquire MG-560 affinity while passing through the epididymis.
As stated earlier, we confirmed that sperm stained with MG-560 after incubation for capacitation did not show any changes in their staining pattern ratios. Next, we stained the sperm before incubation and observed them afterward, expecting changes in the patterns if phospholipid efflux affects MG-560 in the sperm PM. Indeed, the number of HMT-stained sperm dramatically decreased while the number of M-stained sperm increased, suggesting MG-560 efflux from the head and tail of the sperm (Fig. 2A).
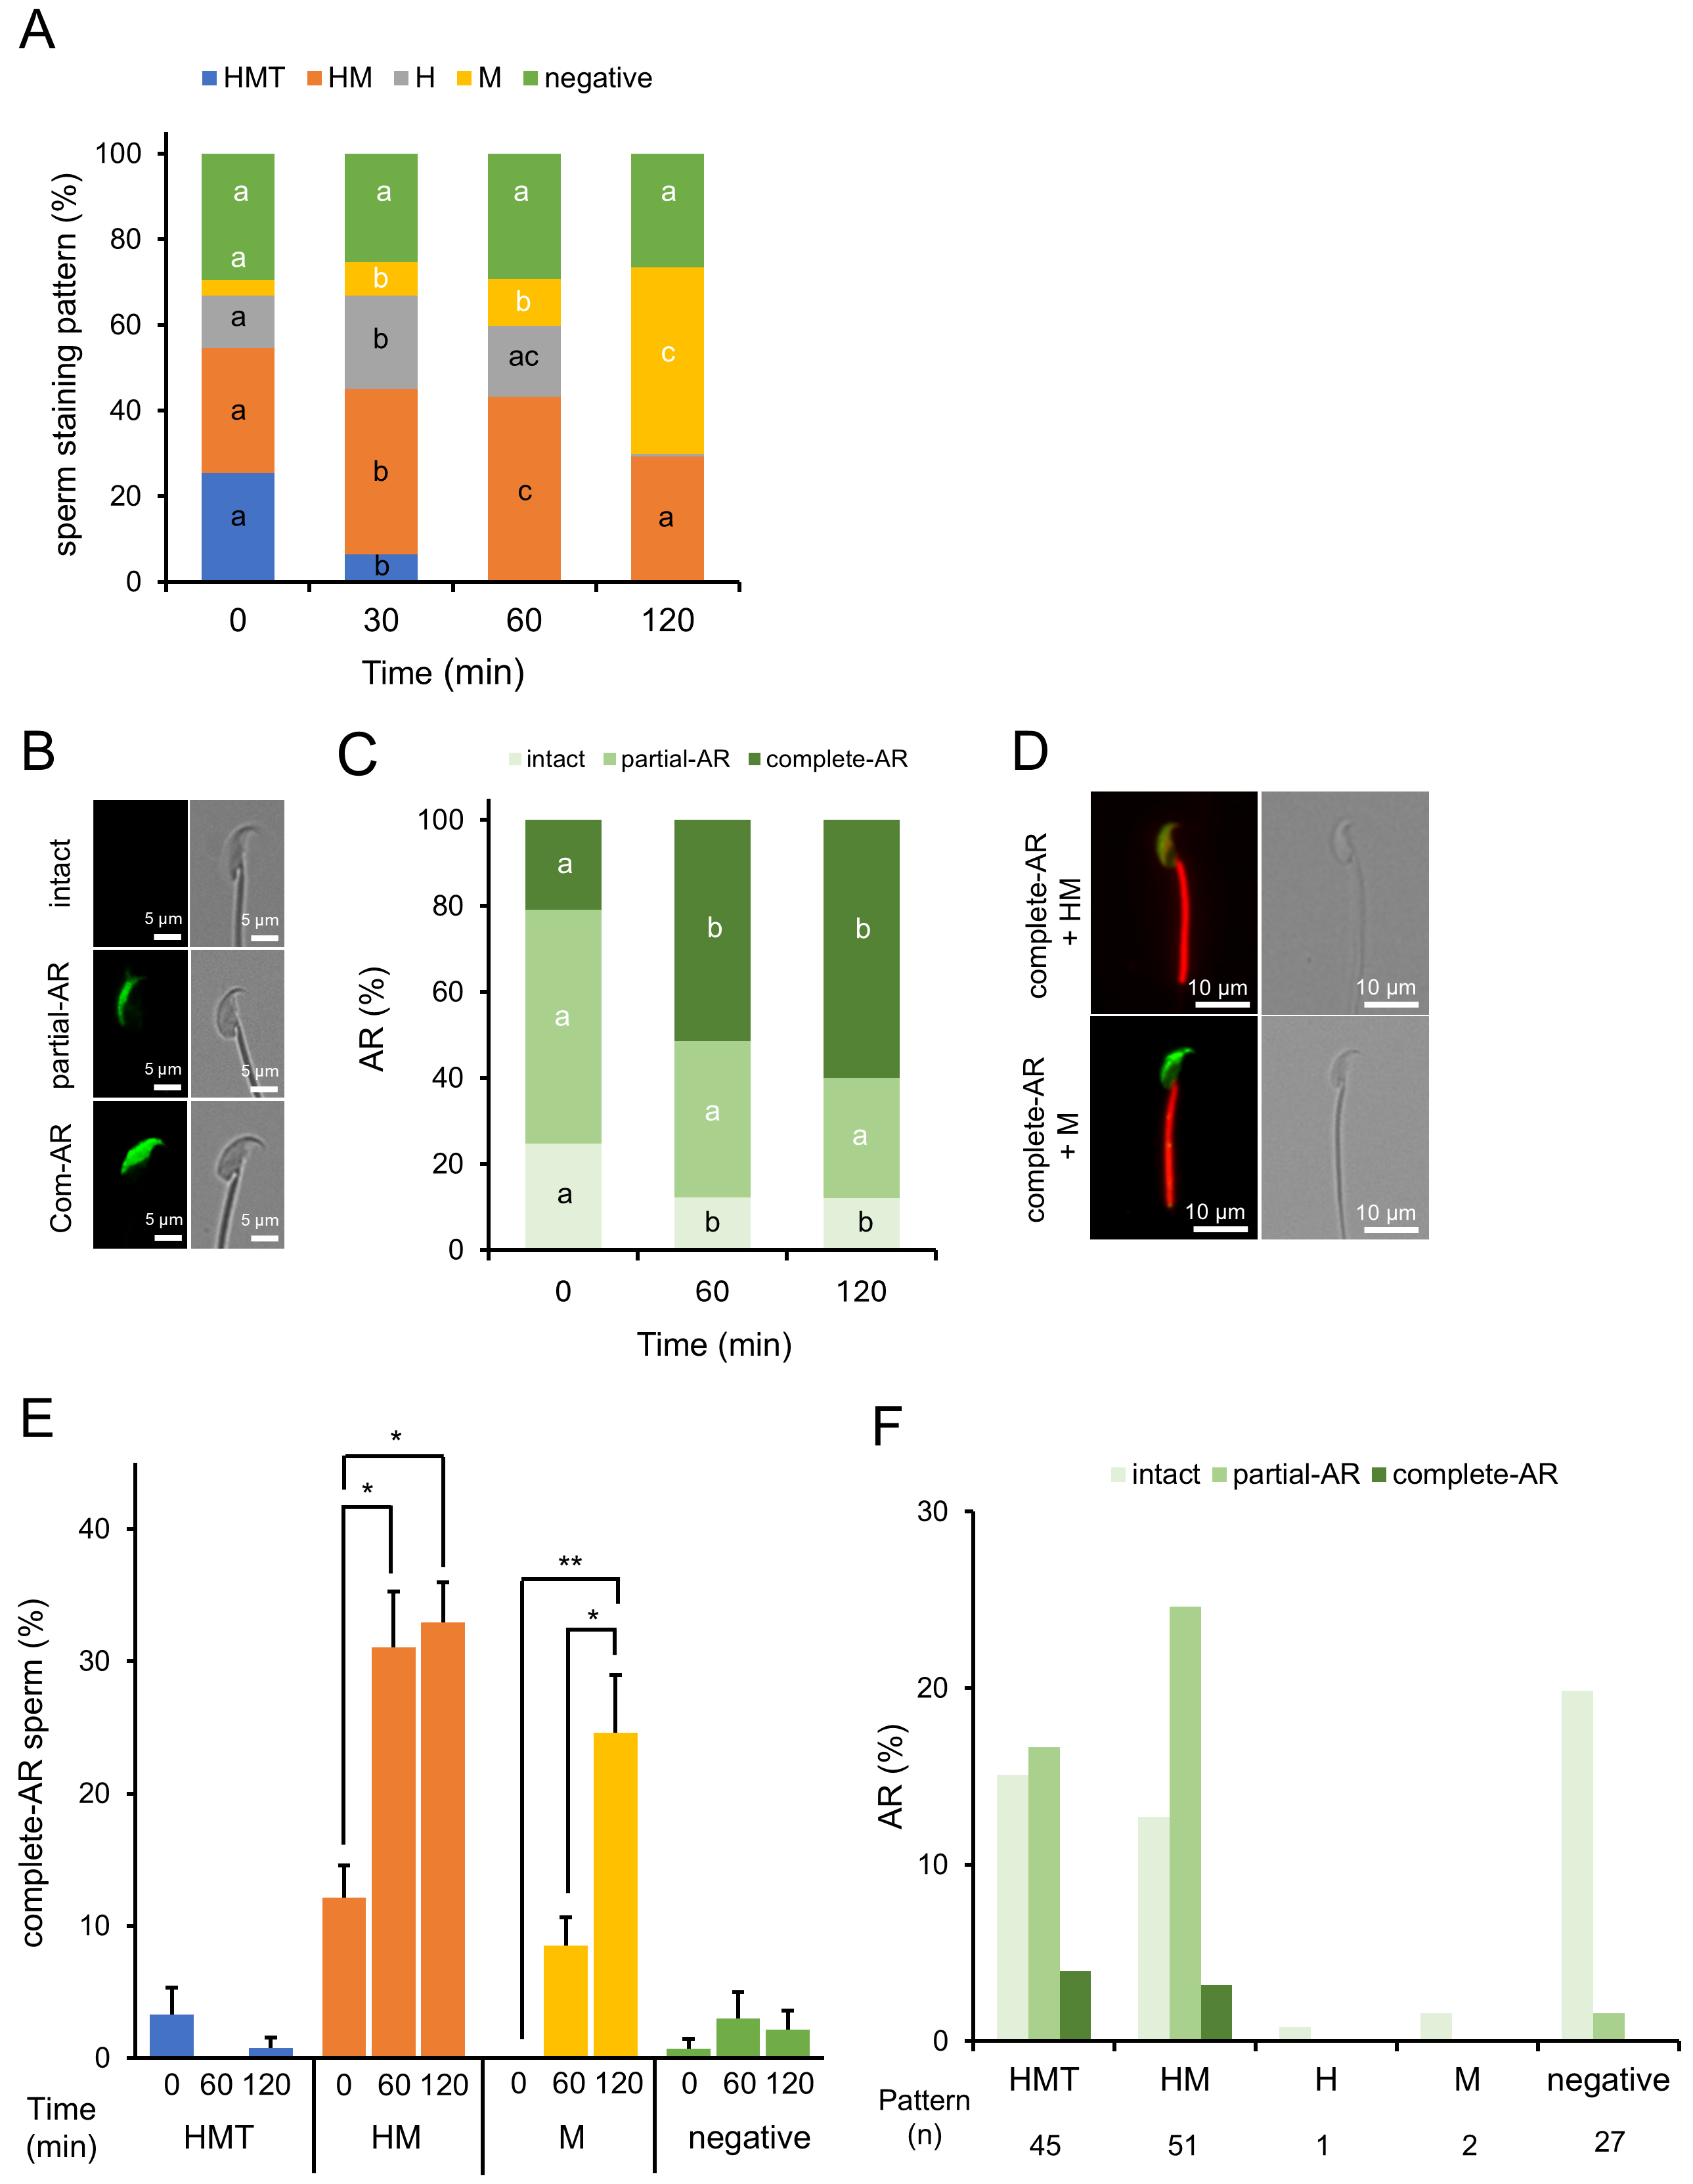 Fig. 2.
MG-560 pre-staining patterns and their dynamic changes in
sperm. (A) Dynamics of incubation time-dependent staining patterns in MG-560
pre-stained sperm. Sperm were stained with MG-560 immediately after collection
and incubated under capacitation conditions. Stacked bar graphs display the
proportions of staining patterns of pre-stained sperm at each incubation time.
Staining patterns were categorized as shown in Fig. 1A. The percentage of
sperm-stained pattern was calculated using the following equation: no. of each
stained pattern sperm/total no. of examined sperm
Since the acrosome reaction (AR) is a key marker for evaluating capacitation [19], we investigated the relationship between AR and MG-560 staining patterns in sperm. Acrosome-reacted sperm were assessed using peanut agglutinin FITC (PNA-Lectin FITC) on pre-stained sperm [20]. FITC fluorescence was detected in the head and expanded over time, even on pre-stained sperm with MG-560 (Fig. 2B–D). The majority of acrosome-reacted sperm exhibited HM- and M-stained patterns, suggesting that these populations have a higher capacity for undergoing the AR (Fig. 2E). Additionally, we examined whether negatively stained sperm could undergo the AR when stained after incubation, as shown in Fig. 1. None of the negatively stained sperm displayed complete AR (Fig. 2F), in contrast to the observation that some negatively stained sperm did undergo AR when pre-stained (Fig. 2E). These results suggest that the negatively pre-stained sperm include a distinctly different population from the negatively post-stained sperm. Specifically, a small population of negatively pre-stained sperm may have derived from HMT-, HM-, or M-stained sperm, which are capable of undergoing the AR.
To confirm that pre-staining sperm with MG-560 does not affect fertilization, we performed IVF using pre-stained sperm. The results showed that the fertilization rate and blastocyst rate of pre-stained sperm were similar to those of unstained sperm (Table 1), suggesting that staining sperm with MG-560 does not interfere with fertilization or subsequent development. After staining for 15 minutes, followed by a 60-minute incubation for capacitation, the sperm were inseminated into cumulus-oocyte complexes (COCs). Sixty minutes after insemination, a higher proportion of M-stained sperm was observed compared to pre-stained sperm (Fig. 3A), while the number of acrosome-reacted sperm remained comparable (Fig. 3B). As a result, M-stained sperm with completed AR increased (Fig. 3C). These results suggest that COCs enhance MG-560 efflux.
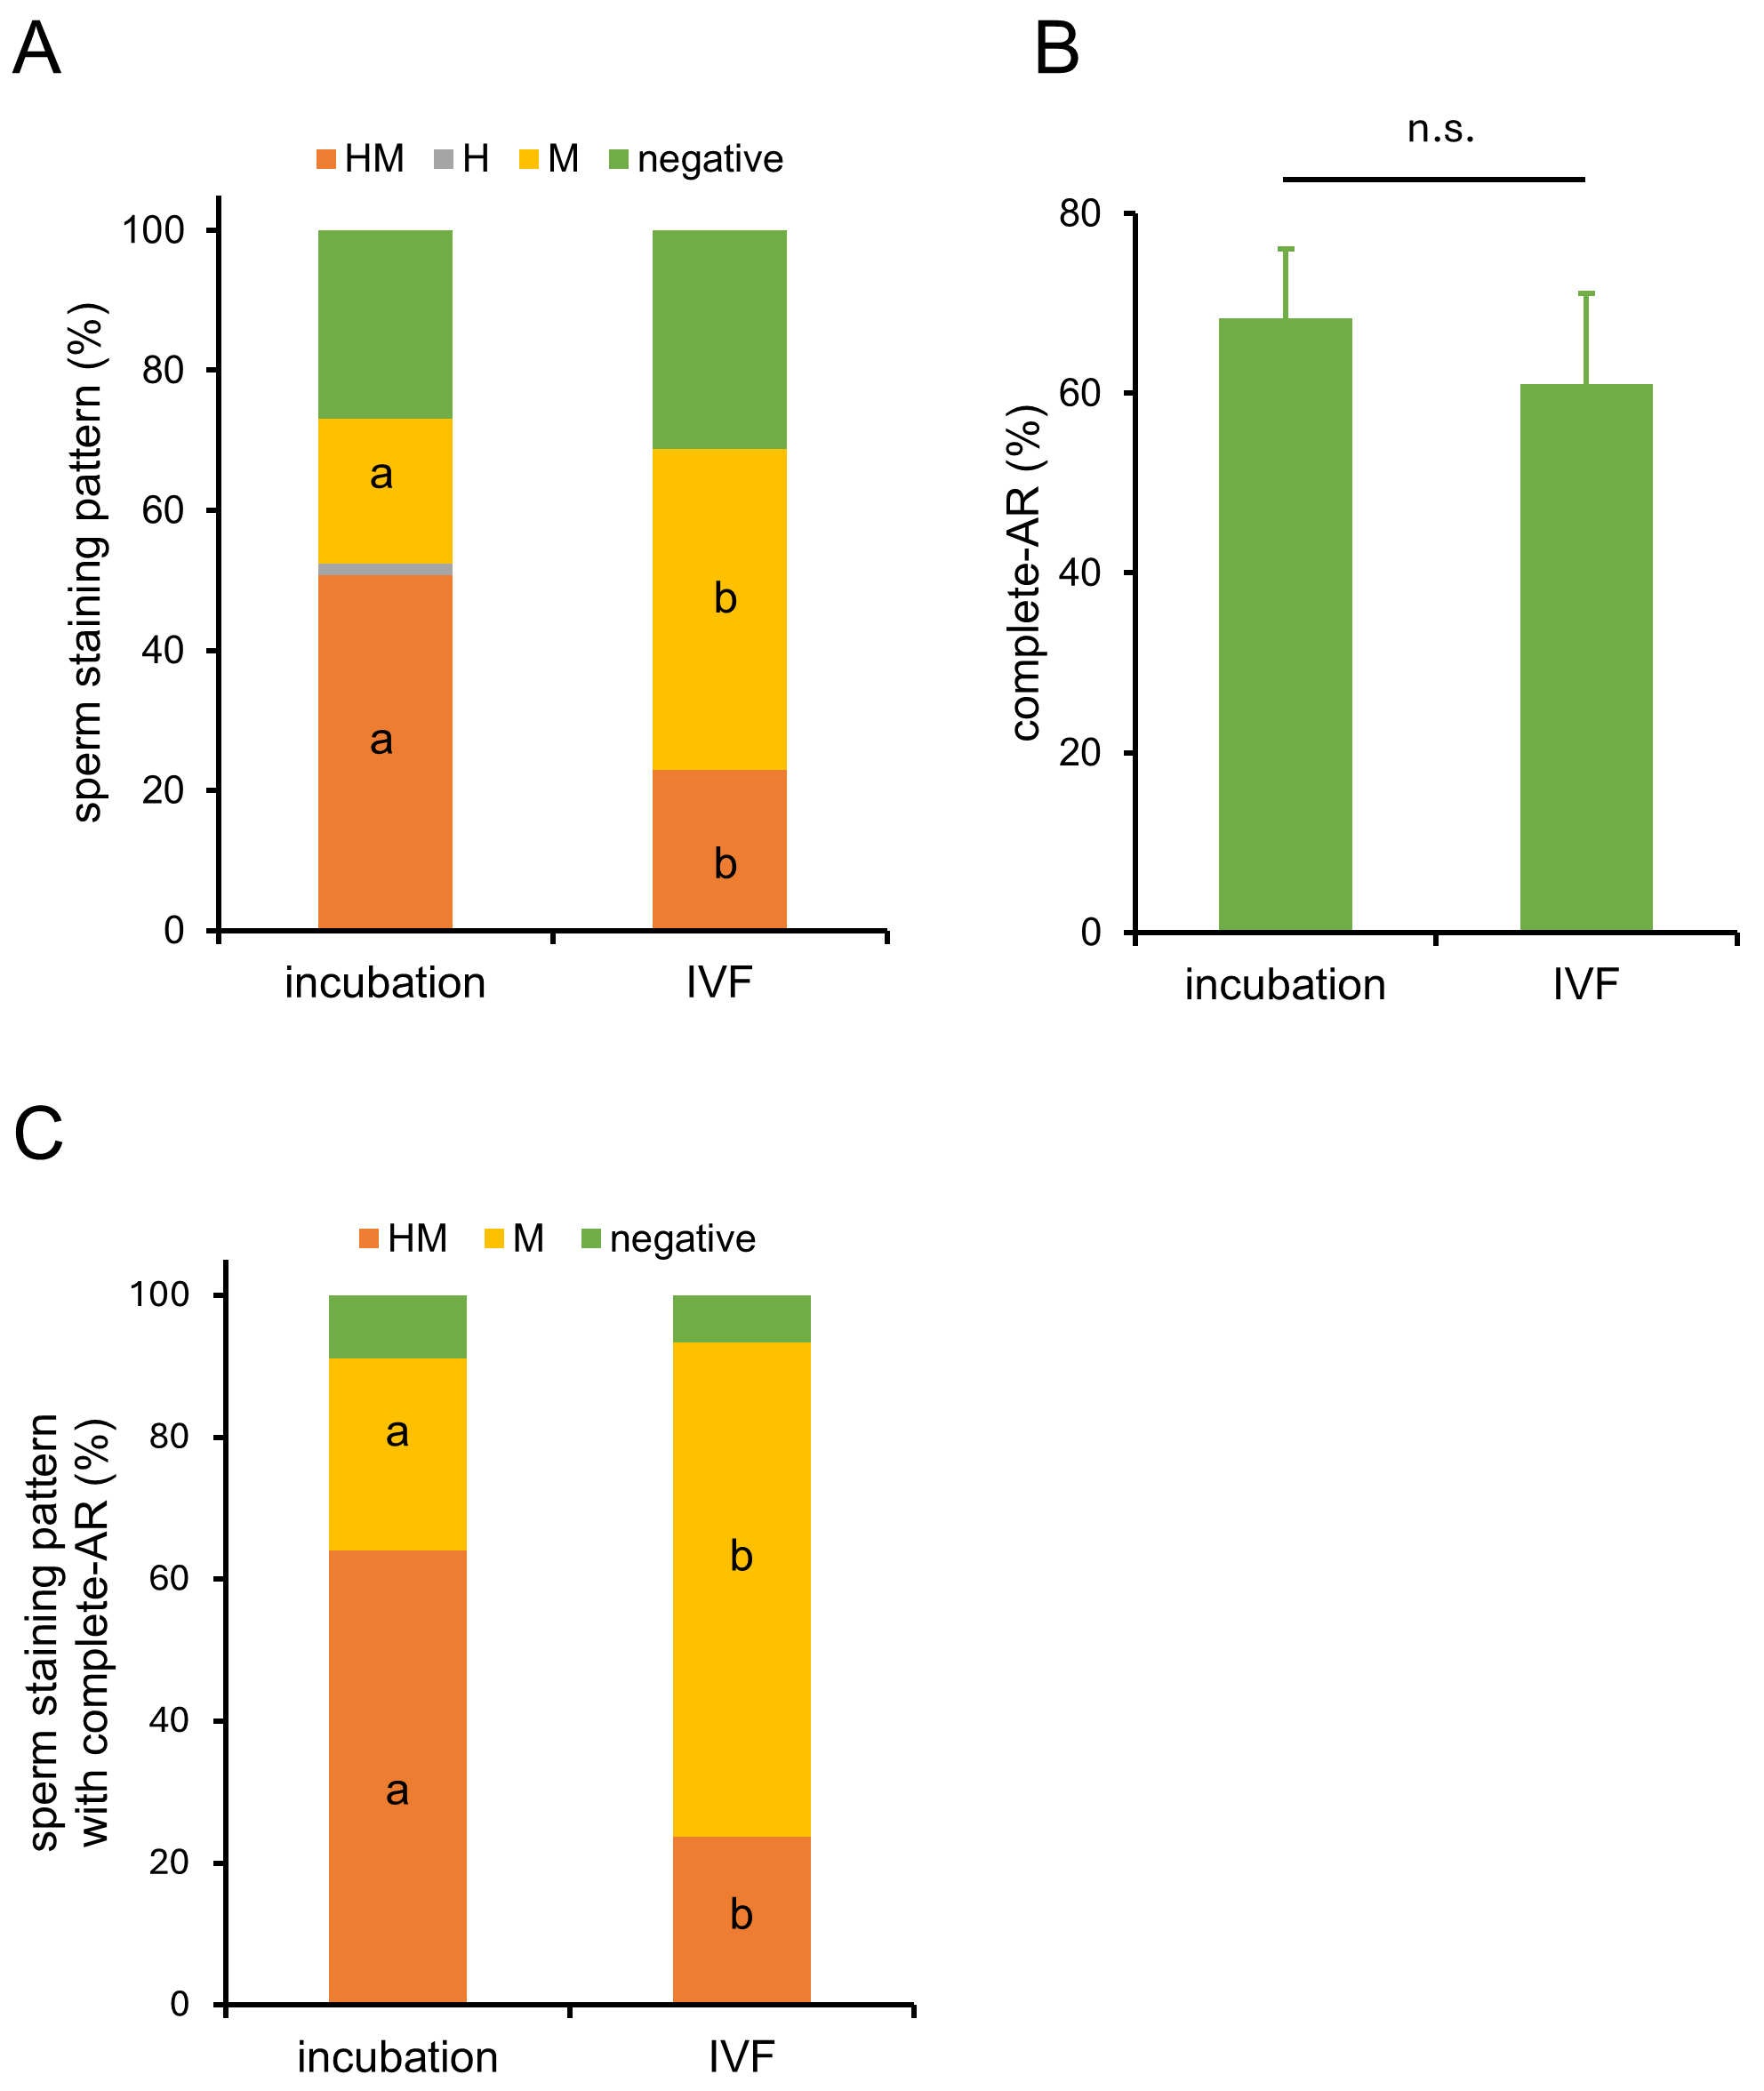 Fig. 3.
Dynamics of MG-560-stained sperm in the presence of
cumulus-oocyte complexes (COCs). (A) In vitro fertilization (IVF) was
performed using sperm stained with MG-560. After pre-staining with MG-560 and
incubating for 60 minutes to allow capacitation, these sperm were inseminated
without and with cumulus-oocyte complexes (‘incubation’, ‘IVF’ group,
respectively). Sixty minutes after insemination, sperm were collected and
observed using fluorescence microscopy. Stacked bar graphs display the percentage
of each stained patterns in incubation and IVF group. Values are given as means
(n = 4). Statistically significant differences were identified between the
percentages of HM- and M-patterns in the two groups. Different
characters show significant difference (p
| Sperm | No. of eggs | No. of fertilized embryos (%) | No. of blastocyst (%) |
| Control | 80 | 74 (92) | 72 (90) |
| MG-560-stained | 92 | 86 (93) | 82 (89) |
No significant differences were observed between treatments for either
fertilization or blastocyst rates (p
To elucidate the role of the cumulus oophorus and zona pellucida in the dynamics of the sperm membrane, we examined the staining patterns of pre-stained sperm reaching the zona pellucida (ZP) (Fig. 4A,B). Unexpectedly, the majority of these sperm were negative for staining (Fig. 4A,C). Consistently, only negatively stained sperm were found in the perivitelline space (PV) (Fig. 4A,C). These results suggest that the cumulus oophorus may contribute to the selection of negatively stained sperm or enhance MG-560 efflux, leading to the accumulation of negatively stained sperm on the zona pellucida (ZP). To examine this possibility, IVF was performed with denuded oocytes, lacking the surrounding cumulus cells. As a result, more HM-stained sperm were observed on the ZP (Fig. 4B,C). Nonetheless, only negatively stained sperm were still found in the perivitelline space (PV) (Fig. 4B,C). Taken together, these data suggest that only a population of pre-stained sperm negative for MG-560 can reach and penetrate the ZP to fertilize the oocyte.
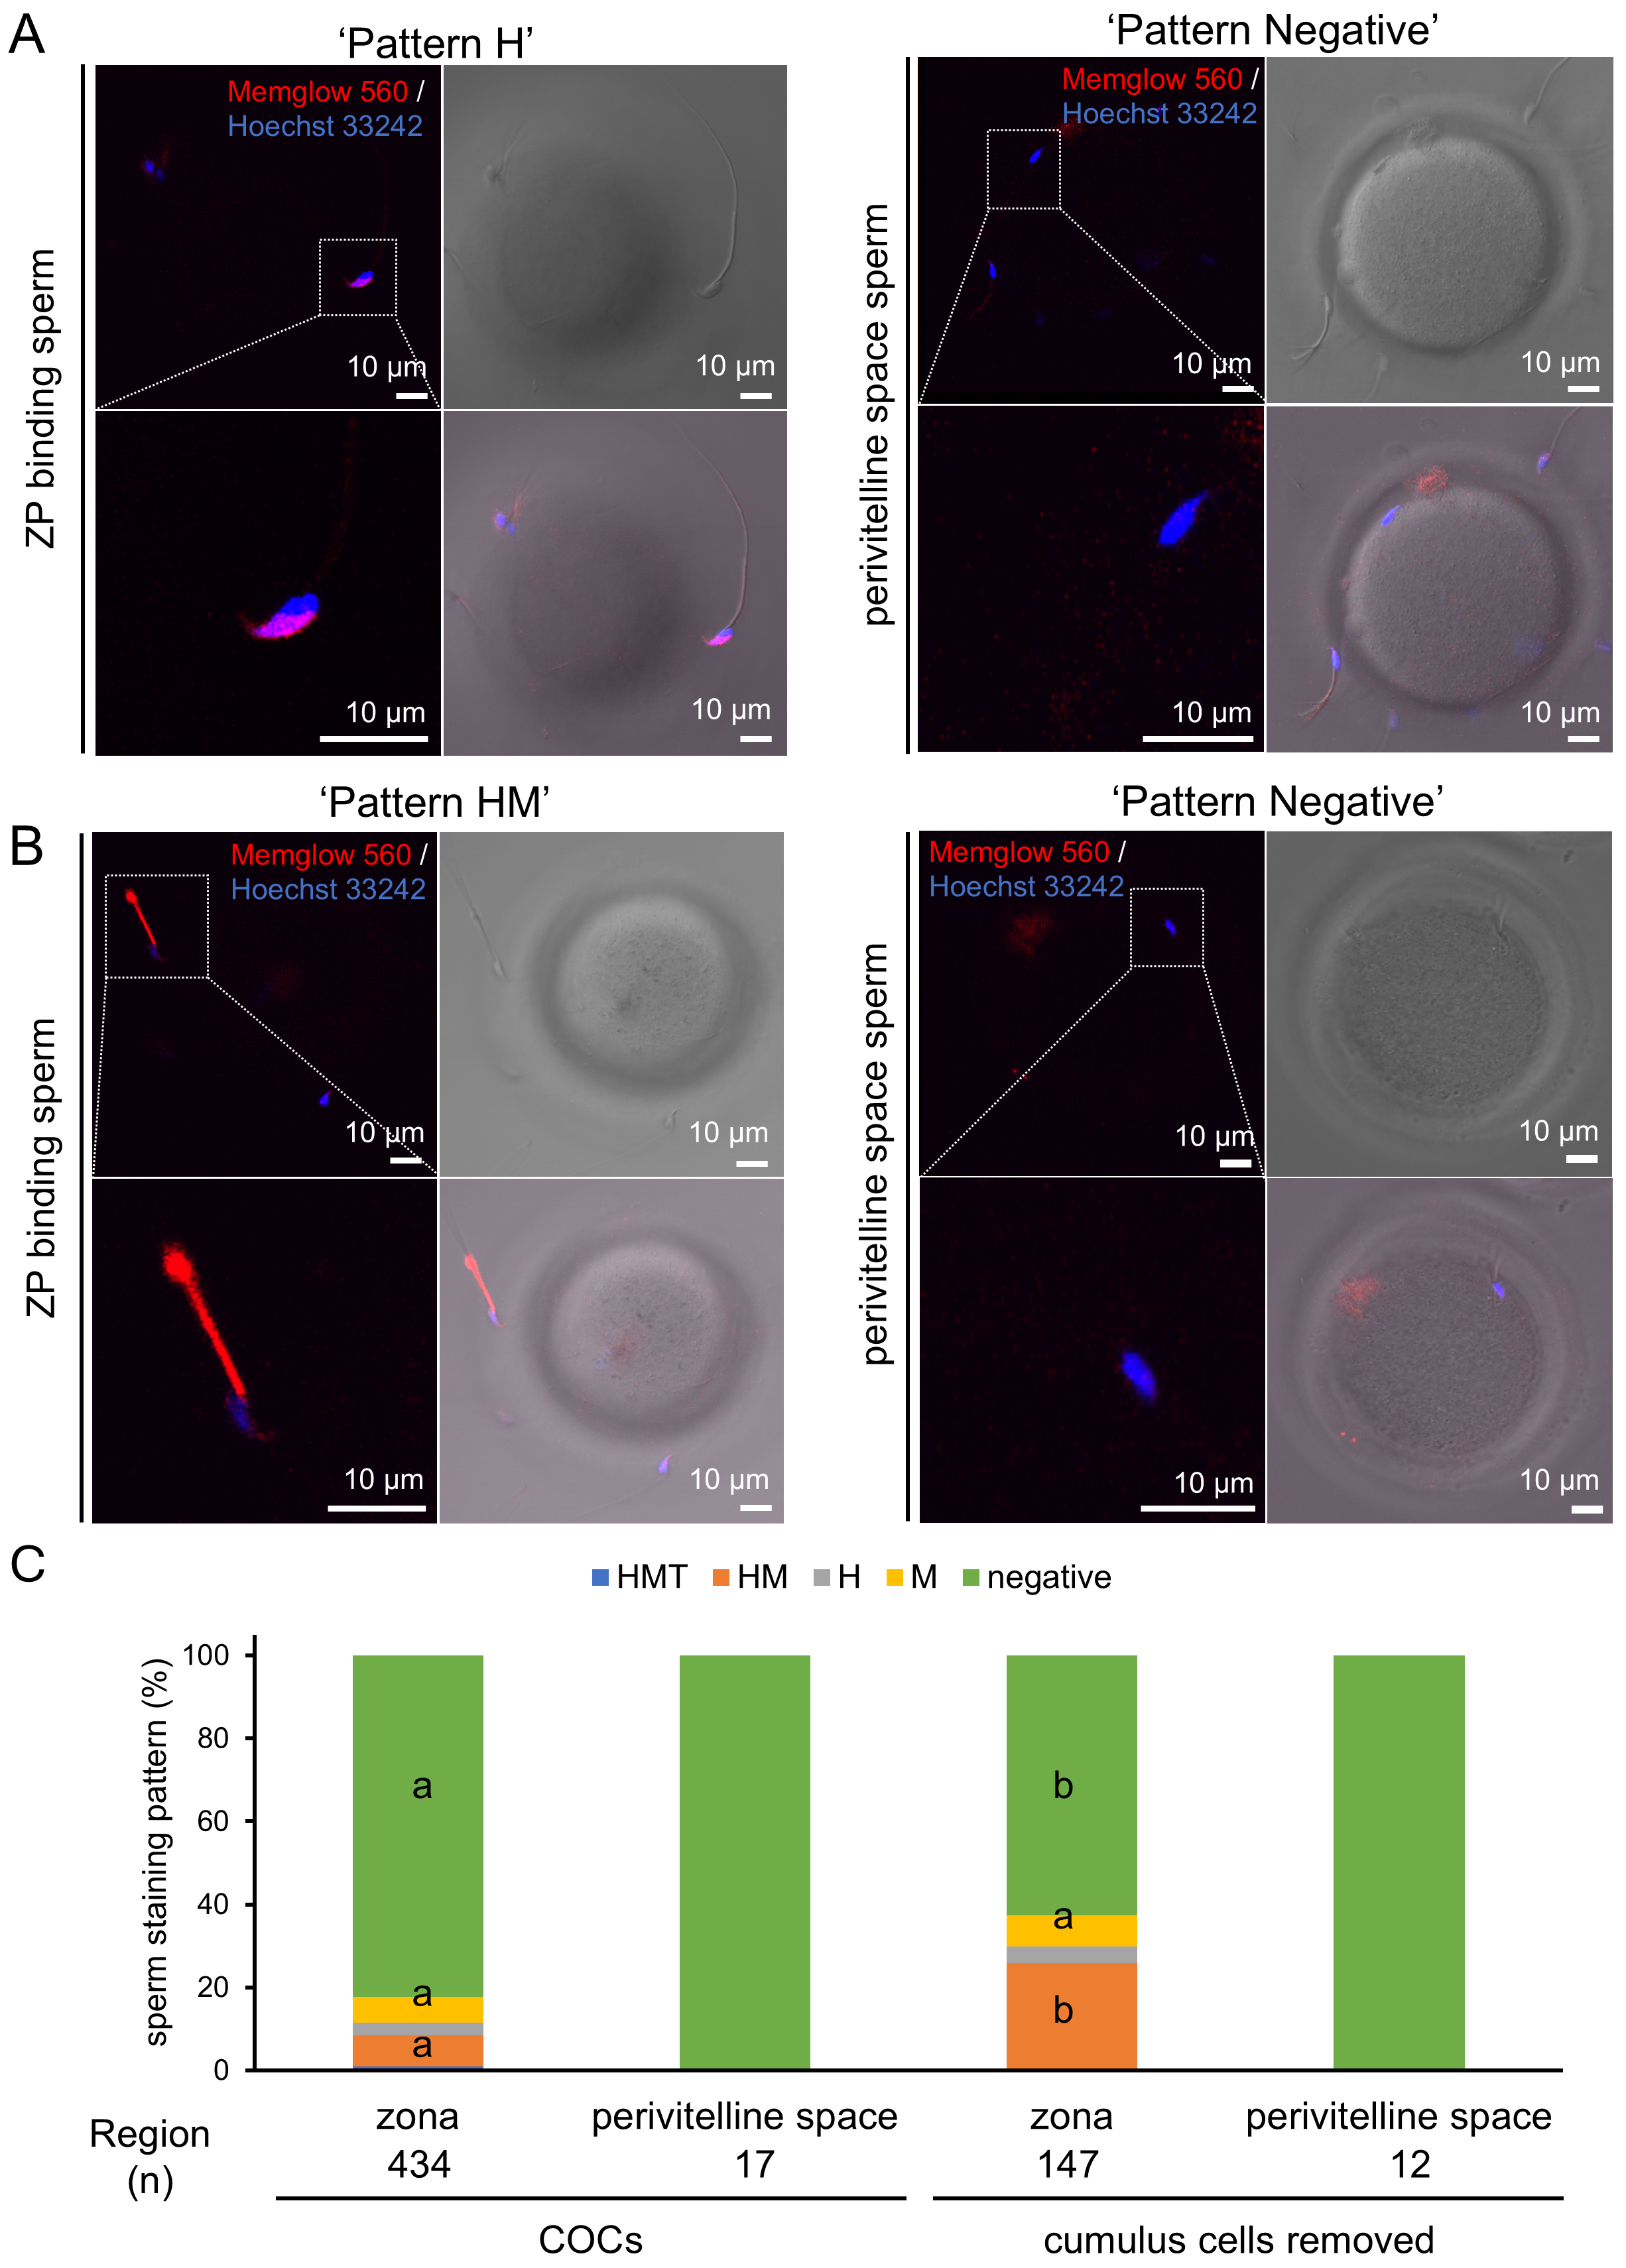 Fig. 4.
MG-560 staining patterns of sperm attached to the zona pellucida
and within the perivitelline space. (A) Sixty minutes after insemination into
cumulus-oocyte complexes (COCs), sperm attached to the zona pellucida and within
the perivitelline space were observed. MG-560 pre-stained sperm were found
binding to the zona pellucida (ZP) (left) or in the perivitelline space (right).
Scale bar represents 10 µm. (B) IVF was performed using denuded oocytes.
MG-560 pre-stained sperm were again found binding to the ZP (left) or in the
perivitelline space (right). Note that H-, M-, and negative-stained patterns are
indicated as representatives. Scale bar represents 10 µm. (C) The graph
represents the proportions of pre-staining patterns of sperm binding to ZP or
found in the perivitelline space. The data in the graph are shown for both
conditions: after IVF in the presence or absence of COCs. The number of examined
sperm in each group is indicated as (n). The percentage of each stained pattern
was calculated using the equation: number of sperm in each stained pattern/total
number of examined sperm
This study aimed to visualize heterogeneity in fluorescence-stained sperm membrane patterns and their dynamics towards fertilization via capacitation using the lipophilic dye MG-560 and to investigate whether the resulting staining patterns are linked to specific physiological states or sperm characteristics.
MG-560 is a MemBright probe composed of cyanine and two amphiphilic zwitterionic anchors, developed specifically for staining the plasma membrane (PM). MemBright, which aggregates in water, disassembles within lipid membranes, eliciting a fluorogenic response [21]. It generally stains the PM of various live cells, such as HeLa cells, and tissues like brain slices in a homogeneous manner due to its rapid diffusion within the lipid membrane, attributed to its small molecular structure. Unexpectedly, patterns of cauda epididymal sperm staining with MG-560 were categorized into five distinct types: whole sperm (HMT), head and midpiece (HM), head only (H), midpiece only (M), and no staining (negative). Although the underlying mechanism of this heterogeneity remains enigmatic, it is important to note that, despite the rapid diffusion within the lipid membrane, MG-560 did not diffuse uniformly across the head, midpiece, and tail regions of the sperm, suggesting boundaries between these regions. Sperm consists of three highly specialized regions: the head, involved in sperm-oocyte interaction; the midpiece, containing mitochondria responsible for energy production; and the flagellum, which drives motility. The sperm head plasma membrane is separated from the midpiece membrane by the posterior ring, while the midpiece is separated from the flagellum membrane by the annular ring [22]. These rings may act as boundaries that prevent diffusion between regions. To our knowledge, this study is the first to apply MemBright to mobile cells.
As mentioned earlier, the staining patterns of cauda epididymal sperm with MG-560 were unexpectedly varied, including a population of unstained sperm. In contrast, testicular sperm showed no staining across any region. Testicular spermatozoa are immobile and infertile, undergoing significant modifications in lipid content and composition during epididymal transit [23]. For example, the levels of phosphatidylcholine and phosphatidylethanolamine decrease, while plasmenylcholine becomes the dominant phospholipid. Although MG-560’s lipid preference remains unclear [21] and the possibility of insufficient staining cannot be excluded, the absence of staining in some cauda epididymal sperm, or in specific regions such as the head, midpiece, and tail, could reflect immaturity in the membrane composition, similar to that of testicular sperm. Supporting this, none of the stain-negative sperm underwent acrosome reaction.
To visualize dynamic changes in membrane composition, we examined how membrane staining patterns changed when sperm were stained with MG-560 prior to incubation for capacitation. We confirmed that when MG-560 was used at concentrations below 50 nM, this pre-staining method did not affect the fertilization rate in IVF, suggesting that staining with MG-560 did not disrupt any physiological processes involved in fertilization. Moreover, this approach allowed us to track fluorescence changes during capacitation, which are expected to reflect changes in membrane composition, particularly the efflux of phospholipids. As a result, the number of HMT-stained sperm decreased, while the number of M-stained sperm increased over time during capacitation, suggesting MG-560 efflux from the head and tail. Cholesterol efflux from the sperm membrane is well-known as a trigger for capacitation [24, 25, 26, 27]. Reduction of cholesterol in the sperm membrane increases membrane fluidity and changes the localization of lipid rafts to induce the acrosome reaction. Albumin is a popular cholesterol acceptor for IVF [28]. As a result, the decrease in the cholesterol/phospholipid ratio occurs during capacitation [18, 29]. Recently, it is also demonstrated that efflux of phospholipids from the sperm membrane can induce sperm capacitation, showing that an increase in the cholesterol/phospholipid ratio can also induce capacitation by increasing membrane fluidity [19]. While bovine serum albumin (BSA) gradually induces cholesterol efflux in sperm, it significantly enhances phospholipid efflux [19]. The disappearance of MG-560 fluorescence in sperm during capacitation could reflect the efflux of lipids from the sperm membrane.
In vivo, mouse sperm undergo the AR before ascending from the isthmus to the ampulla within the oviduct [30, 31, 32]. In contrast, in vitro, acrosome-intact sperm adhere to the surface of the ZP before undergoing the AR, with ZP3 considered the AR-inducing component of the zona [33]. This discrepancy remains enigmatic [34]. Furthermore, BSA in the medium stimulates the acrosome reaction by increasing sperm membrane fluidity, even in the absence of oocytes to increase the fertilization rate [19]. In this study, pre-stained sperm with acrosome reaction (AR) confirmed by PNA-Lectin-FITC staining increased during incubation for capacitation in the absence of oocytes, predominantly exhibiting either the HM- or M-stained pattern. These results suggest that HM- or M-stained sperm have a higher potential for undergoing AR.
After IVF, the majority of sperm attached to the ZP were unexpectedly negative for MG-560. Additionally, all sperm detected in the perivitelline space were also negative. These data suggest that only negative-stained sperm can fertilize oocytes. Since negative-stained sperm after incubation did not undergo the acrosome reaction but negative pre-stained sperm did, these negative-stained sperm around the ZP were likely derived from HMT-, HM-, or M-stained sperm. Interestingly, in the absence of cumulus cells (CCs), more HM-stained sperm attached to the ZP of denuded oocytes in proportion to their staining ratios. Therefore, cumulus cells could enhance MG-560 efflux from sperm to make them negative or play a role in selecting negative-stained sperm. The interaction between sperm and CCs has been shown to induce physiological changes in the sperm, enabling them to acquire the ability to fertilize [35, 36]. Sperm that pass through the cumulus oophorus exhibit higher rates of normal morphology and acrosome reaction, with improved motility patterns [37]. Furthermore, cumulus-oocyte complexes (COCs) can be used to select sperm for intracytoplasmic sperm injection (ICSI), leading to better blastocyst development and quality [38]. Taken together, our results suggest the following sequence: MG-560 in the pre-stained mature sperm membrane is first released from the tail, preparing the sperm for the AR. As a result, HM- and M-stained sperm lose more MG-560, including from the midpiece, while passing through the cumulus oophorus. Finally, sperm that are completely devoid of MG-560 are able to penetrate the zona pellucida (ZP) and fertilize the oocyte.
This study successfully achieved the indirect visualization of sperm membrane dynamics before fertilization using MG-560, a fluorescent dye specific to the plasma membrane. Our results strongly suggest that the staining patterns of sperm with MG-560 are likely associated with their physiological states, providing new insights into the physiological changes sperm undergo for fertilization. On the other hand, the mechanism underlying this association, including the lipid preference of MG-560, remains unclear. Further studies are required to clarify the detailed process by which pre-stained sperm lose MG-560 staining during fertilization. In future research, it will also be important to examine the developmental potential of sperm corresponding to each staining pattern and to investigate the in vivo dynamics of the sperm membrane using artificial insemination with pre-stained sperm. These studies could also provide new insights into assessing human sperm dysfunction, including sperm immaturity underlying male fertility, through the use of MG-560 staining.
This study successfully visualized sperm membrane dynamics during capacitation using a fluorescent dye specific to phospholipids. The staining patterns of mature sperm membranes exhibited heterogeneity, both within individual sperm and between different sperm populations. Furthermore, these patterns changed dynamically during capacitation. Notably, only unstained sperm were able to penetrate the zona pellucida. Therefore, the observed staining patterns reflect the physiological states and characteristics of sperm, offering valuable insights into the process of capacitation and fertilization.
All raw data for this study are available from the corresponding author.
MH and SK designed the research study. MH performed the research. SK provided help and advice on all research. MH analyzed the data. MH and SK wrote the manuscript. Both authors contributed to editorial changes in the manuscript. Both authors read and approved the final manuscript. Both authors have participated sufficiently in the work and agreed to be accountable for all aspects of the work.
All the animal experiments were approved by the Animal Experimentation Committee at the University of Yamanashi, Japan, and conducted in accordance with the ethical guidelines (protocol number A4-10).
We gratefully acknowledge discussions and technical support with Dr. H. Harayama in Kobe University, Drs. T. Wakayama, S. Wakayama, D. Ito, and Ms. Y. Kanda at the Advanced Biotechnology Center, and also Ms. S. Furusato at the Center for advanced Assisted Reproductive Technologies, University of Yamanashi as well as all the lab members.
This work was supported by JSPS KAKENHI Grant (Numbers 20K06443 and 24K01937 to SK).
The authors declare no conflict of interest.
References
Publisher’s Note: IMR Press stays neutral with regard to jurisdictional claims in published maps and institutional affiliations.