


 , Xiaohong Ji 2,†, Hengmei Shi 2, Sicong Liu 1, Hong Yu 1,*
1 Department of Obstetrics and Gynecology, Zhongda Hospital, School of Medicine, Southeast University, 210000 Nanjing, Jiangsu, China
2 Department of Obstetrics and Gynecology, Women’s Hospital of Nanjing Medical University, Nanjing Women and Children’s Healthcare Hospital, 210000 Nanjing, Jiangsu, China
†These authors contributed equally.
Abstract
Pre-eclampsia (PE) is a gestational disorder that significantly endangers maternal and fetal health. Transfer ribonucleic acid (tRNA)-derived small RNAs (tsRNAs) are important in the progression and diagnosis of various diseases. However, their role in the development of PE is unclear. Consequently, we detected the expression profiles of tsRNAs in the plasma of patients with PE as well as those in the plasma of the healthy control group, and a multiplicity of experiments were conducted with the aim of clarifying their roles in the occurrence and development of PE and the feasibility of serving as predictive biomarkers for this disorder.
High-throughput sequencing of tsRNA in plasma from PE cases was performed to evaluate its potential as a diagnostic or therapeutic biomarker. The function of tsRNA in trophoblasts was explored using the HTR-8/SVneo cell line. Plasma from pregnant women with suspected PE was analyzed to assess the potential of tsRNA to act as a predictive marker of PE.
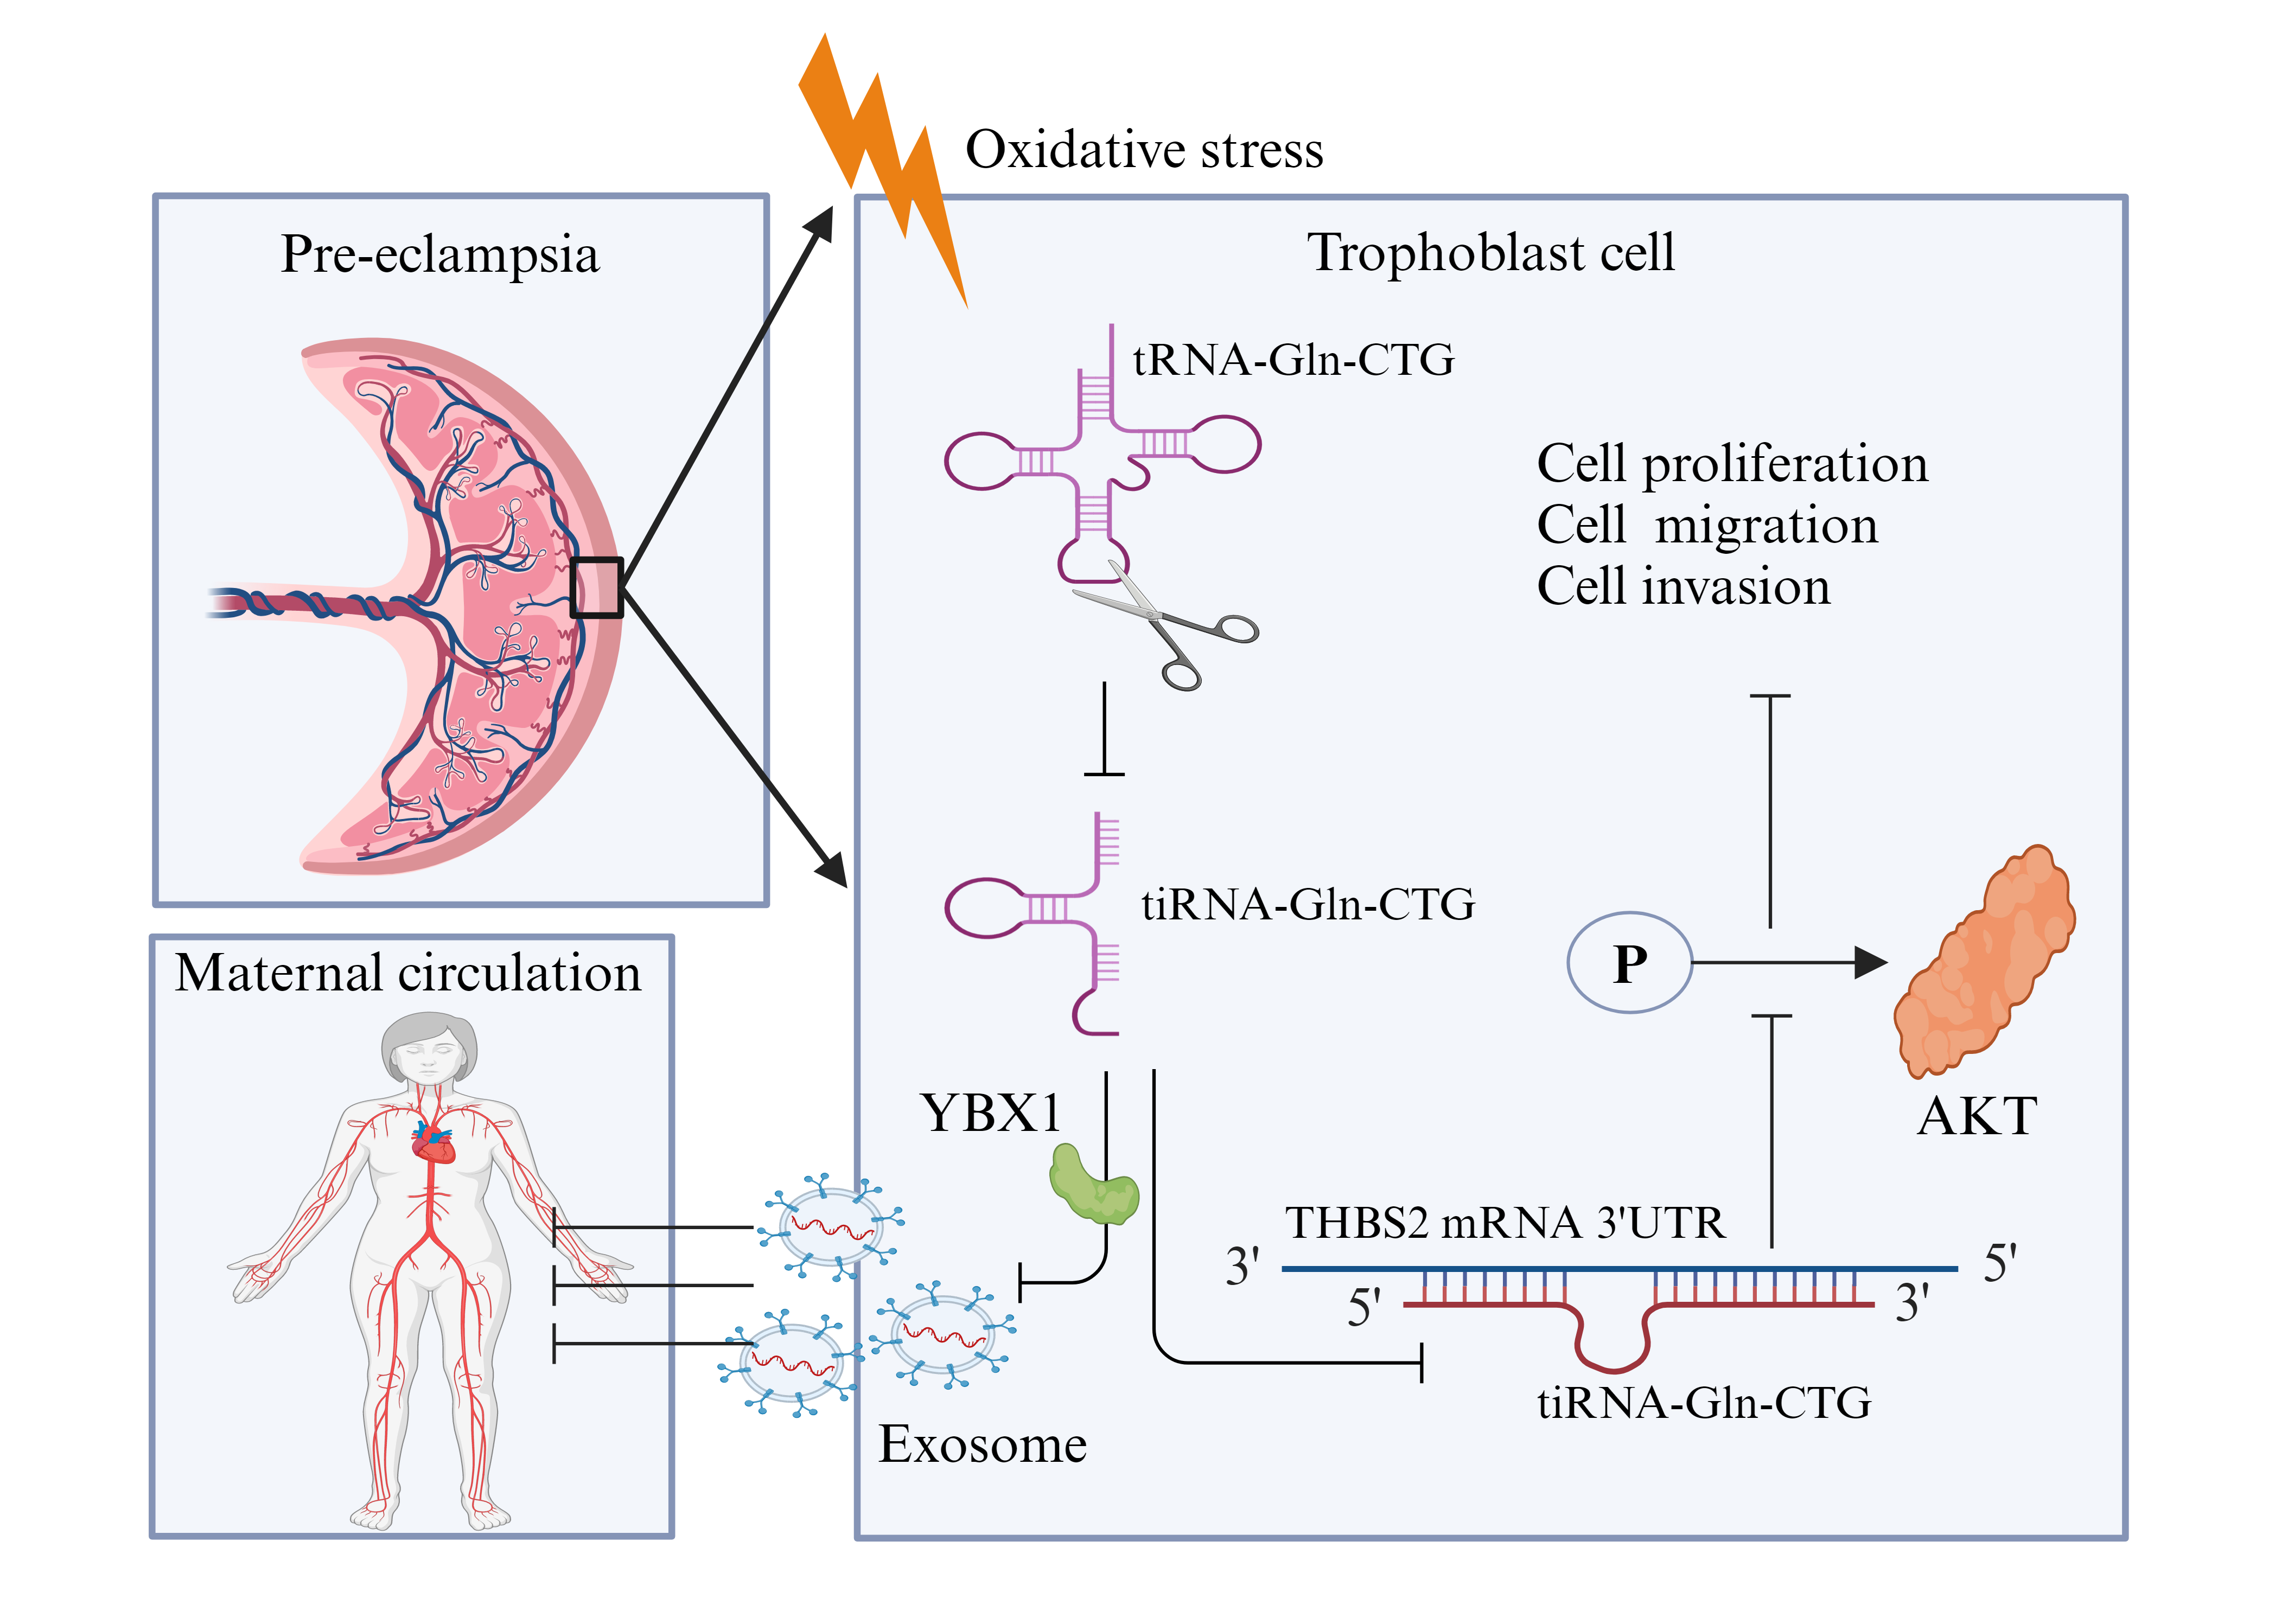
High-throughput sequencing of tsRNA was performed on plasma from pregnant women with PE and from healthy pregnant controls. Analysis revealed a significant reduction in the level of tRNA-derived stress-inducing RNA (tiRNA)-Gln-CTG in the plasma (p < 0.001) and placenta (p < 0.001) of pregnant women with PE, suggesting its potential involvement in the development of this condition. tiRNA-Gln-CTG was identified in the cytoplasm and nucleus of HTR-8/SVneo cells. In vitro experiments revealed that tiRNA-Gln-CTG influences the proliferation, cycling, migration, and invasion of HTR-8/SVneo cells, possibly by targeting the 3′UTR region of thrombospondin-2 messenger ribonucleic acid (mRNA) for degradation. Extracellular vesicle (EV) carriers may mediate the level of tiRNA-Gln-CTG in the circulation. Y-box binding protein-1 (YBX1) may be involved in loading tiRNA-Gln-CTG into EVs. The sensitivity of low tiRNA-Gln-CTG levels for predicting the onset of PE in suspected cases was 91.7% within 1 week of delivery, 85.7% within 4 weeks of delivery, and 89.3% before delivery, with corresponding specificities of 84.5%, 79.2%, and 73.4%, respectively.
tiRNA-Gln-CTG significantly influences trophoblast function and is associated with the development of PE. It can serve as an effective biomarker for predicting PE progression within one week of delivery in women with suspected PE.
Graphical Abstract
Keywords
- tRNA-derived small RNA
- tiRNA-Gln-CTG
- pre-eclampsia
- biomarker
Pre-eclampsia (PE) is a complex disorder that affects multiple systems during pregnancy. It has a critical effect on maternal mortality and morbidity, as well as on perinatal mortality [1, 2]. PE is characterized by abnormal perfusion of the placenta, resulting in the release of soluble factors into the bloodstream. This leads to endothelial damage within the maternal vasculature, ultimately causing hypertension and multi-organ impairment. Low-dose aspirin prophylaxis reduces the risk of preterm PE. However, once PE is diagnosed the only effective treatment is labor induction and delivery, since there is no medication that prevents the progression of this condition [3]. The widely accepted ‘two-stage’ theory of PE pathogenesis involves, (1) inadequate spiral-artery remodeling due to reduced trophoblast invasion, and (2) systemic vascular damage from placental hypoperfusion [4]. It is therefore crucial to identify predictive diagnostic markers and therapeutic targets based on this pathogenesis.
Transfer ribonucleic acid (tRNA)-derived small RNA (tsRNA) is a novel type of small noncoding RNA (sncRNA) that has recently been identified thanks to advances in high-throughput sequencing and bioinformatics analyses. tsRNA is categorized into tRNA-derived fragments (tRF) and tRNA-derived stress-inducing RNA (tiRNA, or tRNA-half) based on the cleavage site and length [5]. tRFs, including 5-tRF, 3-tRF, 1-tRF, and i-tRF, are 14–30 nucleotide sequences derived from mature or precursor tRNAs. Under conditions of stress, the mature tRNA anticodon loop is predominantly cleaved, producing 5′-half and 3′-half tiRNAs that are 29–50 nucleotides in length [6, 7, 8]. Emerging evidence indicates that tsRNAs influence the progression of disease and cancer by participating in biological processes such as gene silencing and protein translation [5, 9]. tsRNA is considered to be a potential biomarker of various diseases, including acute myeloid leukemia [10], lupus nephritis [11], and lung cancer [12]. Furthermore, tsRNA has been shown to play a role in the development of colorectal [13], gastric [14], and breast [15] cancer. Maternal immune activation significantly alters tsRNA expression at the maternal-fetal interface in mice [16]. Palmitic acid treatment significantly reduces tRNA-Gly-derived tiRNA levels in trophoblast cells, thereby influencing the regulation of trophoblast apoptosis [17]. In addition, alterations in tissue tsRNA expression levels lead to changes in circulating tsRNA constitutive profiles. The investigation of tsRNA expression levels as potential biomarkers and therapeutic targets for PE may therefore be of great clinical value.
We conducted tsRNA sequencing on plasma samples from both pre-eclamptic and healthy pregnant women to identify differentially expressed tsRNAs. We then analyzed plasma from patients with suspected PE to validate candidate tsRNAs with the highest diagnostic potential for this condition. Bioinformatics analysis and multiple experimental approaches were employed to investigate the possible biological functions of tsRNAs in the development of PE, together with the underlying biological mechanisms. We identified tiRNA-Gln-CTG as a candidate tsRNA with notably reduced expression in placental trophoblasts and plasma of women with PE. Its contribution to PE development appears to be via its regulation of thrombospondin-2 (THBS2) protein expression. Exploration of the role and mechanism of tsRNAs in PE development is a promising new research direction for the diagnosis and treatment of this condition.
Six patients with PE and 6 healthy pregnant control patients were recruited from
June 2022 to December 2023. The plasma from three PE patients and three healthy
controls was used for high-throughput sequencing of tRF and tiRNA, while the
plasma and placental trophoblast tissues of three other PE patients and three
healthy controls were used to verify the consistency of tsRNA expression levels.
To assess the potential of tsRNA as a predictive biomarker for PE, plasma samples
were also collected from 150 patients with suspected PE, of which 28 did not give
birth in our hospital. Consequently, the study analyzed 122 patients with
suspected pre-eclampsia (PE). Given the documented 20% incidence of PE in women
who are suspected of having this condition [18], the tiRNA-Gln-CTG biomarker was
anticipated to reach 80% sensitivity and specificity, with Z = 1.96. The minimum
sample size required was therefore calculated as: n = 1.962
For high-throughput sequencing, plasma total RNA was first extracted using TRIzol reagent (15596026CN, Invitrogen, Carlsbad, CA, USA) as per the manufacturer’s guidelines. It was then quantified using a NanoDrop-1000 (ND-1000, ThermoFisher Scientific, Waltham, MA, USA) instrument. The rtStarTM tRF & tiRNA Preprocessing Kit (AS-FS-005, Arraystar, Rockville, MD, USA) was used to eliminate RNA modifications that hinder the formation of small RNA sequencing libraries, including the removal of 3′-amino acids and 3′-cyclic phosphate for 3′-adaptor ligation, phosphorylation of 5′-OH to 5′-P for 5′-adaptor ligation, and demethylation of m1A and m3C. Sequencing libraries were prepared from pretreated total RNA in the following steps: (1) ligation of 3′-adaptors; (2) ligation of 5′-adaptors; (3) synthesis of complementary deoxyribonucleic acid (cDNA); (4) amplification via polymerase chain reaction (PCR); and (5) identification of PCR-amplified fragments within the size range of 134–160 bp. The amplified cDNA libraries were quantitatively analyzed using an Agilent 2100 Bioanalyzer (G2939A, Agilent, Santa Clara, CA, USA), and tsRNA high-throughput sequencing was performed with the Illumina NextSeq 500 system (NEXTSEQ 500, Illumina, San Diego, CA, USA). Following the generation of raw sequencing data, mature tRNA libraries were prepared by removing intronic sequences and appending ‘CCA’ to the 3′ end. FastQC was used to assess sequencing quality. 5′- and 3′-adapter bases were trimmed by Cutadapt through Illumina quality filters. Trimmed reads were then aligned, allowing only one mismatch with the mature tRNA sequence. Unmapped reads were subsequently aligned to the precursor tRNA sequence using Bowtie software (Version 1.3.0, The Johns Hopkins University, Baltimore, MD, USA), with only one mismatch permitted. The abundance of tRF and tiRNA was assessed using their sequencing counts, which were normalized to counts per million (CPM) aligned total reads [21].
The HTR-8/SVneo cell line was obtained from Servicebio Technology Co., Ltd.
(Wuhan, Hubei, China) and cultured in RPMI-1640 (G4535, Servicebio, Wuhan, Hubei,
China) with 10% fetal bovine serum (FBS, Gibco, Rockville, MD, USA) at 37 °C and
in 5% CO2. Cell lines underwent short tandem repeat (STR) profiling for validation and tested
negative for mycoplasma. The HTR-8/SVneo PE-like hypoxia model was developed
using 100 µM cobalt chloride hexahydrate (CoCl2
RNA was extracted from cells, plasma, and placenta using TRIzol reagent, and its
quality and quantity assessed using the NanoDrop-1000. Quantitative real-time PCR
(qRT-PCR) was performed using the StepOnePlus Real-Time PCR System from Applied
Biosystems (ThermoFisher Scientific, Waltham, MA, USA). The tsRNA was synthesized
using the non-human-derived spike-in microRNA (miRNA) cel-miR-39-3p
(miRA0000010-1, Ribobio, Guangzhou, Guangdong, China) as an
exogenous reference for normalization in plasma, and RNU6B (U6, Ribobio, China)
as an endogenous reference for normalization in placenta. Standardization of the
messenger RNA (mRNA) level in cells was achieved using
HTR-8/SVneo cells were seeded into 6-well plates and incubated in complete medium for 24 h until reaching 60–70% confluence. They were then transfected with a negative control (NC, sequence: GUUGUAGCUCCGCAAUUGCCGUUCAAUGUUGGGA), a tiRNA-Gln-CTG mimic (sequence: GGUUCCAUGGUGUAAUGGUUAGCACUCUGGACUC), or a tiRNA-Gln-CTG inhibitor (sequence: GAGUCCAGAGUGCUAACCAUUACACCAUGGAACC). All sequences were obtained from Ribobio (China) and were added with 200 µL Opti-MEM (31985070, ThermoFisher Scientific, Waltham, MA, USA) and 5 µL Lipofectamine 3000 (L3000015, ThermoFisher Scientific, Waltham, MA, USA) to transiently transfect HTR-8/SVneo cells. Subsequent experiments were performed 24–48 h after cell transfection. Detailed information and samples can be requested from Robibio by e-mail (marketing@ribobio.com). Negative control (NC, UUCUCCGAACGUGUCACGUTT), THBS2 small interfering (siRNA, GUACCUGCAAGAAAUUUAATT), and Y-box-binding protein 1 (YBX1) siRNA (GGAGGCAGCAAAUGUUACATT) were obtained from GenePharma (Shanghai, China) and transfected into HTR-8/SVneo cells using Lipofectamine 3000 as per the manufacturer’s guidelines.
TargetScan (https://www.targetscan.org) and miRanda (https://anaconda.org/bioconda/miranda) [23] were employed to predict target genes for the selected tRFs/tiRNAs. Gene Ontology (GO) and Kyoto Encyclopedia of Genes and Genomes (KEGG) enrichment analyses were conducted using Metascape bioinformatics resources (https://metascape.org) [24], followed by an investigation of gene/protein interactions through the String database (https://string-db.org) [25].
At 24 h after transfection, HTR-8/SVneo cells were seeded into 96-well plates at a density of 3000 cells per well. After incubating for 12, 24, and 48 h, 10 µL of CCK-8 reagent (CK04, Dojindo, Kumamoto Prefecture, Japan) was added to each well. Following 2 h of incubation, the optical density at 450 nm was analyzed using a multifunctional enzyme marker (Synergy™ 4, Biotek, Winooski, VT, USA).
At 24 h after transfection, HTR-8/SVneo cells were seeded at 10,000 per well in 96-well plates and cultured for 24 h. The EdU proliferation assay was carried out as per the manufacturer’s guidelines (G1601, Servicebio, Wuhan, Hubei, China), and the proportion of cells that incorporated EdU was ascertained by fluorescence microscopy (Zeiss, Oberkochen, BW, Germany). The cell proliferation rate (%) = the number of positive cells (green fluorescence) / the number of total cells (blue fluorescence).
Analysis of cell apoptosis. Cells were transfected, digested with EDTA-free trypsin, washed twice with phosphate-buffered saline (PBS), and then processed as per the manufacturer’s guidelines (40310ES60, YEASON, Shanghai, China). Subsequently, apoptosis was assessed using flow cytometry (Attune NxT, Thermo Fisher Scientific, USA).
Analysis of the cell cycle. Transfected cells were digested, washed twice with PBS, and then processed as per the manufacturer’s guidelines (40301ES60, YEASON, Shanghai, China). At the completion of treatment, flow cytometry was used to analyze the cell cycle (Attune NxT, Thermo Fisher Scientific, Waltham, MA, USA).
Transfected HTR-8/SVneo cells were cultured in 6-well plates until they were fully confluent. Scratch wounds were then created using a 200 µL pipette tip, and three points were randomly marked. After washing the 6-well plates with PBS to eliminate dead cells, 2 mL of RPMI 1640 medium without FBS was added. Images were taken at designated sites at 0, 24, and 48 h post-incubation and analyzed with Image J software (Version 1.8.0, National Institutes of Health, Bethesda, MD, USA) to determine the wound area and calculate the healing rate. The wound healing rate was determined by subtracting the wound area at 24 or 48 h from the initial wound area (0 h), then dividing by the initial wound area.
Cell migration assay. A total of 30,000 HTR-8/SVneo cells and 200 µL of FBS-free RPMI 1640 medium were introduced into the upper chamber of a Transwell (3422, Corning, Steuben County, New York, USA). Simultaneously, 700 µL of RPMI 1640 medium with 10% FBS was added to the lower chamber. Following removal of the culture medium from the upper chamber, samples were fixed with 700 µL of 4% paraformaldehyde for 30 minutes. The cells were then stained in the dark for 30 minutes using a 0.5% crystal violet dye solution (C0121, Beyotime, Shanghai, China). The cells and excess dye solution remaining on the polycarbonate membrane in the upper chamber were removed with cotton swabs, and the chamber was subsequently dried. Cells that penetrated the polycarbonate membrane were imaged using a Zeiss inverted microscope, and their number quantified using Image J software.
Transwell invasion assay. Before the experiment, RPMI 1640 culture medium was mixed with Matrigel matrix glue (354234, Corning, Steuben County, New York, USA) in a 1:7 volume ratio. Subsequently, 60 µL of this mixture was placed in the upper chamber of the Transwell and left to incubate overnight. The remaining experimental procedures were the same as those used in the cell migration assay.
A total of 400 µL of HTR-8/SVneo cellular protein solution was divided equally into 4 groups (Sense, Antisense, Input and Beads). Biotin-labeled tiRNA-Gln-CTG and its control probe were incubated with cytoplasmic protein solution at 4 °C overnight (no probe was added to the beads group) to form RNA-protein complexes. Agarose beads (30 µL) were added to three 1.5 mL enzyme-free EP tubes (151440, MedChemExpress, Monmouth Junction, NJ, USA) and centrifuged for 30 seconds. The upper liquid layer was discarded and the beads were resuspended in 200 µL of PBS and centrifuged at room temperature (3000 g, 1 minute). The supernatant was discarded and the procedure was repeated five times. The RNA-protein complexes were then combined with the agarose beads and incubated at 4 °C for 1 h with rotation. Following centrifugation (3000 g, 1 minute), the supernatant was discarded and the pellet was resuspended in 200 µL of PBS. This step was repeated nine times. Finally, after adding 40 µL of SDS-PAGE sample buffer and incubating in a 100 °C water bath for 10 minutes, the samples underwent 10% SDS-PAGE electrophoresis followed by rapid silver staining (P0017S, Beyotime, Shanghai, China).
The SDS gel was cut into 1 mm pellets with a scalpel and placed into 2 mL centrifuge tubes. Decolorizing solution (25 mM ammonium bicarbonate and acetonitrile) was added and the tubes were evenly shaken. This was repeated several times until the destaining was complete. Ethyl ether was added to dehydrate the pellet until it turned white, followed by vacuum drying. Dithiothreitol (10 mM, D9779, Sigma-Aldrich, St. Louis, MO, USA) was then added and incubated for 60 min at 56 °C. An iodoacetamide solution (55 mM, RPN6302, GE Healthcare, Chicago, IL, USA) was added and reacted for 45 min in the dark. A trypsin solution (10 ng/µL, V5111, Promega, Madison, WI, USA) was then added to fully cover the pellet and left at 37 °C overnight. The next day, the extraction solution (50% acetonitrile + 3% trifluoroacetic acid) and 100% acetonitrile were added and the sample centrifuged. The resulting supernatant with enzyme solution was collected in a new centrifuge tube, vacuum dried and then stored at –20 °C. Peptides were analyzed via elution using an EASY-nLC 1200 UHPLC system (EASY-nLC 1200, Thermo Fisher Scientific, Waltham, MA, USA), and using a Thermo Q Exactive HF-X mass spectrometer (Q Exactive HF-X, Thermo Fisher Scientific, Waltham, MA, USA) following elution and ionization.
The 3′UTR of the THBS2 sequence containing the tiRNA-Gln-CTG binding site was inserted into the SacI/XhoI restriction site of the pmirGLO vector (GenePharma, Shanghai, China). It contained either a wild-type (WT) or mutant (MUT) sequence. HEK293T cells were transfected with a luciferase-reporter vector and either a tiRNA-Gln-CTG mimic or control using Lipofectamine 3000. After transfection for 48 h, firefly and renilla luciferase activities were measured using a luciferase assay system (Glomax 96, Promega, Madison, WI, USA) as per the manufacturer’s guidelines (G1701, Servicebio, Wuhan, Hubei, China).
HTR-8/SVneo cells underwent two PBS washes before the addition of 60 µL of a radioimmunoprecipitation (RIPA) assay lysate mixture containing phenylmethanesulfonyl fluoride and a protease inhibitor (all from Beyotine, Shanghai, China). The cells were thoroughly lysed on ice and the protein concentration was then measured with a BCA protein assay kit (P0012, Beyotine, China). Although 20 µg of protein is typically utilized for WB experiments, we loaded 5–10 µg of extracellular vesicle (EV)-derived protein for exosome identification, and 10 µg for cell-derived proteins. The sample volume used for the EV-free group was 15 µL. The ratio of cell supernatant without EVs to loading buffer was 4:1. Following separation by 10% polyacrylamide gel electrophoresis, proteins were transferred to a polyvinylidene fluoride membrane. After blocking with 5% skim milk or bovine serum albumin for 2 h, membranes were incubated overnight on a shaker with primary antibody. They were then washed three times for 10 minutes each with Tris Buffered Saline containing Tween-20 (TBST) on a shaker, followed by incubation with the secondary antibody for 1 h at room temperature. After three washes with TBST, protein bands were visualized with a chemiluminescent reagent (WBKLS0500, Darmstadt, Germany). Image J software was used to semi-quantify the grayscale values of the immunoblots. Information on the antibodies used in WB is presented in Supplementary File 1.
HTR-8/SVneo cells were incubated for 36 h in a medium containing EV-free FBS (C380109199, VivaCell Bioscience, Shanghai, China). The medium was then collected and EVs wereisolated using the VEX Exosome Isolation Reagent (R601, Vazyme, Nanjing, Jiangsu, China) as per the manufacturer’s instructions. Cell culture medium was filtered through a 0.22 µM pore filter to remove cell debris, followed by centrifugation at 5600 rpm for 20 minutes at 4 °C. Subsequently, Exosome Isolation Reagent was added to the supernatant at a 1:3 ratio and mixed thoroughly. After refrigerating for 16 h at 4 °C, the supernatant was removed after centrifugation (10200 rpm, 30 minutes, 4 °C) and the pelletresuspended in PBS to obtain the exosome suspension. The size and shape of EVs were observed using transmission electron microscopy (HT7800, Hitachi, Chiyoda-ku, Tokyo, Japan), and the expression of cluster of differentiation 63 (CD63), cluster of differentiation 81 (CD81), ALG-2-interacting protein X/apoptosis-linked gene 2-interacting protein 1 (ALIX), tumor susceptibility gene 101 (TSG101), heat shock protein 70 (HSP70) and golgi matrix protein 130 (GM130) proteins was evaluated by WB assay.
HTR-8/SVneo cells were cultured in 24-well plates with cell coverslips. They were then fixed in 4% formaldehyde and permeabilized with 0.5% Triton X-100. A FAM-labeled tiRNA-Gln-CTG probe was designed and synthesized by GenePharma (Shanghai, China). The FISH assay was performed as recommended bythe reagent supplier (C10910, RiboBio, China). A suitable field of view was chosen and imaged using a Zeiss fluorescence microscope (Oberkochen, Germany) to examine the localization of tiRNA-Gln-CTG in HTR-8/SVneo cells.
Data analysis was conducted using SPSS (Version 20.0, International Business
Machines Corporation, Armonk, New York, USA) and GraphPad Prism (Version 8.0,
GraphPad software, San Diego, CA, USA). Study results were expressed as the mean
High-throughput sequencing of tsRNA was performed to compare the level of tsRNA
in plasma from PE and healthy control women (Fig. 1A). Different subclasses of
tsRNAs were distributed according to their size and length (Fig. 1B,C). Results
above indicated that significant differences existed in the composition of the
tsRNA profile and the expression level of tsRNA between the PE and healthy
control groups. Identifying the differential tsRNAs is the primary step for their
roles in the development of PE and their potential as predictive markers for PE.
A total of 1532 tsRNAs showed elevated counts per million (CPM) mapped read
values of
 Fig. 1.
Expression profiles of tsRNA in the plasma of pregnant women
with PE (n = 3) and healthy pregnant women (n = 3). (A) Heat
map of differential tsRNAs. (B) Distribution of tsRNA species in the plasma of
healthy pregnant women. (C) Distribution of tsRNA species in the plasma of women
with PE. (D) tsRNAs with
tsRNAs with CPM
 Fig. 2.
Expression levels of 6 selected tsRNAs in the plasma
and placenta of women with pre-eclampsia and healthy pregnant controls. Data are
presented as the mean
 Fig. 3.
Analysis of the potential biological functions of tiRNA-Gln-CTG. (A) Biological process categories. (B) Cellular component categories. (C) Molecular function categories. (D) Canonical signaling pathways. (E) PPI network analysis. (F) Structure of tiRNA-Gln-CTG. PPI, protein-protein interaction.
FISH experiments revealed that tiRNA-Gln-CTG was expressed in both the cytoplasm
and nucleus of HTR-8/SVneo cells (Fig. 4A). Hypoxia models of HTR-8/SVneo cells
were created using varying CoCl2 concentrations to mimic the placental
hypoxic conditions in PE [26, 27, 28]. The expression level of HIF-1
 Fig. 4.
Localization of tiRNA-Gln-CTG in HTR-8/SVneo cells, and
its expression and secretion in a CoCl2-induced HTR-8/SVneo cell model of
PE. Data are presented as the mean
Transfection with the tiRNA-Gln-CTG inhibitor did not significantly alter the expression of tiRNA-Gln-CTG in HTR-8/SVneo cells compared to the control group (Fig. 5A). However, the cell viability (Fig. 5B), proliferation (Fig. 5C), wound healing (Fig. 5D), and cell migration and invasion (Fig. 5E) were all significantly reduced 48 h after transfection with the inhibitor. Moreover, cells transfected with the tiRNA-Gln-CTG inhibitor exhibited a lower proportion of cells in the S-phase, and a significantly higher proportion in the G0/G1 phase (Fig. 5F). No significant difference in the apoptosis level (Fig. 5G) was observed between the two groups.
 Fig. 5.
Effect of transfection with the tiRNA-Gln-CTG inhibitor
on HTR-8/SVneo cell function. Data are presented as the mean
Transfection with the tiRNA-Gln-CTG mimic led to a significant 55-fold increase in tiRNA-Gln-CTG expression in HTR-8/SVneo cells (Fig. 6A). Cell viability (Fig. 6B), cell proliferation (Fig. 6C), wound healing (Fig. 6D), and cell migration and invasion (Fig. 6E) were all significantly increased 48 h after transfection with the tiRNA-Gln-CTG mimic. The mimic group also exhibited a significantly higher proportion of cells in the S-phase, and a reduced proportion in the G0/G1 phase compared to the mimic-NC group (Fig. 6F). No significant difference in the apoptosis level was observed between the two groups (Fig. 6G).
 Fig. 6.
Effect of transfection with the tiRNA-Gln-CTG mimic on
HTR-8/SVneo cell function. Data are presented as the mean
The TargetScan and miRanda websites predicted that tiRNA-Gln-CTG binds to the THBS2 mRNA 3′UTR region as 8mer-1u (Fig. 7A). The 3′UTR of THBS2 containing WT or MUT sequence for the tiRNA-Gln-CTG binding site was inserted into the SacI/XhoI restriction site of the pmirGLO Dual-Luciferase miRNA Target Expression Vector (Fig. 7B). Dual luciferase assay showed the relative fluorescence intensity was elevated when HEK293T cells were simultaneously transfected with tiRNA-Gln-CTG inhibitor and GP-miRGLO-THBS2-WT, whereas the relative fluorescence intensity was significantly decreased when they were simultaneously transfected with tiRNA-Gln-CTG mimic and GP-miRGLO-THBS2-WT (Fig. 7C). Transfection of HTR-8/SVneo cells with a tiRNA-Gln-CTG inhibitor significantly increased THBS2 mRNA and protein levels, while transfection with a tiRNA-Gln-CTG mimic significantly reduced these levels (Fig. 7D,E). Moreover, THBS2 protein expression was significantly higher in PE placentas (Fig. 7F), and the THBS2 protein level was also significantly increased in CoCl2-induced HTR-8/SVneo cells (Fig. 7G). These findings indicate that THBS2 significantly influences the biological functions of tiRNA-Gln-CTG.
 Fig. 7.
tiRNA-Gln-CTG is involved in the development of PE by mediating
THBS2 mRNA degradation through binding to its 3′UTR region. Data are
presented as the mean
Co-transfection of HTR-8/SVneo cells with a tiRNA-Gln-CTG inhibitor and THBS2-siRNA significantly reduced THBS2 mRNA (Fig. 8A) and protein (Fig. 8B) expression levels in the cells. Reduction of THBS2 expression improved the viability (Fig. 8C), proliferation (Fig. 8D), wound healing (Fig. 8E), and migratory and invasive abilities (Fig. 8F). Reduced THBS2 expression also lowered the proportion of cells in the G0/G1 phase, while increasing the proportion in the proliferative phase (Fig. 8G), however the apoptosis level remained unchanged (Fig. 8H).
 Fig. 8.
Cellular functions of HTR-8/SVneo cells after
co-transfection with tiRNA-Gln-CTG inhibitor and siRNA-THBS2. Data are presented
as the mean
tiRNA-Gln-CTG sense and antisense molecules were identified by nucleic acid electrophoresis (Fig. 9A). RNA pull-down assay (Fig. 9B) and mass spectrometry revealed that tiRNA-Gln-CTG could specifically bind to 45 proteins (Fig. 9C). YBX1 was chosen for further validation due to its involvement in the regulation of gene expression and in non-coding RNA incorporation into the exosome. In vitro experiments confirmed that tiRNA-Gln-CTG specifically binds to YBX1 (Fig. 9D). The YBX1 expression level was reduced after transfection of YBX1-siRNA (Fig. 9E). The expression of tiRNA-Gln-CTG in HTR-8/SVneo cells remained unchanged following transfection of YBX1-siRNA (Fig. 9F), but its expression was significantly reduced in EVs present in the culture medium (Fig. 9G), as well as in the culture medium itself (Fig. 9H). AKT occupies a central position in the PPI interaction network analysis. The present results suggest that tiRNA-Gln-CTG exerts its biological function possibly through its regulation of AKT phosphorylation (Fig. 9I). This study also identified several signature proteins associated with the biological function of tiRNA-Gln-CTG, notably changes in the expression levels of cyclin D1, proliferating cell nuclear antigen (PCNA), vimentin, N-cadherin, and E-cadherin, whereas the expression levels of B-cell lymphoma/leukemia-2 (Bcl2) and Bcl-2 associated X (Bax) remained unchanged (Fig. 9J,K).
 Fig. 9.
Preliminary investigation of the mechanism by which
tiRNA-Gln-CTG is sorted into EVs and mediates their biological functions. Data
are presented as the mean
A total of 122 women with a suspected diagnosis of PE were enrolled in the study
(Table 1), of whom 28 ultimately developed PE and 94 did not (non-PE group).
Women who developed PE had a lower body mass index (BMI) (p = 0.036),
delivered earlier (p
 Fig. 10.
Receiver operating curves were employed to analyze the
predictive ability of plasma tiRNA-Gln-CTG for the future occurrence of PE in
women with suspected PE. Data are presented as the mean
| PE (n = 28) | Non-PE (n = 94) | p | |||
| Age (yrs), median (IQR) | 33.00 (6.50) | 31.50 (6.00) | –1.521 | 0.128 | |
| BMI (kg/m2), median (IQR) | 26.66 (5.99) | 29.43 (6.70) | –2.100 | 0.036 | |
| Gestational week at suspected PE (weeks), median (IQR) | 33.29 (3.89) | 32.29 (3.61) | –0.006 | 0.995 | |
| Gestational week for PE diagnosis (weeks), median (IQR) | 36.56 (3.14) | – | – | – | |
| Gestational week of delivery (weeks), median (IQR) | 36.93 (1.75) | 38.79 (1.61) | –5.486 | ||
| tiRNA-Gln-CTG ΔCT | 6.87 |
5.55 |
–6.133 | ||
| Mode of delivery, n (%) | |||||
| Vaginal delivery | 2 (7.14) | 40 (42.55) | 11.983 | ||
| Cesarean section | 26 (92.86) | 54 (57.45) | |||
| Diagnostic indicators of suspected PE, n (%) | |||||
| Blood pressure | 22 (78.57) | 43 (45.74) | 9.339 | 0.002 | |
| Abnormal urine protein levels | 4 (14.29) | 9 (9.57) | 0.130 | 0.719 | |
| Elevated aminotransferases | 1 (3.57) | 20 (21.28) | 3.585 | 0.058 | |
| Low platelet | 0 (0.00) | 2 (2.13) | – | 1.000 | |
| Suspected IUGR of the fetus | 4 (14.29) | 31 (32.98) | 3.685 | 0.055 | |
PE, pre-eclampsia; BMI, body mass index; IUGR, intrauterine growth restriction.
Certain 5′tiRNAs, including a group of tRF-3a, are notably upregulated at the maternal-fetal interface during immune activation in mice [16]. 5′-tRFs are the primary small RNA species secreted by pre-eclamptic syncytiotrophoblasts [29]. Oxidative stress regulates tiRNA production [30], and both hypoxia and oxidative stress are key mechanisms in placental PE [31]. The investigation of changes in tsRNA expression and their functions in PE could provide novel insights for the prediction and treatment of this condition. The present study is the first to report the use of plasma tiRNA-Gln-CTG to predict the future occurrence of PE in women who are suspected of having this condition.
A lower plasma tiRNA-Gln-CTG level was found to be a biomarker for predicting the onset of PE within one week in women suspected of being at risk for this condition. CoCl2 induces oxidative stress in trophoblasts, thus prompting its use in a hypoxia model that uses HTR-8/SVneo cells to mimic trophoblast injury in PE. Our findings indicated a significant reduction in the production and secretion of tiRNA-Gln-CTG under conditions of oxidative stress. tiRNA-Gln-CTG plays a role in trophoblast proliferation, migration, invasion, and cell cycle regulation, and its secretion is facilitated by YBX1-mediated EV encapsulation. Our results suggest that tiRNA-Gln-CTG may function by binding to the 3′UTR of THBS2 mRNA, thereby facilitating its degradation and subsequently influencing AKT phosphorylation. AKT plays a crucial role in the PI3K/AKT signaling pathway, and its phosphorylation regulates various cellular processes, including growth, survival, proliferation, and migration [32]. High phosphorylation levels of AKT were found to be associated with protection against oxidative stress in trophoblast cells [33]. In the present study we did not explore the target organs of plasma tsRNA, but rather the function of its regulatory secretory cells. tRF-3022b was reported to be significantly increased in colorectal cancer tissues and plasma exosomes, and tRF-3022b is also involved in regulation of the cell cycle and apoptosis in colorectal cancer cells. This regulation is achieved through secretion of tRF-3022 from the cell, followed by uptake again by the cell [34]. Although tiRNA-Gln-CTG plays a biological role in trophoblasts, we did not examine whether it is directly regulated after production, or whether it is secreted from the cell in EVs and then taken up by trophoblasts to play a regulatory role. Thus, more experiments are needed to validate the mechanism by which tiRNA regulates trophoblast function.
THBS2 is a glycoprotein with diverse biological roles, including angiogenesis, cell motility, apoptosis, and cytoskeletal organization [35, 36]. This study demonstrated that THBS2 is negatively regulated by tiRNA-Gln-CTG, as confirmed by bioinformatics analysis and luciferase reporter assays. Additional functional experiments showed that THBS2 knockdown enhanced the effect of a tiRNA-Gln-CTG inhibitor on trophoblast cell proliferation, migration, invasion, and cell cycle progression. Numerous studies have shown that THBS2 is dysregulated in breast, colon, and ovarian cancers, acting as an inhibitor of tumor invasion [37, 38]. THBS2 was found to inhibit angiogenesis in endothelial cells through its interaction with matrix metalloproteinases and the extracellular matrix [39]. In the present study, THBS2 protein and mRNA levels were elevated in the placental tissues of PE patients and in the CoCl2-induced trophoblast-hypoxia model. Taken together, these findings imply that the biological effects of tiRNA-Gln-CTG in trophoblasts may in part be mediated through THBS2.
tRF and tiRNA can influence cell proliferation and the cell cycle by modulating gene expression and interacting with RNA-binding proteins such as YBX1 to inhibit transcription [40]. On the other hand, YBX1 is also involved in exosomal RNA sorting [41]. The entry of some specific RNAs into the exosome requires the sorting action of YBX1 [42]. Byexploring the expression and secretion of tiRNA-Gln-CTG after YBX1 silencing, we were able to demonstrate a role for YBX1 in tiRNA sorting.
Thus, our findingsdemonstrate a role for tiRNA-Gln-CTG in the development of PE, as well as its sorting into EVs. tsRNA is expressed at high abundance in various body fluids and has been considered as a possible biomarker for various diseases [8]. The exploration of tiRNA-Gln-CTG as a candidate biomarker for PE therefore seems to be an important area for future research. In the present study of women with suspected PE during gestation 24+0–36+6, lower plasma levels of tiRNA-Gln-CTG were found to have progressively higher predictive ability for the onset of PE before delivery, up to 4 weeks after the diagnosis of suspected PE, and up to 1 week after the diagnosis of suspected PE. This provides some direction for future studies into diagnostic and predictive indicators of PE. The primary biomarker for predicting PE is the ratio of soluble fms-like tyrosine kinase-1 (sFlt-1) to placental growth factor (PIGF). A cohort study found this indicator has a negative predictive value of 99.3% for predicting PE, with a sensitivity and specificity of 80.0% and 78.3%, respectively [18]. The combined detection of tiRNA-Gln-CTG with this indicator may significantly enhance the sensitivity and specificity of PE diagnosis. Besides tiRNA-Gln-CTG, the KEGG biological functions of tRF-Ser-TGA and tRF-Cys-GCA have revealed associations with signaling pathways including MAPK [43], tumor necrosis factor (TNF) [44], and HIF-1 [45], although they were not further explored in the present study. These signaling pathways contribute to trophoblast cell development in PE. Exploration of the biological roles and molecular mechanisms of various tsRNAs, as well as their potential as biomarkers for predicting PE development in suspected cases, is crucial for optimizing the future management of PE.
An additional point is that tiRNA-Gln-CTG is expressed in both rats and mice [46]. This provides a basis for investigating the effects of placental injection of tiRNA-Gln-CTG on PE symptoms in rat or mouse models. However, the conditions for animal studies are not yet available at our institute and will gradually be carried out in subsequent research programs.
There are several limitations to this study. Firstly, 5′-tRF delivered by circulating EVs was found to reach endothelial cells and macrophages in the vessel wall of pre-eclamptic vessels directly [29]. However, our study did not investigate the effect of EVs on target cells and tissues (mainly endothelial cells and macrophages) after secretion from trophoblasts. Secondly, the RNA pull-down and combined mass-spectrometry analysis did not reveal the traditional Argonaute (AGO) protein family (AGO1, AGO2, AGO3, AGO4) [47]. This of course does not prove that tiRNA-Gln-CTG is unable to form a silencing complex with the AGO proteins. Silencing of the AGO family of genes one by one may be helpful in exploring the role of this family in the biological functions of THBS2. Lastly, our study of the signaling pathways related to the biological functions of THBS2 was not sufficiently thorough and will need further exploration in future research.
This is the first study to examine the tsRNA expression profile in the plasma of PE patients and healthy controls. We focused on the role of tiRNA-Gln-CTG in PE development, and its potential as a biomarker for diagnosing suspected cases of PE in pregnant women. We provide new ideas and perspectives for the future diagnosis and treatment of PE. tiRNA-Gln-CTG is a potential regulator of trophoblast function during the development of PE. The secretion of tiRNA-Gln-CTG into the maternal circulation via EVs is a strong predictive biomarker for the development of PE in women suspected of having this condition.
Some of the data used in this study are available from public databases, and the results of high-throughput sequencing of tsRNAs as well as the process of data analysis in this study are available upon request from the corresponding author.
YXW and XHJ: design of experiments, conduct of experiments, data analysis, and writing of the manuscript. HMS and SCL: design and conduct of experiments, data analysis, and guidance on manuscript revision. HY: design and guidance of experiments, editorial review of the manuscript, and financial support. All authors contributed to editorial changes in the manuscript. All authors contributed to the article and approved the final version. All authors agreed to be accountable for all aspects of the work.
The Ethics Committee of the Women’s Hospital of Nanjing Medical University approved this study (Approval No. 2023KY-003). Except for the database registration, the study adhered to the Declaration of Helsinki standards. All patients enlisted for this research provided written informed consent. They were afforded strict protection of their rights and privacy, and could withdraw from the study at any moment.
This is a special acknowledgement. We thank Prof. HJ Ding, Prof. KP Xie, Prof. CB Ji, Prof. XW Cui, Dr. LJ Xu, Dr. CQ Wu, Dr. HY Hou, Dr. Y Yang, Dr. ZY Xia, Dr. L Xue, Dr. ZJ Miao, Miss HY Chen, Miss SY Jiang, Mr. YC Wang, Miss TT Y in and others from Nanjing Medical University. We also thanks Prof. RZ Jia, Dr. X Shen, Dr. SW Feng, Dr. H Yin and others from Zhongda Hospital of Southeast University. The moral and financial support from them helped YX Wang and this research. Thanks to ejear for language editing services on the manuscript.
This research received no external funding.
The authors declare no conflict of interest.
Supplementary material associated with this article can be found, in the online version, at https://doi.org/10.31083/FBL26345.
References
Publisher’s Note: IMR Press stays neutral with regard to jurisdictional claims in published maps and institutional affiliations.