

 , Bo Wu 1,†, Xueqin He 1, Wei Li 1, Wenqi Guan 1
1 Department of Cardiovascular, Yangpu Hospital, School of Medicine, Tongji University, 200090 Shanghai, China
†These authors contributed equally.
Abstract
Coronary heart disease (CHD) is an intricate and multifaceted cardiovascular disorder that contributes significantly to global morbidity and mortality. Early and accurate identification and diagnosis of CHD are paramount to ensuring patients receive optimal therapeutic interventions and satisfactory outcomes.
Data on CHD gene expression were obtained from the Gene Expression Omnibus (GEO) repository and potential hub genes were screened through gene ontology (GO), Kyoto Encyclopedia of Genes and Genomes (KEGG), weighted gene co-expression network analysis (WGCNA), and least absolute shrinkage and selection operator (LASSO) analyses. Functional validation of these hub genes was conducted by interfering with them in human umbilical vein endothelial cells (HUVECs). Cell proliferation and apoptosis were assessed through cell counting kit-8 (CCK-8) and flow cytometry assays, respectively, while enzyme-linked immunosorbent assay (ELISA), quantitative polymerase chain reaction (qPCR), Western blot, and immunofluorescence were used to measure the expression of key indicators.
We identified 700 upregulated differentially expressed genes (DEGs) and 638 downregulated DEGs in CHD, and utilized LASSO analyses to screen disease potential biomarkers, such as zinc finger protein 429 (ZNF429). Interference with ZNF429 in HUVECs mitigated the CHD-induced decrease in cell proliferation and increase in apoptosis. Moreover, the expression of interleukin-1β (IL-1β), interleukin-6 (IL-6), tumor necrosis factor-alpha (TNF-α), vascular cell adhesion molecule-1 (VCAM-1), intercellular adhesion molecule-1 (ICAM-1), cluster of differentiation 62E (CD62E), and cluster of differentiation 62P (CD62P) was reduced, leading to decreased cellular inflammation and adhesion.
CHD-associated biomarker ZNF429 was identified through bioinformatics analysis to potentially regulate the expression of inflammatory factors IL-6, IL-1β, and TNF-α, along with adhesion molecules ICAM-1, VCAM-1, CD62E, and CD62P. This modulation influence was subsequently found to impact the progression of CHD. These findings offered valuable insights into potential targets for further investigation and therapeutic interventions for CHD management.
Keywords
- coronary heart disease
- bioinformatics analysis
- ZNF429
Coronary heart disease (CHD), as a coronary artery disease and a prevalent cardiovascular ailment, is responsible for over 382,820 fatalities by 2023 [1]. Due to stenosis or occlusion of the coronary arteries due to coronary atherosclerosis, this disease is typically characterized by the amalgamation of plaque, lipid, cholesterol, and calcium sedimentation within coronary arteries, ultimately leading to myocardial ischemia, hypoxia, or cardiac necrosis [2]. Risk factors for CHD encompass high blood pressure, elevated cholesterol, tobacco use, obesity, diabetes, and genetic predisposition. Collectively, these factors expedite the onset of CHD, posing significant threats to the health of the elderly population [3]. Recently, the incidence of CHD shows that the group suffering from this disease tends to be younger and younger [4]. Most theoretical descriptions of the conceptual frameworks of CHD mechanisms, including spanning angina pectoris, myocardial infarction, ischemic cardiomyopathy, and occult CHD, are largely theoretical [5].
Despite recent advancements in the diagnosis of CHD, the identification of precise and sensitive biomarkers remains pivotal in managing this widespread disease. Studies have indicated that baseline levels and fluctuations in B-type natriuretic peptide and sensitive troponin I levels have the potential to guide the intensity of secondary CHD preventive therapies [6, 7]. Further insights underscore serum uric acid (SUA) level as a prospective biomarker for CHD [8]. Elevated lipoprotein-associated phospholipase A2 levels have emerged as robust indicators of CHD risk, with implications for atherosclerosis and risk assessment [9]. While biomarkers and genes linked to CHD have been studied to enable early diagnosis, challenges persist in deciphering the functional significance of these biomarkers and genes, as well as their potential clinical utility. Thus, there is an urgent need to identify markers for early detection of CHD.
Increasing comprehensive gene expression profile databases have emerged due to gene expression analysis, providing valuable insights into diverse disease mechanisms. Bioinformatics analysis is also a potent tool for unraveling the complex molecular mechanisms under the context of CHD development, as well as for identifying potential biomarkers and therapeutic targets [10, 11]. This study employed bioinformatic analysis to identify CHD diagnostic biomarkers. Functional validation of the selected targets was conducted at the cellular level, providing valuable insights for advancing future diagnosis and targeted treatment of CHD.
Gene expression data for CHD and normal samples were retrieved from the Gene Expression Omnibus (GEO) database (https://www.ncbi.nlm.nih.gov/geo/query/acc.cgi?acc=GSE202625). The GSE202625 dataset, encompassing twenty-seven CHD blood samples and twenty-five normal blood samples, was used to validate the expression of potential marker genes.
Differential expression analyses were conducted using the R package DESeq2 (1.38.3).
Normalized data were assessed to identify differentially expressed genes (DEGs)
between samples. Correction for multiple hypothesis testing was executed, and
p-values were adjusted utilizing the false discovery rate (FDR), and the
corrected p-value was called the q-value. DEGs were deemed
statistically significant at a q-value
R software (R Foundation for Statistical Computing, Vienna, Austria), along with
the “biological conductor” and “ggplot” packages (3.4.2), was employed for gene
ontology (GO) function and Kyoto Encyclopedia of Genes and Genomes (KEGG) pathway
enrichment analyses. The DEGs were categorized into biological processes,
cellular components, and molecular functions. Enrichment was determined using an
q-value of
WGCNA explores genetic combinations and associations among samples, aiding biomarkers and therapeutic gene discovery [12]. The study employed 1338 DEGs to assess network topology for scale independence and connectivity using WGCNA. Hierarchical clustering was employed to cluster genes with comparable expression patterns into modules. Module–trait correlation identified highly CHD-associated module genes.
We assessed the impact of hub genes on CHD by employing a method of least
absolute shrinkage and selection operator (LASSO) regression through the R glmnet
[13]. LASSO is renowned for analyzing high-dimensional data, aiming to minimize
the residual sum of squares while constraining the absolute sum of the model
coefficients below a threshold. Genes with p
Human umbilical vein endothelial cells (HUVECs) (RRID: CVCL_2959, HTX2104) were
obtained from Shenzhen OTWO Biotech Co., Ltd (Shenzhen, China). The cell lines were identified
using short tandem repeat (STR) profiling, and the absence of mycoplasma
contamination was confirmed. The sh-negative control (NC) plasmid and shZNF429 plasmid were designed
and constructed by Chongqing Biomedicine Biotechnology Co., Ltd (Chongqing, China). The shZNF429 interference sequence is as follows: F-5′-GATCCGGCTATACAAAGGAGGTTATAACTCGAGTTATAACCTCCTTTGTATAGCTTTTTTG-3′;
R-5′-AATTCAAAAAAGCTATACAAAGGAGGTTATAACTCGAGTTATAACCTCCTTTGTATAGCCG-3′. And the pLVX-shRNA1 vector without the insertion of the shZNF429 interference sequence serves as the NC. Specifically,
two 1.5 mL EP tubes were prepared, with 25 µg NC plasmid added to the sh-NC
group and 25 µg shZNF429 plasmid to the shZNF429 group. OPTI-MEM (31985070,
GIBCO, Shanghai, China) was supplemented to make a final volume of 500 µL.
Then, two additional 1.5 mL Eppendorf tubes (EP) were prepared by adding 75 µL
transfection reagent max (24765-1, Biomedicine, Chongqing, China) and 425
µL optimized-minimal essential medium (OPTI-MEM) in each tube. After 5 minutes, the transfection
reagent-containing mixture from the EP tubes was added into the
plasmid-containing EP tubes, mixed thoroughly, let stand at room temperature for
15 minutes, and then added to HUVECs for passage and culture. The experimental
groups were as follows: The control group: HUVEC cells were
cultured in DMEM medium without serum and dual-antibody culture medium
(C11995500BT, GIBCO, Shanghai, China). The model group: HUVEC cells were cultured
in DMEM medium without serum and dual-antibody at a final concentration of
80 µg/mL oxidized low-density lipoprotein (ox-LDL, 20605ES05, Yeasen,
Shanghai, China). The model+sh-NC group: transfected sh-NC
plasmid cell suspension was adjusted to a density of 2
Each well of a 96-well plate was supplied with 10 µL of CCK-8 solution (C0038, Beyotime, Shanghai, China). Blank wells were filled with culture medium and CCK-8 solution, while those for control with cells, culture medium, and CCK-8 solution. Following one-hour incubation, absorbance at 450 nm was measured using a microplate reader (CMax Plus, Molecular Devices, San Jose, CA, USA).
For flow cytometry detection of cell proliferation, BeyoClick™ EdU-555 Cell Proliferation Kit (C0075S, Beyotime, Shanghai, China) was used following the operation steps. Cells were labeled with EdU, digested, resuspended, and added with 1 mL of 4% paraformaldehyde fixative solution. Following PBS treatment, 1 mL of permeabilization solution was supplied. Then, 0.5 mL of Click solution was added to each tube to evenly cover the samples, followed by incubation at room temperature for 30 minutes. The cells were detected using a flow cytometer (1026M, Betalco, Changzhou, China) and data were analyzed with FlowJo_V10 software (FlowJo LLC, Ashland, OR, USA).
Flow cytometry apoptosis was detected using an Annexin V-FITC/PI apoptosis detection kit (40302ES60, Yeasen, Shanghai, China), following the manufacturer’s protocol. After the collection of cell suspension from each group, the cells were centrifuged and the supernatant was discarded. The cells were gently resuspended with 195 µL of AnnexinV-FITC-A binding solution. Then, 5 µL of AnnexinV-FITC was added and mixed, followed by centrifugation and removal of the supernatant. Subsequently, 190 µL of AnnexinV-FITC-A binding solution was gently resuspended with cells. After adding the staining solution, the samples were placed in an ice bath in the dark before detection, and data were analyzed with FlowJo_V10 software.
ELISA experiments were conducted following the instructions provided with the
respective assay kits. The ELISA kits for human IL-6, IL-1
Total RNA was extracted from each cell group using the TRIzol method, and the concentration and purity of RNA were determined using a UV–visible spectrophotometer (OD260/OD280). Complementary DNA (cDNA) synthesis was performed using the cDNA synthesis kit instructions (TSK302M, Tsingke, Beijing, China), and the qPCR reaction system was prepared (TSE002, Tsingke, Beijing, China). Following this, reactions were conducted in a real-time fluorescent quantitative PCR instrument (Bio-Rad Laboratories, Hercules, CA, USA), with the housekeeping gene GAPDH employed for normalization. Gene expression levels were determined using the 2-ΔΔCt method. Primer sequences can be found in Table 1.
| Primer name | Sequence |
| ZNF429-F | 5′-TTCTCTCTGGAGGAGTGGCA-3′ |
| ZNF429-R | 5′-TCGCTTCATCTTGCAGGGTT-3′ |
| VCAM-1-F | 5′-AGCACCACAGGCTCTTTTCC-3′ |
| VCAM-1-R | 5′-ACACTTGACTGTGATCGGCTT-3′ |
| ICAM-1-F | 5′-TGTGACCAGCCCAAGTTGTT-3′ |
| ICAM-1-R | 5′-AGTCCAGTACACGGTGAGGA-3′ |
| h-GAPDH-F | 5′-TCAAGGCTGAGAACGGGAAG-3′ |
| h-GAPDH-R | 5′-CTCCTCCTCCTCCTGCTTCT-3′ |
F, forward; R, reverse.
The cell total protein was lysed on ice. In total, 500 µg of total protein from each sample was mixed with buffer (8015011, Dakewei, Shenzhen, China) (resulting in a protein concentration of approximately 3.3 µg/µL after mixing) and subjected to metal bath denaturation. Sixty micrograms of denatured protein were loaded for electrophoresis at 80 V until the samples entered the concentrating gel, followed by an increase in voltage to 120 V. Primary antibodies against ZNF429 (ab171422, abcam, Shanghai, China), VCAM-1 (A19131, abclonal, Wuhan, China), ICAM-1 (A20472, abclonal, Wuhan, China), and GAPDH (A19056, abclonal, Wuhan, China) were diluted at 1:1000 and incubated overnight at 4 °C. Secondary antibodies (AS014, abclonal, Wuhan, China) were then diluted at 1:2000 and incubated at room temperature for 1 hour. The membrane was uniformly covered with ECL exposure solution and detected using an exposure instrument (Universal Hood II, Bio-Rad, Hercules, CA, USA).
Fixed cells were rinsed on the coverslip three times with PBS, each time for 5 minutes. After blocking with goat serum (C0265, Beyotime, Shanghai, China) for 30 minutes, primary antibodies against P-selectin (CD62P, 1:200, bs-0561R, Bioss, Beijing, China) and E-selectin (CD62E, 1:200, bs-1273R, Bioss, Beijing, China) were incubated at 4 °C overnight and washed three times. Secondary antibodies (1:200, GB21303, Servicebio, Wuhan, China) were added and incubated at room temperature for 1.5 hours and rinsed with PBS three times. DAPI staining (C1005, Beyotime, Shanghai, China) was performed, and the sections were sealed with an anti-fluorescence quenching agent (P0126, Beyotime, Shanghai, China) before observing changes under a microscope.
All experimental results were repeated three times. One-way ANOVA analysis and
plotting were performed using Prism GraphPad 8.0 software (Dotmatics, Boston, MA,
USA). Data display indicates mean
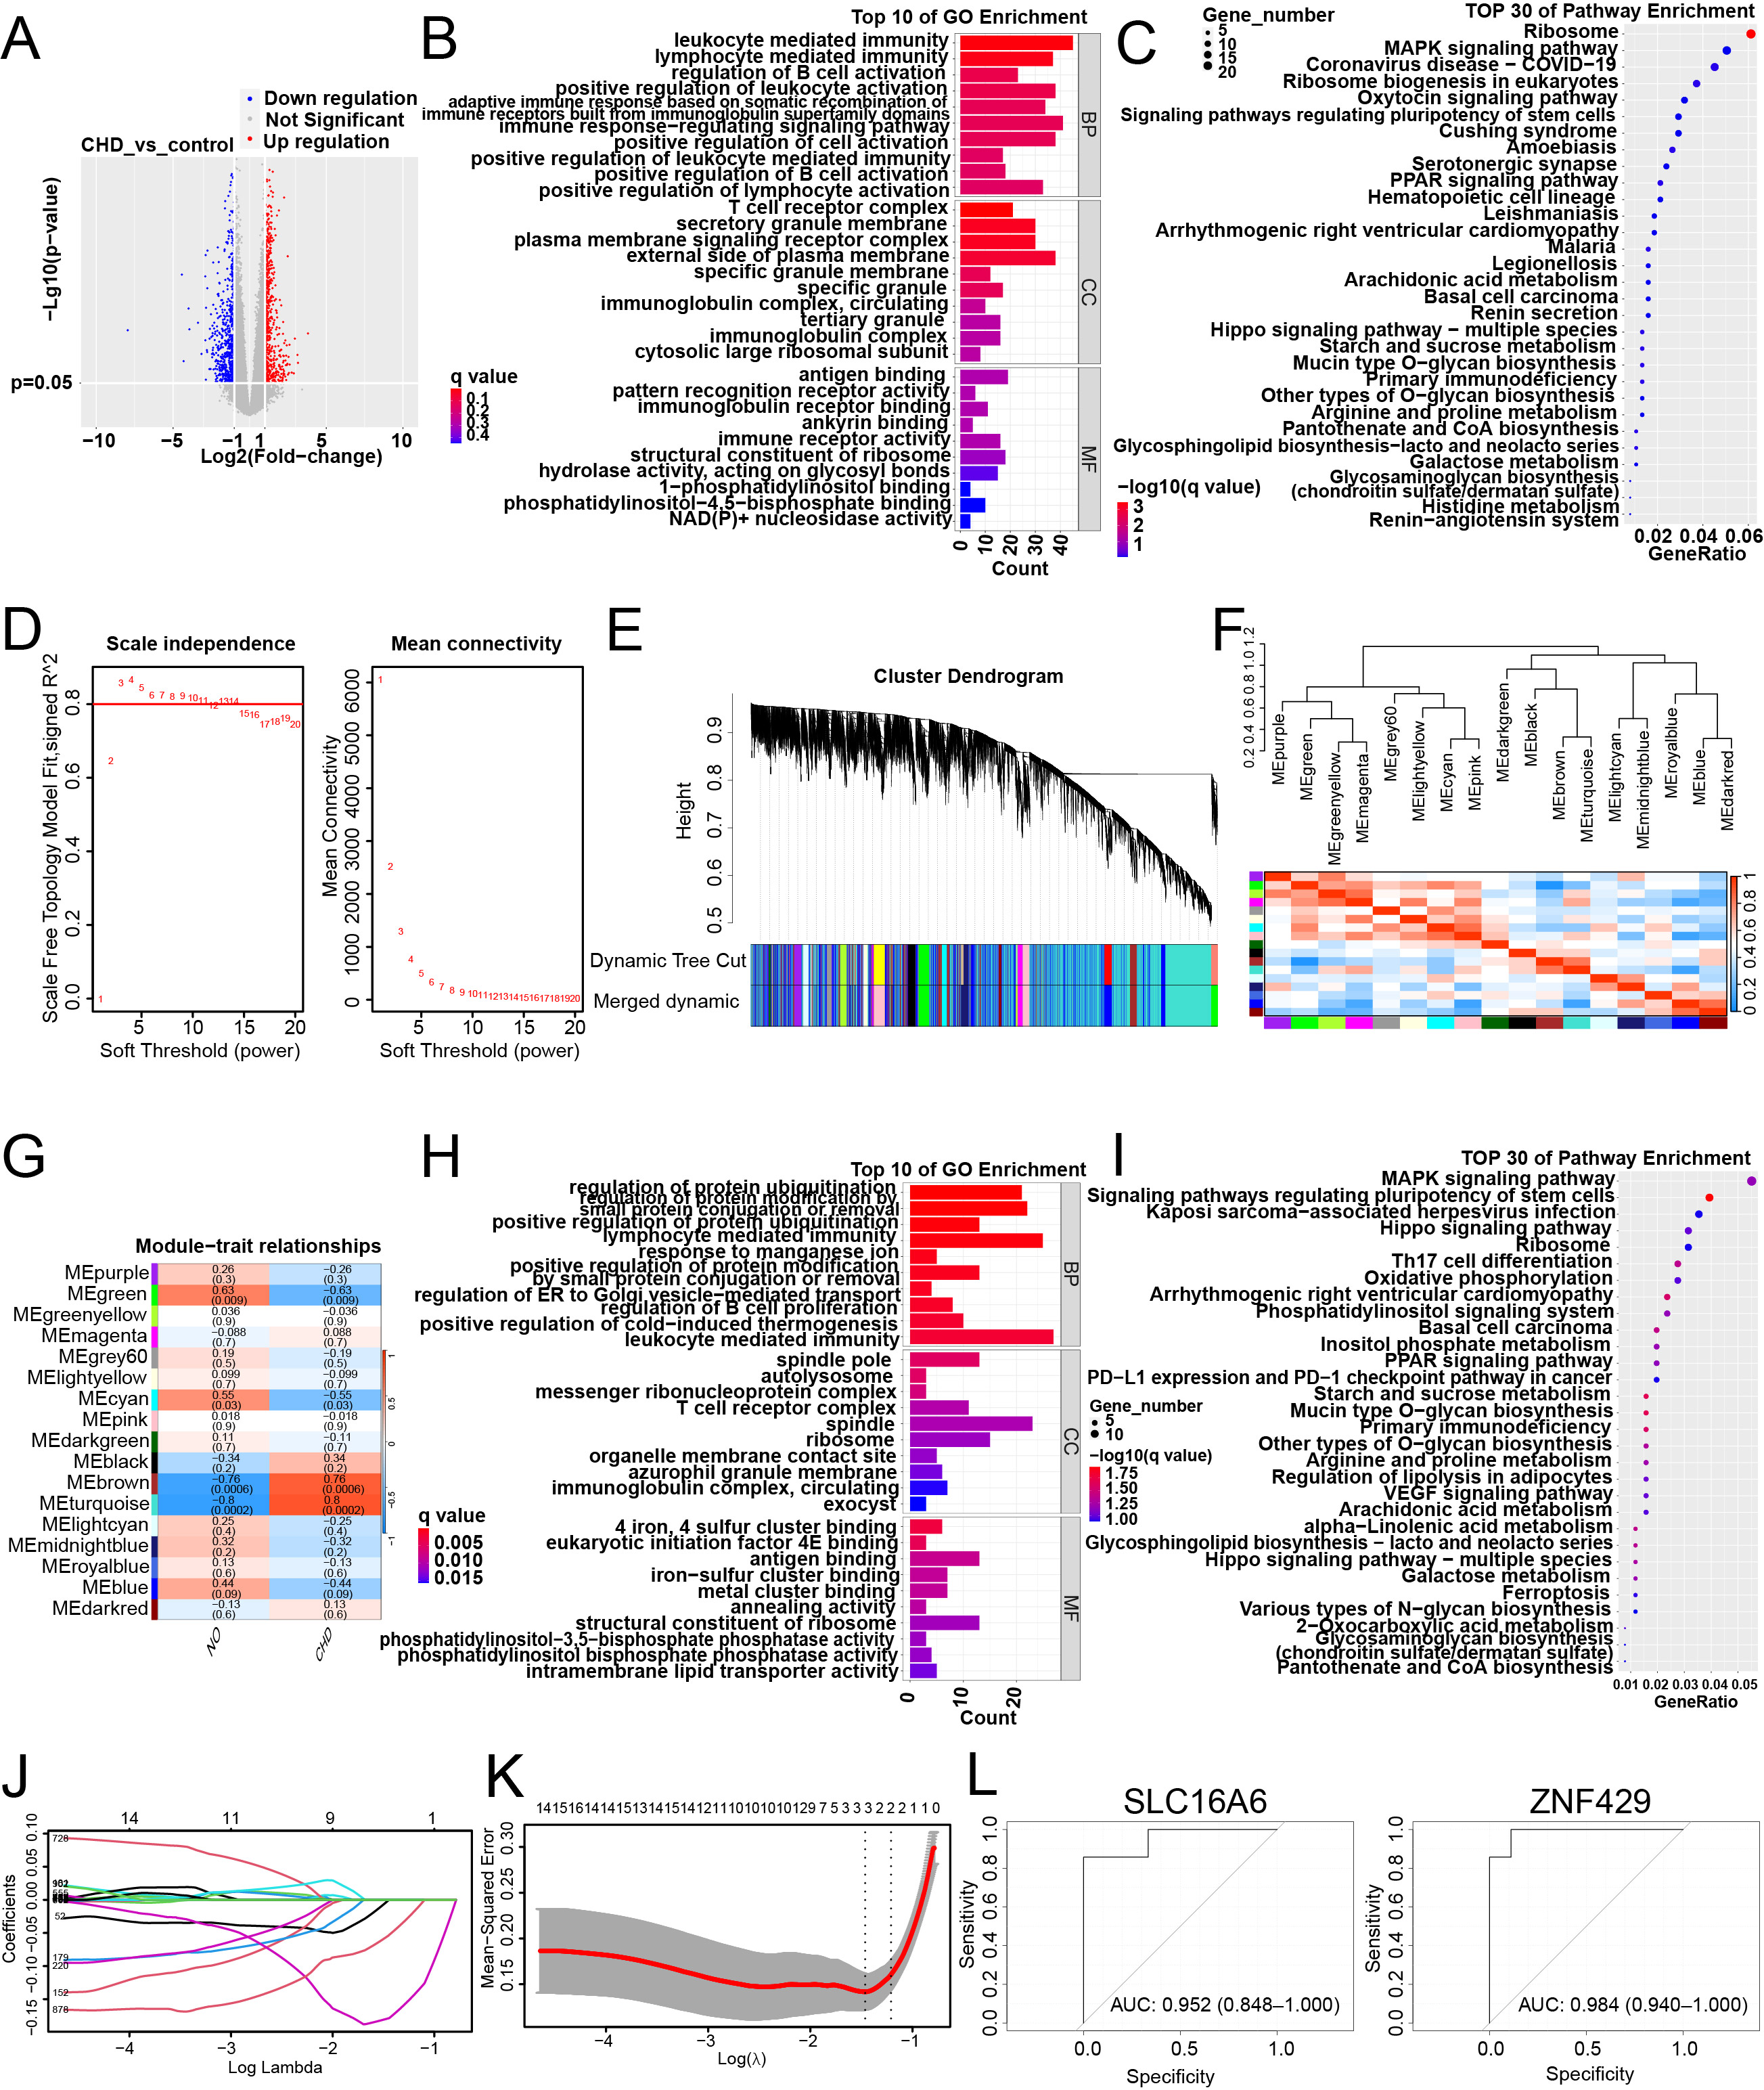
This study utilized the R DESeq2 package to identify 1338 genes with distinct
expression patterns between normal and CHD samples (
 Fig. 1.
Screening of coronary heart disease biomarkers based on bioinformatics analysis. (A) Volcano map depicting differentially expressed genes (DEGs) comparison between the coronary heart disease (CHD) group and control group, featuring distinctive color codes for gene expression alterations. (B) Top 10 gene ontology (GO) terms in the GSE202625 dataset. (C) Top 30 Kyoto Encyclopedia of Genes and Genomes (KEGG) pathways in the GSE202625 dataset. (D) The scale-free fitting index of soft threshold power. (E) Cluster dendrogram of DEGs using various metrics. Each branch signifies a gene, while colors below denote co-expression modules. (F) Interactions among co-expression modules. (G) Matrix illustrating the correlations and corresponding p-values between traits and modules. (H) Top 10 GO enrichment terms of DEGs within the turquoise and brown modules. (I) Top 30 KEGG enrichment pathways of the DEGs within the turquoise and brown modules. (J) Determination of the number of factors. (K) The important prognostic variables were selected using the least absolute shrinkage and selection operator (LASSO) regression method. (L) Logistic regression model to identify the area under the curve (AUC) of disease samples. The abscissa is the false positive rate, and the ordinate is the true positive rate.
By evaluating the scale-free topology fitting index for a specific power and network connectivity strength, we ensured alignment of the corresponding soft threshold power and a scale-free network. Network topology analysis was used to determine a threshold force of 4, and a hierarchical clustering tree was generated based on this value (Fig. 1D,E). The resultant hierarchical clustering tree delineated 17 co-expressed gene modules that were identified for subsequent exploration. Further assessment addressed the independence among these 17 co-expression modules, revealing a minimal overlap between their constituent genes (Fig. 1F). Notably, the module–trait correlation heat map highlighted that the turquoise and brown modules had the highest correlations with CHD characteristics, with correlation coefficients of 0.80 (p = 0.0002) and 0.76 (p = 0.0006, Fig. 1G), respectively. Functional and pathway enrichment analyses were performed for DEGs within the turquoise and brown modules. The results of GO analysis highlighted predominant enrichment in key processes, such as regulation of protein ubiquitination, positive regulation of protein modification via small protein conjugation or removal, regulation of protein modification via small protein conjugation or removal, positive regulation of protein ubiquitination, ribosome, structural constituent of ribosome, and phosphatidylinositol bisphosphate phosphatase activity (Fig. 1H). KEGG analysis revealed substantial enrichment in pathways including the MAPK signaling pathway, signaling pathways regulating pluripotency of stem cells, the Hippo signaling pathway, Kaposi sarcoma-associated herpesvirus infection, and the ribosome (Fig. 1I).
LASSO analysis of DEGs from turquoise and brown modules was used to identify hub genes for CHD. Following LASSO analysis, the selection of these vital markers was accomplished through the precision of the penalty parameter adjustment, facilitated by a 10-fold cross-validation approach (Fig. 1J). LASSO regression analysis yielded two features, indicating that we reduced the number of latent variables to 2 (Fig. 1K). Consequently, two hub genes, SLC16A6 and ZNF429, demonstrated a discernible association with CHD. Subsequent ROC curve analysis further illuminated the discriminative potential of the logistic regression model based on these two marker genes. AUC values of SLC16A6 and ZNF429 were 0.952 and 0.984, respectively, underscoring the relatively high predictive efficacy of these hub genes in distinguishing between normal and CHD samples. This outcome underscores the considerable utility of the identified hub genes as potential indicators of CHD diagnosis and prediction (Fig. 1L). Based on the above analysis, we found that the AUC value of ZNF429 is higher. Therefore, ZNF429 was chosen for cell experimental validation.
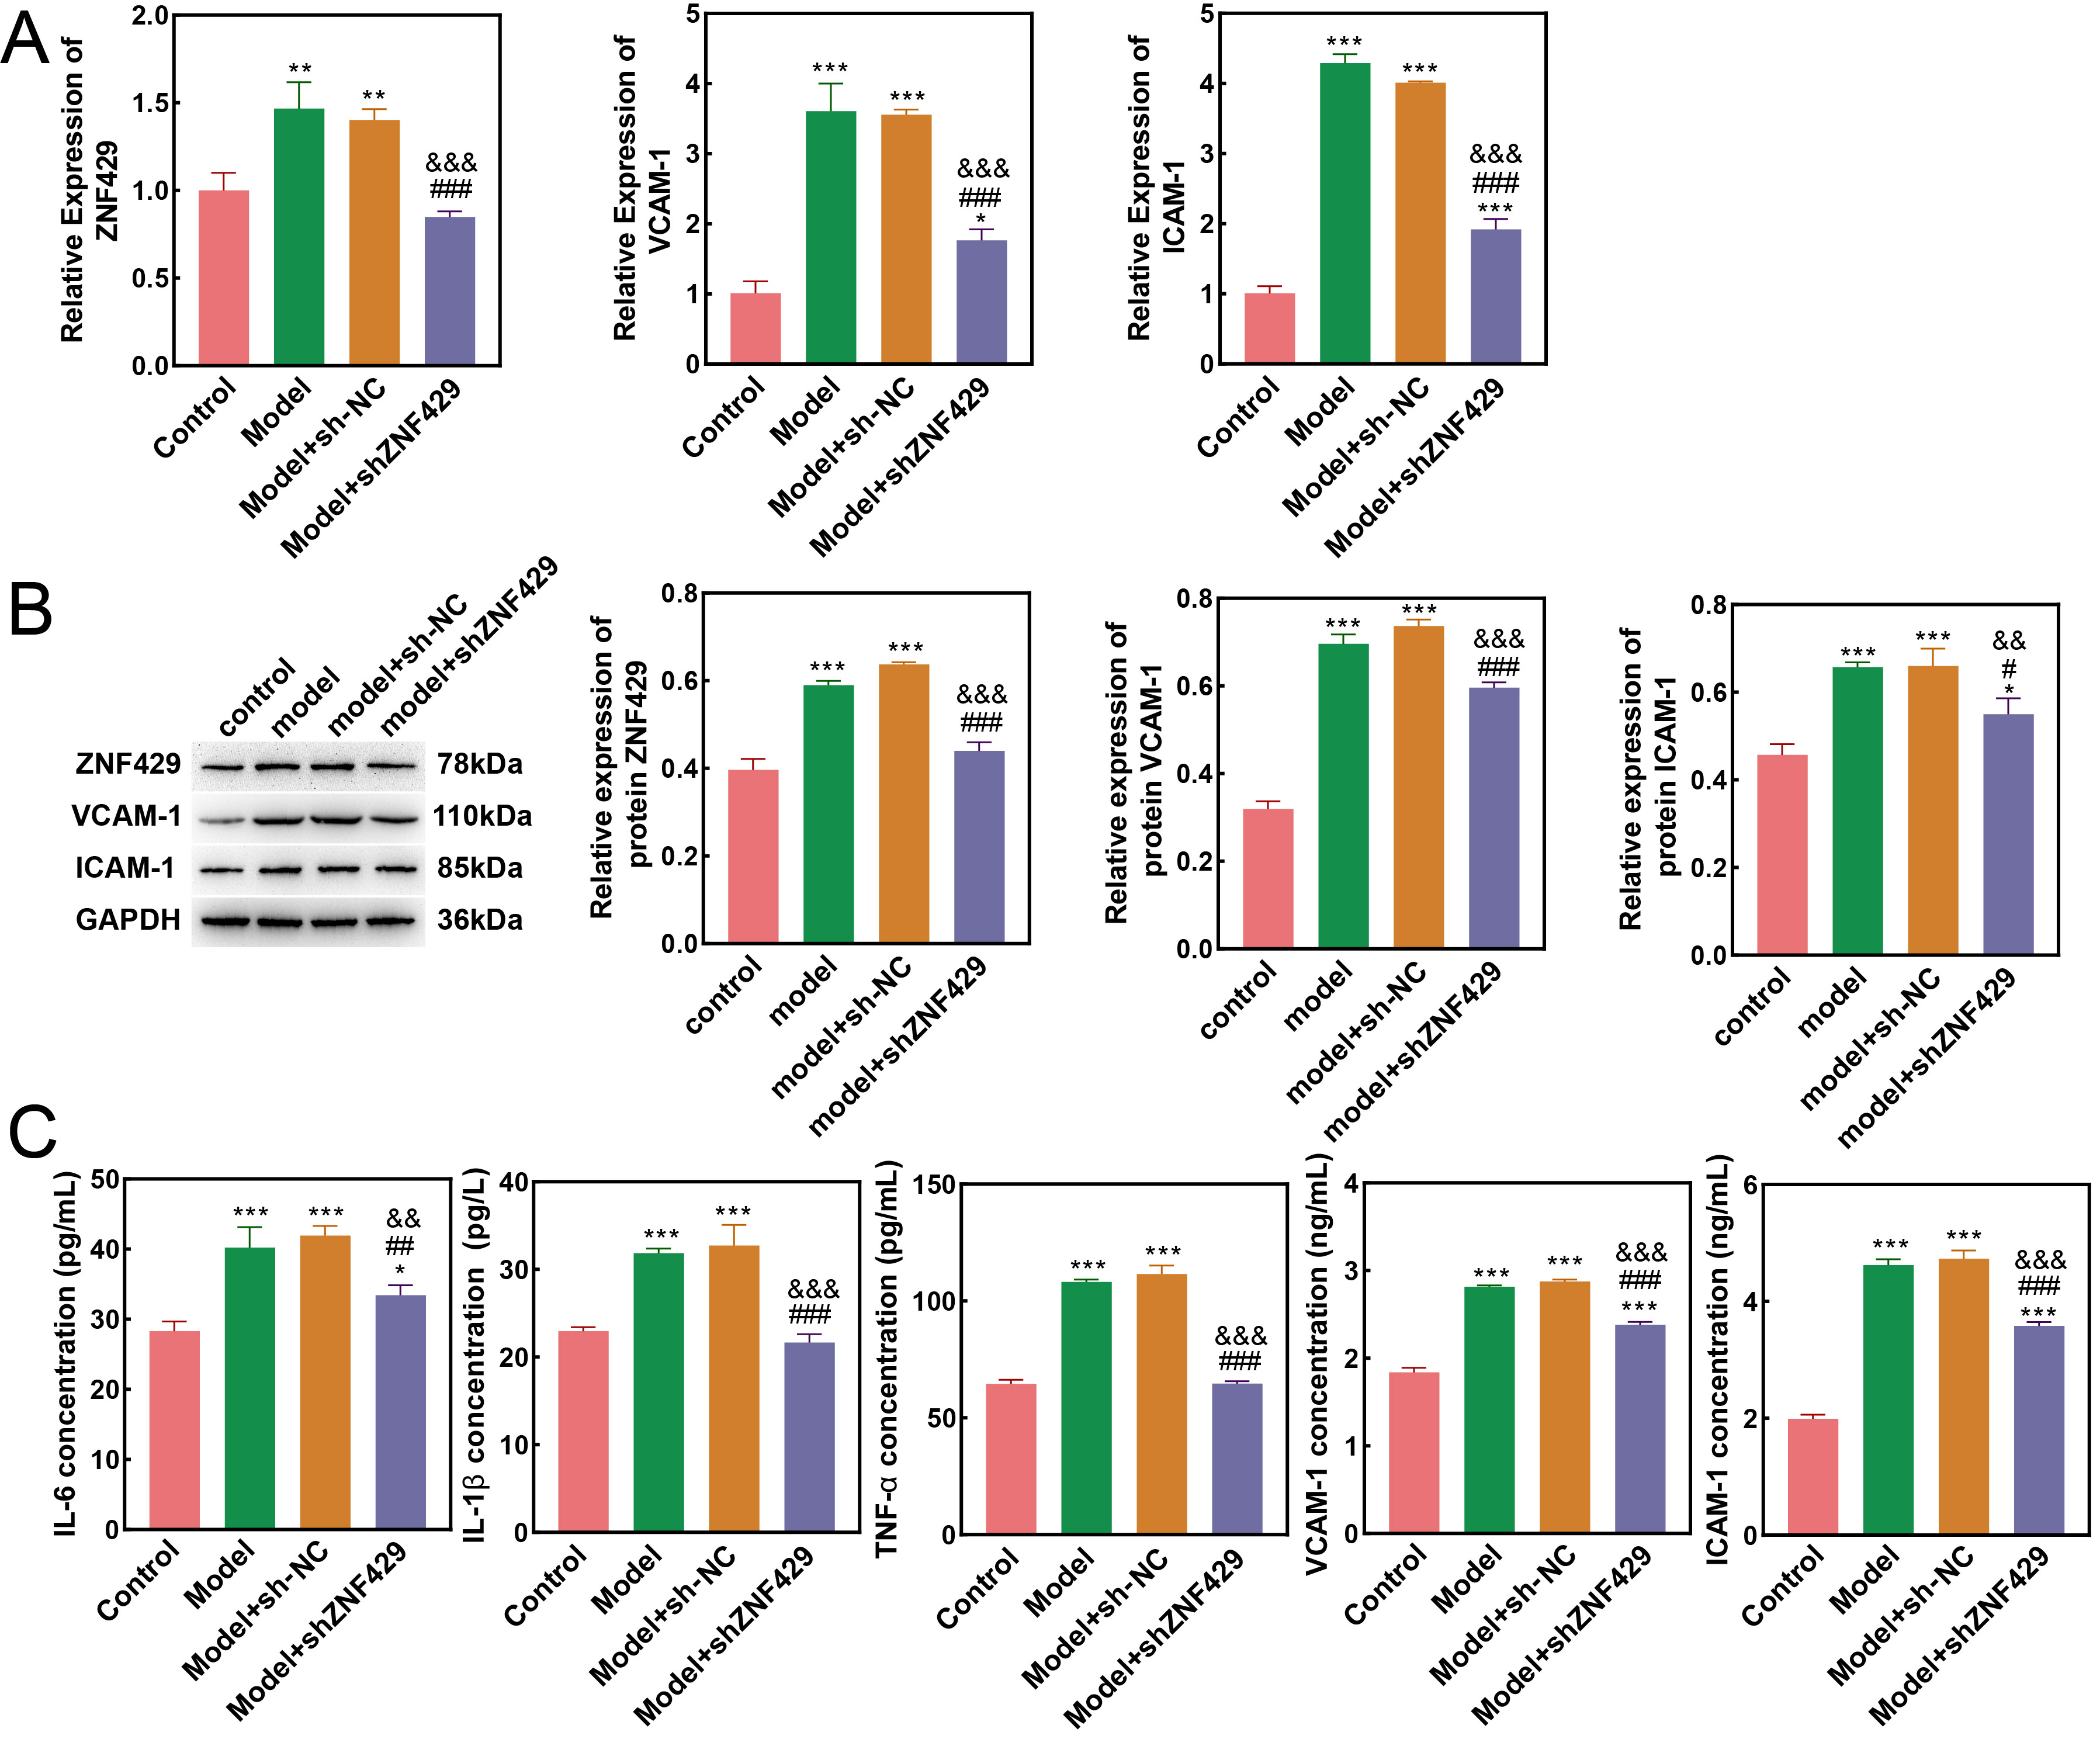
IL-6, IL-1
 Fig. 2.
Differences in cell characteristics detected via
quantitative polymerase chain reaction (qPCR), Western blot, and enzyme-linked
immunosorbent assay (ELISA). (A) qPCR detection of the mRNA expression of
ZNF429, VCAM-1, and ICAM-1 in cells. (B) Western blot detection of the mRNA
expression of ZNF429, VCAM-1, and ICAM-1 in cells. (C) ELISA detection of
IL-1
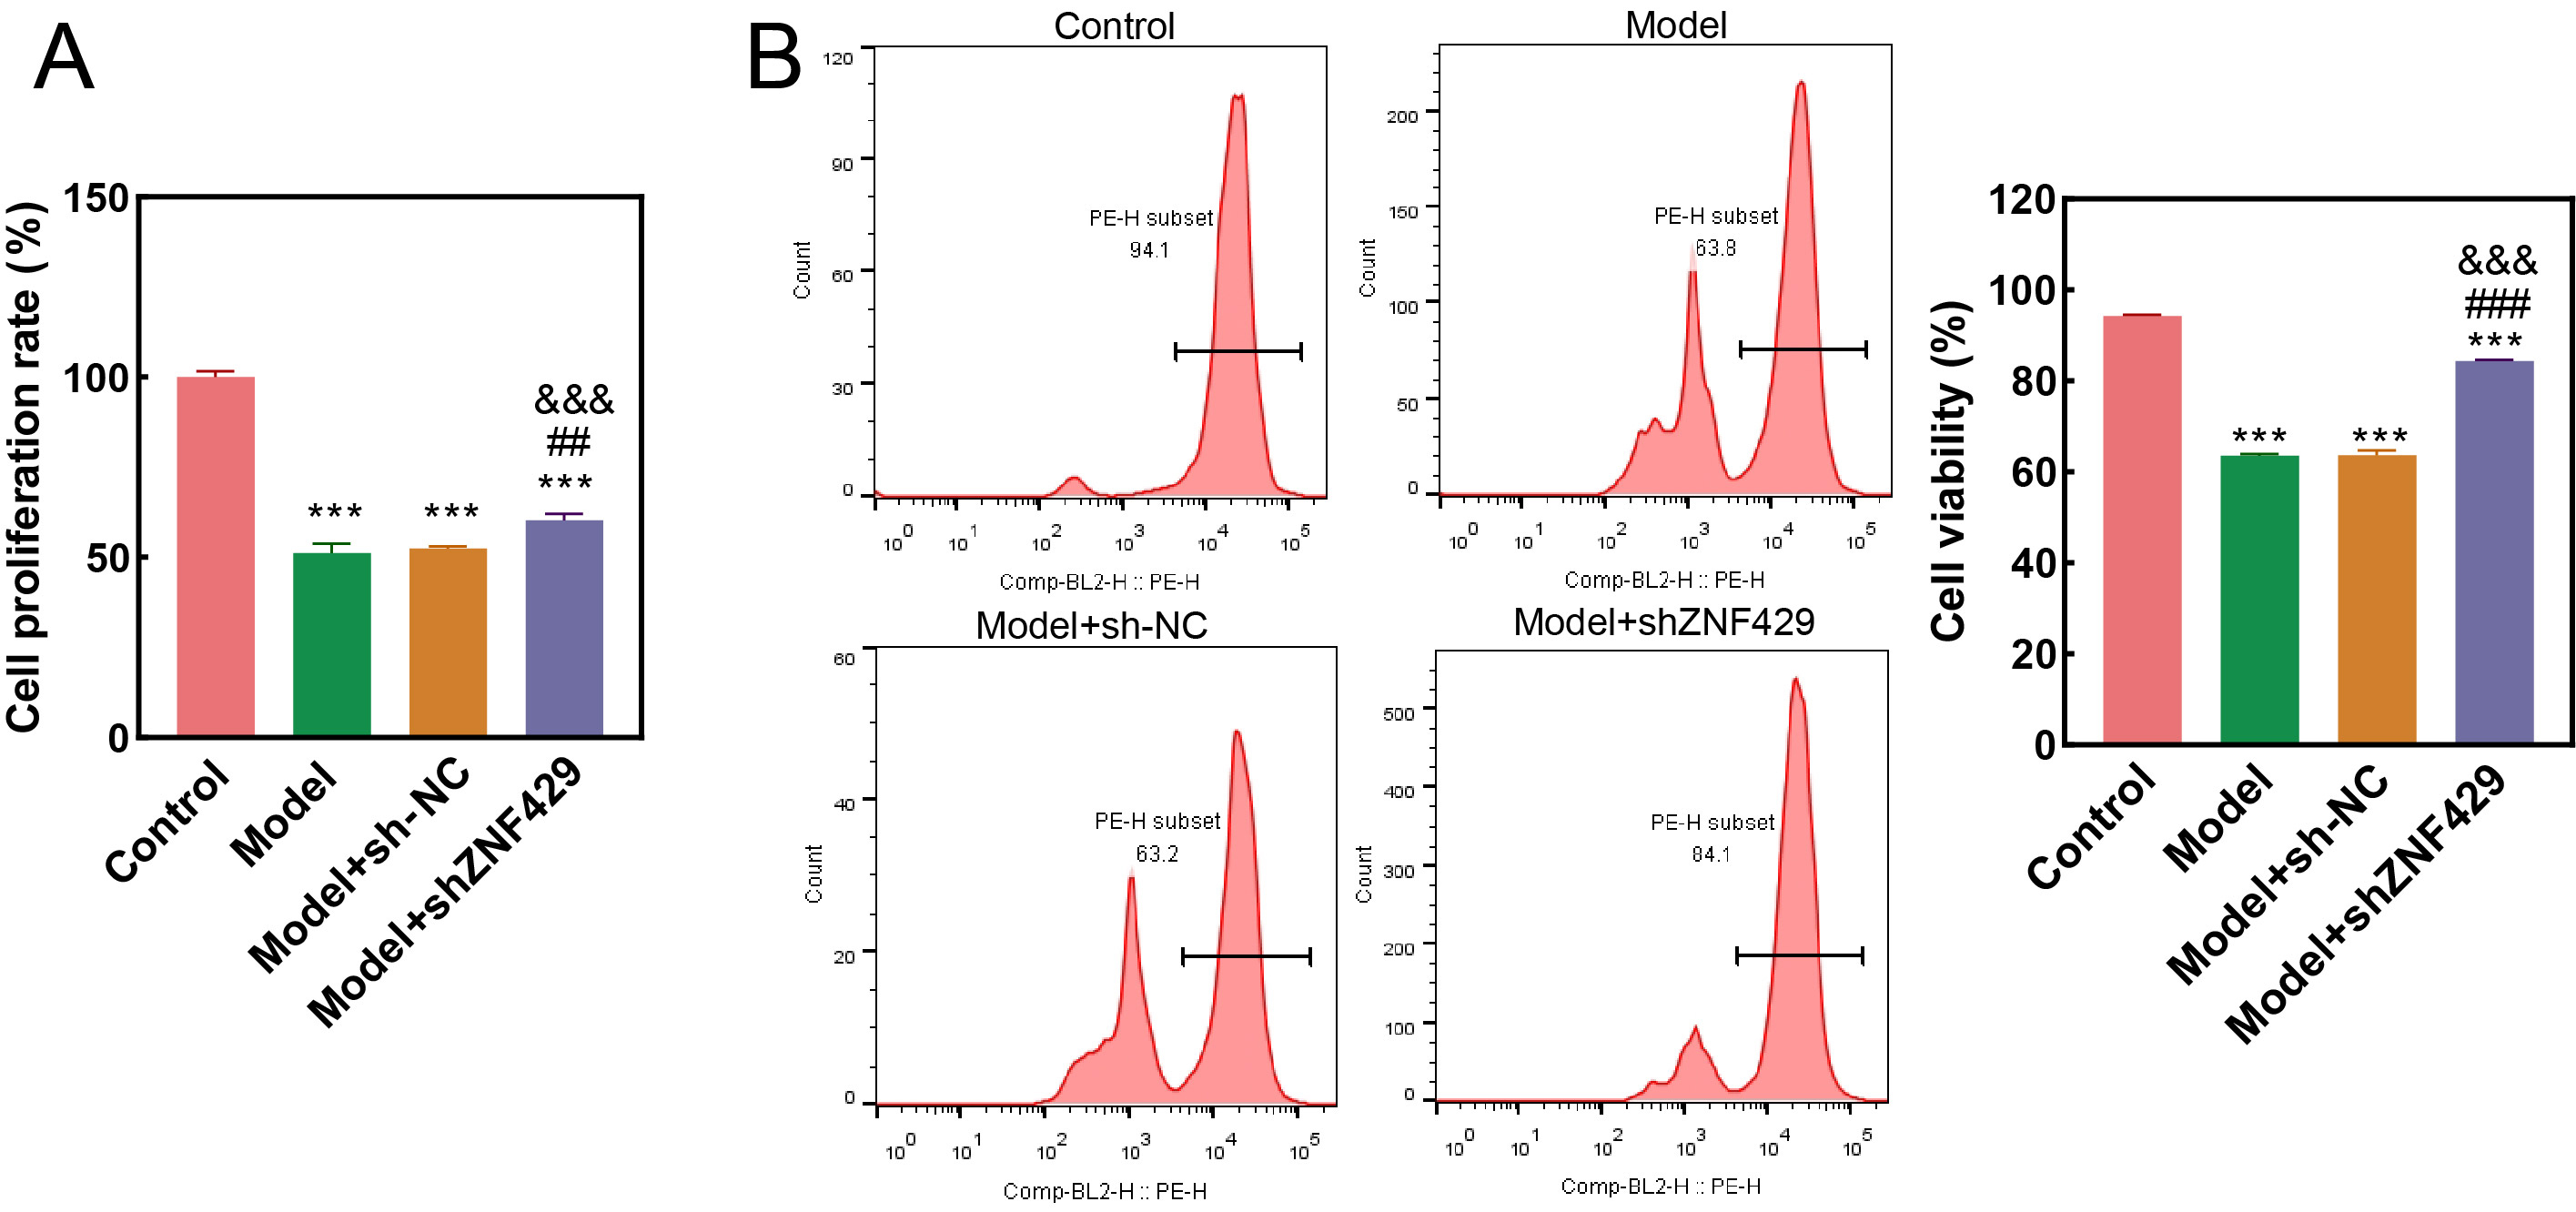
CCK-8 assay results demonstrated a significantly lower
proliferation rate in the model group and model+sh-NC group compared to the
control (p
 Fig. 3.
Comparative analysis of cell proliferation in each
group. (A) Cell proliferation detected via the cell counting kit-8 (CCK-8)
assay. (B) Cell proliferation was evaluated via flow cytometry. PE-H subset:
positive peak, indicating how many (%) proliferating cells were contained.
Compared to control, *** p
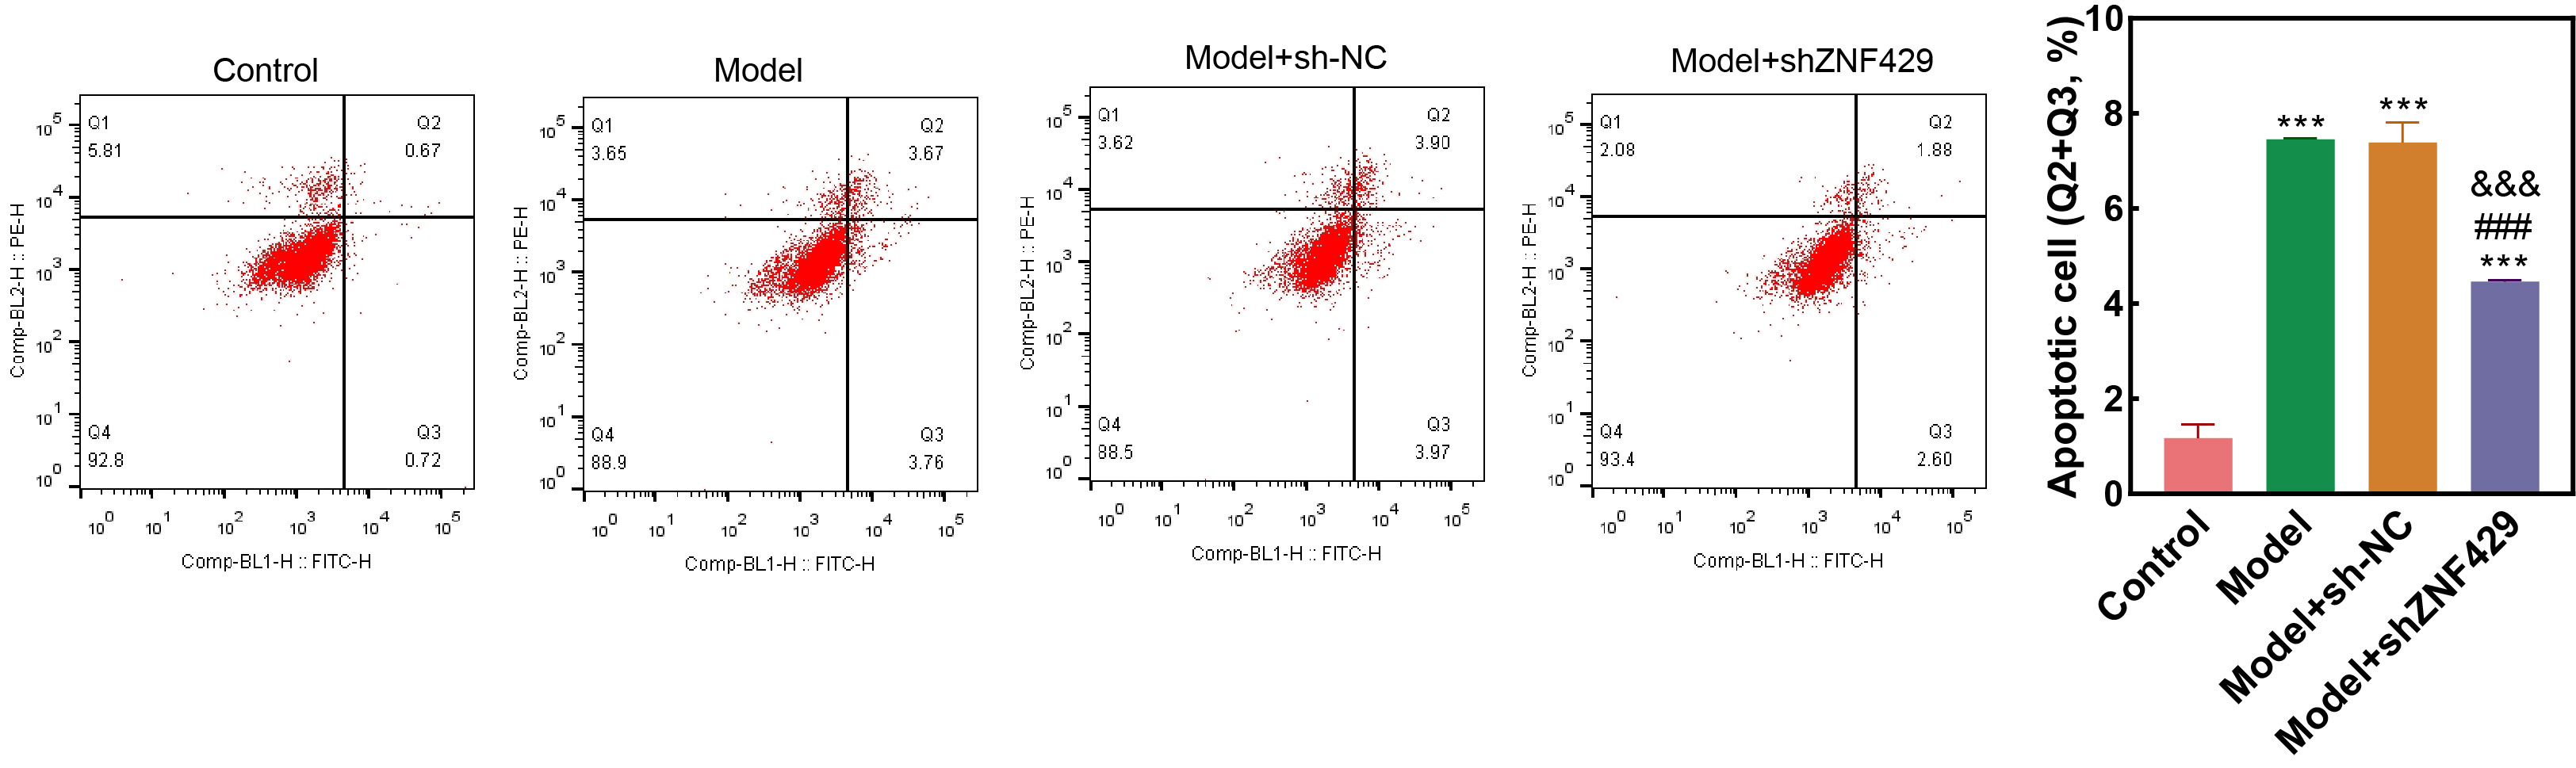
 Fig. 4.
Cell apoptosis detected through flow cytometry.
Compared to control, *** p
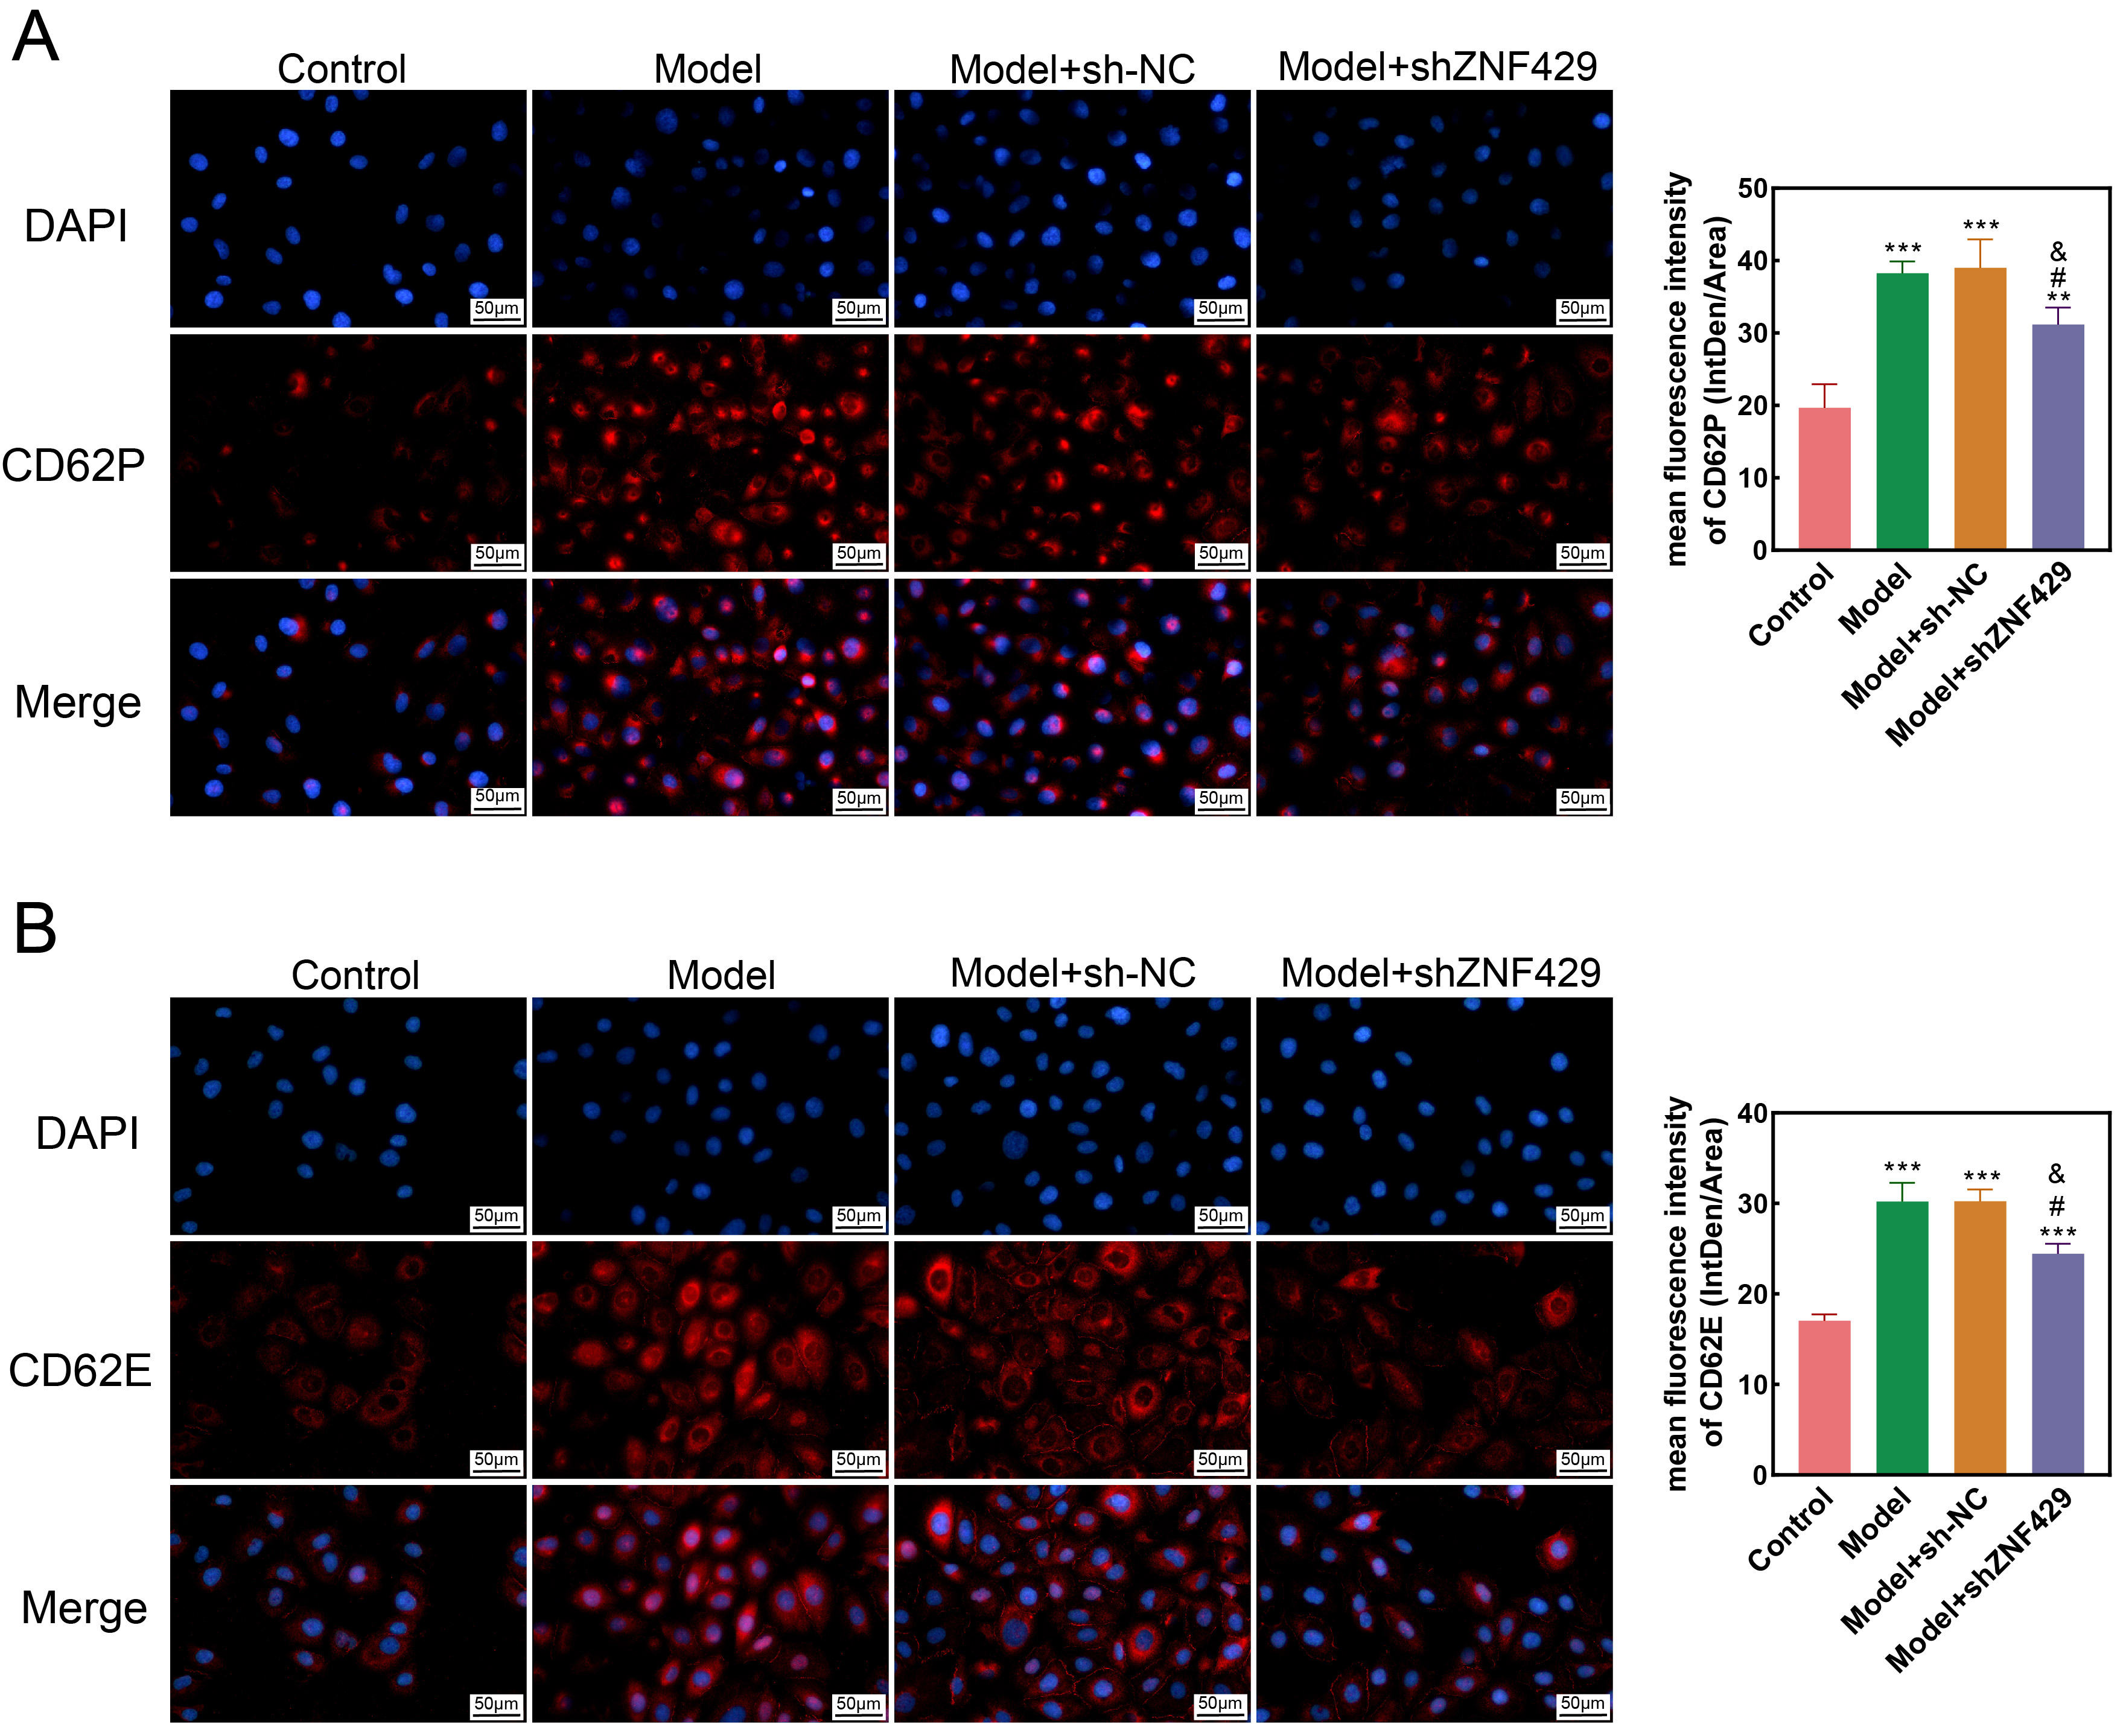
CD62P and CD62E are selectins. Studies have found that CD62P is significantly
elevated in patients with acute coronary syndrome [18, 19, 20], while CD62E plays an
essential role in inflammation [21]. Therefore, we measured the levels of CD62Pand CD62E after knocking down ZNF429. The immunofluorescence detection results
are shown in Fig. 5. CD62P and CD62E levels in model and model+sh-NC groups were
significantly increased vs control (p
 Fig. 5.
Immunofluorescence detection
of CD62P and CD62E levels in cells. (A) The effect of interference with ZNF429
on the levels of CD62P in each group (400
CHD is a prevalent and global health concern due to high mortality in diverse age groups. Its pervasive impact places considerable strain on healthcare systems, in terms of both public health and economic implications [8]. New putative biomarkers are crucial for effective screening of CHD and primary prevention strategies. In this study, we utilized RNA sequencing-based gene expression analysis to identify potential biomarkers of congenital heart disease. Functional and pathway enrichment analyses of the DEGs revealed potential molecular mechanisms underlying CHD pathogenesis. GO enrichment analysis revealed significantly enriched processes such as leukocyte-mediated immunity, T-cell receptor complex, lymphocyte-mediated immunity, and antigen binding. KEGG analysis enriched pathways such as ribosome and MAPK signaling pathways. Employing WGCNA allowed the identification of gene modules with shared expression patterns, further revealing hub genes within modules significantly associated with clinical features pertinent to the disease [22]. Of particular interest is that turquoise and brown modules had the highest correlation with CHD traits.
In this study, we identified two hub genes (SLC16A6 and ZNF429) through LASSO model analysis. The solute carrier 16 (SLC16) family is a group of membrane proteins that mediates the transmembrane transport of monocarboxylate complexes [23]. Alterations in the expression and transport of some SLC16 transporters can contribute to the occurrence of certain diseases, including cancer, diabetes, and neurological disorders [24]. Zinc finger proteins regulate DNA-dependent transcription frequency, rate, or extent. Despite its involvement in analgesic drug metabolism and pain pathways, the biological role of ZNF429 in CHD remains unclear. Identified within the turquoise and brown modules, these genes exhibited strong associations with CHD, extending their significance across diverse functions pertaining to CHD pathogenesis. These functions include the regulation of protein ubiquitination, ribosomes, phosphatidylinositol bisphosphate phosphatase activity, and eukaryotic translation initiation factor 4F complex. Therefore, we explored deeper into understanding the effect of ZNF429 on CHD.
Various inflammatory and adhesion molecules participate in the development of
coronary artery atherosclerosis [25]. The factors IL-1
Prior research has demonstrated that factors CD62E, CD62P, ICAM-1, and VCAM-1
are elevated in patients with cerebral small vessel disease and
arterial hypertension. These markers can be regarded as surrogates of endothelial
expression [34, 35]. Khanam et al. [36] have found that during the
progression of the disease, cells produce inflammatory cytokines such as
TNF-
In summary, this study identified CHD-related biomarkers through bioinformatics
analysis and validated them in HUVEC. These results indicate that ZNF429
regulates the progression of CHD by modulating the expression of IL-1
The datasets used and analyzed during the current study are available from the corresponding author upon reasonable request.
HW and BW performed most of the experiments, analyzed the data, and drafted the manuscript. XQH was mainly involved in data acquisition and article writing. WL and WQG interpreted the data and participated in article revision. HW participated in the project design and critically revised the manuscript. All authors contributed to editorial changes in the manuscript. All authors have contributed to and approved the final manuscript. All authors participated sufficiently in the work and agreed to be accountable for all aspects of the work.
Not applicable.
Not applicable.
This research received no external funding.
The authors declare no conflict of interest.
References
Publisher’s Note: IMR Press stays neutral with regard to jurisdictional claims in published maps and institutional affiliations.