


 , Li Liu 1, Yueting Xing 1, Jiajia Wang 1, Wei Yin 1, Yingying Huang 1, Chun Guo 1, Nan Zhou 1
1 Core Facilities, School of Medicine, Zhejiang University, 310058 Hangzhou, Zhejiang, China
Abstract
Background: As a common drug for tumor therapy, doxorubicin
hydrochloride (DOX) is not yet widely used as a clinical solution. This is due to
its toxicity and potential drug resistance. Objective: This study
investigated the inhibitory effect of enteromorpha prolifera polysaccaharide
(EPP) combined with doxorubicin hydrochloride (DOX) on A549 cells, which fall
into the cell line of human non-small cell lung cancer (NSCLC). It also explained
the attenuated and synergistic effect of enteromorpha acid polysaccharide along
with its synergistic effect on DOX. Methods:
To evaluate the proliferation inhibitory effect
of EPP, DOX and both combined, we monitored cell growth curve and morphology
using the real-time cell function analysis and imaging system—xCELLigence RTCA
eSight system (eSight system). Flow cytometry was used to monitor cell apoptosis
rate and cell cycle distribution. Mitochondrial function was tested by the energy
metabolism analysis system. Results: EPP could work with DOX to inhibit
the proliferation of A549 cells. Growth curve showed that when 0.4 mg/mL of EPP
was mixed with 0.2 µg/mL of DOX for 24 h, the mixure liquid had a
significant inhibitory effect on the proliferation of A549 cells (p
Keywords
- non-small cell lung cancer (NSCLC)
- enteromorpha prolifera polysaccaharide (EPP)
- doxorubicin hydrochloride (DOX)
- synergistic inhibition
Lung cancer is the most malignant neoplasm with the highest mortality rate among cancer. It poses threats to both men and women. Around 85% of lung cancer cases are categorized as non-small cell lung cancer (NSCLC) and the number is still increasing numbers in recent years [1, 2, 3, 4, 5]. Chemotherapy is the major method to treat NSCLC [6, 7]. Among various therapies, doxorubicin hydrochloride (DOX) is a widely used broad-spectrum antineoplastic agent. However, DOX’s application may lead to severe adverse effects and tumors may gradually develop resistance to it [8, 9, 10]. Thus, it is important to find safe and effective pharmacological interventions to treat lung cancer.
Enteromorpha is a common green alga growing along the coastline of Zhejiang Province [11, 12]. Since ancient times, it has been used for both medicinal and dietary purposes. It is an effective herb to treat inflammation-related ailments such as cough and bronchitis [13]. The main active component of enteromorpha is enteromorpha prolifera polysaccharide (EPP) [14, 15, 16], of which the biological activities include preventing tumor, enhancing immune system and preventing blood clots [17, 18]. Previous studies [17, 19] have confirmed these significant biological activities. However, few studies have directly tested the inhibitory effects of EPP on tumor activity in vitro. This study focuses on the effects of combined drugs of EPP and DOX on A549 cell’s apoptosis, proliferation, cycle, and mitochondrial function. The findings provide an alternative for practitioners to use traditional Chinese medicine (TCM) in the treatment of NSCLC. This is beneficial to scientific and technological development as well as social harmony.
The A549 cell from NSCLC cell strain was provided by the School of Basic Medical Sciences, Zhejiang University. These epithelial-like cells are polygonal in shape with more regular dimensions and grow attached to a substrate in discrete patches.
The light-yellow EPP powder was provided by the School of Chemistry and Bioengineering, Guilin University of Technology, and DOX was from Zhejiang Provincial People’s Hospital. In addition, Roswell Park Memorial Institute (RPMI) medium (Cat# 11875-093), 0.25% trypsin (Cat# 25200-072), and penicillin-streptomycin glutamine (PSG) (Cat# 10378-016), and Fetal bovine serum (FBS) (Cat# A5669701) were purchased from Invitrogen Shanghai Trading Co., Ltd. (Gibco, Shanghai, China). Anhydrous ethanol (Cat# 64-17-5) was obtained from Sinopharm Chemical Reagent Co., Ltd. (Ourchem, Hangzhou, Zhejiang, China) and stored at 4 °C. The E-plate view 96 proliferation plate (Cat# 300601020) was purchased from Hangzhou Rongbang Biotechnology Co., Ltd. (Agilent, Hangzhou, Zhejiang, China). The ATP assay kit (Cat# 103592-100) and mitochondrial stress assay kit (Cat# 103015-100) were from Hangzhou BioSmile Biotechnology Co., Ltd. (Agilent, Hangzhou, Zhejiang, China). The six-well plates (Cat# 3799), centrifuge tubes (Cat# 430829), flow cytometry tubes (Cat# 352235), and 40 µm cell strainers (Cat# 352340) were purchased from Shanghai Pufei Biotechnology Co., Ltd. (Shanghai, China). The Annexin V-FITC/PI apoptosis detection kit (Cat# AP101) and PI cell cycle kit (Cat# CCS012) were from Hangzhou MultiSciences Biotechnology Co., Ltd. (MultiSciences, Hangzhou, Zhejiang, China)
First, 100 mg of EPP powder was taken and placed in a 50 mL centrifuge tube. Next, 10 mL of ddH2O (0.22 µm) (Millipore, Hangzhou, Zhejiang, China) was slowly added to the tube and the powder was dissolved by ultrasonic apparatus (Xiaomeichaosheng, Kunshan, China). Then, an autoclave (Yamato, Chongqing, China) was used for sterilization and sterile ddH2O was added to make a 10 mL solution. Finally, the 10 mg/mL EPP stock solution was made. Finally, 1 mg/mL DOX stock solution was made by dissolving 1 mg DOX powder into 1 mL of sterile saline.
The EPP group: the working concentrations of EPP were sequentially diluted in cell culture medium to 0.2, 0.4, 0.8, 1.6, and 3.2 mg/mL.
The DOX group: the working concentrations of DOX were sequentially diluted to 1, 2, 5, and 10 µg/mL in the cell culture medium.
The EPP+DOX group: DOX solutions at concentrations of 1, 2, and 5 µg/mL were mixed with EPP solutions at concentrations of 0.2, 0.4, 0.8, 1.6, and 3.2 mg/mL.
The A549 cell line of the human non-small cell lung cancer (NSCLC) were provided by the Prof. Yuehai Ke (originally purchased from ATCC). The cell line was maintained at 37 °C with 5% CO2, validated by short tandem repeat(STR) profiling and tested negative for mycoplasma contamination using MycoSensor PCR assay kit (Agilent, Hangzhou, China). A549 cells were cultured in RPMI medium supplemented with 10% fetal bovine serum (FBS) and 1% penicillin-streptomycin glutamine (PSG). The medium was replaced every 1–2 days. When they were 80% confluent, the cells were passaged with 0.25% trypsin. This process was repeated for 5 passages.
The eSight system integrates real-time and label-free analysis technology with
live cell imaging for cell phenotype analysis and cell-growth tracking. A
suspension of 4
A549 cells were cultured until they grow exponentially. After discarding the old culture medium, cultured cells with no drug administration were used as control groups. The cells used in experimental groups were treated with EPP, DOX, or the combination of both. Each group had 3 replicates. Next, the cells were cultured for another 24 hours. After trypsin digestion and centrifugation, the cell pellets were collected for flow cytometry to analyze the cell’s apoptosis and cell cycle.
(1) Cell Apoptosis Analysis: After the cell pellets were resuspended in 500
µL of 1
(2) Cell Cycle Analysis: The cell pellets were washed and centrifuged in pre-chilled phosphate-buffered saline (PBS) for three times. After washing, the supernatant was discarded. The cell pellets were resuspended in 300 µL of pre-chilled PBS, followed by slow and uniform addition of 700 µL of pre-chilled absolute ethanol. After mixing, the fixed cells were kept at 4 °C overnight. The supernatant was then discarded, and the cell pellets were washed again using the pre-chilled PBS. The cells were resuspended in 500 µL of PBS to get a single-cell suspension. Next, 1 µL of RNase A (20 µg/mL) and 2.5 µL of PI staining solution (5 µg/mL) were added to the suspension. The mixture was incubated at room temperature for another 10 minutes in the darkness. Next, the cell suspension was filtered by a cell strainer, which had 40 µm mesh and was connected with the tubes of flow cytometry for further analysis.
A549 cells were cultured until they grow exponentially. After discarding the old culture medium, cultured cells with no drug administration were used as the control group. Those used in experimental groups were treated with EPP, DOX, or the EPP+DOX combination, respectively. At least 6 replicates were set up per condition. The cells were then cultured for another 24 hours. Before the experiment, the instrument and the probe plate were heated, and the probe plate was hydrated. When we started the experiment, we first prepared the analysis and detection solution to wash the cells. The ATP production rate assay kit and the mitochondrial stress test kit were used to measure the ATP production rate and the mitochondrial respiration and standard drugs was added to the probe plate. Then, the probe plate was mixed with the cell plate and placed in the instrument. After the measurement, 10 µL of radio immunoprecipitation assay lysis buffer (RIPA) was transferred into each well in the plate to lyse the cells. After two freeze-thaw cycles at –80 °C, we calculated the protein content in each well and the cellular ATP production rate to assess the mitochondrial respiration.
Representative results were selected from the experiment data for presentation.
FlowJo_V10 software (BD Biosciences, San Jose, CA, USA), ModFit LT Version 5
software (Verity Software House, Topsham, ME,
USA), and GraphPad Prism 9.0 software (GraphPad Software, La Jolla, CA, USA) were
used to process the data. The values of IC50 were reported as the mean
Half-maximal inhibitory concentration (IC50) is the most popular method to measure a drug’s efficacy. It indicates the necessary amount of drug to inhibit 50% cell growth—the lower the IC50 value, the more potent the drug will be in anti-tumor activity [20].
A549 cells were plated for proliferate exponentially and then treated with EPP
at different concentrations (0.2, 0.4, 0.8, 1.6, and 3.2 mg/mL). The eSight
system was adopted to monitor the cells for 72 hours and draw the cell
proliferation curves (Fig. 1) in real time. Compared with the control group
(p
 Fig. 1.
The effect of Enteromorpha prolifera polysaccaharide
(EPP) on the proliferation of A549 cell. (A) The real-time dose-dependent curve
of EPP. (B) The IC50 of EPP. (C) The statistic of cell proliferation
inhibition of EPP on A549 cell at various time points. ****p
A549 cells were treated with DOX at the concentration of 1 µg/mL, 2
µg/mL, 5 µg/mL, and 10 µg/mL. The eSight
system was used to monitor the treatment results and draw the cell proliferation
curves. Compared with the control group (p
 Fig. 2.
The effect of doxorubicin hydrochloride (DOX) on the
proliferation of A549 cell. (A) The real-time dose-dependent curve of DOX. (B)
The IC50 of DOX. (C) The statistic of cell proliferation inhibition of DOX
on A549 cell at various time points. ****p
In order to minimize toxic side effects and reduce activity in A549 cells, we
need to optimize the concentration of EPP and DOX. This experiment compared the
inhibitory effect on cell proliferation of the combined drug at different
concentrations. Specifically, 1 µg/mL, 2 µg/mL, and 5
µg/mL of DOX and 0.2 µg/mL, 0.4 µg/mL, 0.8
µg/mL, 1.6 µg/mL, and 3.2 mg/mL of EPP were tested.
A549 cells were treated with these mixtures for 72 hours. According to the
results, the cell viability decreased in all groups (Fig. 3). When we mixed 2
µg/mL DOX with 0.4 mg/mL of EPP (p
 Fig. 3.
The effect of combination drug treatment of EPP and DOX on the
proliferation of A549 cell. ****p
The optimal concentration was found to effectively inhibit the proliferation of A549 cells after comparing the effects of EPP alone, DOX alone and the mixture of EPP and DOX. In addition, the best synergistic effect of EPP on DOX was 0.4 mg/mL, rather than 0.6 mg/mL, when EPP was used as a single liquid. Therefore, in the subsequent experiments, single EPP liquid was set at 0.6 mg/mL; single DOX liquid was set at 2 µg/mL; and the mixture of EPP and DOX was set at 0.4 mg/mL and 2 µg/mL respectively.
Fig. 4 shows the cell morphology under the eSight system. In the control group, A549 cells had a spindle-shaped morphology and the cell density showed exponential growth overtime. After 72 hours of drug exposure, the cells shrank in volume. In the single EPP treatment group, compared with the control group, A549 cells began to shrink after 24 hours of treatment, indicating a certain inhibitory effect of EPP. In both the single DOX treatment group and the EPP+DOX mixture treatment group, after 24 hours of drug exposure, growth inhibition was also observed. A549 cell experienced shrinkage, cytoplasmic condensation, and gained darker color. In the mixture treatment group, the shrinkage of A549 cell membrane was even more pronounced. The cell became smaller with darker nucleus and more condensed cytoplasm. It color became darker than those in the single DOX treatment group. These observations were consistent with the curve of mixture treatment, which means that the mixture of EPP and DOX demonstrated a greater inhibitory effect on A549 cell proliferation.
 Fig. 4.
The effect of EPP, DOX and combination drug treatment of EPP and DOX on the morphology of A549 cell. Scale bar: 100 µm.
Apoptosis is a programmed process of cell death. Once the apoptosis in tumor
cells is deregulated, the tumor cell will stop developing. Thus, initiating tumor
cell apoptosis would be an effective approach to cure cancer [21]. In this
experiment, A549 cells were treated with EPP at 0.6 mg/mL, DOX, at 2
µg/mL and the mixture of 0.4 mg/mL EPP and 2 µg/mL DOX
for 24 hours. Annexin V-FITC/PI double staining was performed, and flow cytometry
was used to measure the apoptosis rates of the treatment groups and the control
group. The apoptosis rates of the control group were (5.25
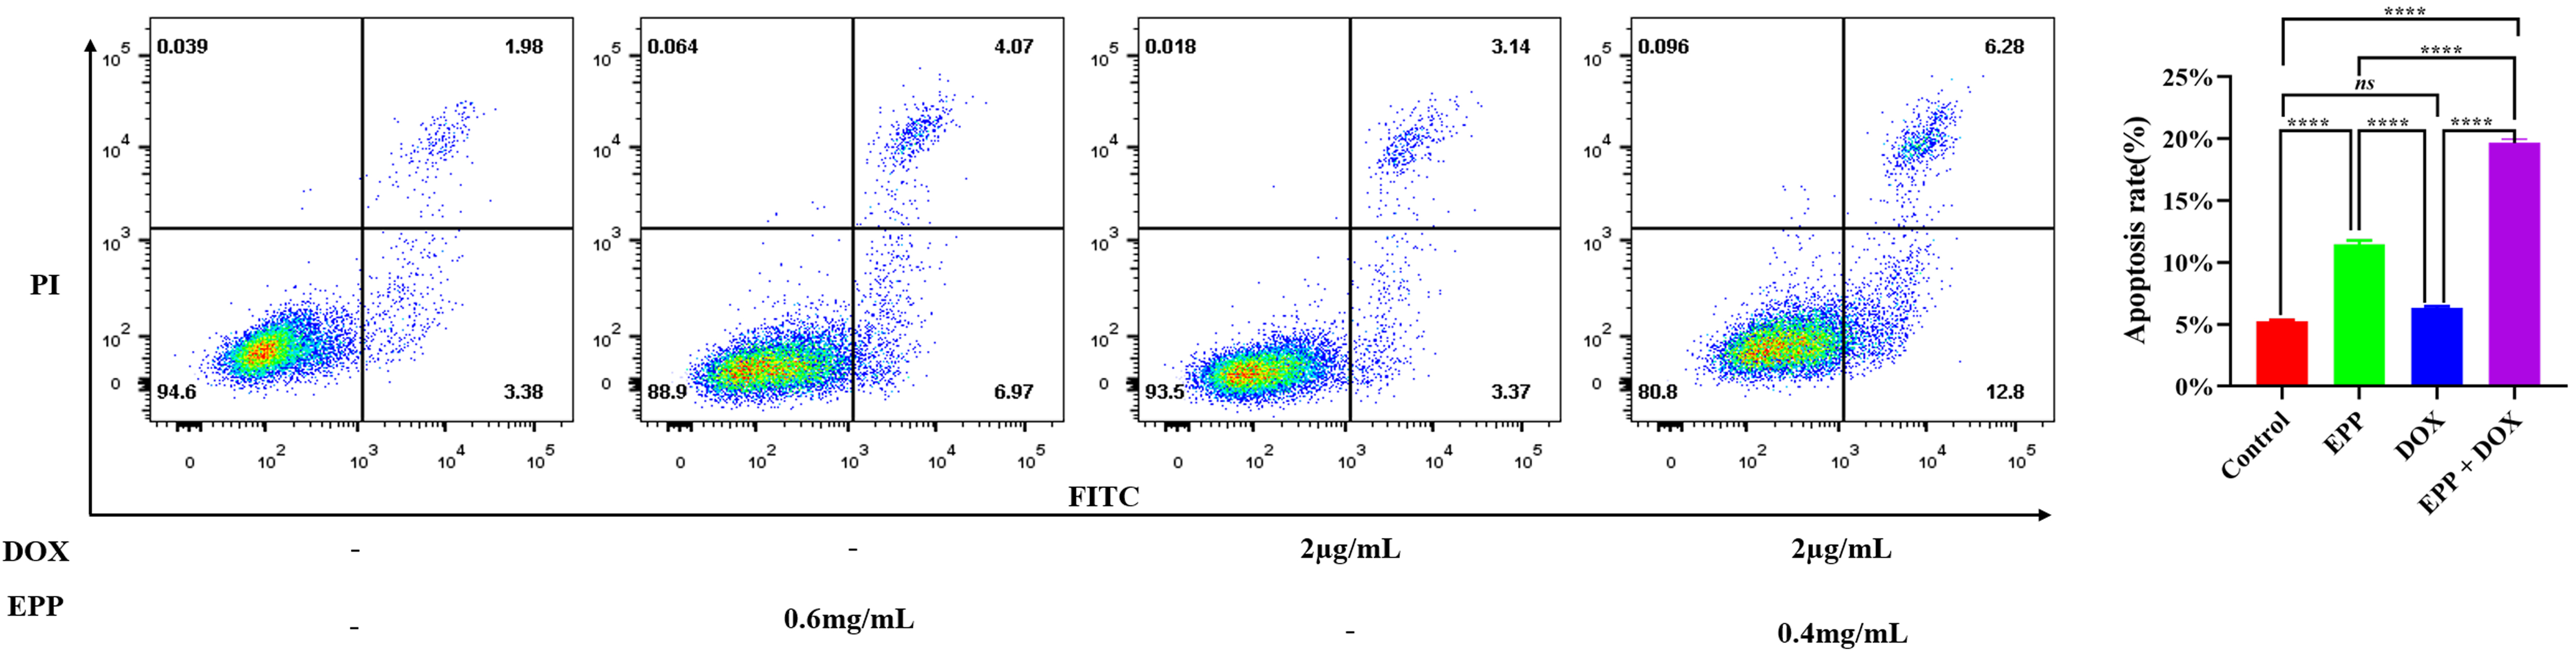 Fig. 5.
The effect of combination drug treatment of EPP and DOX on the
cell apoptosis rate of A549 cell. The DOX group vs. the Control group,
𝑛𝑠p
Cell cycle refers to the cyclical growth and division of cells from one
completion to the next, including the G0-G1 phase (pre-DNA synthesis), S phase
(DNA synthesis and replication), and G2-M phase (DNA inspection, repair, and
division) [22, 23]. In this experiment, A549 cells were treated with 0.6 mg/mL
EPP, 2 µg/mL DOX, or the mixture of 0.4 mg/mL EPP and 2
µg/mL DOX for 24 hours. Flow cytometry was used to detect the
distribution of cells in different cycles (Fig. 6). In the mixture of EPP and DOX
treatment group, there was an increase of cell number in the G0-G1 phase
(p
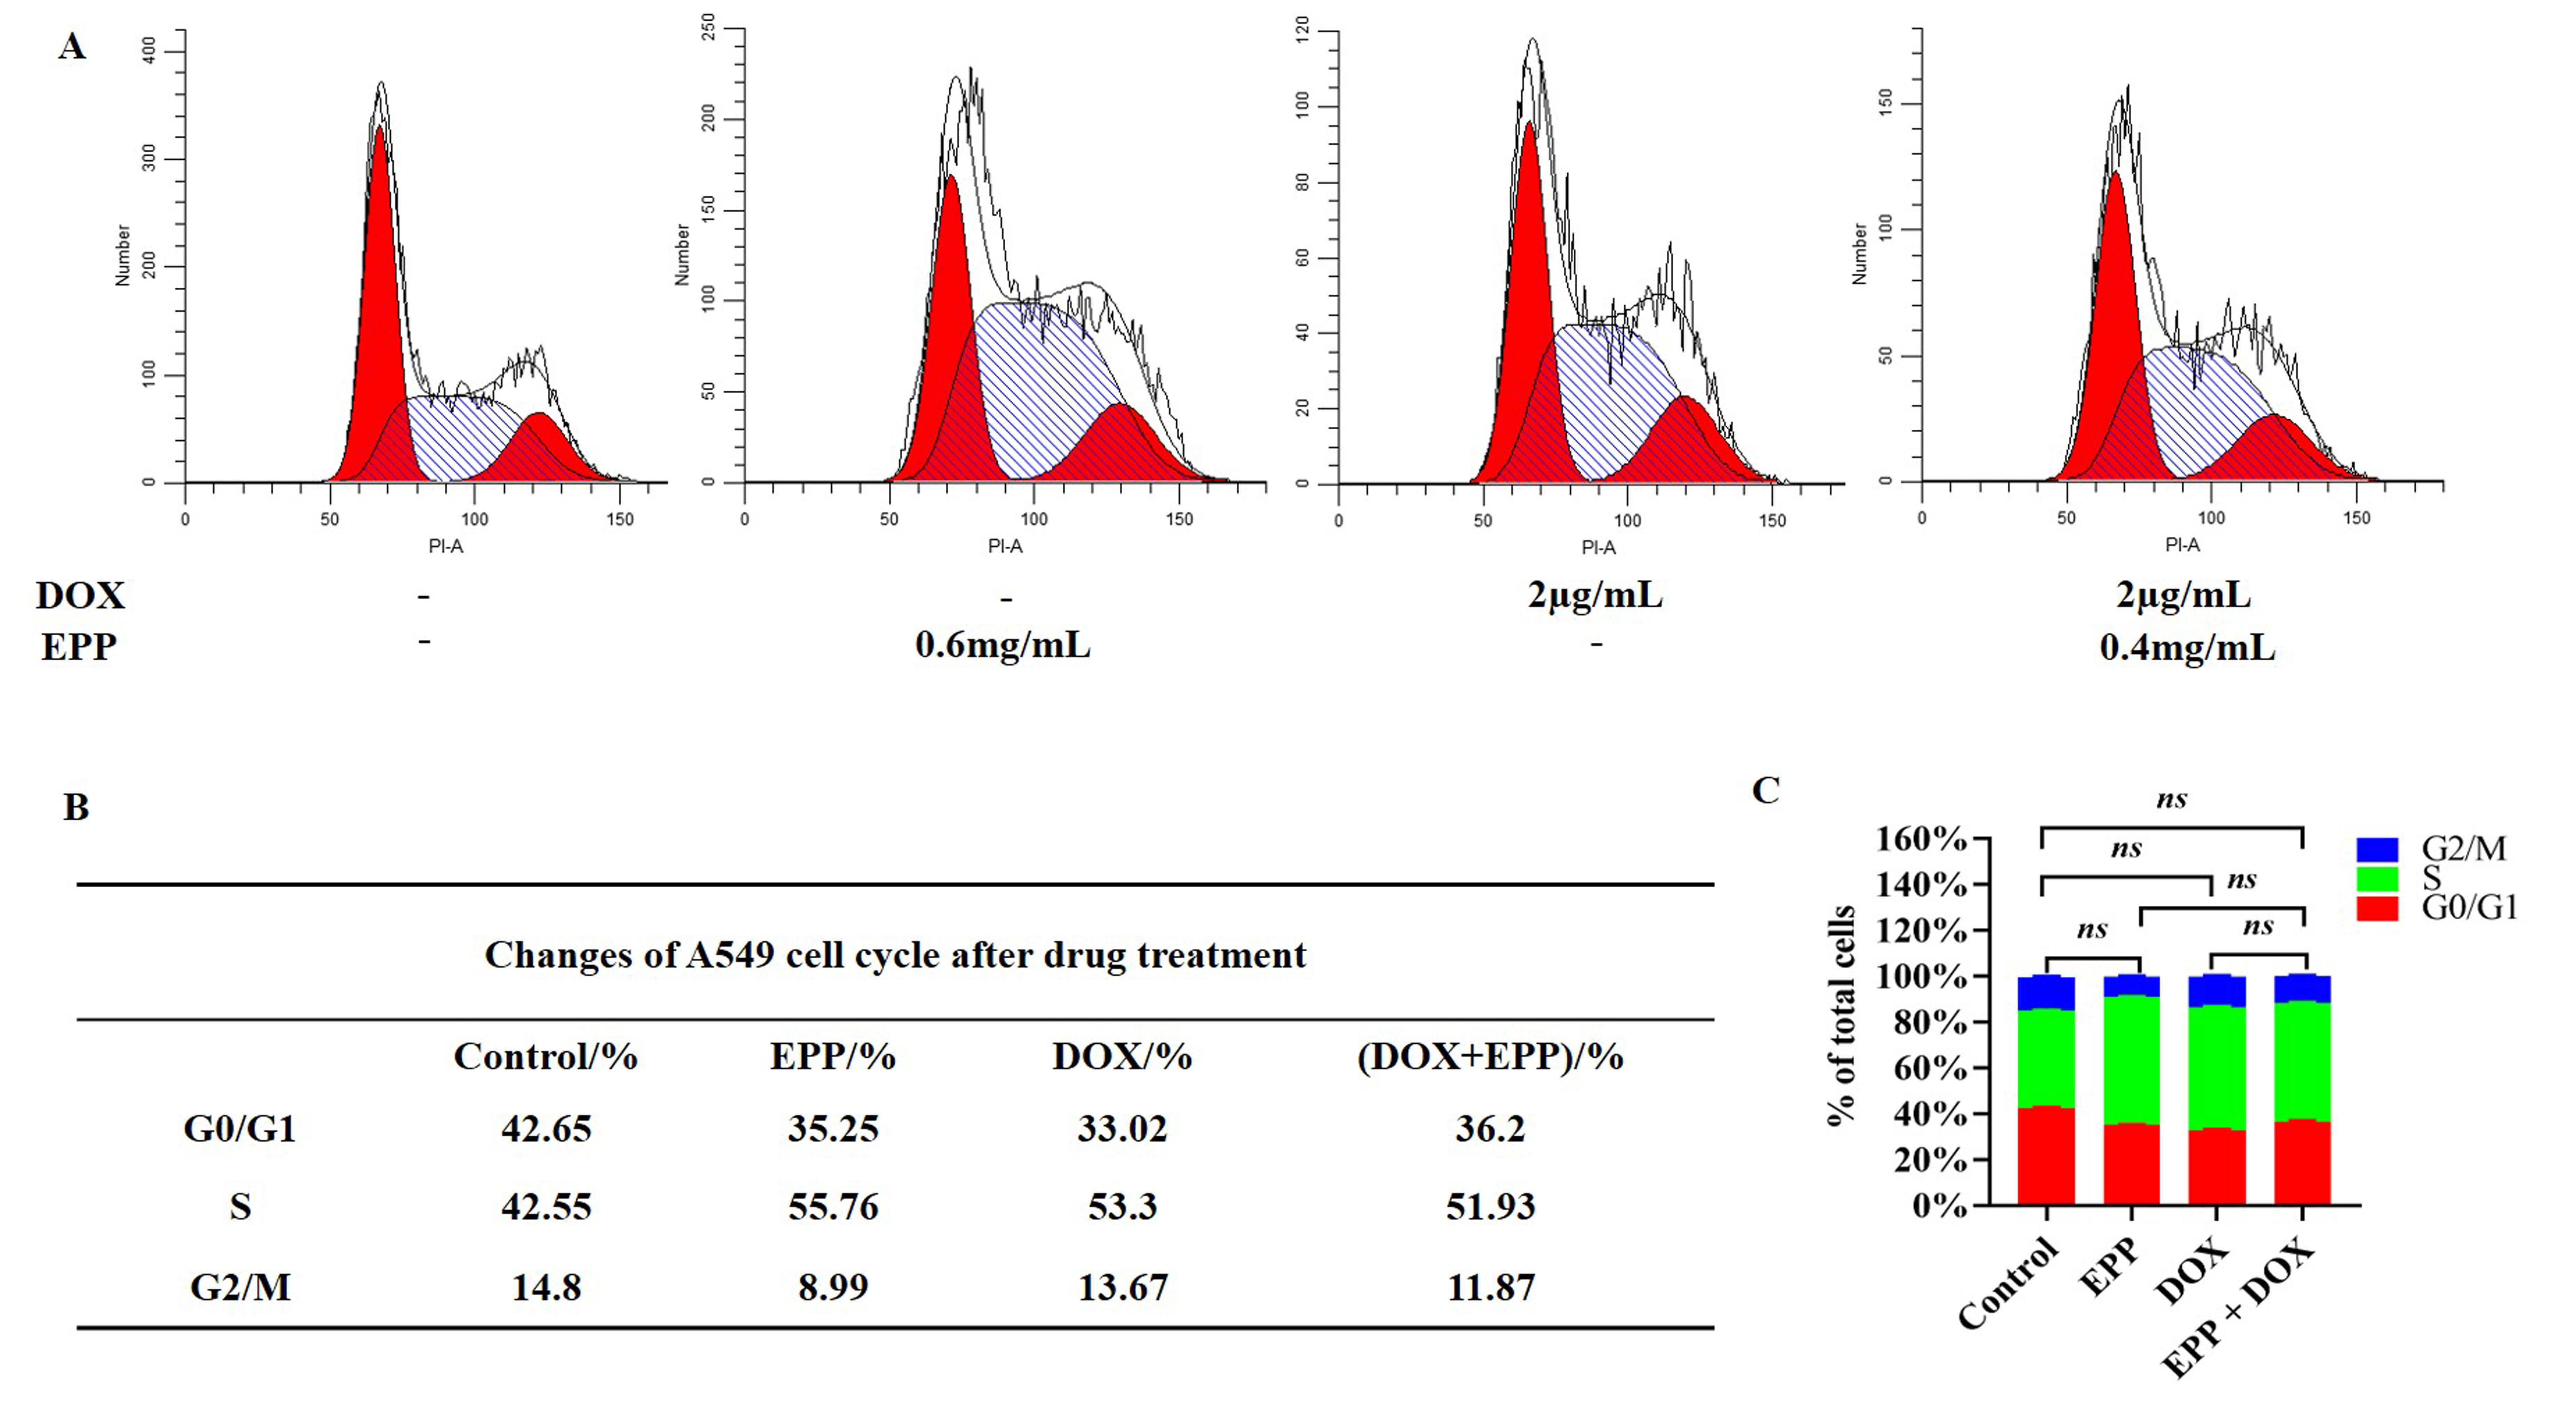 Fig. 6.
The effect of combination drug treatment of EPP and DOX on the
cell cycle of A549 cell. (A) Cell cycle diagram of drug treatment for 24 hours.
(B) Changes of A549 cell cycle after drug treatment. (C) Statistical chart of
A549 cell cycle treated by different drug groups.
𝑛𝑠p
The real-time energy metabolism analysis system (Seahorse XF 96) allows for real-time monitoring of cellular glycolysis and aerobic respiration, making it possible to analyze the intracellular parameters such as glycolytic, mitochondrial ATP production rate, and mitochondrial respiratory function in a dynamic way. This system provides a better understanding of the changes in cellular bioenergetics [24, 25]. Glycolysis is a set of reactions that converts glucose to pyruvate or lactate. It is a crucial energy source for tumor cells, the presence of can be a mark of cancer. ATP serves as the primary source of energy acquisition and storage in living organisms, while cellular apoptosis is an active cell death process that consumes ATP. Mitochondria plays a vital role in generating ATP within cells, and mitochondrial respiration is closely associated with cellular ATP level. Decreased mitochondrial function often coincides with a reduction in ATP level [26]. Therefore, inhibiting glycolysis to lower ATP level and impairing mitochondrial respiratory function can kill tumor cells targetedly.
Fig. 7 shows the results of treating A549 cells with single EPP, single DOX, and
the mixture of EPP and DOX for 24 hours. Compared with the control group, the
EPP+DOX mixture treatment significantly inhibited glycolytic ATP production rate
(p
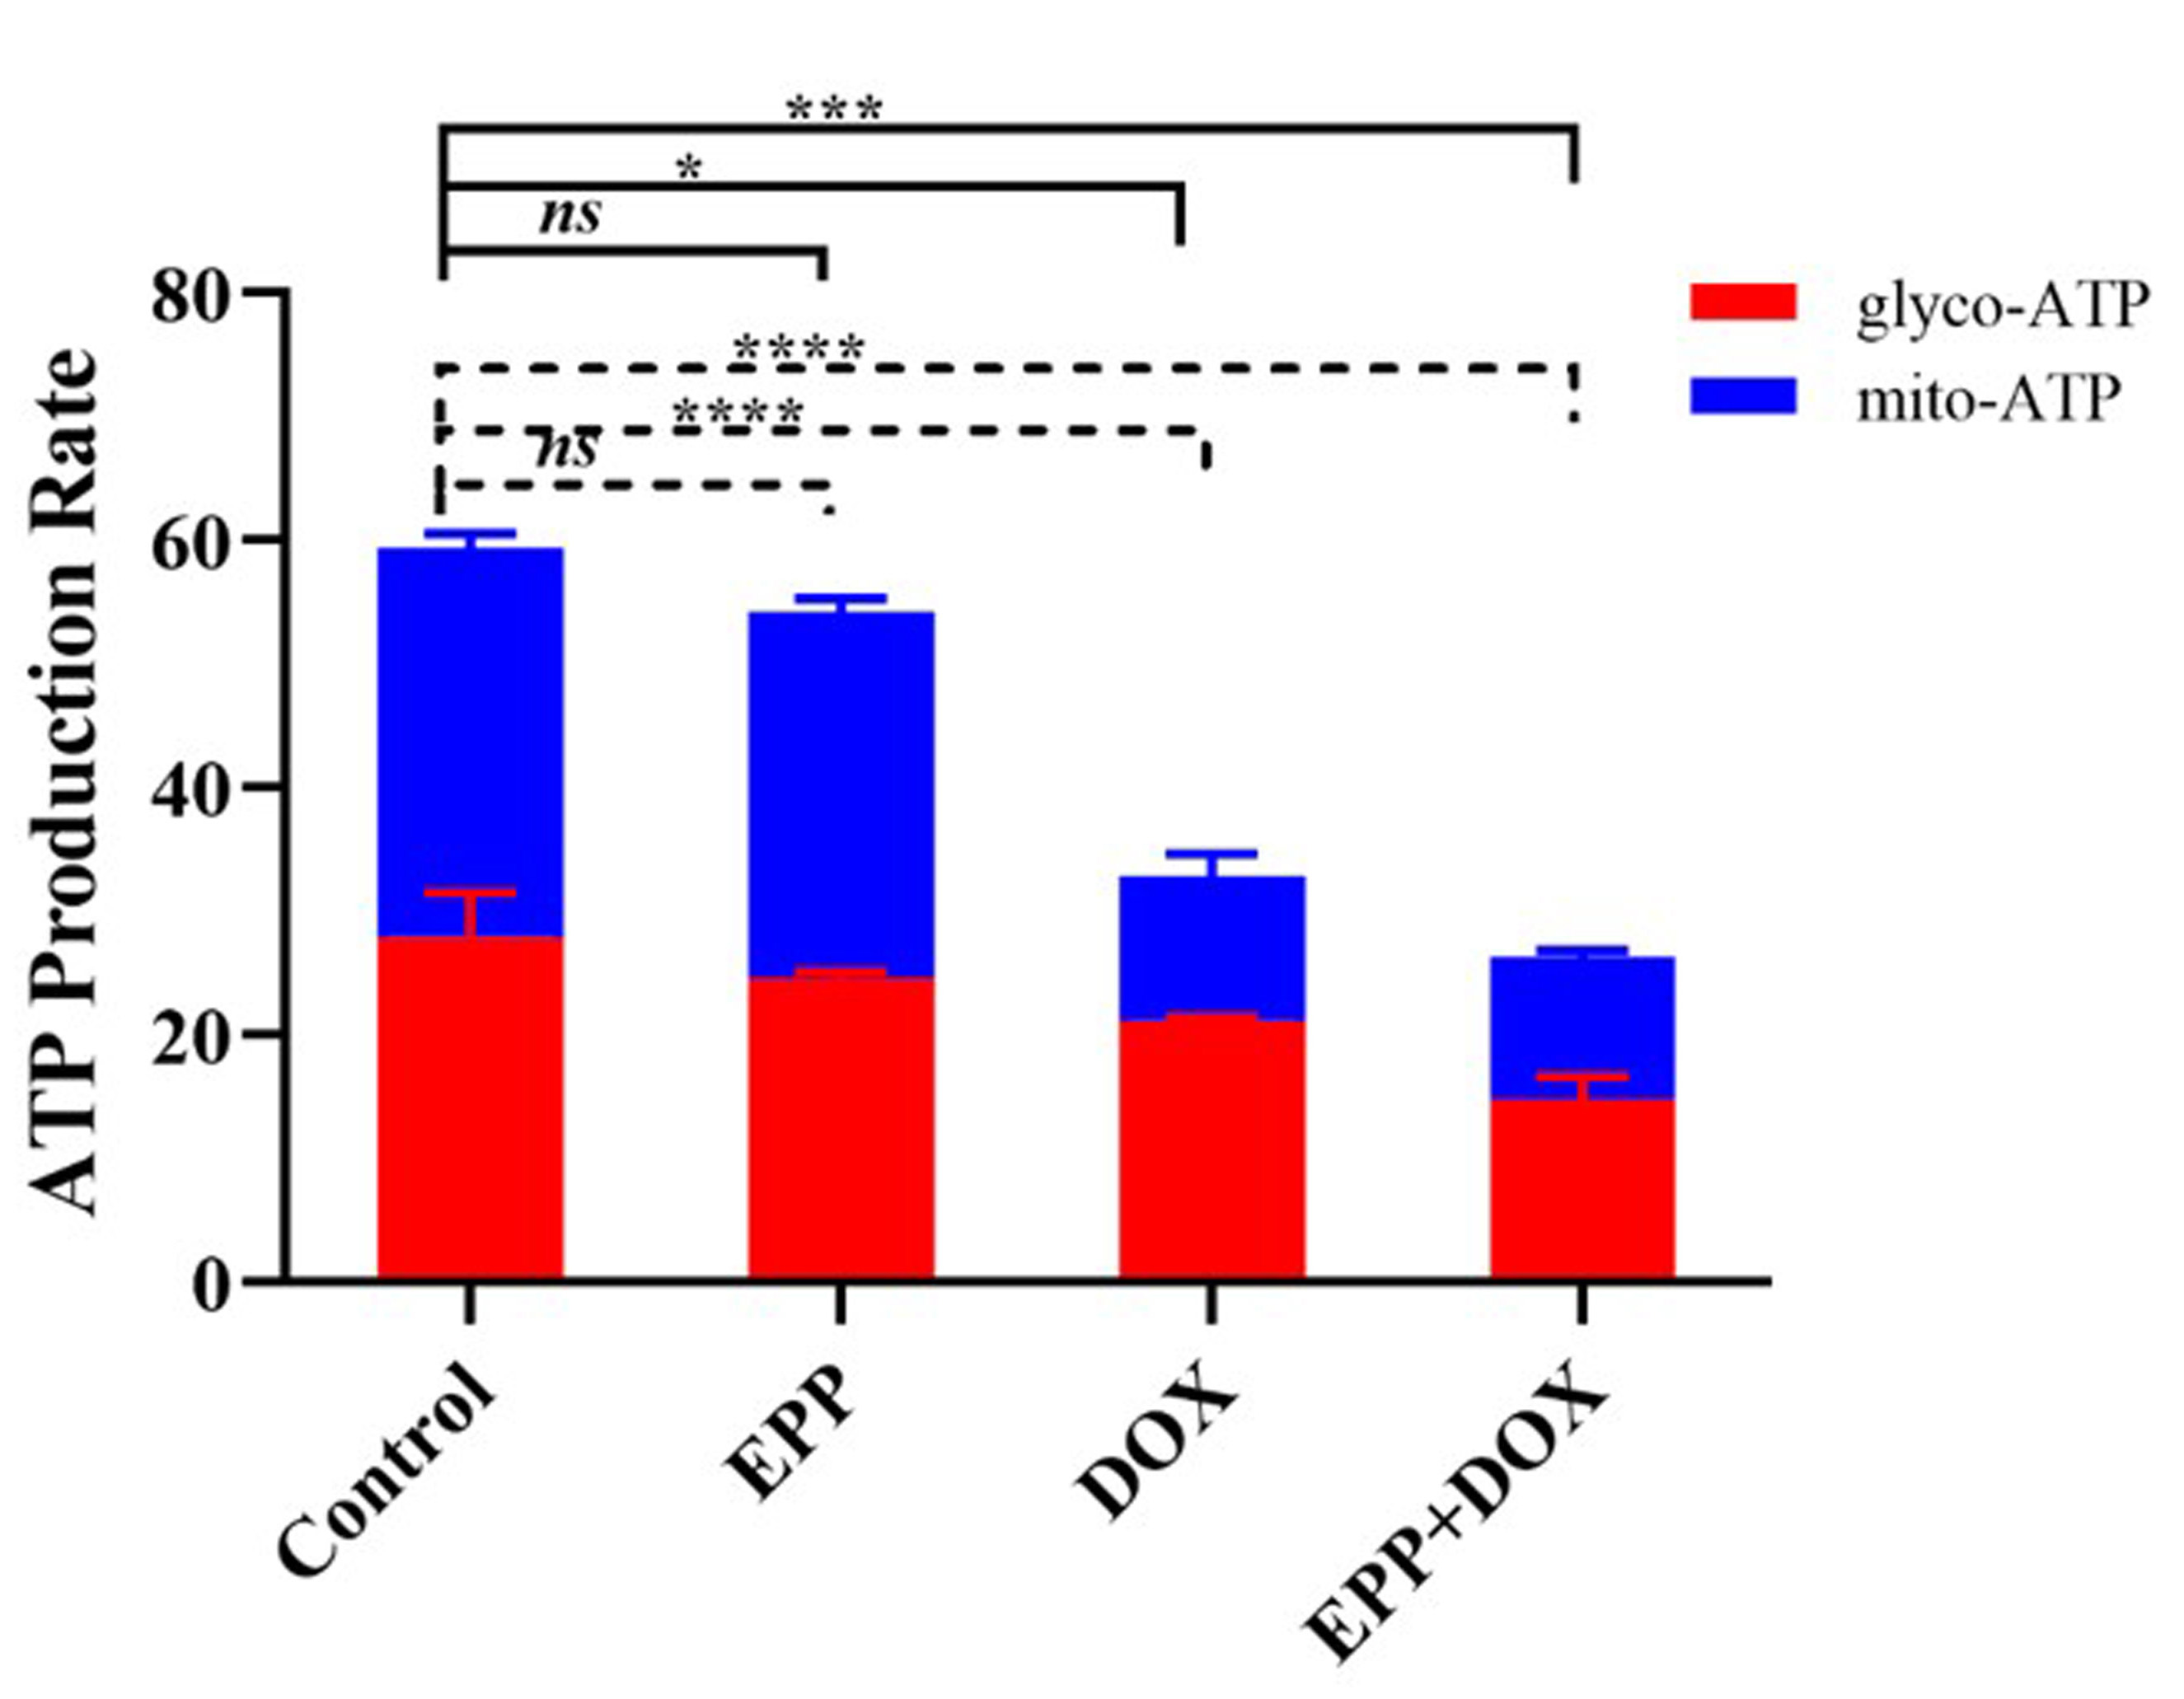 Fig. 7.
The effect of combination drug treatment of EPP and DOX on the
ATP production rate of A549 cell. ****p
Following the treatment of A549 cells with single EPP, single DOX, and the
mixture of EPP and DOX for 24 hours (Fig. 8), it was observed that the EPP+DOX
mixture treatment led to a significant decrease in ATP production (p
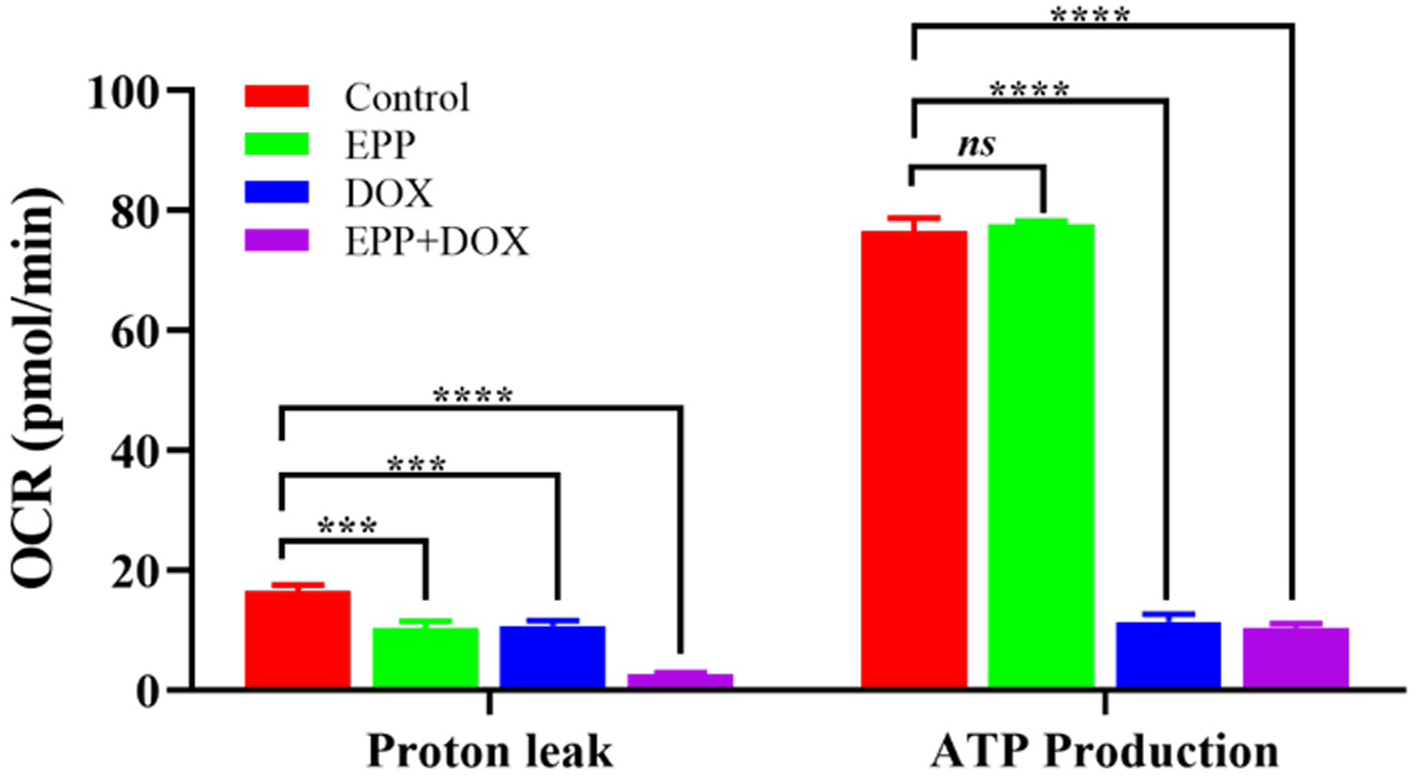 Fig. 8.
The effect of combination drug treatment of EPP and DOX on the
mitochondrial respiratory function of A549 cell. ****p
Doxorubicin hydrochloride (DOX) is an antineoplastic chemotherapeutic drug under anthracycline class. It shows various anti-tumor activities and is widely used to treat lung cancer, breast cancer, and gastric cancer [23]. However, DOX has toxic side effect and tumors will get resistance to it. To improve its clinical use and avoid detrimental impact on patient, it is significant to find solutions.
Traditional Chinese medicine (TCM) is the result of Chinese culture and wisdom. Now, more and more TCM drugs are used to enhance the efficacy of therapies, reduce drug toxicity, inhibit tumor growth, and prevent drug resistance, especially in the field of cancer treatment [4]. Its active ingredients can increase tumor cells’ sensitivity to DOX, reduce drug resistance, control the growth of tumor cells and alleviate the adverse effect [4, 5, 27]. EPP, an acidic polysaccharide found in Enteromorpha, possesses unique anti-tumor and immunomodulatory properties [19, 28]. In this study, the mixture of EPP and DOX was used to treat A549 lung cancer cells. By examining cell proliferation, apoptosis, cell cycle distribution, mitochondrial function, among others, this study has probed into the inhibitory effect of the mixture on the activity of A549 lung cancer cells.
The eSight system is used to monitor the inhibiting effect of EPP, DOX and their mixture on A549 cells in real-time. Results showed that different concentrations of EPP and DOX could inhibit A549 cell growth that was dose independent. The calculated IC50 values indicated that 0.6 mg/mL EPP and 2 µg/mL DOX can be used in the follow-up experiment to study the mixture’s inhibiting effect on A549 cell activity. Furthermore, from the analysis of the curves of a single treatment based on real-time monitoring and the observation of A549 cell morphology at different time points, significant differences were found between the treatment and the control group after 24 hours of drug exposure. These findings paved the way for evaluating the effect of drugs in future studies.
To better use pharmacological properties and improve the efficacy of DOX, this study mixed DOX with EPP to lower its toxic side effect of DOX while still inhibiting the growth of A549 lung cancer cells [29]. We used the eSight system (as shown in Fig. 3) to make the real-time proliferation curves that show the changes in A549 cells treated with different concentrations of EPP mixed with different concentrations of DOX. We observed that the low-dose EPP+DOX group induced cell apoptosis initially and, as time extended, cells were led to death, resulting in the inhibition of A549 cell activity. In comparison, the high-dose EPP+DOX group rapidly induced cell necrosis, achieving the inhibitory effect on A549 cell activity [30]. Compared with the control group, the treatment groups with a single drug, or the combination of EPP+DOX, show dose-dependent characteristics in terms of CI values and morphological changes in A549 cells. Specifically, the mixture of 0.4 mg/mL EPP and 2 µg/mL DOX (Fig. 9) had significantly higher inhibitory effect. These findings suggested that the synergistic effect of EPP and DOX substantially enhanced the inhibitory effect on A549 cell activity.
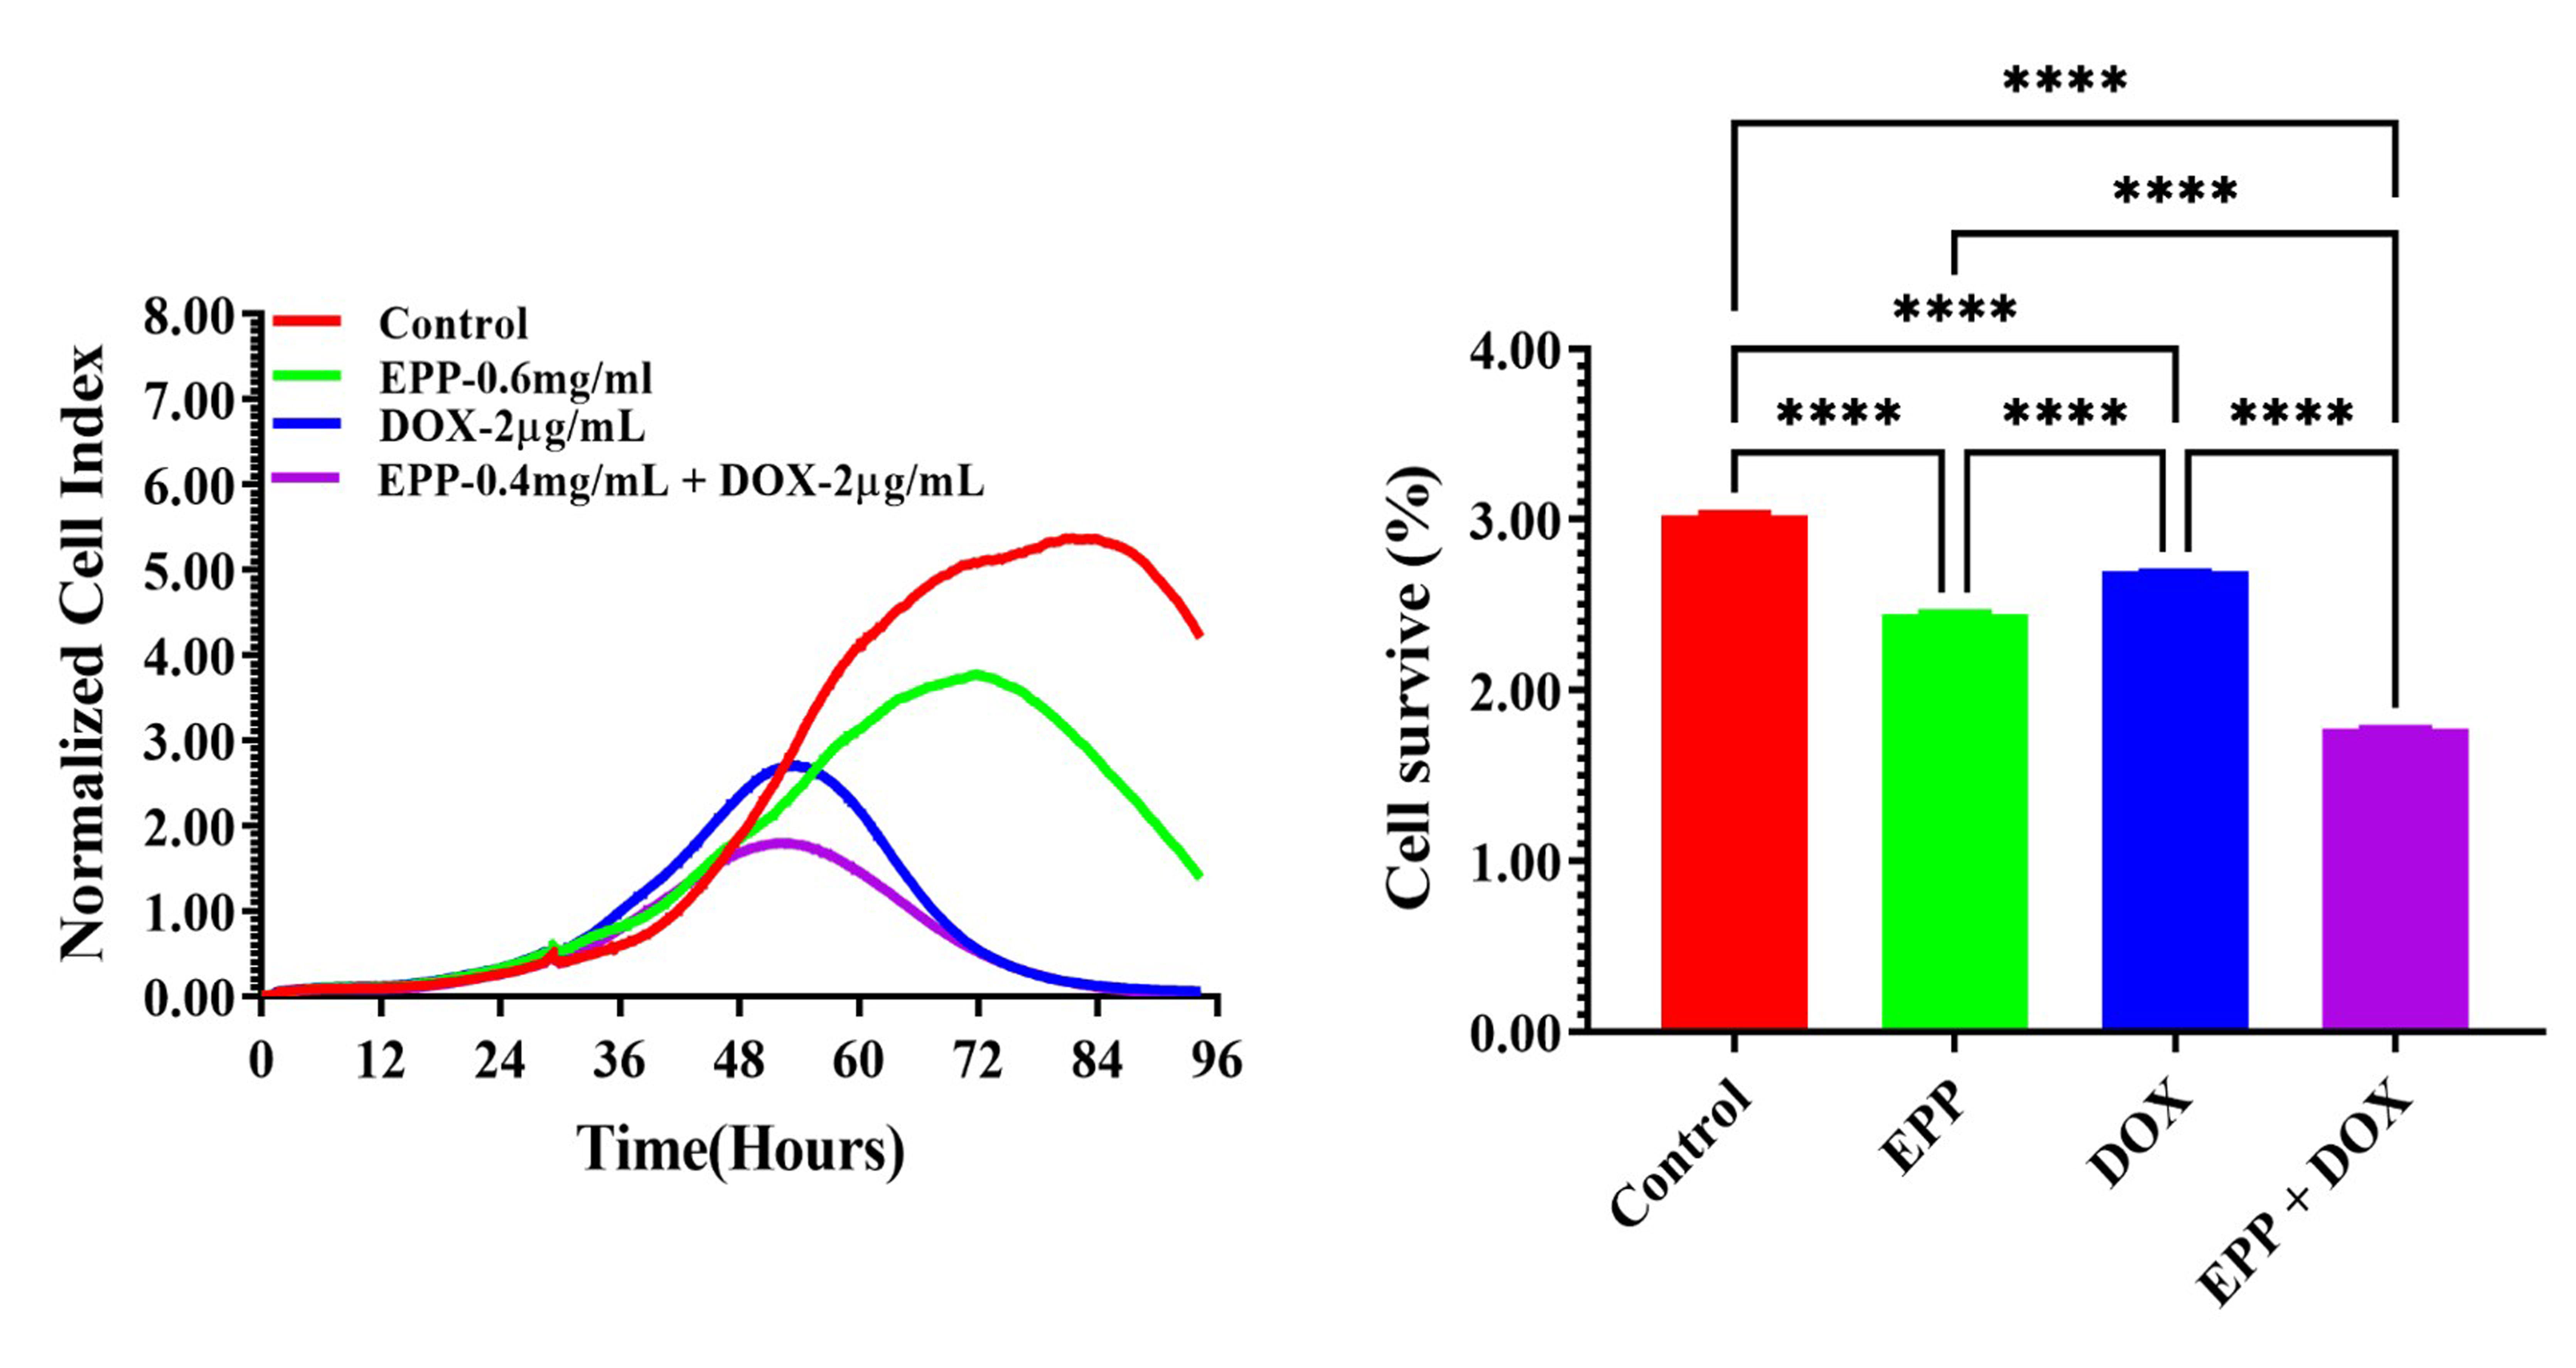 Fig. 9.
The effect of combination drug treatment of EPP and DOX on the
cell proliferative activity of A549 cell. ****p
From the flow cytometry analysis of cell apoptosis and cell cycle distribution after 24 hours of drug treatment, it was revealed that the mixture of EPP and DOX led to a significant increase in apoptosis compared with the control group and treatment groups with a single drug. The cell cycle was blocked at the G1-S phase, which enhancing the inhibitory effect of the drug mixture on A549 cell proliferation.
Tumor cells are highly active. Their proliferation require more energy than normal cells. Even with abundant oxygen, tumor cells still need glycolysis as an energy-producing pathway [31]. ATP plays a vital role in the proliferation and apoptosis of tumor cells, and cell apoptosis is closely associated with ATP production rate and mitochondrial function. According to our real-time monitoring of energy metabolism, A549 cell groups treated with the mixture of EPP and DOX had significantly lower ATP production rate and a pronounced inhibition of mitochondrial respiration, leading to quicker cell apoptosis. These findings provide evidence that the proliferation of A549 cells can be inhibited significantly by the mixture of EPP and DOX.
In summary, based on the analysis of the statistical results among and within different experimental groups, and considering factors such as drug toxicity and resistance, the mixture of EPP at 0.4 mg/mL and DOX at 2 µg/mL can be selected as a synergistic drug regimen to suppress the activity of A549 cells. This study provides a theoretical support for anti-tumor activity of EPP and highlights the social and ecological benefits of using EPP as a valuable resource. All in all, EPP has a promising prospect in clinical application.
All data points generated or analyzed during this study are included in this article and there are no further underlying data necessary to reproduce the results.
Conceptualization, YWL. Data curation, YWL, YTX, NZ. Methodology, YWL, LL, YTX, JJW, CG. Visualization, YWL, LL, WY, YYH. Software, YWL. All authors contributed to editorial changes in the manuscript. All authors read and approved the final manuscript. All authors have participated sufficiently in the work and agreed to be accountable for all aspects of the work.
Not applicable.
We thank Professor Li Xia (Guilin University of Technology) for her technical support.
This work was supported by Zhejiang Provincial Education Department Fund (Grant No. Y202250033).
The authors declare no conflict of interest.
References
Publisher’s Note: IMR Press stays neutral with regard to jurisdictional claims in published maps and institutional affiliations.