


 , Irina Antonova 1, Roman Zenkov 1, Denis Naberezhnov 2,3, Gennady Belitsky 1, Anna Borunova 1, Tatiana Zabotina 1, Daniel García-Gomis 4, Alfiya Safina 5, Katerina Gurova 5, Andrei Gudkov 5, Kirill Kirsanov 1,6, Albert Jordan 4, Marianna Yakubovskaya 1,*
1 N.N. Blokhin National Medical Research Center of Oncology, Ministry of Health of Russia, 115478 Moscow, Russia
2 Federal State Budgetary Institution, Centre for Strategic Planning and Management of Biomedical Health Risks of the Federal Medical and Biological Agency, 119121 Moscow, Russia
3 Engelgardt Institute of Molecular Biology, Russian Academy of Sciences, 119991 Moscow, Russia
4 Department of Molecular Genomics, Molecular Biology Institute of Barcelona IBMB-CSIC, Scientific Park of Barcelona, 08028 Barcelona, Catalonia, Spain
5 Department of Cell Stress Biology, Roswell Park Comprehensive Cancer Center, Buffalo, NY 14263, USA
6 Department of Faculty Surgery, Peoples’ Friendship University of Russia Miklukho-Maklaya St., 117198 Moscow, Russia
Abstract
Background: Many plant secondary metabolites (PSMs) were shown to intercalate into DNA helix or interact with DNA grooves. This may influence histone-DNA interactions changeing chromatin structure and genome functioning. Methods: Nucleosome stability and linker histone H1.2, H1.4 and H1.5 localizations were studied in HeLa cells after the treatment with 15 PSMs, which are DNA-binders and possess anticancer activity according to published data. Chromatin remodeler CBL0137 was used as a control. Effects of PSMs were studied using fluorescent microscopy, flowcytometry, quantitative reverse transcriptase-polymerase chain reaction (RT-qPCR), western-blotting. Results: We showed that 1-hour treatment with CBL0137 strongly inhibited DNA synthesis and caused intensive linker histone depletion consistent with nucleosome destabilization. None of PSMs caused nucleosome destabilization, while most of them demonstrated significant influence on linker histone localizations. In particular, cell treatment with 11 PSMs at non-toxic concentrations induced significant translocation of the histone H1.5 to nucleoli and most of PSMs caused depletion of the histones H1.2 and H1.4 from chromatin fraction. Curcumin, resveratrol, berberine, naringenin, and quercetin caused significant redistribution of all three variants of the studied linker histones showing some overlap of PSM effects on linker histone DNA-binding. We demonstrated that PSMs, which induced the most significant redistribution of the histone H1.5 (berberine, curcumin and naringenin), influence the proportion of cells synthesizing DNA, expressing or non-expressing cyclin B and influence cell cycle distribution. Berberine induction of H1.5 translocations to nucleoli was shown to occur independently on the phases of cell cycle (metaphase was not analyzed). Conclusions: For the first time we revealed PSM influence on linker histone location in cell nuclei that opens a new direction of PSM research as anticancer agents.
Keywords
- plant secondary metabolites
- chromatin structure
- linker histones
- cancer preventive activity
- cancer prevention
- DNA-binding compounds
- cell cycle
- cytotoxicity
- nucleosome stability
- linker histone depletion
A series of significant studies clearly demonstrated that the Mediterranean diet may slow down the incidence of various forms of cancer [1]. This effect is proposed to be due at least partly to high concentrations of plant secondary metabolites (PSMs) from the group of polyphenols. These compounds are characterized by the presence of one or more aromatic rings with different hydroxyl groups, which determine their chemical properties and biological effects. A large number of cellular targets for these small molecules have been found, as well as mediated changes in specific signaling pathways that prevent tumor growth or carcinogenesis. Many studies have demonstrated antiproliferative, proapoptotic, anti-inflammatory, and immunomodulatory effects of resveratrol, quercetin, genistein and other PSMs in the experiments in vitro [2, 3, 4, 5]. In the experiments in vivo, a number of PSMs were demonstrated to reduce the incidence and multiplicity of colon tumors induced by 1,2-dimethylhydrazine or azoxymethane, ovarian tumors induced by 7,12-dimethylbenz(a)anthracene, and mammary tumors induced by 7,12-dimethylbenz(a)anthracene and N-methyl-N-nitrosourea [6, 7, 8, 9]. Their chemopreventive effects was shown in a number of clinical trials [10, 11, 12].
The pleiotropy of the effects of PSMs makes it extremely difficult to interpret the integral result of their action. PSMs are able to bind to a large number of protein molecular targets, including cellular receptors, enzymes of xenobiotic metabolism, components of signaling pathways, enzymes of DNA metabolism and epigenetic regulation of transcription [13, 14, 15, 16]. However, one of the commonest properties of PSMs is their affinity to DNA.
Noteworthy, PSMs do not form covalent bonds with DNA, but interact with the biopolymer via van der Waals, ionic, and hydrogen bonds. This explains why PSMs are mainly not mutagenic. Using various spectroscopic methods, PSM intercalation into DNA helix was demonstrated for resveratrol and genistein [17], quercetin and delphinidin [18], apigenin and naringenin [19], fisetin [20], epigallocatechin gallate (EGCG) [21], and sanguinarine [22]. DNA minor groove binding was shown for curcumin [17] and sanguinarine [23]. Binding DNA, PSMs can affect the geometric characteristics and thermodynamic stability of the duplex, the flexibility and physicochemical properties of the biopolymer, as well as influence the formation and stabilization of various alternative DNA structures, such as G-quadruplexes, H-DNA, and cruciforms. Binding and stabilization of G-quadruplexes by PSMs were shown for fisetin [20], curcumin [24], EGCG [25], kaempferol [26], berberine [27], sanguinarine [28], quercetin [29], and thymoquinone [30]. G4-mediated downregulation of c-MYC expression was shown by reporter analysis for sanguinarine, quercetin, kaempferol and thymoquinone [31]. Moreover, they can shield the sites of DNA interaction with enzymes that are involved in replication, transcription, and repair. All the DNA-mediated effects of PSMs may influence the three-dimensional organization of chromatin and DNA packaging processes and change the access to DNA landing sites for chaperones, epigenetic factors, and other regulatory proteins [32, 33]. In our previous studies, the effects of chromatin destabilization by DNA-binding agents have been described for the new anticancer and chemopreventive drug Curaxin CBL0137 [34, 35] and for minor groove binding ligands (MGBL) [36]. CBL0137 does not affect the chemical structure of DNA, but it causes dose-dependent destabilization and disassembly of the nucleosome [35], followed by histone chaperone FACT trapping to chromatin [37] and cell cycle arrest at G0/G1 and G2/M phases.
Influence of PSMs on cell chromatin structure has never been analyzed. The main goals of our study were to analyze PSM effects on chromatin stability, nucleosome histones and histone chaperone facilitates chromatin transcription (FACT) localization in the cell nuclei, linker histones localization in the nuclei and their relative content in chromatin fraction and total protein pool, cell cycle distribution under the treatment of PSMs and the dependence of PSM effects on cell cycle phase. 15 PSMs of different chemical structures, which demonstrate DNA-binding and possess anticancer activity, were chosen for our study.
All of the studied compounds were obtained from Chemlight, Moscow, Russia (1)
and from Selleckchem, Houston, TX, USA (2). We studied apigenin, CAS 520-36-5,
Lot. 0436771-86, (1); berberine, CAS 633-65-8, Lot. S904601, (1); coumarin, CAS
91-64-5, (1); curcumin, CAS 458-37-7, (1); delphinidin, CAS 13270-61-6, Lot.
117271994, (1); EGCG, CAS 989-51-5, Lot. SLBL3516V, (1); fisetin, CAS 528-48-3,
Lot. 477164536, (1); genistein, CAS 446-72-0, Lot. S134201, (1); ginsenoside,
Rb1, CAS 41753-43-9, Lot S392401, (1); kaempferol, CAS 520-18-3, Lot. S231406,
(1); naringenin, CAS 480-41-1, (1); quercetin, CAS 117-39-5, Lot. LRAB3054, (1);
resveratrol, CAS 501-36-0, Lot. 139609, (1); sanguinarine chloride hydrat, CAS
5578-73-4, Lot. S903202, (1); thymoquinone, CAS 490-91-5, Lot. S476101, (1).
Curaxin CBL0137 was provided by Incuron, Inc., Russia. Triton X-100 (CAS
9002-93-1, Lot. 19H2156267) was purchased from BioInnlabs, Rostov-on-Don, Russia.
Phenol – chloroform – isoamyl alcohol mixture (CAS 136112-00-0), TopVision Low
Melting Point Agarose (CAS 39346-81-1, Lot. 91339087), cOmplete™,
Mini Protease Inhibitor Cocktail (cat. 11836153001, Lot. 33576300), Laemmli
Sample Buffer x2 (CAS 53123-88-9, Lot. S3401), Phosphate-buffered saline (PBS,
P4417, Lot. M8254), DAPI (CAS 28718-90-3, Lot. 378275275), thymidine (50-89-5,
Lot. WXBD3213V), 5-Ethynyl-2
Human cervical cancer cells (HeLa) was obtained from the Blokhin Cancer Research Center (CRC) cell
collection, HeLa_SSRP1-GFP_H2B-mCherry were obtained from the Department of
Cell Stress Biology at Roswell Park (Buffalo, NY, USA). HeLa_H1.5-mCherry
cells were constructed as described below. Cells were cultured in
Dulbecco’s Modified Eagle Medium (DMEM) supplemented with L-glutamine (0.584
mg/mL), penicillin (50 U/mL), and streptomycin (50 µg/mL) (PanEco,
Moscow, Russia) and 10% fetal bovine serum (PanEco). Cell lines were incubated
at 37 °C and 5% CO
Vector pSB/IR-TRE3G-H1-mCherry was constructed in order to provide expression of fluorescent linker histone H1.5 in HeLa cells. This plasmid includes the gene of H1-mCherry fusion protein and inverted repeats that are crucial for transposition (via “sleeping beauty” mechanism).
The sequence of H1-mCherry gene and the gene of resistance to geneticin was amplified from pReceiver-M55 plasmid provided by the laboratory of Katerina Gurova. Amplification was carried out with Q5 polymerase (NEB, Ipswich, MA, USA) and the following primers:
forward: 5
reverse: 5
Blunt ends of the product were kinated with T4 Polynucleotide Kinase (NEB, Ipswich, MA, USA).
Plasmid pSB-IR-TRE3G-5.1, which contains inverted repeats for transposition and TRE3G promotor (with the tetracycline controlled transcriptional activation), was hydrolyzed with EvoRV restrictase resulting in DNA fragment with blunt ends. Linear DNA fragment was incubated with FastAP alkaline phosphatase (ThermoScientific, Waltham, MA, USA) in order to avoid circularization of the fragment during ligation.
Two fragments were ligated with T4 DNA ligase (SibEnzyme, Novosibirsk, Russia). Bacterial colonies with the proper construction were selected in PCR with the following primers:
forward: 5
reverse: 5
PCR with proper construction resulted in the DNA product of 1773 bp. Plasmid sequence was confirmed by sequencing.
Final plasmid pSB/IR-TRE3G-H1-mCherry was transfected into HeLa cells in 60 mm dishes using TurboFect Transfection Reagent (ThermoScientific, Waltham, MA, USA) according to the manufacturer’s protocol. It was transfected with plasmid pCMV(CAT)T7-SB100 (Addgene, 34879) in the ratio of 4 to 1. pCMV(CAT)T7-SB100 encodes sleeping beauty SB100X transposase, which inserts the construction into cell genome. Cells containing the construction in their genome were selected with geneticin (G418).
The nontoxic concentrations of phytonutrients for Hela cells were measured using the resazurin test based on the fluorescent determination of the metabolic activity of viable cells. For analysis, HeLa cancer cells were seeded in 96-well plates (10,000 cells per well in 180 µL of DMEM). Cells were treated with phytonutrients of various concentrations for 24 hours. Then, 20 µL of resazurin reagent solution (0.18 mg/mL) was added to each well and incubated for 4 h at 37 °C. The plates were read on a Fluoroscan FL (Thermo Scientific, Waltham, MA, USA) using a test wavelength of 530 nm. IC50 and IC20 values and nontoxic concentrations were derived from aproximate logistic function of resorufin fluorescence intensity at 592 nm. Maximum non-toxic concentrations were confirmed using propidium iodide (PI)/annexin cell staining and subsequent flow cytometric analysis. All experiments were carried out in parallel and in triplicate.
Micrococcal nuclease digestion assay was performed as previously described [35]
with some modifications. HeLa cells were trypsinized, harvested, and washed once
with 1
To visualize the localization of core histone H2B and linker histone H1.5 cells
HeLa_SSRP1-GFP_H2B-mCherry or HeLa_H1.5-mCherry were seeded in 6-well plates
(150,000 cells per well) with cover glass 22
For isolation of total protein, cells were incubated with RIPA buffer (50 mM
Tris–HCl, pH 7.4, 1% NP-40, 0.5% Na-deoxycholate, 450 mM NaCl, 1 mM EDTA, 1 mM
EGTA), with Complete Protease Inhibitor Cocktail (Roche, Basel, Switzerland) on
ice for 30 min. For chromatin and nucleoplasmic fraction extraction 10 million
cells were resuspended in 1 mL of Buffer A (10 mM HEPES-KOH, pH 7.9, 1.5 mM
MgCl
Protein concentrations were determined with the BioRad DC protein assay kit (Hercules, CA, USA). Samples were mixed with Laemmli Gel Loading buffer and boiled for 5 min at 95 °C.
Samples were exposed to polyacrylamide gel with sodium dodecyl sulfate (SDS-PAGE) (10%), transferred to a Polyvinylidene fluoride (PVDF) membrane, blocked with 5% non-fat milk for 1 hour, incubated with primary antibodies over night at 4 °C and secondary antibodies conjugated to peroxidase for 1 hour at room temperature. Bands were detected using Clarity Western substrate for enhanced chemiluminescence (ECL) visualization reagent (1705061, Bio-Rad, Hercules, CA, USA) and ImageQuant LAS 4000 digital imaging system (GE Healthcare, Chicago, IL, USA). Densitometric analysis of the blots was performed using ImageJ software. Experiments were performed minimum three times.
We used the following pimary antibodies: SSRP1, mouse monoclonal 10D1
(BioLegend, cat# 609702, San Diego, CA, USA); SPT16, mouse monoclonal 8D2
(BioLegend, cat# 607002, San Diego, CA, USA);
The effect of phytonutrients on H1 genes expression was evaluated in cell line
HeLa using the RT-qPCR assay. Cells were incubated for 24 h in the medium with
various phytonutrients using concentration IC20 in 6-well plates. Then, total RNA
was extracted with TRIzol reagent (ThermoScientific, Waltham, MA, USA) according
to the manufacturer’s protocol. For cDNA synthesis, total RNA (1 µg
from both untreated and phytonutrient-treated cells) was reverse transcribed
using Moloney Murine Leukemia Virus Reverse Transcriptase (MMLV-RT) reverse transcriptase and random hexanucleotide primers in 25
µL of the reaction mixture according to the manufacturer’s protocol
(Syntol). Each PCR was based on 5 ng of DNA, 1
The sequences of the gene-specific primers used for RT-qPCR were as follows:
• RPL27 F: 5
• RPL27 R: 5
• H1-0 F: 5
• H1-0 R: 5
• H1-1 F: 5
• H1-1 R: 5
• H1-2 F: 5
• H1-2 R: 5
• H1-3 F: 5
• H1-3 R: 5
• H1-4 F: 5
• H1-4 R: 5
• H1-5 F: 5
• H1-5 R: 5
For Analysis of cell cycle phase distribution HeLa_H1.5-mCherry was seeded in 6-well plates (100,000 cells per well). After 24 hours, cells were treated with compounds of interest at IC20 concentrations for 1 hour. Next, the cells were incubated for 20 min with EdU (20 µM) and removed from the substrate with trypsin.
For monitoring of cell cycle synchronization HeLa_H1.5-mCherry was seeded in 6-well plates (50,000 cells per well). After 24 hours to synchronize cells in S phase, cells were treated with thymidine (final concentration 2 µM), incubated for 14–16 hours, then cells were washed twice with PBS, culture medium was added and incubated for 6–10 hours. Cells were then washed twice with PBS and treated again with thymidine. Cells were incubated for 20 min with EdU (20 µM) and removed from the substrate with trypsin: for S-phase fixation after 15 hours, for G2/M-phase fixation after 21 hours, for G1-phase fixation after 29 hours.
After the above treatments, cell lines were washed several times with PBS and fixed in cold 4% paraformaldehyde for 15 min. After three washes, they were permeabilized with cold Triton-X100 for 7 min and blocked with bovine serum albumin for 1 hour. Then S-phase labeling was carried out in a fast, highly-specific click reaction (Invitrogen™Click-iT™ EdU Cell Proliferation Kit, Waltham, MA, USA). To mark the G2/M phase, immunofluorescent staining of cells with antibodies to cyclin B1 (Invitrogen cat#MA5-13128, Waltham, MA, USA) and subsequent binding with secondary antibodies AlexaFluor647 (Abcam cat#150115, Cambridge, UK) were performed in darkness. Cells were washed with PBS and analyzed on a FACS Canto-2 flow cytometer. Thus, a cell in S-phase had a phenotype (EdU+, cyclin B1–), and in a cell in G2/M-phase it had a phenotype (EdU–, cyclin B1+). The absence of both markers (EdU–, cyclin B1–) is a sign of cell identification in the G1/G0 phase.
Also cell cycle analysis was carried out according to PI staining protocol (Invitrogen, Waltham, MA, USA). Cells were collected, washed twice with ice-cold PBS and fixed with 70% ethanol at 4 °C 30 min. Then cells were stored at –20 °C for 24 h, then washed with PBS and stained with 0.02 mg/mL PI, 0.1% v/v Triton X-100 and 0.2 mg/mL DNase-free RNase A in PBS. After 30 min incubation at room temperature in the dark, cells were analyzed by flow cytometer FACS Canto-2. Percent of cells in each cell cycle phase was analyzed and calculated using kaluza software, version 2.2.1 (https://www.beckman.co.il/ru/flow-cytometry/software/kaluza).
Synchronization of the cell cycle of the HeLa H1.5-mCherry line was carried out using a double thymidine block with subsequent analysis of the distribution of the cell population over the phases of the cell cycle at different time points after the removal of the thymidine block by analyzing immunofluorescently stained cells on a flow cytometer.
HeLa_H1.5-mCherry was seeded in 6-well plates (50,000 cells per well) with a 22
| № | Сompound | IC50 (µM) | IC20 (µM) | Solvent (%) | СPBR | IC0 (µM) | Solvent (%) | СPBR |
| 1 | apigenin | 52 |
12 |
0.01 DMSO | 0.5 | 5 | ||
| 2 | berberine | 709 |
108 |
0.15% DMSO | 4.3 | 10 | ||
| 3 | coumarin | 1868 |
860 |
0.21% EtOH | 34.4 | 260 | ||
| 4 | curcumin | 32 |
15 |
0.02% DMSO | 0.6 | 7.5 | ||
| 5 | delphinidin | 874 |
284 |
water | 11.4 | 100 | water | |
| 6 | EGCG | 282 |
133 |
0.14% EtOH | 5.3 | 65 | ||
| 7 | fisetin | 553 |
118 |
0.06% DMSO | 4.7 | 27 | ||
| 8 | genistein | 842 |
176 |
0.18% DMSO | 7 | 60 | ||
| 9 | ginsenoside Rb1 | 285 |
80 |
0.09% DMSO | 3.2 | 30 | ||
| 10 | kaempferol | 115 |
10 |
0.01% DMSO | 0.4 | 2 | ||
| 11 | naringenin | 457 |
236 |
0.19% EtOH | 9.4 | 52 | ||
| 12 | quercetin | 109 |
34 |
0.06% EtOH | 1.4 | 10 | ||
| 13 | resveratrol | 707 |
233 |
0.11% EtOH | 9.3 | 50 | ||
| 14 | sanguinarine | 4.0 |
2.1 |
0.02% DMSO | 0.08 | 0.8 | ||
| 15 | thymoquinone | 33 |
18 |
0.02% DMSO | 0.7 | 3 |
PSMs, plant secondary metabolites; EGCG, epigallocatechin gallate; CPBR, compound per base ratio; DMSO, dimethyl sulfoxide; EtOH, ethanol.
To identify cells in certain cell phases after the above cell line treatments
cells were washed twice with PBS and fixed in 4% paraformaldehyde at room
temperature for 15 min. After three washes, they were permeabilized with Triton-100 for 7 min at room temperature and blocked with bovine serum albumin for 1 h.
Then S-phase labeling was carried out in a fast, highly-specific click reaction
(Invitrogen™Click-iT™ EdU Cell Proliferation Kit,
Waltham, MA, USA). To mark the G2/M phase, immunofluorescent staining of cells
with antibodies to cyclin B1 (Invitrogen cat#MA5-13128, Waltham, MA, USA) and
subsequent binding with secondary antibodies AlexaFluor647 (Abcam cat#150115,
Cambridge, UK) were performed in darkness. Thus, cells in S-phase had a phenotype
(EdU+, cyclin B1–), cells in G2/M-phase had a phenotype (EdU–, cyclin B1+). The
absence of both markers (EdU–, cyclin B1–) made it possible to identify cells in
the G1/G0 phase. The nucleus was stained with DAPI. The coverslips were mounted
on the glass slides using Mowiol mounting medium. Images were obtained with a
Zeiss Axio Observer A1 inverted microscope with N-Achroplan 100
We compared data of the treatments and controls using one-way analysis of
variance (ANOVA) and Dunnett’s post hoc test. Differences between groups were
considered to be significant at a p value of
We wanted to use non-toxic concentration of PSMs, and before studying the effects of PSMs on the chromatin structure we measured their cytotoxicity using resazurin assay. IC50 and IC20 were determined from the fit curves to dose-response data (Table 1, Supplementary Fig. 1). IC0 was determined as a maximal non-toxic concentration, at which an alive cell proportion was higher than 95% that was controlled by flow cytometry using PI/annexin staining and trypan blue dye exclusion test. Fluorescent activity of all the PSMs was checked not to have any interference with signals of proteins or antibodies tagged by fluorophores (Supplementary Table 1, Supplementary Fig. 2). All the studied PSMs are DNA-binding compounds, and taking into account the cultural medium volume to calculate the amount of the compound added and the number of cultured cells to calculate the amount of nuclear DNA in the sample, we estimated maximal achievable compound per base ratio (CPBR), however, interactions of PSMs with different proteins were ignored in the calculations. Among 15 PSMs analyzed in our study delphinidin is the only one to demonstrate good solubility in water solutions (Supplementary Fig. 3). The rest 14 PSMs were dissolved in organic solvents (DMSO or ethanol) and added to the reaction mixture or cultural medium of HeLa cells at the concentrations not affecting the studied processes. Final concentrations of the solvents in the cultural medium are also provided in Table 1.
Thus, we demonstrated that all PSMs studied may cause cytotoxic effect and determined maximal non-toxic and IC20 concentrations, which were used in our further study of PSM effects on chromatin structure in cultured HeLa cells.
The study of molecular effects caused by PSMs on nucleosome stability was performed using three alternative approaches: (1) analysis of DNA cleavage products of chromatin treatment with micrococcal endonuclease; (2) microscopy of cells with fluorescently labeled H2B histone using HeLa SSRP1-GFP H2B-mCherry cells; (3) measurement of the content changes of the FACT histone chaperone subunits in the nucleoplasm and chromatin-bound protein fractions of HeLa cells using Western blotting.
Nucleosomal DNA is inaccessible for the micrococcal nuclease cleavage of DNA shielded by nucleosome histones, while the linker regions of DNA are digestible. This leads to DNA fragmentation seen at the electropherograms as the so-called “ordered ladder” (Fig. 1, tracks 3, 20). The lack of this order can be observed only when the cell nuclei are treated with compounds that disrupt the binding of DNA to the nucleosome core histones. CBL0137, which is known to cause chromatin destabilization, was taken as a positive control [35].
 Fig. 1.
Effects of DNA-binding non-mutagenic plant secondary metabolites (PSMs) on nucleosome stability. (A) Gel electrophoresis of DNA isolated from nuclei of HeLa cells incubated with CBL0137 followed by digestion with micrococcal nuclease. 1, 18—DNA marker; 2, 19—DNA control; 3, 20—negative control; 4, 21—CBL0137, 100 µM; 5, 22—CBL0137, 50 µM; 6—quercetin; 7—coumarin; 8—apigenin; 9—kaempferol; 10—resveratrol; 11—sanguinarine; 12—EGCG; 13—naringenin; 14—genistein; 15—thymoquinone; 16—curcumin; 17—fisetin; 23 ginsenoside Rb1; 24—delphinidin; 25—berberine. (B) HeLa SSRP1-GFP H2B-mCherry cells treated with CBL0137 (50 µM, 1 hour) or berberine (IC0, 24 hours). (C) Western blotting of the nucleoplasmic and chromatin fractions of HeLa cells treated with CBL0137 (50 µM, 1 hour) or PSMs (IC0, 24 hours). Scale bar 10 microns.
After 30 min incubation of HeLa cell nuclei with CBL0137 at concentrations of 50 µM and 100 µM, active DNA cleavage by mnase was observed, while no nucleosome-protected fragments or uncleaved DNA were revealed (Fig. 1A, tracks 4, 5, 21, 22). All the studied PSMs caused the pattern of DNA cleavage showing nucleosome-bound DNA fragments not-digested by NEB (Fig. 1A, tracks 6–17, 23–25).
The choice of concentrations of PSMs used in the reaction mixtures in this experiment was limited by their solubility in water, and we added the compounds even at the cytotoxic concentrations to for HeLa cells. PSM concentrations and CPBRs used in this experiment are provided in Table 2.
| № | Compound | Concentration (µM) | CPBR | Solvent* |
| 1 | CBL0137 | 100 | 1.5 | DMSO |
| 2 | CBL0137 | 50 | 0.8 | DMSO |
| 3 | apigenin | 460 | 6.7 | DMSO |
| 4 | berberine | 370 | 5.4 | DMSO |
| 5 | coumarin | 2000 | 30.0 | EtOH |
| 6 | curcumin | 340 | 4.9 | DMSO |
| 7 | delphinidin | 300 | 4.3 | DMSO |
| 8 | EGCG | 450 | 6.6 | EtOH |
| 9 | fisetin | 1000 | 14.5 | DMSO |
| 10 | genistein | 500 | 7.3 | DMSO |
| 11 | ginsenoside Rb1 | 450 | 6.7 | DMSO |
| 12 | kaempferol | 440 | 6.3 | DMSO |
| 13 | naringenin | 610 | 8.9 | EtOH |
| 14 | quercetin | 275 | 4.0 | EtOH |
| 15 | resveratrol | 1050 | 15.2 | EtOH |
| 16 | sanguinarine | 50 | 0.8 | DMSO |
| 17 | thymoquinone | 380 | 5.5 | EtOH |
* solvents were used in concentrations 0.4% or less (up to 0%).
Two copies of histone H2B together with two copies each of histones H2A, H3 and H4 form the octamer core of the nucleosome, around which DNA is wrapped. H2B is a canonical histone: it is distributed throughout the chromatin in all phases of the cell cycle. Using in vivo microscopy of HeLa cells with fluorescently labeled H2B histone, a complete redistribution of histone H2B from chromatin to the nucleoli was observed after the cells were treated with 50 µM CBL0137 for 1 hour [35]. We used CBL0137 cell treatment as a positive control. Neither berberine nor all the other PSMs at IC20 concentrations after the cells exposition for 1 and 24 hours affected the intranuclear localization of H2B histone, which remained associated with chromatin (Table 2, Fig. 1B).
The FACT histone chaperone is involved in DNA packaging by the complex interaction with core histones when the inner parts of the nucleosome are accessible. This protein is a dimeric subunit of SSRP1 and SPT16. In addition to the interaction of the SPT16 subunit with the H2A/H2B dimer, the SSRP1 FACT subunit interacts with DNA after nucleosome unfolding [35, 39]. Using Western-blotting method, we assessed the redistribution of the histone chaperone FACT subunits between the chromatin and nucleoplasmic fractions under the influence of the studied PSMs. CBL0137 was shown to induce FACT trapping on chromatin and we analyzed its influence on SSRP1 and SPT16 redistribution between the chromatin and nucleoplasmic fractions as a positive control. PARP1 of the nucleoplasmic fraction and core histone H3 of the chromatin-associated fraction were taken as reference proteins. At concentrations not exceeding IC20, PSMs did not affect the FACT subunits distribution in the nuclei of HeLa cells both after 1- and 24-hour treatment, while the treatment of the cells with 50 µM CBL0137 for 1 hour caused significant increase in the relative content of SPT16 and SSRP1 subunits in the chromatin fraction and a decrease of their relative content in the nucleoplasm (Fig. 1C).
Thus, using three different approaches we did not reveal PSM influence on nucleosome stability.
We analyzed the localization of the mCherry-tagged linker histone H1.5 in HeLa cells using fluorescent microscopy. Linker histone H1.5 is mainly associated with chromatin and in the cells non-treated with any compounds we observed its distribution over the cell nucleus. When the cells were treated with 25 µM CBL0137 for 1 hour, histone H1.5 was translocated to the nucleoli in almost all the cells (97%). In the cells treated with non-toxic concentrations of PSMs for 1 and 24 hours, similar changes were found when cells were treated with berberine (IC0, 1 hour and 24 hours): in more than 85% of cells, the linker histone H1.5 was translocated to the nucleoli. For the compounds delphinidin, fisetin, genistein, sanguinarine, resveratrol, curcumin, naringenin, quercetin, thymoquinone, and EGCG, a significant change in the proportions of cells with different localization of the linker histone H1.5 (in chromatin, intermediate, in nucleoli) was also demonstrated (Fig. 2).
 Fig. 2.
Redistribution of mCherry-tagged linker histone H1.5 under the
influence of PSMs. (A) Histogram of the proportions of cells with the different
localization of the linker histone H1.5 after 1-hour treatment with CBL0137 or
PSMs. (B) Histogram of the proportions of cells with the different localization
of the linker histone H1.5 after 1-hour treatment with CBL0137 or 24-hour
treatment with PSMs. Statistically significance of the differences between control untreated cells and PSM treated cells by the histone
contents in nucleoli and intermediate position (Pearson’s chi-squared test): *
— p
Having demonstrated a significant change in the nuclear localization of the linker histone H1.5 in the cells exposed to both CBL0137 and a number of PSMs, we took into consideration the following facts: (1) treatment of cells with both CBL0137 and a number of PSMs was demonstrated to induce interferon signaling [34, 40], and (2) in the study of Izquierdo-Bouldstridge et al. [38], knockdown of the linker histones H1.2 and H1.4 was shown to increase the expression of endogenous retroviruses, accompanied by the triggering of interferon signaling. Accordingly, we suggested that CBL0137 and PSMs can cause depletion from the chromatin fraction of not only histone H1.5, but also other linker histone variants. Since the functional activity of H1.2 and H1.4 histones is associated with the suppression of endogenous retroviruses, on the next stage of our study the effects of CBL0137 and PSMs on the relative content of these linker histone variants in chromatin were analyzed. We also analyzed the effects of PSMs on the relative content of these histone variants in the total pool of cell proteins and on the expression levels of linker histone genes. The relative content of the linker histones H1.2 and H1.4 in the chromatin fraction, as well as in the total pool of cell proteins was assessed using Western blotting followed by densitometry analysis of the blots (Fig. 3, Table 3). Untreated cells served as a negative control.
 Fig. 3.
Influence of PSMs on the relative content of H1.2 and H1.4
linker histones in chromatin fraction. (A) Western blotting analysis of the
chromatin fraction of HeLa cells treated with PSMs for 24 h. (B) Densitometry
analysis of the blots: Mean
| # | Compound | Concentration | Chromatin fraction | Total cell protein pool | mRNA level of the linker histones | |||||||
| H1.2 | H1.4 | H1.2 | H1.4 | 1 | 1.1 | 1.2 | 1.3 | 1.4 | 1.5 | |||
| 1 | - (control) | - | 1 | 1 | 1 | 1 | 1 | 1 | 1 | 1 | 1 | 1 |
| 2 | CBL0137 | 25 µM | 0.11 |
0.15 |
0.75 |
0.77 |
||||||
| 3 | apigenin | IC0 | 0.69 |
0.76 |
||||||||
| IC20 | 0.67 |
0.71 |
1.19 |
0.81 |
1.17 |
0.92 |
0.77 |
1.45 |
1.03 |
0.92 | ||
| 4 | berberine | IC0 | 0.45 |
0.46 |
||||||||
| IC20 | 0.44 |
0.44 |
0.97 |
0.57 |
1.73 |
0.91 |
1.26 |
1.15 |
1.46 |
1.24 | ||
| 5 | coumarin | IC0 | 0.70 |
0.72 |
||||||||
| IC20 | 0.56 |
0.74 |
1.18 |
0.86 |
0.93 |
1.44 |
1.14 |
1.36 |
1.30 |
1.38 | ||
| 6 | curcumin | IC0 | 0.65 |
0.60 |
||||||||
| IC20 | 0.28 |
0.12 |
0.97 |
0.73 |
1.13 |
1.26 |
0.9 |
1.19 |
1.36 |
1.11 | ||
| 7 | delphinidin | IC0 | 0.30 |
0.27 |
||||||||
| IC20 | 0.33 |
0.15 |
0.89 |
0.89 |
1.06 |
0.82 |
1.39 |
0.73 |
0.82 |
0.80 | ||
| 8 | EGCG | IC0 | 0.65 |
0.67 |
||||||||
| IC20 | 0.64 |
0.39 |
1.01 |
1.00 |
1.75 |
1.56 |
1.30 |
1.12 |
1.35 |
1.34 | ||
| 9 | fisetin | IC0 | 0.40 |
0.44 |
||||||||
| IC20 | 0.22 |
0.06 |
1.31 |
0.58 |
1.58 |
0.73 |
0.87 |
0.74 |
1.6 |
0.92 | ||
| 10 | genistein | IC0 | 0.48 |
0.60 |
||||||||
| IC20 | 0.43 |
0.40 |
0.78 |
0.57 |
1.68 |
0.85 |
1.21 |
0.68 |
0.74 |
0.90 | ||
| 11 | ginsenoside Rb1 | IC0 | 0.87 |
0.76 |
||||||||
| IC20 | 0.74 |
0.82 |
0.87 |
0.79 |
1.43 |
0.82 |
0.83 |
1.12 |
1.14 |
1.55 | ||
| 12 | kaempferol | IC0 | 0.68 |
0.43 |
||||||||
| IC20 | 0.66 |
0.49 |
1.13 |
1.02 |
1.06 |
0.95 |
1.14 |
0.94 |
1.47 |
1.25 | ||
| 13 | naringenin | IC0 | 0.63 |
0.78 |
||||||||
| IC20 | 0.37 |
0.24 |
0.60 |
0.27 |
1.13 |
1.47 |
1.21 |
1.08 |
1.29 |
1.34 | ||
| 14 | quercetin | IC0 | 0.27 |
0.32 |
||||||||
| IC20 | 0.25 |
0.29 |
1.57 |
0.84 |
1.40 |
1.13 |
0.97 |
1.19 |
1.54 |
1.20 | ||
| 15 | resveratrol | IC0 | 0.43 |
0.39 |
||||||||
| IC20 | 0.22 |
0.03 |
0.43 |
0.60 |
0.99 |
1.30 |
1.37 |
0.96 |
0.91 |
0.63 | ||
| 16 | sanguinarine | IC0 | 0.60 |
0.08 |
||||||||
| IC20 | 0.37 |
0.22 |
1.49 |
0.59 |
1.01 |
1.40 |
1.33 |
1.13 |
1.02 |
1.06 | ||
| 17 | thymoquinone | IC0 | 0.83 |
0.70 |
||||||||
| IC20 | 0.73 |
0.65 |
0.83 |
0.86 |
0.99 |
1.01 |
0.77 |
1.77 |
1.62 |
1.33 | ||
* The differences were estimated for control untreated cells and PSM treated cells. Red: statistically significant decrease, rose: less than 0.6 decrease; Dark blue: statistically significant increase, blue: more than 1.4 increase.
In the cells treated with 25 µM CBL137 for 1 hour, depletion of histones H1.2 and H1.4 from chromatin fraction was observed, leading to a decrease in their relative content by 9.1 and 6.7 times, respectively. When cells were treated with fisetin, genistein, delphinidin, berberine, sanguinarine, quercetin, and resveratrol at the IC20 and IC0 for 24 hours, we observed significant decrease of both chromatin-bound H1.2 and H1.4 relative contents. The amount of linker histones H1.2 and H1.4 in the chromatin fraction under the influence of the substances at the IC20 decreased, respectively: for fisetin by 4.5 and 16.7 times, genistein—by 2.3 and 2.5 times, delphinidin—by 3.0 and 6.7 times; berberine—by 2.3 and 2.3 times; sanguinarine—2.7 and 4.5 times; quercetin — 4.0 and 3.4 times; resveratrol—4.5 and 33.3 times. With this treatment of the cells with all of the compounds listed above, we did not detect any significant changes in H1.2 and H1.4 relative content in the cell protein pool, with the exception of IC20 resveratrol, which caused a decrease in the relative level of H1.2 in the cell protein pool by 2.3 times. The treatment of cells with resveratrol at the non-toxic concentration led to a statistically significant reduction in the relative content of both H1.2 and H1.4, without any influence on the histones level in the total protein pool of the cells. Curcumin at the IC20, caused a statistically significant decrease in the chromatin bound fraction of the relative content of H1.2 by 3.6 times and H1.4 by 8.3 times, with a slight non-significant decrease of the relative content of these histones in the total protein pool. When cells were exposed to naringenin at the IC20, it also showed a statistically significant decrease in the relative contents of linker histones H1.2 and H1.4 in the chromatin fraction by 2.7 and 4.2 times respectively, however, a decrease of these proteins in the total cell protein pool was also observed: by 1.6 times for H1.2 and by 3.7 times for H1.4. EGCG and kaempferol at the IC20 caused a significant decrease of H1.4 content in the chromatin fraction by 2.6 and 2.0 times respectively, with no changes in the relative content of this histone in the total protein pool. For apigenin, coumarin, ginsenoside, and thymoquinone, there were no statistically significant changes in the relative content of the linker histones H1.2 and H1.4 in the chromatin fraction (Fig. 3).
Possible influence of PSMs on the expression of mRNA of 6 somatic variants of linker histones H1.0, H1.1, H1.2, H1.3, H1.4, and H1.5 was analyzed by RT-qPCR. After 24 hours of cell treatment with PSMs at the IC20 there were no significant changes detected in the relative level of mRNA expression for H1.0, H1.1, H1.2, H1.3, H1.4, and H1.5 (Table 3).
Thus, we reveled significant PSM influence on linker histone localizations. In particular, a 1-hour treatment with 11 PSMs at IC0 induced significant translocation of the linker histone H1.5 to nucleoli; 6 PSMs at IC0 caused statistically significant depletion of the histone H1.2 from chromatin fraction and 3 more PSMs did it at IC20; statistically significant depletion of the histone H1.4 from chromatin fraction was observed for 8 PSM treatment at IC0 and for 3 more PSMs at IC20. Curcumin, resveratrol, berberine, naringenin, and quercetin caused redislocation of all three variants of the studied linker histones showing some overlap of PSM effects on linker histone DNA-binding. To analyse whether PSMs effects on linker histones in chromatin fraction is not specific only for HeLa cells.
We studied influence of resveratrol, genestein, EGCG and CBL0137 on linker histone H1.2 in another cancer cell line—T47D, human breast cancer cells. We observed statistically significant decrease in the amount of this protein in cromatin fraction after 24-hour treatment of the cells with resveratrol at the concentration of 233 µM and genistein at the concentration of 176 µM at 24 hours. In T47D cells 1-hour treatment with CBL0137 at a concentration of 25 µM caused complete depletion of linker histone H1.2 in the chromatin fraction. The data obtained are comparable in two cell lines, that suggest general character of observation independent on cell types (Supplementary Fig. 4).
Linker histones H1.2 and H1.4 are involved in the regulation of the cell cycle. In particular, linker histone H1.2 depletion induced in T47D cells by shRNA-mediated knockdown was shown to cause cell arrest in the G1 phase and inhibit cell proliferation [41]. In addition, in CBL0137 treatment of the cells of breast cancer and hematological malignancies showed significant changes in cell cycle progression [42, 43].
PSM influence on cell cycle in HeLa cells was studied for the compounds
berberine, naringenin, curcumin, which produced the most significant
redistribution of the linker histones H1.5, H1.2 and H1.4. HeLa cells were
treated with PSMs at the concentrations IC20 (for 24-hour treatment, Table 1) for
1-hour and then cell populations were analyzed by flow cytometry. Modified
thymidine analogue EdU efficiently incorporated into DNA was fluorescently
labeled with the bright, photostable dye Alexa Fluor488 in a fast,
highly-specific, mild click reaction to detect cells with active DNA synthesis.
To mark the G2/M phase, we performed immunofluorescent staining of cells with
antibodies to cyclin B1 and then the secondary antibodies AlexaFluor647.
Treatment of HeLa cells with CBL0137 caused a significant decrease of the cell
proportions (EdU+, cyclin B1–) and (EdU+, cyclin B1+), correspondingly to 0.79%
and 0.15% versus 42.10% and 11.95% in the control and increase of the cell
proportion (EdU–, cyclin B1–) and (EdU–, cyclin B1+) to 79.20% and 20.53%
versus 37.27
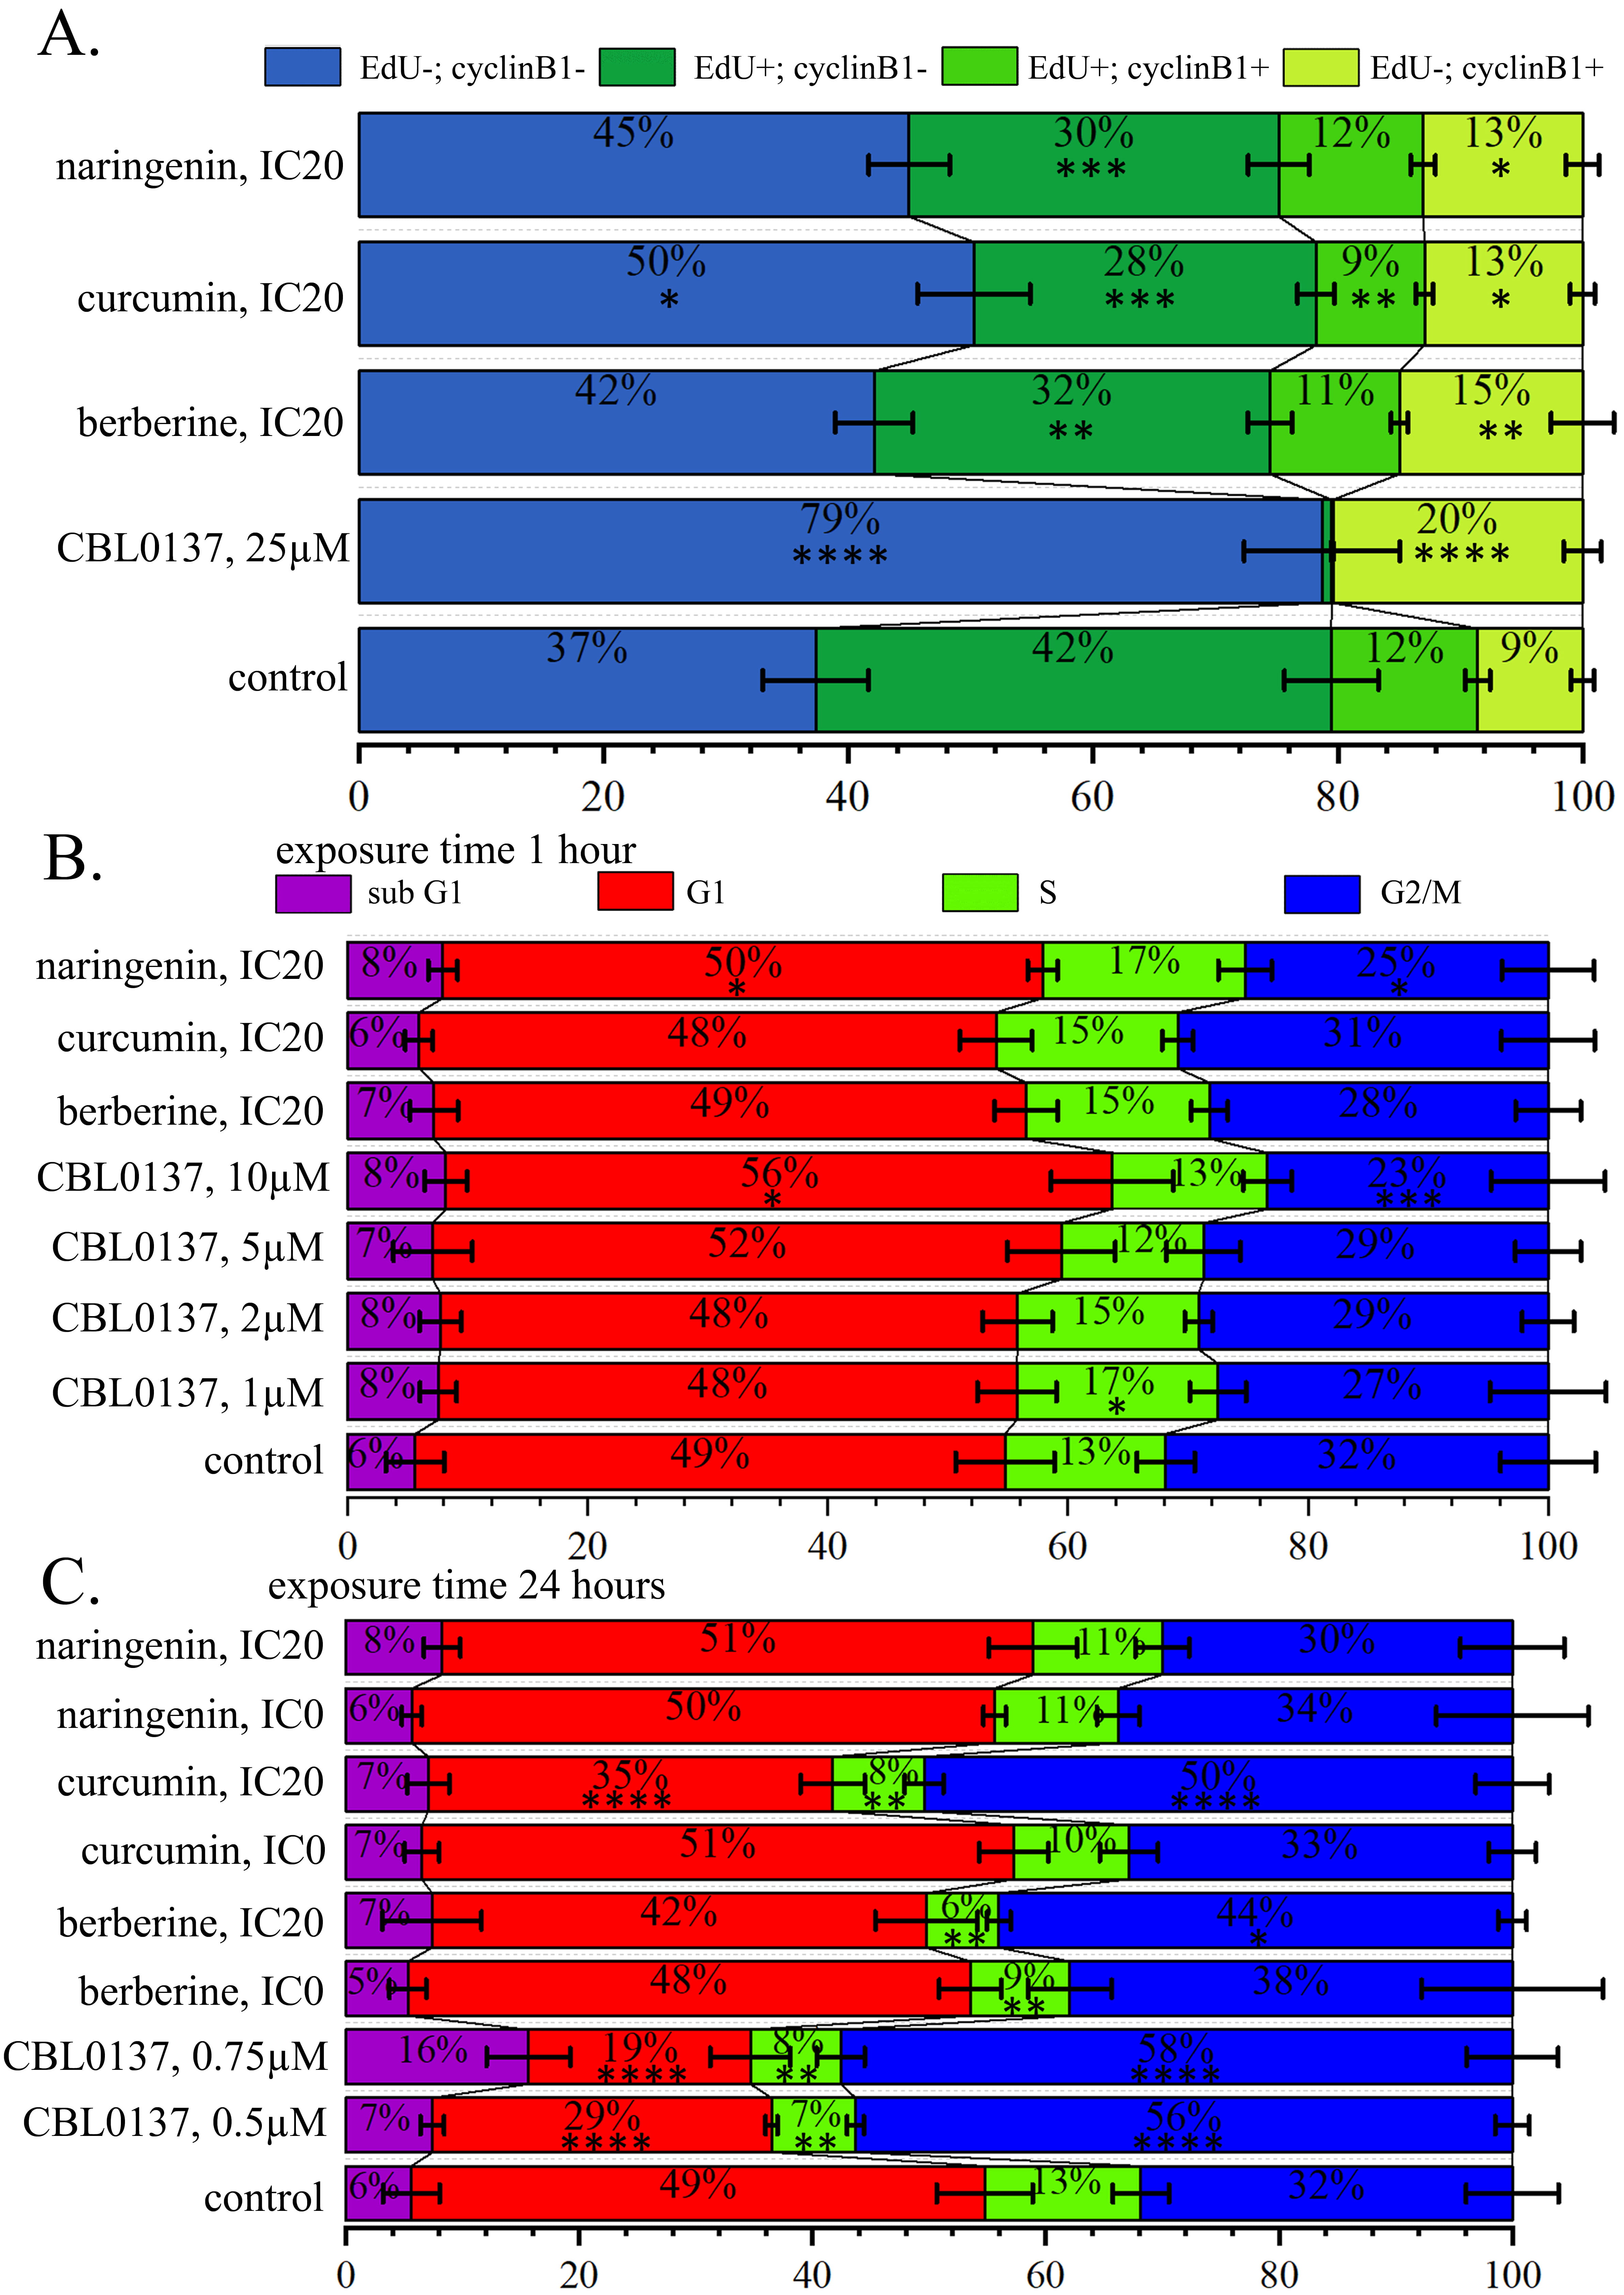 Fig. 4.
PSM influence on the cell cycle distribution. (A) Histograms of
cell proportions detected by 5-Ethynyl-2
Cell treatment with curcumin leads to less intensive but also significant reduction in proportions of the cells incorporating EdU, both cyclin B1– and cyclin B1+, and enlargement of proportions of the cells not incorporating EdU also cyclin B1– and cyclin B1+. Proportions of cells which did not incorporate EdU and both expressing and not expressing cyclin B1 significantly changed ubder influence of all PSMs analysed in this experiment. In particular, after the cell treatment with berberine proportion of cells (EdU–, cyclin B1–) was 42.67%, with curcumin—50.33%, and with naringenin—43.67% against 37.27% in the control cell population. In the untreated cell population, the proportion of cells (EdU–, cyclin B1+) was 8.57%, and it increased after the treatment with with berberine, curcumin, and naringenin up to 15.17%, 12.93% and 12.67%, correspondingly (Fig. 4A, Supplementary Fig. 5).
Significant changes in the proportion of cells incorporting EdU within just 1-hour PSM treatment revealed a decrease in DNA synthesis, and PSM effects were similar to those of CBL0137, although less pronounced.
Analyzing the cell cycle distribution after 1-hour treatment with CBL0137 using PI staining, we observed a statistically significant increase in the proportion of cells in the G1 phase: (55.04%) relative to control (48.73%), and a statistically significant decrease in the proportion of cells in G2/M: phase: (23.18%) compared to control (31.59%). Under naringenin treatment we observed a statistically significant increase in the proportion of cells in S phase (16.75%) relative to control (13.28%) and decrease in G2/M (25.10%) compared to control (31.59%) (Fig. 4B, Supplementary Fig. 6).
Analysis of cell cycle distribution after 24 hours cell treatment with compounds in non-toxic and IC20 concentration using PI staining showed a statistically significant reduction in the proportion of cells in the G1 phase after the treatment with CBL0137 at concentrations of 0.5 µM (28.77%) and 0.75 µM (18.77%) and after the treatment with curcumin at the IC20 concentration (34.18%) relative to control (48.73%). We demonstrated a statistically significant decrease in the proportion of cells in S phase (7.75%) after the treatment with CBL0137 at the concentrations of 0.5 µM (7.00%), 0.75 µM (7.63%) and PSMs: curcumin IC20 (7.74%), berberine IC0 (8.45%), berberine IC20 (6.10%) relative to untreated cells (13.28%) and a statistically significant increase in the proportion of cells in G2/M phase after the treatment with 0.5 µM CBL0137 (54.70%), 0.75 µM CBL0137 (56.81%), berberine IC20 (43.25%) and curcumin IC20 (49.72%) compared to control (31.59%) (Fig. 4C, Supplementary Figs. 5,7).
Causing linker histone depletion from chromatin, PSMs should influence the
degree of DNA packaging. The process of DNA packaging depends on the phase of the
cell cycle, and we propose that the effect of PSMs may be different depending on
the stage of the cell cycle, at which the treatment occurs. To clarify it, we
analyzed the effect of berberine, one of the most active PSM, which induced
linker histone H1.5 depletion up to 85% after the only 1-hour treatment, and it
also influences proportions of the cells in other cell cycle phases.
Immunostaining of the cells and the result interpretation were performed
analogous to the analysis at the previous part of the study on the PSM influence
on cell cycle progression. Synchronization of the cell cycle of the HeLa
H1.5-mCherry cells was performed using a double thymidine block. Since the double
thymidine block should lead to cell cycle arrest before S-phase, its removal
should be followed by an increase in the number of cells in S-phase compared to
the unsynchronized population. Subsequent flow cytometry analysis of the cell
population distribution by cell cycle phases after the different periods
following the removal of the thymidine block confirmed the enrichment of cell
proportions at the different cell cycle phases. Cell cycle distributions were
analyzed using EdU-based S-phase detection and cyclin B1-based G2/M-phases
detection. The cells without both markers (EdU–, cyclin B1–) were attributed to
the G1/G0 phases. According to the data obtained, a significant increase in the
proportion of cells in the corresponding phases of the cell cycle was obtained
compared to the unsynchronized culture. In particular, after removal of the
double thymidine block, the proportion of cells in the S-phase was up to 91
 Fig. 5.
Berberine influence on H1.5 intranuclear translocation in HeLa H1.5-mCherry cells. (A) Fluorescent microscopy of the cells in the different cell cycle phases; Scale bar 10 microns. (B) Results of the fluorescent microscopy and flow cytometry analyses of the cells (1) of the unsynchronized populations, (2) of the population enriched by the cells in G1/G0 phases 14 hours after removal of the thymidine block, (3) of the population enriched by the cells in S phases immediately after removal of the thymidine block, (4) of the population enriched by the cells in G2/M phases 6 hours after removal of the thymidine block; Scale bar 50 microns. (C) The histogram of cell proportions in the unsynchronized population and the populations enriched by the cells in G1/G0-, S-, and G2/M-phases by the thymidine block. (D) Berberine influence on the linker histone H1.5 nuclear localization on the synchronized cell population. Scale bar 10 microns.
We have shown that linker histone H1.5 translocation to the nucleoli after the treatment with berberine for occurred at each of the cell cycle phases: G1/G0, S, G2/M, and G2. Thus, no significant changes of berberine effect on the linker histone H1.5 localization depending on the cell cycle phase were found (Fig. 5D).
DNA-binding PSMs are small molecules, which do not form covalent bonds with DNA, but intercalate DNA or interact with DNA grooves and DNA alternative structures (Table 4, Ref. [4, 17, 19, 21, 22, 25, 44, 45, 46, 47, 48, 49, 50, 51, 52, 53, 54, 55, 56, 57, 58, 59, 60, 61, 62, 63, 64, 65, 66, 67, 68, 69, 70, 71, 72, 73, 74, 75, 76, 77, 78, 79, 80, 81, 82, 83, 84, 85, 86, 87, 88, 89]).
| № | Compound | Effect | Reference |
| 1 | Apigenin | DNA-binding (intercalation) | [19, 45] |
| DNA-binding (minor groove) | [46] | ||
| Epigenetic activation (inhibition HDAC) | [45, 47, 48] | ||
| Epigenetic activation (inhibition DNMT) | [45] | ||
| 2 | Berberine | DNA-binding (intercalation) | [49] |
| DNA-binding (minor groove) | [50] | ||
| Epigenetic activation (inhibition HDAC) | [51] | ||
| Epigenetic activation (inhibition DNMT) | [52] | ||
| 3 | Coumarin | DNA-binding (minor groove) | [53, 54] |
| 4 | Curcumin | DNA-binding (intercalation) | [46] |
| DNA-binding (minor groove) | [17, 44, 55, 56] | ||
| Epigenetic enzyme 1 (inhibitor HDAC) | [48, 56] | ||
| Epigenetic enzyme 2 (inhibitor DNMT) | [48, 57, 58] | ||
| 5 | Delphinidin | DNA-binding (intercalation) | [74] |
| DNA-binding (minor groove) | [75] | ||
| Epigenetic activation (inhibition HDAC) | [59, 60] | ||
| Epigenetic activation (inhibition DNMT) | [61] | ||
| 6 | EGCG | DNA-binding (intercalation) | [21, 25, 62, 63] |
| DNA-binding (minor groove) | [21] | ||
| Epigenetic activation (inhibition HDAC) | [58, 64, 65, 66, 67] | ||
| Epigenetic activation (inhibition DNMT) | [57, 58, 65, 66] | ||
| 7 | Fisetin | DNA-binding (intercalation) | [4, 68] |
| Epigenetic activation (inhibition HDAC) | [69] | ||
| Epigenetic activation (inhibition DNMT) | [70] | ||
| 8 | Genistein | DNA-binding (intercalation) | [47] |
| DNA-binding (minor groove) | |||
| Epigenetic activation (inhibition HDAC) | [48, 71] | ||
| Epigenetic activation (inhibition DNMT) | [71] | ||
| 9 | Ginsinoside | DNA-binding (minor groove) | [72] |
| Rb1 | Epigenetic activation (inhibition HDAC) | [73] | |
| 10 | Kaempferol | DNA-binding (intercalation) | [74] |
| DNA-binding (minor groove) | |||
| Epigenetic activation (inhibition HDAC) | [75] | ||
| Epigenetic activation (inhibition DNMT) | [76, 77] | ||
| 11 | Naringenin | DNA-binding (intercalation) | [4, 19] |
| DNA-binding (minor groove) | [46] | ||
| Epigenetic activation (inhibition HDAC) | [78, 79] | ||
| Epigenetic activation (inhibition DNMT) | [80] | ||
| 12 | Qeurcetin | DNA-binding (intercalation) | [74] |
| DNA-binding (minor groove) | [81] | ||
| Epigenetic activation (inhibition HDAC) | [48, 58, 82] | ||
| Epigenetic activation (inhibition DNMT) | [55, 58, 82] | ||
| 13 | Resveratrol | DNA-binding (intercalation) | [17, 81, 83] |
| DNA-binding (minor groove) | [17] | ||
| Epigenetic activation (inhibition HDAC) | [48, 58, 84] | ||
| Epigenetic activation (inhibition DNMT) | [57, 58, 84] | ||
| 14 | Sanguinarine | DNA-binding (intercalation) | [22] |
| DNA-binding (minor groove) | [85] | ||
| Epigenetic activation (inhibition HDAC) | [86] | ||
| Epigenetic activation (inhibition DNMT) | |||
| 15 | Thymoquinone | DNA-binding (intercalation) | [60] |
| DNA-binding (minor groove) | [87] | ||
| Epigenetic activation (inhibition HDAC) | [88, 89] | ||
| Epigenetic activation (inhibition DNMT) | [88] |
HDAC, Histone deacetylase; DNMT, DNA methyltransferase.
Recently a different experimental system has shown significant influence of many DNA-binding PSMs with anticancer activity on epigenetic regulation of transcription (Table 4). It is in agreement with an increasing body of data obtained by modern sophisticated technologies revealing that epigenetic enzymes and non-coding part of our genome have key roles in regulation of gene expression, and by this in cell behaviour and carcinogenesis [90, 91]. Epigenetic regulation is highly sensitive to environmental signals, which act as “phenotypic-inducer” of defined acquired traits. In particular, a group of small DNA-binding molecules was shown to remodel chromatin structure and activate epigenetically silenced genes [34, 44, 92]. Moreover, berberine was shown to interact with both DNA and linker histones, which should impact in cooperative interaction with nucleosomes [93]. All the data provided in the Table 4 support our hypothesis that PSMs may remodulate chromatin structure influencing histones interaction with DNA and by this have direct influence on cell transcriptome.
However, analyses of PSM influence on cell chromatin structure have never been performed in spite of the fact of their possible shielding or changing spatial characteristics of the binding sites for histones, epigenetic enzymes, transcription factors, and other DNA-mediated proteins [32, 33]. This information is important for profound understanding of the molecular mechanism of PSM anticancer activity and could help to advance cancer chemoprevention drug discovery.
The first goal of our study was to analyze chromatin structure in Hela cells treated with PSMs using approaches revealing both strong nucleosome destabilization and weak effects on DNA-binding of linker histone. We have shown that PSMs, unlike the antitumor drug CBL0137, do not cause any a destabilizing effect on the structure of nucleosomes. None of the studied PSMs affected the pattern of DNA cleavage, when chromatin was treated with micrococcal nuclease. PSMs did not influence localization of the nucleosome core histone H2B tagged by fluorescent mark. Moreover, the relative content of histone chaperone FACT in chromatin fraction measured using Western blotting did not change after HeLa cell treatment with PSMs. Thus, the effects of PSMs on the intranuclear localization of histone H2B and FACT are in good agreement with the data on the absence of the PSM effect on the profile of nuclear DNA cleavage by microccocal nuclease (NEB). By analysis of DNA cleavage products of chromatin treatment with NEB in the positive control, where Hela cell nuclei were treated with CBL0137 for only an hour, we observed entire disappearance of any DNA fragments, which corresponds to previously published data [35]. Moreover, HeLa cell treatment with CBL0137 caused significant redislocation of H2B in nuclei and a significant increase of FACT relative content in chromatin fraction that is in accordance with previously published data concerning CBL0137 effects on chromatin [37, 94, 95].
We proposed that effects of PSMs on chromatin structure may be significantly weaker compared to CBL0137 as it was demonstrated for indolocarbazole derivative LCS-1269 [44]. Using HeLa cells with mCherry-tagged H1.5 we demonstrated significant redistribution of H1.5 into the nucleoli for 11 PSMs out of 15, in particular, for berberine, delphinidin, fisetin, genistein, sanguinarine, resveratrol, curcumin, naringenin, quercetin, thymoquinone, and EGCG just after 1-hour treatment. The strongest effect was caused by berberine, and this effect is in agreement with the data of Rabbani-Chadegani et al. [93], who described cooperative interaction of berberine with DNA, linker histone and nucleosome. Then we analyzed the relative content of H1.2 and H1.4 in chromatin fraction by Western blotting. The reason we chose these linker histone variants to further analyze is they are the predominant variants in most somatic cells additionally, Izquierdo-Bouldstridge et al. [38] had shown of these histone variants caused significant transcriptome consequences including activation of endogenous retrovirus expression accompanied by the triggering of interferon signaling. Statistically significant depletion of the histone H1.2 in chromatin fraction of HeLa cells was observed for the treatment with six PSMs at IC0: berberine, delphinidin, fisetin, genistein, quercetin, resveratrol, and three more PSMs, in particular, curcumin, naringenin and sanguinarine, caused H1.2 depletions from chromatin fraction at IC20. Statistically significant depletion of the histone H1.4 in chromatin fraction of HeLa cells was observed for 8 PSM treatment at IC0: berberine, delphinidin, fisetin, genistein, kaempferol, quercetin, resveratrol, and sanguinarine. Three more PSMs, in particular, curcumin, EGCG and naringenin caused H1.4 depletions from chromatin fraction at IC20. The strongest depletion of both linker histone variants from chromatin fraction was observed, when HeLa cells were treated with IC20 fisetin, resveratrol, curcumin, delphinidin and quercetin. The relative protein level of linker histone variants H1.2 and H1.4 in chromatin fraction decreased by 70% or more. Noteworthy, that linker histones H1.2-H1.3-H1.5 depletion by triple knockdown in mouse embryonic stem cells (50% reduction total H1) caused dramatic chromatin structure changes Yuhong Fan et al. [96] and depletion of 80–90% of the linker histone variants H1.2 and H1.4 by their knockdown was most deleterious [37]. On the whole, we identified 8 compounds (kaempferol, EGCG, delphinidin, curcumin, genistein and berberine, sanguinarine, fisetin) that cause a statistically significant displacement of linker histones H1.2 and H1.4 from chromatin. Thus, we demonstrated for the first time that some PSMs may realize their effect via depletion of linker histone and that curcumin, resveratrol, EGCG, berberine, naringenin, and quercetin caused depletion of all three variants of linker histones H1.2, H1.4 and H1.5 showing some overlap with PSM effects on linker histone DNA-binding. However, four PSMs, in particular, apigenin, coumarin, ginsenoside Rb1 and thymoquinone, did not cause statistically significant quantitative changes either in the total pool of proteins or in the chromatin-bound protein fraction, which may indicate their low ability to influence the interaction of DNA and linker histones.
We demonstrated that PSMs do not cause any statistically significant effects on the transcription of linker histone genes of six somatic variants. Moreover, the total amount of linker histones H1.2 and H1.4 in cells was not significantly changed, the only two exeptions being resveratrol and naringenin (Table 3). Under the treatment of cells with naringenin and resveratrol, not only a direct depletion of linker histones from chromatin occurs, but other effects on the maturation/degradation of linker proteins in cells also take place. Resveratrol caused depletion of linker histone H1.2 from chromatin fraction up to 4.55 times on the background of decrease in the total amount of linker histones in 2.33 times and significant depletion of linker histones H1.4 (up to 33.33 times) on the background of insignificant decrease of its total amount in nuclei. Naringenin caused significant depletion of linker histones H1.2 and H1.4 from chromatin fraction on the background of insignificant decrease in the total amount of linker histone H1.2 and significant decrease in the total amount of linker histone H1.4. Thus, for most of PSMs depletion of linker histones H1.2 and H1.4 from chromatin fraction was observed on the background of insignificant change in the total pool of H1.2 and H1.4 in nuclei.
Displacement of linker histones from chromatin by PSMs may be proposed to involve either significant competition between PSMs and linker histones for the binding sites of DNA or an influence on the rate of exchange of linker histones with DNA. It can be achieved by increasing post-transcriptional modifications of linker histones, such as phosphorylation, acetylation, formylation, propionylation and crotonylation, leading to a decrease in the positive charge of linker histones that affects DNA packaging and accommodation of a less compact state of chromatin [97, 98]. Noteworthy, the PSM effect on H1.5 localization in cell nuclei was observed under 1-hour treatment indicating the most likely competitive inhibition mechanism
Linker histone condensation/decondensation is involved in regulation of cell cycle, DNA repair, thanscription [98, 99, 100]. It has been found that relative content of linker histones, their pattern of expression and post-translational modifications in cancer cells are different from characteristics of normal cells and this change is associated with tumor grade and aggressiveness [101]. For example, high expression of H1.5 was found in high-grade tumors (pulmonary neuroendocrine tumors and prostate cancer) against decreased expression of H1.5 observed in low-grade tumors [102, 103]. H1.0 is highly expressed in terminally differentiated cells, and its expression is generally downregulated in various cancers [104, 105]. Levels of linker histone variants H1.0, H1.1, H1.4 and H1x have been found to be reduced in malignant adenocarcinomas compared to benign adenomas [106, 107]. However, on the contrary, high levels of H1.2 expression correlate with poor treatment results for pancreatic cancer [108].
Loss of linker histones or production of a mutant protein can cause aberrant chromatin states. Reduction of H1 stoichiometry leads to decreased H3K27 methylation, increased H3K36 methylation, and intensifies interaction frequency between compartments followed by deregulation of the cell survival pathways [32]. The local density of H1 controls the balance of repressive and active chromatin domains by DNA packaging. Depletion of linker histones may be a marker of genomic instability in tumor cells and be a precursor to more serious transcriptome abnormalities and expression of non-coding regions. A local depletion of some H1 variants was associated with the intensive expression of major satellite and then other components of heterochromatin: LINE, minor satellite, Long terminal repeate (LTR) [109]. In breast cancer cells, coordinated loss of H1.2 and H1.4 was demonstrated to trigger an interferon response due to derepression of heterochromatin regions, that is a characteristic hallmark of many cancers [40]. Noteworthy, that depletion of any linker histone variant induced by the corresponding gene knocked-down is usually compensated by overexpression of other variants, however it does not prevent changes in higher-order chromatin folding [110, 111]. Thus, our study data showing that both CBL0137 and a number of DNA-binding PSMs cause the depletion of linker histone variants from chromatin, let us propose their influence on higher-order chromatin folding, enabling LINE, minor satellite, LTR expression and by this activation of interferon I-type signaling.
Linker histones play diverse roles in different cellular processes including cell cycle. Many linker histone variants contain multiple cyclin-dependent kinase (CDK) motifs, which undergo site-specific phosphorylation [97]. These modifications are variant-specific and some of them are highly cell cycle-dependent, reaching a maximum in M phase [112]. Loss of linker histones in chromatin, in addition to transcriptome changing in the expression of a number of genes, can also cause abnormalities in cell cycle progression. Thus, we decided to analyze whether PSMs causing strong depletion of linker histones from chromatin fraction may influence cell cycle distribution. According to our data berberine, curcumin and naringenin influence the cell cycle distribution causing a decrease in DNA synthesis and a significant increase in the proportions of cells in G1/G0 and G2/M phases were observed.
After 1-hour CBL0137 treatment at high concentration (10 µM) we observed significant increase of the proportion of cells in G1-phase that is in agreement with almost entire disappearance of the cells synthesizing DNA (by EdU incorporation): up to 1% against 54% in control untreated cell population. After 1-hour naringenin treatment at the concentration IC20 we observed significant increase of the proportion of cells in S-phase that is also in agreement with significant inhibition of DNA synthesis (by EdU). Significant decrease of the proportion of cells incorporating EdU was also observed under 1-hour cell treatment with curcumin and berberine. We could also conclude that PSMs studied in our cell cycle experiments did not cause fast block before S-phase that opposed to CBL0137 at high concentrations. However, after 24-hour CBL0137 treatment with low concentration we observed significant increase of the proportion of the cells in G2/M-phase; analogous changes also significant but less pronounced, were observed for 24- hour treatments with curcumin and berberine at the concentration of IC20.
These results are in agreement with the data of Sancho et al. [41], who showed that in T47D human breast cancer cells knock-down of H1.2 reduces the levels of several proteins required for the cell cycle, including CDK2, MCM2 and PCNA, causing an arrest in the G1 phase of the cell cycle. Moreover, H1.2 depletion inhibits progesterone receptor isoform A (PRA)-mediated cell proliferation and promotes entry into the G2/M and S phases of the cell cycle [113]. It is in accordance with the data on cell arrest in the G0/G1 or G2/M phases shown in a number of studies on cell lines of different cancers, in particular, for berberine in human melanoma A375 and colorectal cancer HCT 116 cells [114, 115], curcumin in acute myeloid leukemia K562, colorectal cancer HCT 116, SK-N-SH neuroblastoma and glioblastoma cells [116, 117, 118, 119] and naringenin in breast cancer MDA-MB-231 cells [120].
Previously, it was shown that using immunofluorescence labeling by the specific antibodies in synchronized HeLa cells makes phosphorylation of H1.5 Ser17 appear early in G1 at discrete speckles followed by phosphorylation of Ser172. Thr10 phosphorylation started during prophase, showed highest phosphorylation levels during metaphase, and disappeared clearly before chromatin decondensation occurred [112]. Thus, our data demonstrates the translocation of H1.5 into the nucleoli after berberine1-hour treatment of cells in various phases of the cycle for only 1 hour (except mitosis, when chromatin condenses) which may be interpreted as follows: berberine causes concurrent inhibition of linker histone DNA-binding either independently on its post-translational phosphorylation and other post-translational modifications or on those variants of linker histone post-translational modifications that stably present in chromatin.
Functional role of linker histones in the regulation of endogenous retroelements, in particular, LINEs and SINEs, is well known [40, 121, 122, 123]. In turn, a number of studies have recently revealed involvement of endogenous retroelements in activation of interferon type I signaling, and by this, in both normal physiological functioning of the immune system and pathogenesis of immune disorders [124, 125]. Moreover, inhibition of interferon type I signaling was shown to immunosuppress tumor microenvironment while its restoring is followed by antitumor immunity activation [126]. Herein, we demonstrated for the first time that PSMs cause linker histone depletion from chromatin fraction, that may represent a possible mechanism for induction of interferon type I signaling, which has been described for a number of PSMs, and it represents one of the possible mechanisms of PSM anticancer activity.
Recently, great progress has been achieved in understanding of chromatin organization and functioning. In particular, the role of linker histones, the most abundant chromatin-associated proteins, was demonsrated in the regulation of such dynamic processes in cells as replication, cell cycle, DNA repair, RNA turnover, transcription and development was demonstrated. Affinity of every linker histone variant for chromatin depends on its post-translational modifications occurring in various positions and differing by several types, that finally determines accessibility of the DNA region for other DNA-mediated proteins. It explains diverse and complex peculiarities of linker histone functions both in the open and closed states of chromatin. In our study we demonstrated PSM influence on interaction of DNA with linker histones H1.2, H1.4 and H1.5 that is significant for understanding of xenobiotic influence on genome functioning and for elucidation of the mechanism of anticancer effect of PSM. In future it will be important to find out influence of PSM on DNA interaction with other variants of linker histones and studied variants possessing different post-translational modifications. Linker histone variants H1.2 and H1.4 involvement in regulations of expression of LINEs and SINEs, influencing interferon type I signaling, demonstrates how linker histones may impact physiological functioning of the immune system. In this context our finding of the ability of PSMs to cause H1.2, H1.4 and H1.5 translocations from chromatin not only demonstrates one of the possible mechanisms of PSM biological activity, but also reveal the way how small DNA binding molecules may cause transcriptome adaptive changes. That extends our understanding of the complex peculiarities of linker histone functioning and opens a new approach for their further studies, in particular, their influence on LINE expression in respect to immune control of cancer cell clone formation.
PSMs, plant secondary metabolites; MGBL, minor groove binding ligands; CDK, cyclin-dependent kinase; DMEM, Dulbecco’s Modified Eagle Medium.
Data presented in this study are contained within this article and in the supplementary materials, or are available upon request to the corresponding author.
OV and MY designed the research study and wrote the original draft. OV, IA, RZ, DN, AB, DGG, AS performed the experiments and performed formal analysis. OV, GB, KK, MY, KG, AJ contributed to the conception and design of the work and interpretation of data obtained. TZ, KG, AG, AJ and KK contributed to the acquisition of methodology and experiment supervision, editing and provided writing revisions. All authors contributed to editorial changes in the manuscript. All authors read and approved the final manuscript. All authors have participated sufficiently in the work and agreed to be accountable for all aspects of the work.
Not applicable.
We would like to thanks I. Dronova for the help in translating the article.
The work was supported by the Russian Science Foundation grant 23-25-00276.
The authors declare no conflict of interest.
Supplementary material associated with this article can be found, in the online version, at https://doi.org/10.31083/j.fbl2908275.
References
Publisher’s Note: IMR Press stays neutral with regard to jurisdictional claims in published maps and institutional affiliations.