1. Introduction
The aging population is experiencing a significant rise in the incidence and
prevalence of age-related diseases, such as coronary heart disease (CHD) and
atrial fibrillation (AF) [1, 2]. Telomeres, consisting of repetitive sequences at
the distal ends of chromosome, serve as important biomarkers of aging, and the
shortened length of telomeres is strongly associated with cardiovascular aging
and disease. Patients with shorter telomeres in peripheral blood leukocytes are
at higher risk of cardiovascular diseases such as heart failure (HF) and AF [3].
Telomeres depend on telomerase to synthesize their own repetitive sequences as a
means of compensating for telomere shortening caused by cell division. Telomerase
reverse transcriptase (TERT) is the rate-limiting enzyme of telomerase, which
means that TERT directly influences telomerase activity and ultimately determines
telomere length [4]. Research has been increasingly focusing on the maintenance
of telomere length through activation of TERT to delay aging, as well as on the
prevention and even treatment of age-related diseases. TERT has shown promising
applications in the treatment of CHD, myocardial ischemia/reperfusion (I/R)
injury, HF, and cardiotoxicity of chemotherapeutic agents in vitro and in mice. However, studies on its effects on the
electrophysiology of cardiomyocytes are sparse [5, 6]. Previous studies have shown
that telomere shortening can cause mitochondrial dysfunction and intracellular
Ca overload in cardiomyocytes, which may result in arrhythmias, but the
specific impact of TERT on mitochondrial function and intracellular Ca in
cardiomyocytes is not well understood [7, 8]. The objective of this study was to
investigate the role of TERT in the electrophysiology and mitochondrial function
of mouse atrial myocytes, particularly focusing on its regulatory effects on
intracellular Ca.
TERT plays a vital role in treating cardiovascular diseases and maintaining
heart function. Studies have shown that cardiac-specific TERT overexpression in
an acute myocardial infarction mouse model reduces infarct size in vivo,
and decreases apoptosis in cultured cardiomyocytes in vitro [9, 10].
Ale-Agha et al. [11] demonstrated that mitochondrial TERT reduces
cardiomyocyte apoptosis, ameliorates myocardial fibrosis, and promotes
endothelial cell migration and angiogenesis. Chatterjee et al. [12]
reported that overexpression of telomerase reduces doxorubicin-mediated apoptosis
and protects cardiac function in doxorubicin-induced cardiotoxicity models.
Madonna et al. [13] observed that overexpression of TERT in cardiac stem
cells increases their survival after I/R injury. Conversely, reduced TERT
activity increases the risk of heart injury. Ait-Aissa et al. [14] noted
that telomerase deficiency predisposes to HF and I/R injury in rats.
Additionally, reduced TERT activity triggers mitochondrial and cellular oxidative
stress, leading to impaired cell division, cardiomyocyte hypertrophy, and even
death [15, 16, 17]. Previous studies have suggested that telomere shortening activates
p53 expression, subsequently inhibiting peroxisome proliferator-activated
receptor gamma coactivator-1 (PGC-1) and leading to intracellular Ca
overload and mitochondrial dysfunction [7, 8]. A recent study reported that
telomere damage induces mitochondrial dysfunction via the p53/PGC-1
pathway [18]. Transformation-related protein 53, also known as p53, is critical
in regulating Ca-dependent apoptosis and mitochondrial function [19].
PGC-1 is implicated in the regulation of mitochondrial biogenesis and
energy metabolism. Moreover, PGC-1 not only directly reduces
intracellular Ca but also indirectly alleviates cellular oxidative stress
[20, 21]. Consequently, we hypothesize that TERT regulates cardiomyocyte
mitochondrial function and intracellular Ca homeostasis through the
p53/PGC-1 pathway, ultimately affecting cellular electrophysiology.
In this study, we silenced and overexpressed the TERT gene in vitro to observe its effects on mitochondrial function, intracellular
Ca homeostasis, and electrophysiology of atrial myocytes. Subsequently,
the regulatory effects of TERT on p53/PGC-1 pathway were confirmed by
silencing and overexpressing TERT and interfering with p53 and PGC-1.
Moreover, we explored the feasibility of PGC-1 as an intervention
target for cardiovascular diseases in vitro.
2. Materials and Methods
2.1 Cell Culture
HL-1 cells were purchased from Shenzhen Haodi Huatuo Biotechnology Co., Ltd.
(Cat. No. HTX2129; Shenzhen, China). The authors authenticated the cells shortly
before use with the short tandem repeat profiling technique. Mycoplasma testing
was performed using the MycoSensor PCR Assay Kit (Agilent Technologies, Santa
Clara, CA, USA). HL-1 cells were cultivated in complete Claycomb Medium (Sigma,
St. Louis, MO, USA) supplemented with 10% fetal bovine serum (Gibco, Waltham,
MA, USA), 100 U/mL penicillin/streptomycin (Invitrogen, Carlsbad, CA, USA), 4 mM
l-glutamine (Gibco), and 100 µM norepinephrine (Solarbio, Beijing,
China). The cardiomyocytes were cultured on cell culture plastics coverslips
coated with 0.02% gelatin (Sigma) at 37 °C in 5% CO [22]. The medium was
refreshed every 48 h, and the cultures were split 1:3 using standard subculturing
procedures once cells reached high confluence at about 3–4 days.
2.2 Cell Transfection
For cell transfection, TERT-overexpressing lentiviruses and lentiviral-based
small hairpin RNA (shRNA) targeting TERT were purchased from Genechem Co., Ltd.
(Shanghai, China). Empty lentivirus vector was utilized as a negative control for
TERT and shTERT. The specific sequence of shRNA-TERT is provided in the
supplementary materials (Supplementary Table 1); shTERT#3 was selected
for subsequent experiments (Supplementary Fig. 1). When HL-1 cells
reached 50% confluency, the original medium was replaced with fresh medium
containing 6 µg/mL polybrene (Sigma). Next, virus suspension was added
according to the manufacturer’s instructions, and the virus-containing medium was
replaced with fresh complete medium after 24 h. After 72 h, lentiviral-transduced
cells were selected with 3 µg/mL puromycin (Sigma) and verified by Western
blot (WB) analysis. Finally, the most effective shRNA-TERT was used for the
downstream functional experiments. The study design for the experiment is shown
in Fig. 1.
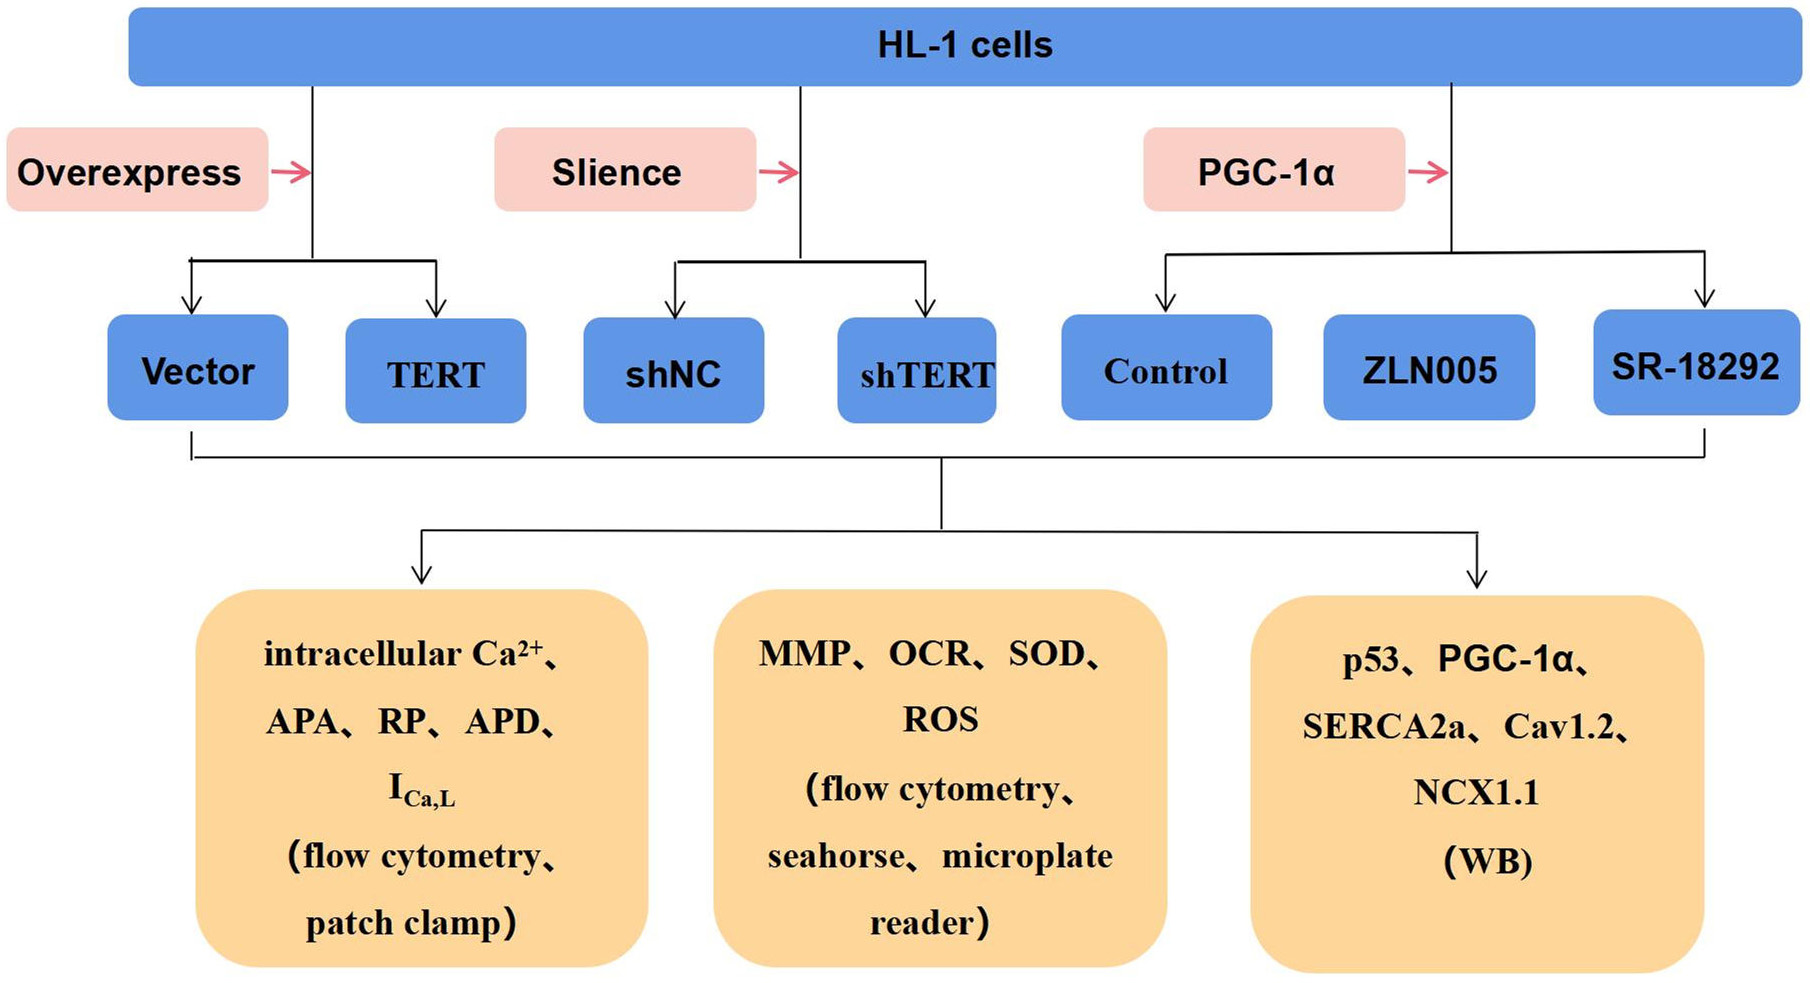 Fig. 1.
Study design for the experiment. TERT, telomerase reverse
transcriptase; PGC-1, peroxisome proliferator-activated receptor gamma
coactivator 1-alpha; APA, action potential amplitude; RP, resting potential; APD,
action potential duration; I, L-type Ca currents; MMP,
mitochondrial membrane potential; OCR, oxygen consumption rate; SOD, superoxide
dismutase; ROS, reactive oxygen species; WB, Western blot; shNC, negative control.
2.3 Drug Treatment
When validating the p53/PGC-1 pathway, the concentration of each drug
was determined based on previous literature and preliminary test results [18, 23].
To investigate the effects of p53 on PGC-1, HL-1 cells were treated
with the p53 agonist Tenovin-6 (final concentration of 15 µM; Selleck
Chemicals, Houston, TX, USA) and the p53 inhibitor PFT (final
concentration of 15 µM; Selleck), while the control group received an equal
volume of dimethyl sulfoxide (DMSO; Solarbio), and all were co-cultured for 24 h.
To validate the role of PGC-1, HL-1 cells were treated with the
PGC-1 agonist ZLN005 (final concentration of 20 µM;
MedChemExpress [MCE], Monmouth Junction, NJ, USA) and the PGC-1
inhibitor SR-182923 (final concentration of 20 µM; MCE); the control group
received an equal volume of DMSO (Solarbio) with a co-culture duration of 24 h.
2.4 Cellular Electrophysiology
As we previously described [24], the Axon Multiclamp 700B Amplifier (Molecular
Devices, San Jose, CA, USA) and pClamp software (version 10.4; Axon Co.,
Scottsdale, AZ, USA) were used for the whole-cell patch-clamp study. An electrode
with a tip diameter of 2–4 µm was pulled with the PP-83
Microelectrode Puller (Narishige Co., Tokyo, Japan).
To measure the action potential (AP), the patch clamp was set to “current
clamp” mode, with a clamping potential of 0 mV and stimulation applied at 1500
pA for 10 ms. The AP of the cells in each group was recorded, and parameters such
as AP duration (APD), AP amplitude (APA), and resting membrane potential (RMP)
were calculated. The extracellular solution composition was (in mM): NaCl 140,
KCl 4, CaCl 1, MgCl 1, HEPEs 10, and glucose 10, adjusted to a pH of
7.4 with NaOH. The intracellular solution consisted of (in mM): K-aspartame 120,
KCl 20, NaATP 4, MgCl 1, HEPES 10, and glucose 10, and the pH was
adjusted to 7.4 with KOH.
For voltage-gated L-type Ca current (I) measurements, the patch
clamp was set to “voltage-clamp” mode. A holding potential of –40 mV was used,
with a depolarizing pulse of 0 mV for 150 ms applied to record a slowly
inactivated inward current, which was controlled with 5 µmol/L nifedipine,
a Ca channel blocker. Extracellular solution comprised (in mM): NaCl 135,
CaCl 1, MgCl 5, CsCl 5.4, BaCl 0.3, NaHPO 0.33,
HEPEs 10 and glucose 10, with pH adjusted to 7.4 with NaOH. Intracellular
solution included (in mM): TEA-Cl 10, CaCl 1, MgCl 5, CsCl 120, EGTA
10, NaATP 5, HEPEs 10 and the pH was adjusted to 7.4 with CsOH.
2.5 Intracellular Ca
HL-1 cells were washed twice with Ca-free phosphate-buffered saline (PBS)
(Solarbio), and incubated with Fluo-4/AM (Invitrogen) at 37 °C for 60 min
at a 10 µM final concentration. The cells were digested with 0.25%
trypsin-EDTA (Hyclone Laboratories, Logan, UT, USA), centrifuged at 1000 rpm for
5 min to eliminate excess dye, washed twice with Ca-free PBS, and finally
resuspended to 0.3 mL with Ca-free PBS. Subsequently, Ca
fluorescence intensity was quantified using the FACS Calibur Flow Cytometer (BD
Biosciences, Franklin Lakes, NJ, USA) at an excitation wavelength of 485 nm and
emission wavelength of 520 nm. A total of 2 10 cells were
collected, and the intracellular Ca concentration was expressed as mean
fluorescence intensity. Data were analyzed using FlowJo software (VX10.6.2,
TreeStar, Ashland, OR, USA).
2.6 Reactive Oxygen Species
The reactive oxygen species (ROS) Detection Assay Kit (Sigma) was utilized to
determine the intracellular oxidative stress level. Following the manufacturer’s
protocol, the cells were suspended in culture medium at a density of 5
10 cells/mL. Subsequently, 1 µL ROS Detection Reagent Stock Solution
was added to 1 mL culture solution, and it was incubated in a cell incubator with
5% CO at 37 °C, for 30–60 min in the dark. Fluorescence intensity was
measured using the FACS Calibur Flow Cytometer (BD Biosciences) at an excitation
wavelength of 540 nm and emission wavelength of 570 nm. Then 2
10 cells were collected and the ROS concentration was expressed as mean
fluorescence. Data were analyzed with FlowJo VX10 software.
2.7 Superoxide Dismutase Activity
Superoxide dismutase (SOD) was measured using an assay kit (Sigma). The
superoxide interacts with WST-1 and an electron-coupling reagent to produce the
formazan product. SOD converts superoxide to hydrogen peroxide, yielding a
reduced colorimetric signal at 450 nm. A microplate reader
(BioTek, Winooski, VT, USA) was used to measure the optical density value of each
well at a wavelength of 450 nm and calculate the SOD (%) = ([A –
A ] – [A – A ])/(A – A
) 100%. The results were normalized to the protein
concentration.
2.8 Mitochondrial Membrane Potential
For mitochondrial membrane potential (MMP) assessment, HL-1 cells were prepared
in complete Claycomb Medium at a density of 5 10 cells/mL.
Following the manufacturer’s instructions, 2 µL of 500X MitoTellTM Orange
was added to 1 mL cell solution and incubated in a cell incubator with 5%
CO at 37 °C, for 30 min. Fluorescence intensity was measured using the FACS
Calibur Flow Cytometer (BD Biosciences) at an excitation wavelength of 540 nm and
an emission wavelength of 590 nm. Then 2 10 cells were collected
and the MMP was expressed as mean fluorescence. Data were processed using FlowJo
VX10 software.
2.9 Mitochondrial Oxygen Consumption Rate
To determine the mitochondrial oxygen consumption rate (OCR), a Seahorse
analyzer (XF96; Agilent Technologies) was used [25, 26]. When cells were 70–80%
confluent, OCR was assessed. Prior to measurement, cells were incubated at 37
°C without CO for 1 h. Basal OCR was initially measured in
triplicate. Subsequently, to inhibit ATP synthase, cells were treated with 1.5
µM oligomycin, and 1.0 µM carbonyl cyanide 4-(trifluoromethoxy)
phenylhydrazone (FCCP) was added for maximal uncoupled respiration. Next, 0.5
µM rotenone/antimycin A was used to test non-mitochondrial respiration.
ATP-linked respiration was the basal OCR subtracted from the uncoupled (after the
addition of oligomycin). After FCCP addition, the maximum respiratory capacity
was tested, while the spare capacity was calculated by subtracting basal from
FCCP-induced OCR. All Seahorse results were normalized to protein concentration,
which was quantified by the Bradford assay (Solarbio).
2.10 WB Analysis
WB analysis was conducted following previously established protocols [24].
Protein samples were equally loaded on sodium dodecyl sulfate polyacrylamide gels
and transferred to nitrocellulose membranes [24]. The membranes were blocked in
5% skim milk for 1 h at room temperature and then incubated overnight at 4 °C
with the following primary antibodies: rabbit anti-actin monoclonal (1:1000,
ab179467; Abcam, Cambridge, MA, USA), rabbit anti-p53 polyclonal (1:1000,
ab131442; Abcam), rabbit anti-PGC-1 polyclonal (1:1000, ab54481;
Abcam), rabbit anti-SERCA2a monoclonal (1:1000, ab150435; Abcam), rabbit
anti-NCX1.1 monoclonal (1:1000, ab177952; Abcam), rabbit anti-CaV1.2 monoclonal
(1:1000, ab270987; Abcam), mouse anti-TERT monoclonal (1:500, sc-377511; Santa
Cruz Biotechnology, Dallas, TX, USA). The chemiluminescence detection reagent
(Western Lightning Plus®ECL, N0775330; PerkinElmer, Waltham, MA, USA)
showed a specific signal after 2 h of incubation with the appropriate secondary
antibody (A0277, Beyotime, Shanghai, China).
2.11 Statistical Analyses
For statistical evaluation, SPSS version 21.0 (IBM SPSS Statistics, Armonk, NY,
USA) was employed. The results are expressed as the mean standard error
of the mean. The Shapiro–Wilk normality test was utilized to assess the
normality of the data distribution. For comparisons between two groups, the
unpaired two-tailed Student’s t-test or Mann–Whitney U tests were
applied for normally or non-normally distributed data, respectively. Comparisons
among three groups were performed using one-way analysis of variance followed by
Dunnett’s post hoc test. p 0.05 was considered statistically
significant.
3. Results
3.1 TERT Regulates the APD
AP was recorded with the patch-clamp technique, and the original AP recording of
the HL-1 cells is shown in Fig. 2A,B. TERT silencing significantly shortened
action potential duration at 50% repolarization (APD) and APD
(Fig. 2E,F). In contrast to silencing, TERT overexpression significantly
prolonged APD, especially APD and APD (n = 10, p 0.01)
(Fig. 2C,D). Neither TERT overexpression nor silencing had a significant impact
on APA and RMP compared to the respective control groups (Table 1).
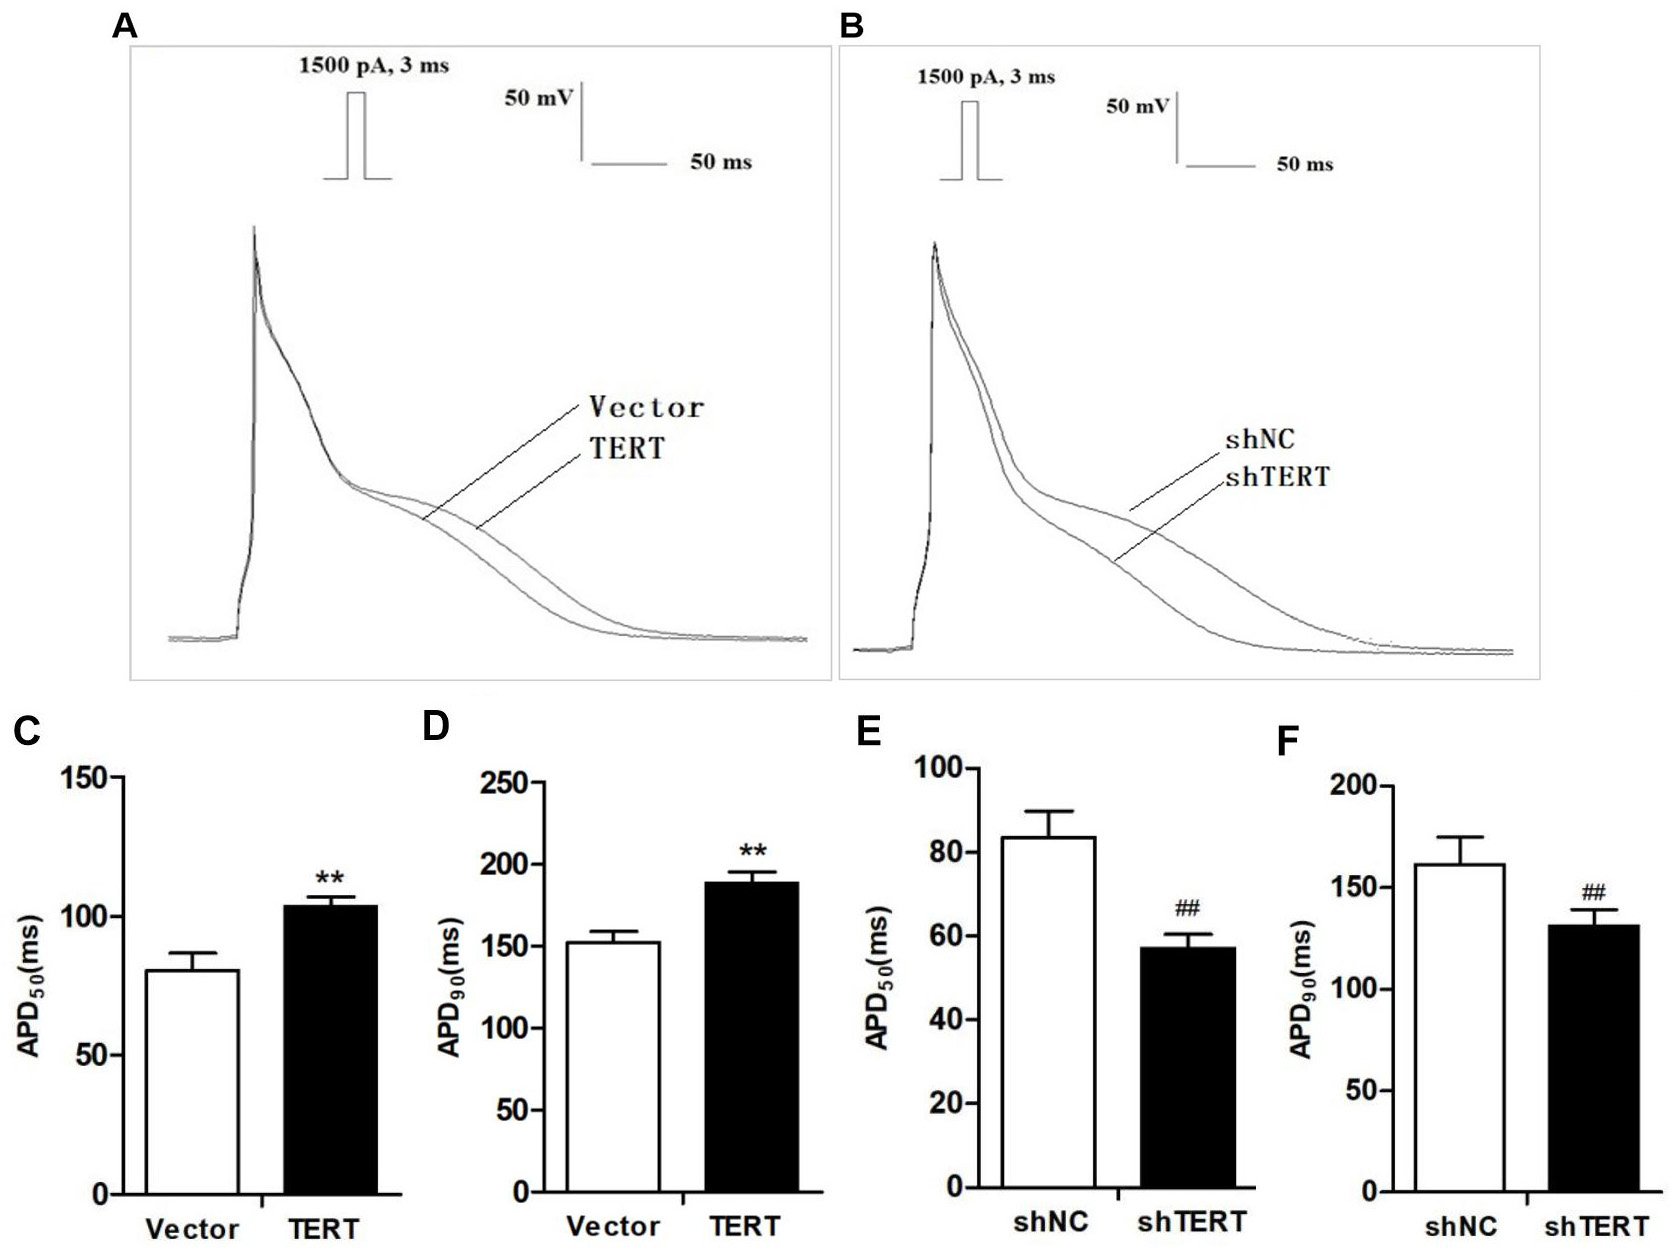 Fig. 2.
Effects of TERT on APD. (A,B) Original recording of the action
potential (AP) in TERT overexpression (A) and TERT-silenced (B) HL-1 cells. (C)
TERT overexpression significantly prolonged APD. (D) APD of the
TERT overexpression group was clearly prolonged compared with the Vector group.
(E) TERT silencing significantly shortened APD. (F) TERT silencing
shortened APD. **p 0.01 vs. Vector group;
p 0.01 vs. shNC group. TERT, telomerase reverse
transcriptase; APD, action potential duration; APD, action potential
duration at 50% repolarization; APD, action potential duration at 90%
repolarization.
Table 1.Effects of TERT on AP parameters in HL-1 cells (n = 10, s).
| Parameters |
Vector |
TERT |
shNC |
| APA (mV) |
110.0 11.2 |
113.5 6.1 |
107.1 5.7 |
| RP (mV) |
–80.1 2.5 |
–79.1 3.5 |
–77.7 2.9 |
| APD (ms) |
12.3 1.0 |
12.0 1.3 |
10.8 1.2 |
| APD (ms) |
80.5 6.2 |
103.4 3.7** |
83.5 6.3 |
| APD (ms) |
152.2 6.7 |
188.4 6.7** |
161.5 13.5 |
**p 0.01 vs. Vector group; p
0.05, p 0.01 vs. shNC group. AP, action potential;
APA, action potential amplitude; RP, resting potential; APD, action potential
duration.
3.2 TERT Regulates L-type Calcium Channel Current and Expression of
the CaV1.2
Previous studies have indicated that a decrease in Cav1.2, accompanied by
reduced I, is a primary pathological change in APD shortening [27, 28].
As demonstrated in Fig. 3A, I amplitude in the TERT-silenced group was
markedly lower compared to the shNC group. Conversely, TERT overexpression
significantly increased I amplitude in HL-1 cells. Furthermore, when the
current amplitude was replaced by current density, we found that silencing TERT
led to a decrease in peak I density from –9.31 0.5 pA/pF to
–7.35 0.8 pA/pF (n = 10, p 0.05; Fig. 3C). For the opposite
condition, the peak I density of the TERT overexpression group (–16.3
1.2 pA/pF) was significantly greater than that of the control group
(–9.35 0.6 pA/pF) at 0 mV depolarization (n = 10, p 0.01;
Fig. 3B).
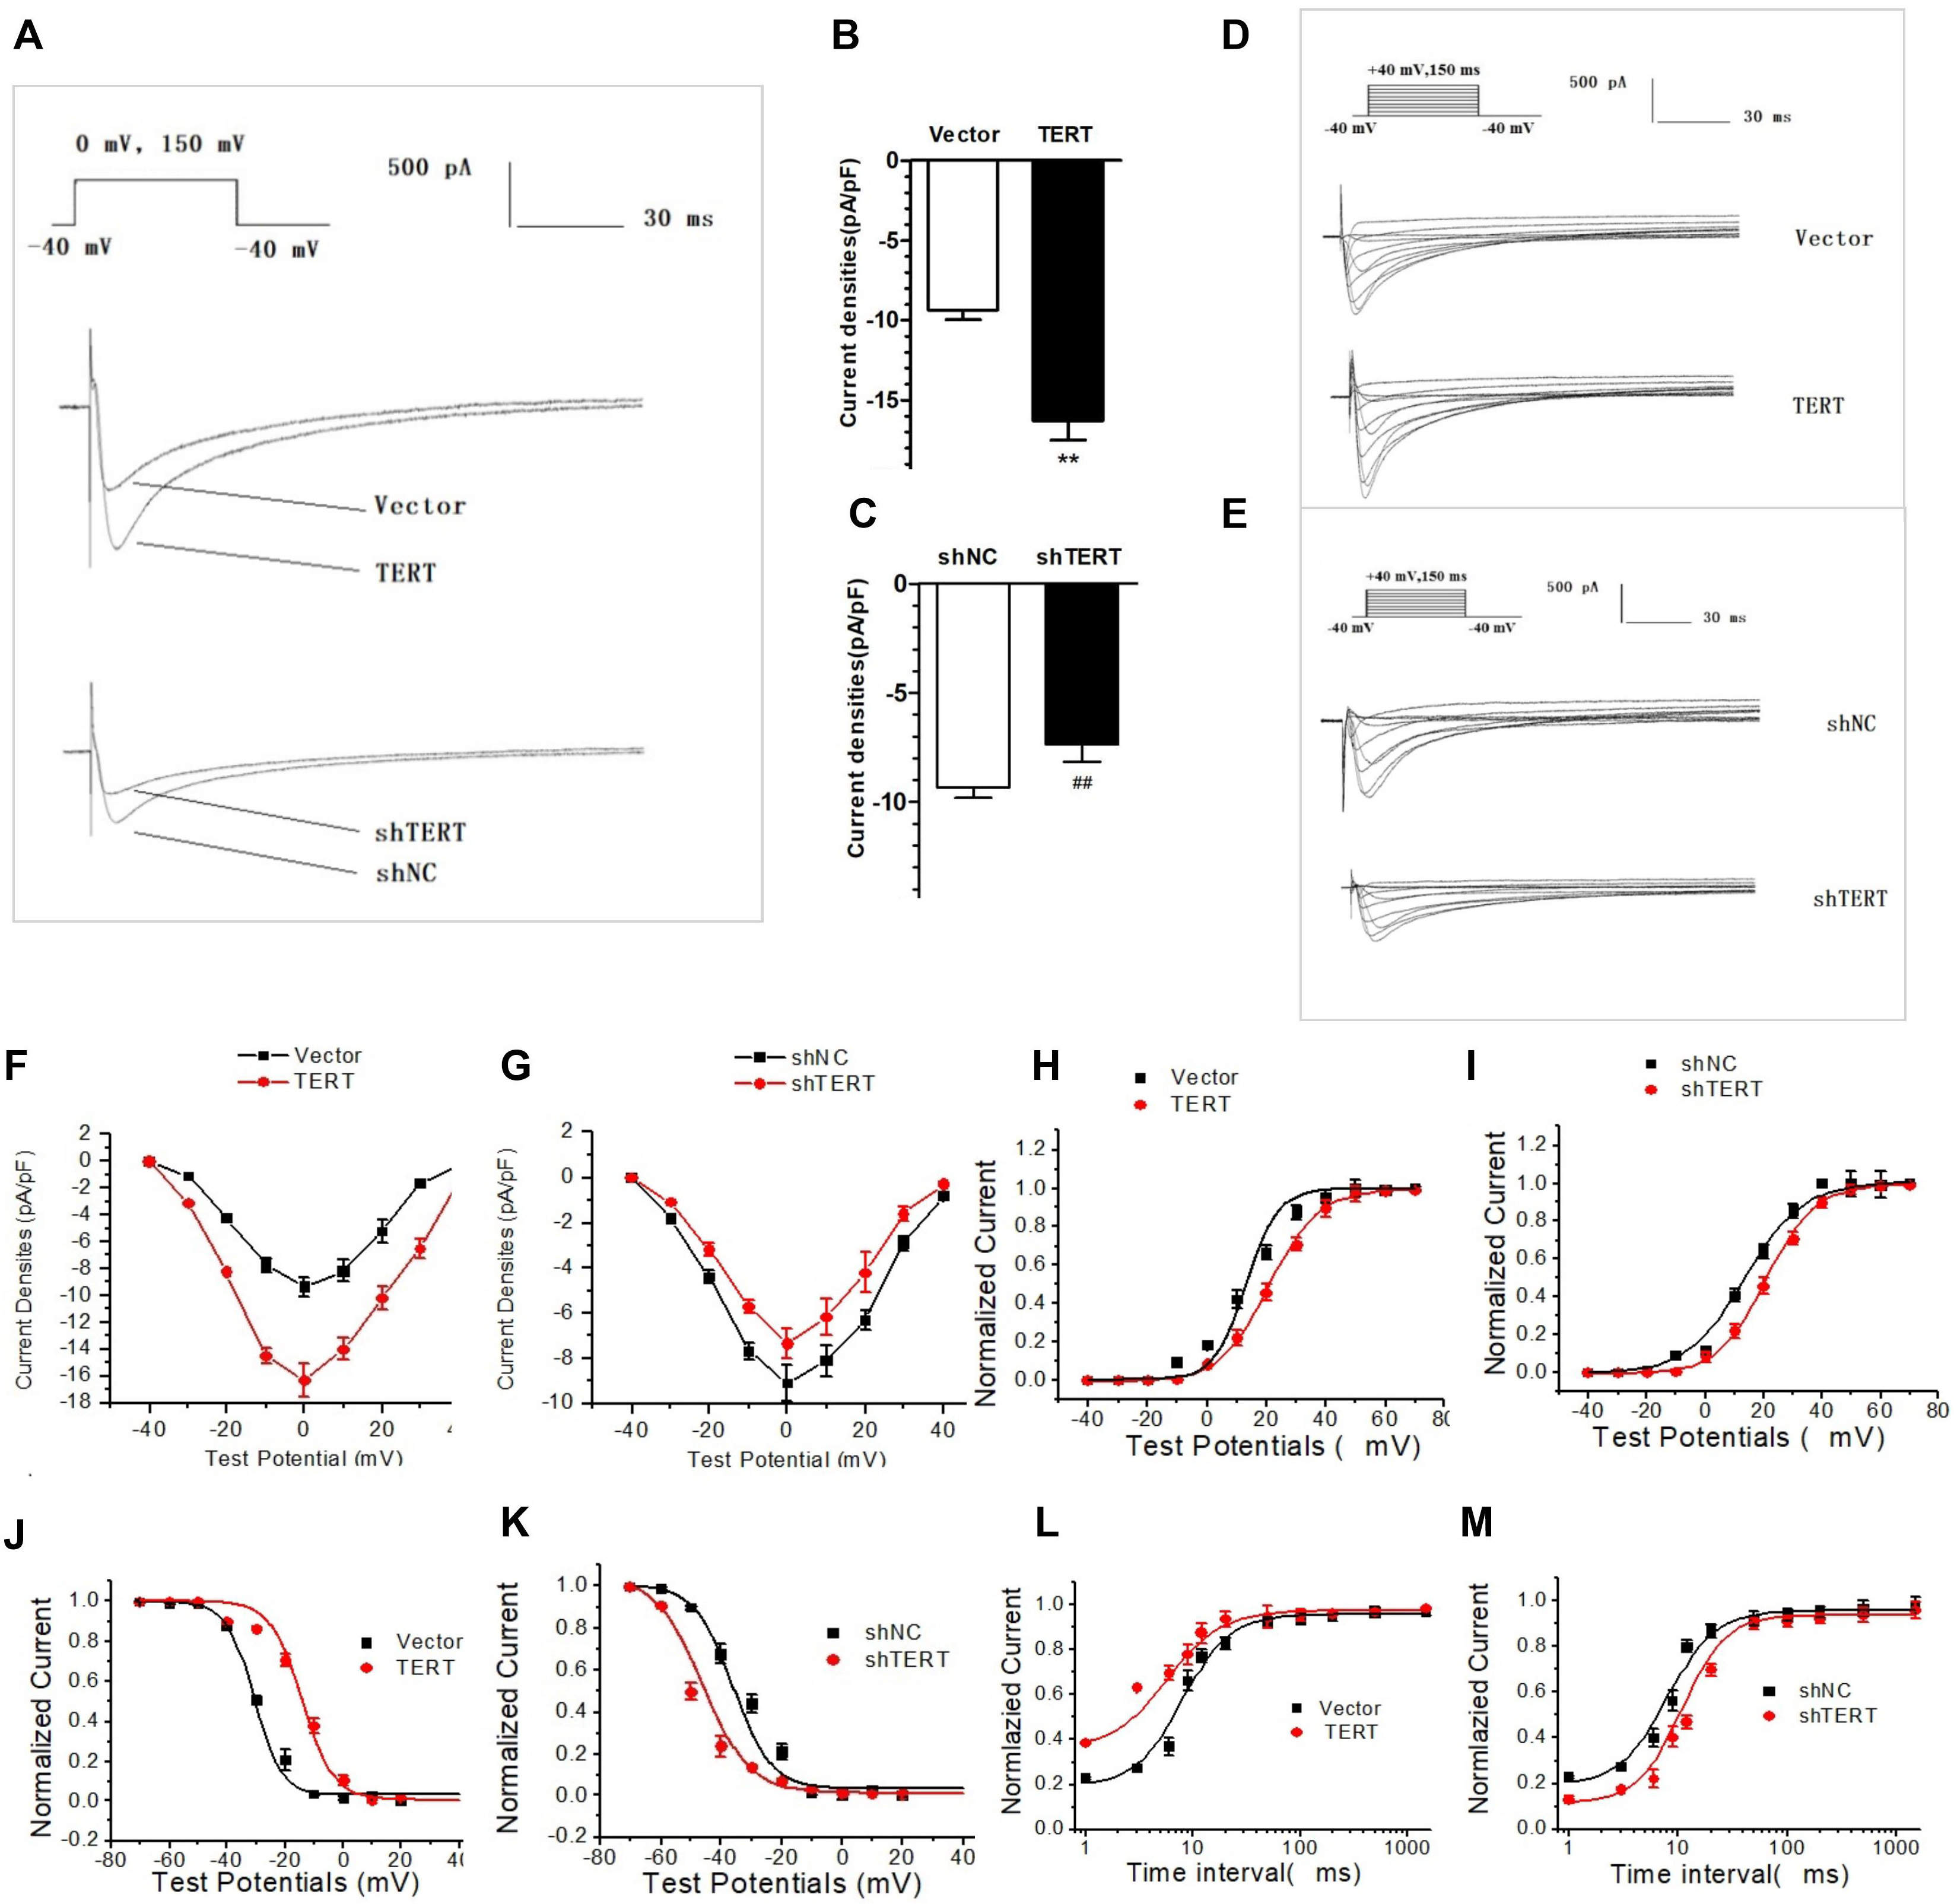 Fig. 3.
Effects of TERT on I. (A) Original recording of the
effects of TERT on the amplitude of I in HL-1 cells. (B) TERT
overexpression significantly increased the peak I density. (C) Silencing
TERT caused decreased the peak I density. (D,E) Original recording of
the voltage-dependent effect of TERT overexpression (D) and TERT silencing (E) on
I. (F,G) I-V curve of TERT overexpression (F) and TERT silencing (G) in
HL-1 cells. (H,I) The steady-state activation curve of I in TERT
overexpression (H) and TERT silencing (I) group. (J,K) The steady-state
inactivation curve of I in TERT overexpression (J) and TERT silencing
(K) groups. (L,M) I recovery curve after inactivation in TERT
overexpression (L) and TERT silencing (M) groups. **p 0.01
vs. Vector group; p 0.01 vs. shNC group.
TERT, telomerase reverse transcriptase; I-V curve, current density–voltage
curve.
I was elicited by continuous stimulation, and the changes in I
at each stimulation voltage were observed at the same time (Fig. 3D,E). The I-V
curve was obtained by plotting the current density and stimulation voltage, which
showed a typical “inverted bell” Ca current characteristic (Fig. 3F,G),
indicating that the role of TERT on I is voltage-dependent.
The steady-state activation curve of I showed that the half-activation
voltage shifted to the right in the TERT-silenced group (Fig. 3I), while the
slope of the curve increased in the TERT overexpression group (Fig. 3H), but
neither was statistically significant (p 0.05). These findings
indicated a limited effect of TERT on the steady-state activation of I.
Compared with the control group, the steady-state inactivation curve of
I in TERT-silenced cells shifted to the left, which means that it moved
to the hyperpolarization direction, indicating that channel steady-state
inactivation increased near the resting potential (RP) (Fig. 3K). However, when overexpressing TERT,
the above curve changed to the opposite direction. The steady-state inactivation
curve of I in the TERT overexpression group shifted to the right from
the control group (Fig. 3J), suggesting that the steady-state inactivation of
Ca channels was slowed; that is, the channel inactivation process was
weakened at the same stimulation pulse, which may be the reason for the increase
in current density. These results indicate that TERT may mediate current changes
by altering channel inactivation.
Regarding the effects of TERT on the kinetics of recovery after I
inactivation, we found that when the TERT gene was silenced, the
recovery curve after channel inactivation shifted to the right and the recovery
time was prolonged, indicating that TERT changed the current density by affecting
the recovery kinetics of Ca channels (Fig. 3M). However, the process of
recovery after Ca current inactivation was accelerated in the TERT
overexpression group, suggesting that it may have been another factor for the
current increase (Fig. 3L).
CaV1.2 is linked to Ca inward flow. The expression of CaV1.2 in
TERT-silenced cells was significantly decreased, while TERT overexpression led to
CaV1.2 upregulation (Fig. 4E–H).
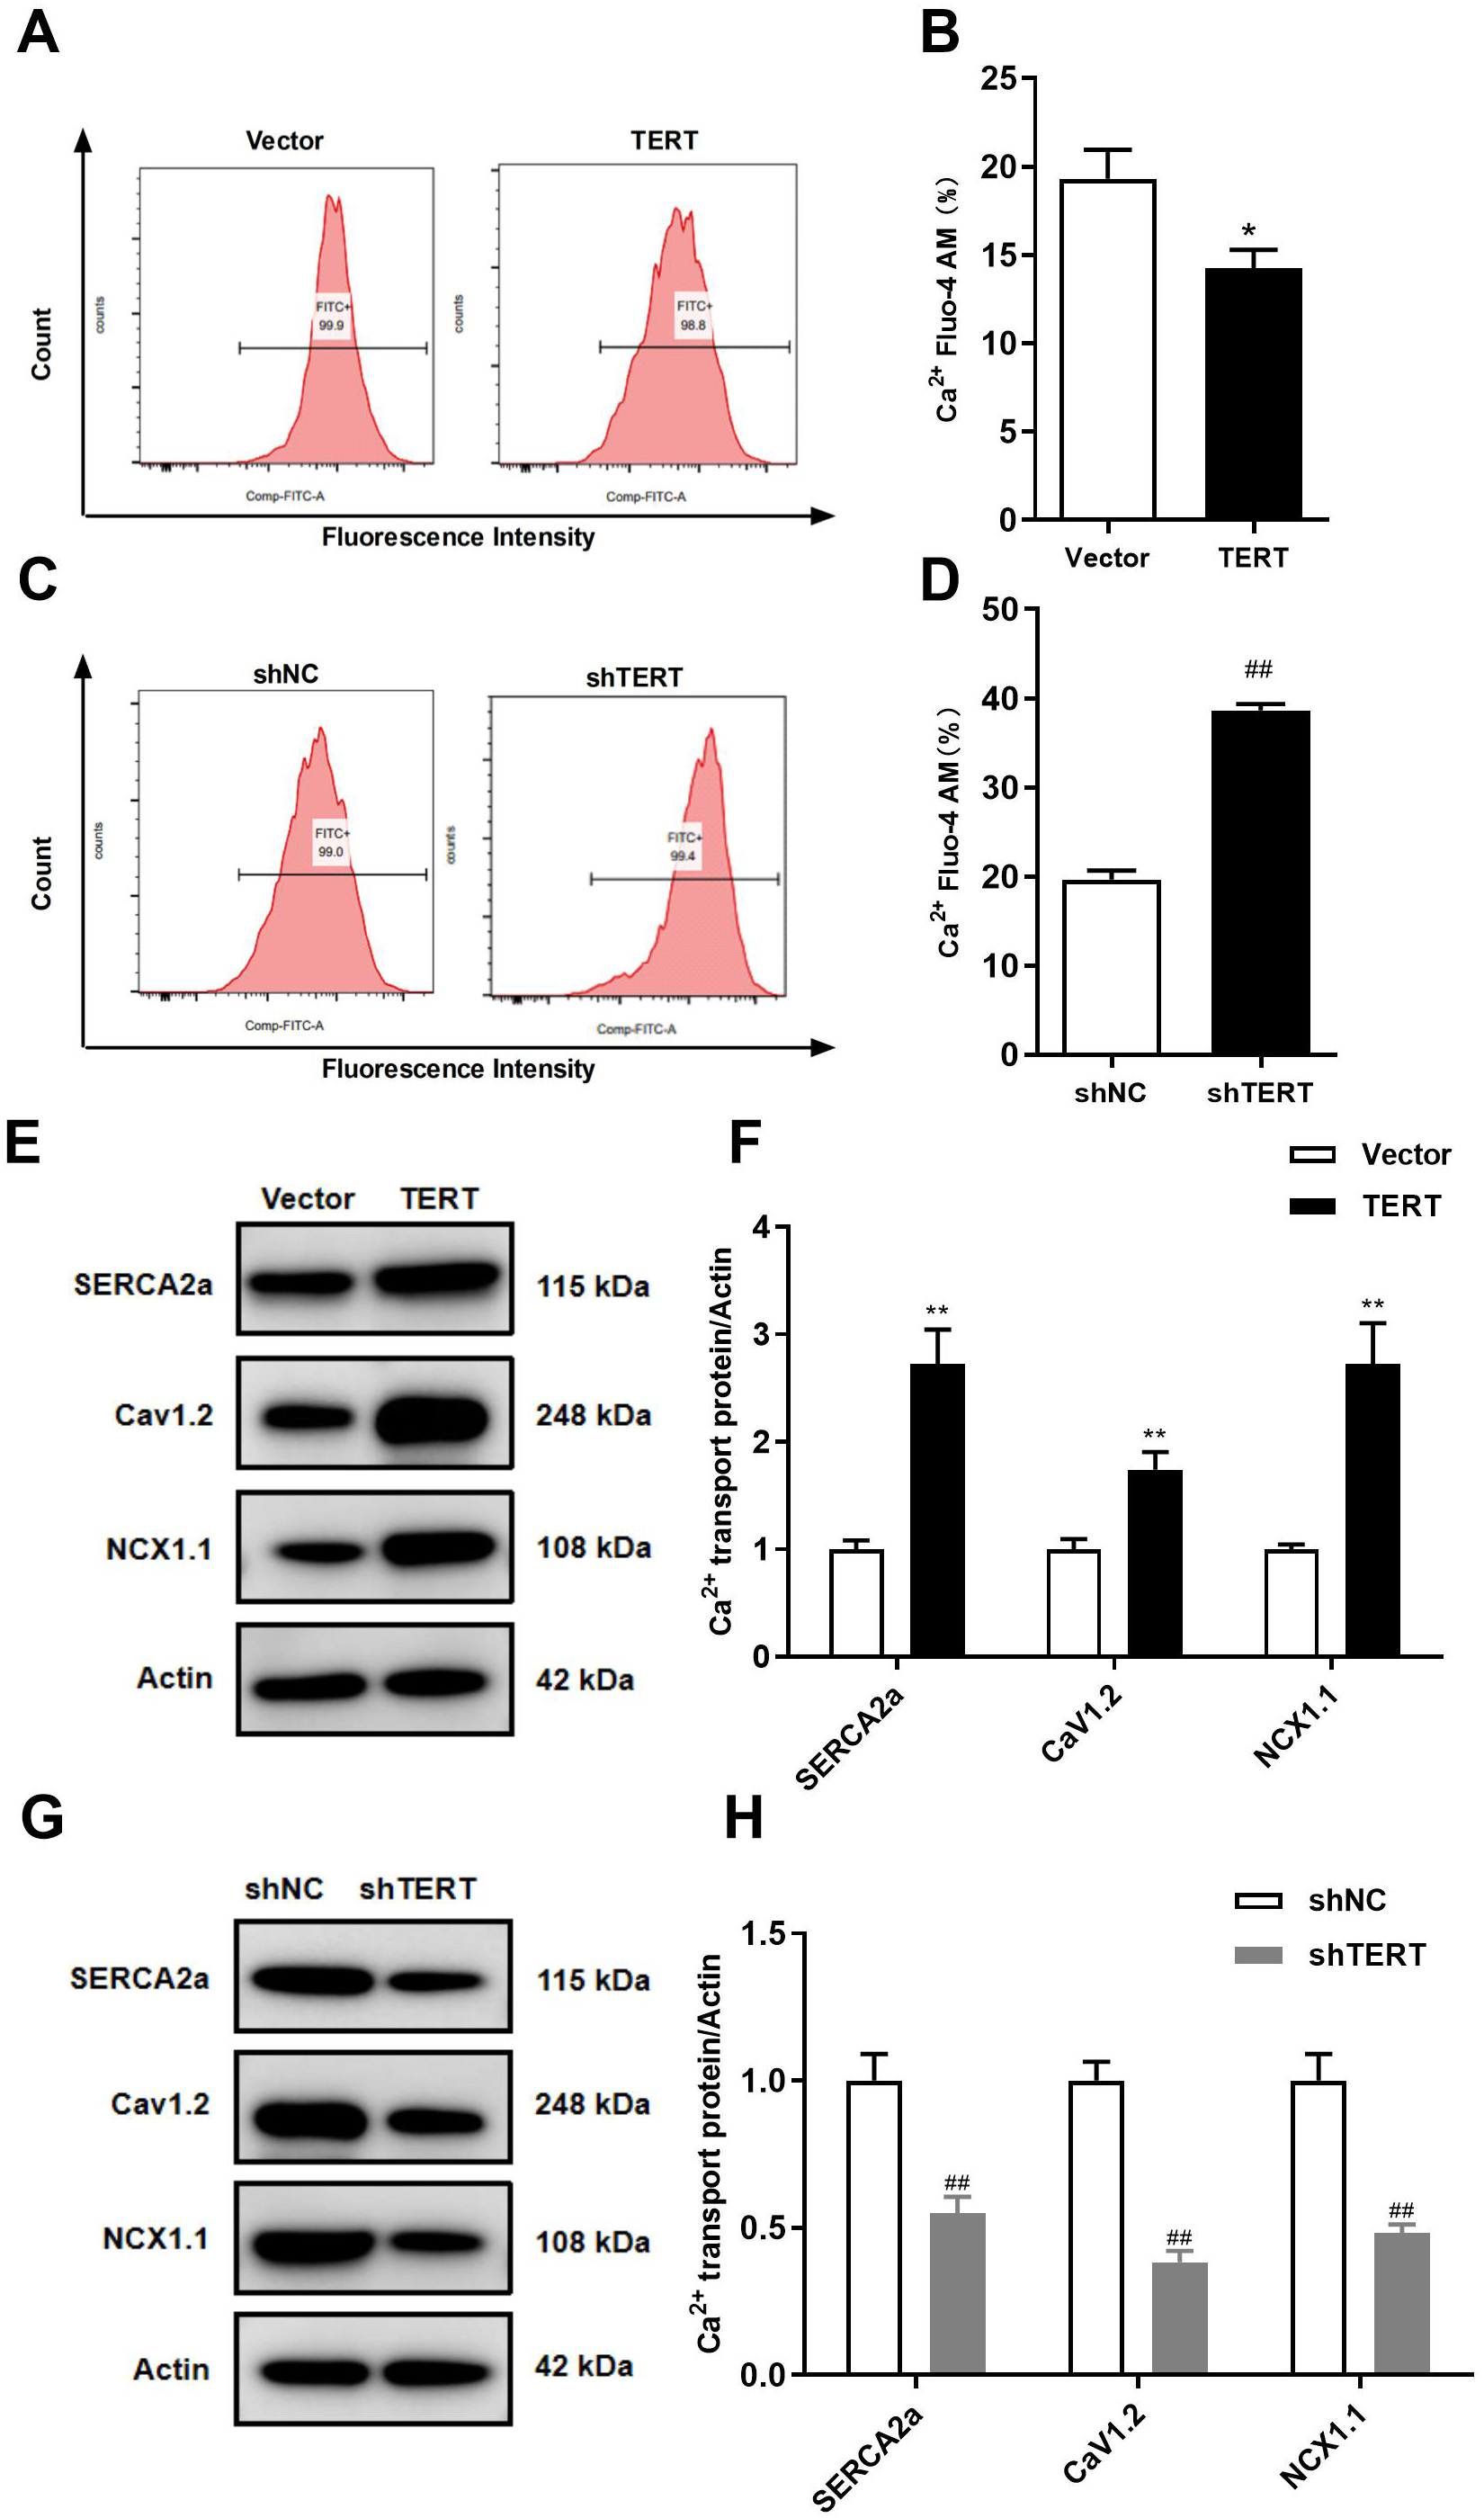 Fig. 4.
Effects of TERT on intracellular Ca and Ca transporters. (A) Representative images of Ca concentration in
TERT overexpression HL-1 cells. (B) Intracellular Ca concentration
quantified by mean fluorescence intensity in TERT overexpression HL-1 cells. (C)
Representative images of Ca concentration in TERT-silenced HL-1 cells. (D)
Intracellular Ca concentration quantified by mean fluorescence intensity
in TERT-silenced HL-1 cells. (E,F) WB analyses of the Ca transporter in
TERT overexpression HL-1 cells. (G,H) WB analyses of the Ca transporter in
TERT-silenced HL-1 cells. *p 0.05, **p 0.01
vs. Vector group; p 0.01 vs. shNC group.
TERT, telomerase reverse transcriptase.
3.3 TERT Regulate Intracellular Ca
Ca is the most important second messenger in cardiomyocytes, and
abnormally increased intracellular Ca can lead to electrical remodeling,
APD shortening, and a decrease in I. As depicted in Fig. 4C,D, TERT
silencing led to intracellular Ca overload (n = 5, p 0.01).
However, TERT overexpression significantly reduced the intracellular Ca
concentration compared to the control (Fig. 4A,B).
The maintenance of intracellular Ca homeostasis is co-regulated by the
sarcoplasmic reticulum (SR) Ca transporter, cell membrane Ca
transporter, and mitochondrial Ca transporter [29]. The concentration of
extracellular Ca is much higher than that of intracellular Ca. When
cells are stimulated, extracellular Ca flows into the cell through the
CaV1.2 Ca channel on the cell membrane, activating the cardiac ryanodine
receptor, RyR2, to release Ca and eventually leading to the contraction of
cardiomyocytes. Subsequently, the vast majority of intracellular free Ca
is recovered by SERCA2a in the SR, and the remaining Ca is transported
extracellularly by NCX1.1. Mitochondria act as intracellular Ca pools
providing a buffering effect on intracellular Ca, and proteins such as
mitochondrial calcium uniporter, mitochondrial calcium uptake 1, and
voltage-dependent anion-selective channel 1 are involved in mitochondrial
Ca uptake [29, 30].
WB analysis revealed that silencing TERT significantly downregulated the
expression of SERCA2a (Fig. 4G), and TERT overexpression upregulated the
expression of SERCA2a (Fig. 4E). The primary role of NCX1.1 in the heart is to
extrude Ca from the cell, countering the Ca that enters the
cytoplasm during systole through CaV1.2 [31]. In this study, we found that
silencing the TERT gene significantly downregulated the expression of
NCX1.1, while TERT overexpression had the opposite effect (Fig. 4E–H). The above
results suggest that telomere shortening decreases Ca uptake and reduces
Ca efflux, ultimately leading to intracellular Ca accumulation.
3.4 TERT Regulates Mitochondrial Function
In this study, flow cytometry was used to detect intracellular ROS. As indicated
in Fig. 5C,D, compared with the shNC group, silencing of TERT in HL-1 cells
caused a significant increase in ROS (n = 5, p 0.01). Conversely,
ROS levels in TERT overexpression HL-1 cells was significantly lower compared
with control cells (Fig. 5A,B). SOD is an important member of the intracellular
antioxidant system, and can scavenge harmful ROS to relieve the damage caused by
oxidative stress. Compared with the respective control groups, SOD activity in
the TERT overexpression group was increased, while it was significantly decreased
in TERT-silenced cells (Fig. 5I,J). These findings demonstrate that TERT
silencing can lead to an increase in ROS content and decrease in SOD activity,
consistent with the finding that telomere shortening can lead to increased
oxidative stress in cardiomyocytes [32, 33].
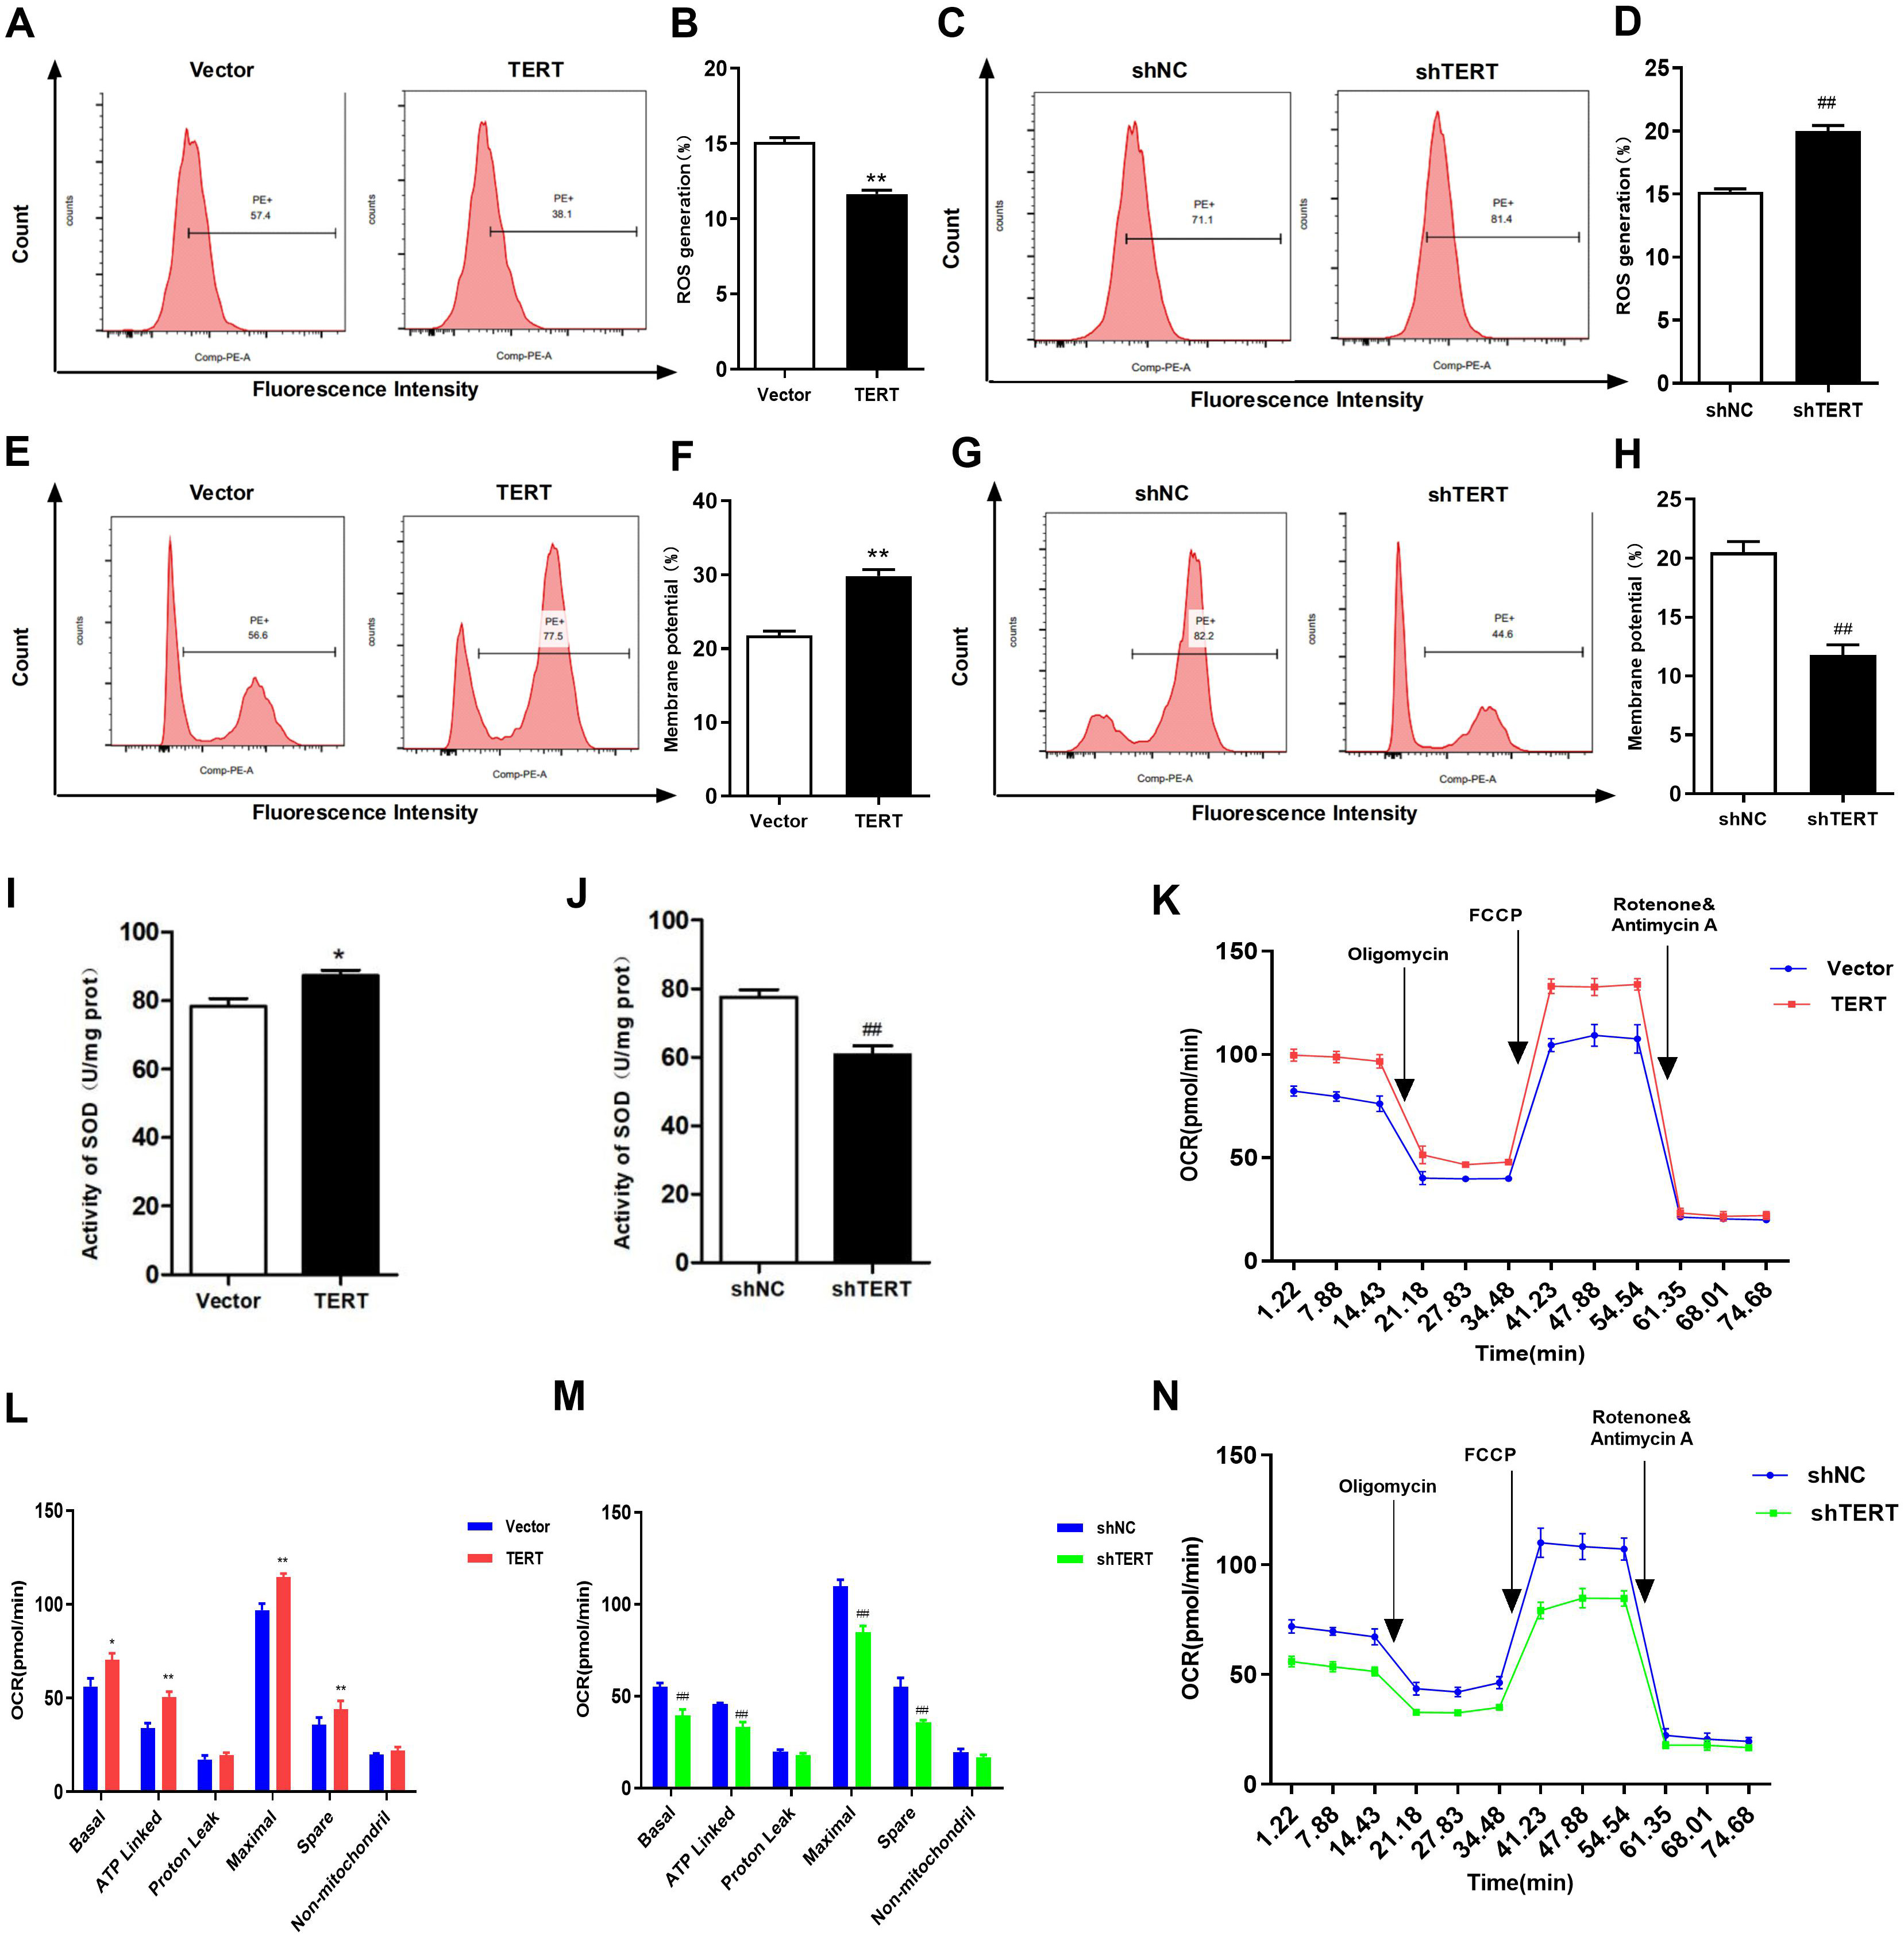 Fig. 5.
Effects of TERT on mitochondrial function. (A) Representative
images of ROS detected by flow cytometry in TERT overexpression HL-1 cells. (B)
ROS were quantified and found to be significantly lower in TERT overexpression
HL-1 cells than in the controls. (C) Representative images of ROS detected by
flow cytometry in TERT-silenced HL-1 cells. (D) ROS were quantified and found to
be significantly higher in TERT-silenced HL-1 cells than in the controls. (E)
Representative images of MMP in the TERT overexpression group. (F) Quantification
of MMP in TERT overexpression HL-1 cells. (G) Representative images of MMP in
TERT-silenced HL-1 cells. (H) Quantification of MMP in TERT-silenced HL-1 cells.
(I) SOD activity in TERT overexpression HL-1 cells was higher than that in the
control group. (J) Silencing of TERT significantly decreased SOD activity. (K)
OCR curve of TERT overexpression HL-1 cells. (L) The OCR of TERT overexpression
HL-1 cells. (M) OCR curve of TERT-silenced HL-1 cells. (N) The OCR of
TERT-silenced HL-1 cells. *p 0.05, **p 0.01 vs.
Vector group; p 0.01 vs. the shNC group. TERT,
telomerase reverse transcriptase; ROS, reactive oxygen species; MMP,
mitochondrial membrane potential; SOD, superoxide dismutase; OCR, oxygen
consumption rate; ATP, adenosine triphosphate; FCCP, Carbonyl cyanide 4-(trifluoromethoxy)phenylhydrazone.
The MMP is a crucial indicator of mitochondrial function. A decrease in MMP is
often observed in the early stages of apoptosis. As shown in Fig. 5G,H, silencing
of TERT caused a significant decrease in MMP (n = 5, p 0.01);
however, in TERT overexpression HL-1 cells, the MMP was higher than that in the
control cells (Fig. 5E,F). In this study, TERT silencing resulted in a decrease
in OCR in HL-1 cells, with a significant decrease in basal OCR, ATP-linked OCR,
maximal OCR, and reserve OCR (Fig. 5M,N). Conversely, the OCR of TERT
overexpression HL-1 cells was higher than that of the control, and the basal OCR,
ATP-linked OCR, maximal OCR, and reserve OCR were significantlyincreased
(p 0.01). Besides, proton leak OCR and non-mitochondrial OCR were
also increased, with no statistical difference compared with the control group
(Fig. 5K,L). In summary, TERT silencing led to impaired mitochondrial function,
increased ROS production, and decreased OCR, MMP, and SOD activity.
3.5 TERT Regulates the p53/PGC-1 Pathway
Telomere shortening leads to intracellular Ca overload and dysfunction of
mitochondria via the p53/PGC-1 pathway [7, 8, 18, 19]. To validate this
pathway, we intervened the molecules on upstream of the regulatory axis. It is
noteworthy that the expression of p53 was upregulated and the level of
PGC-1 was downregulated in TERT-silenced cells (Fig. 6B,E). Conversely,
TERT overexpression decreased p53 expression and increased PGC-1
expression in HL-1 cells (Fig. 6A,D). Subsequently, we treated HL-1 cells with
the p53 agonist Tenovin-6 and inhibitor PFT. The results showed that
treatment with PFT upregulated the expression of PGC-1, while
Tenovin-6 downregulated expression (Fig. 6C,F). These results suggest that TERT
regulates the p53/PGC-1 pathway in atrial myocytes.
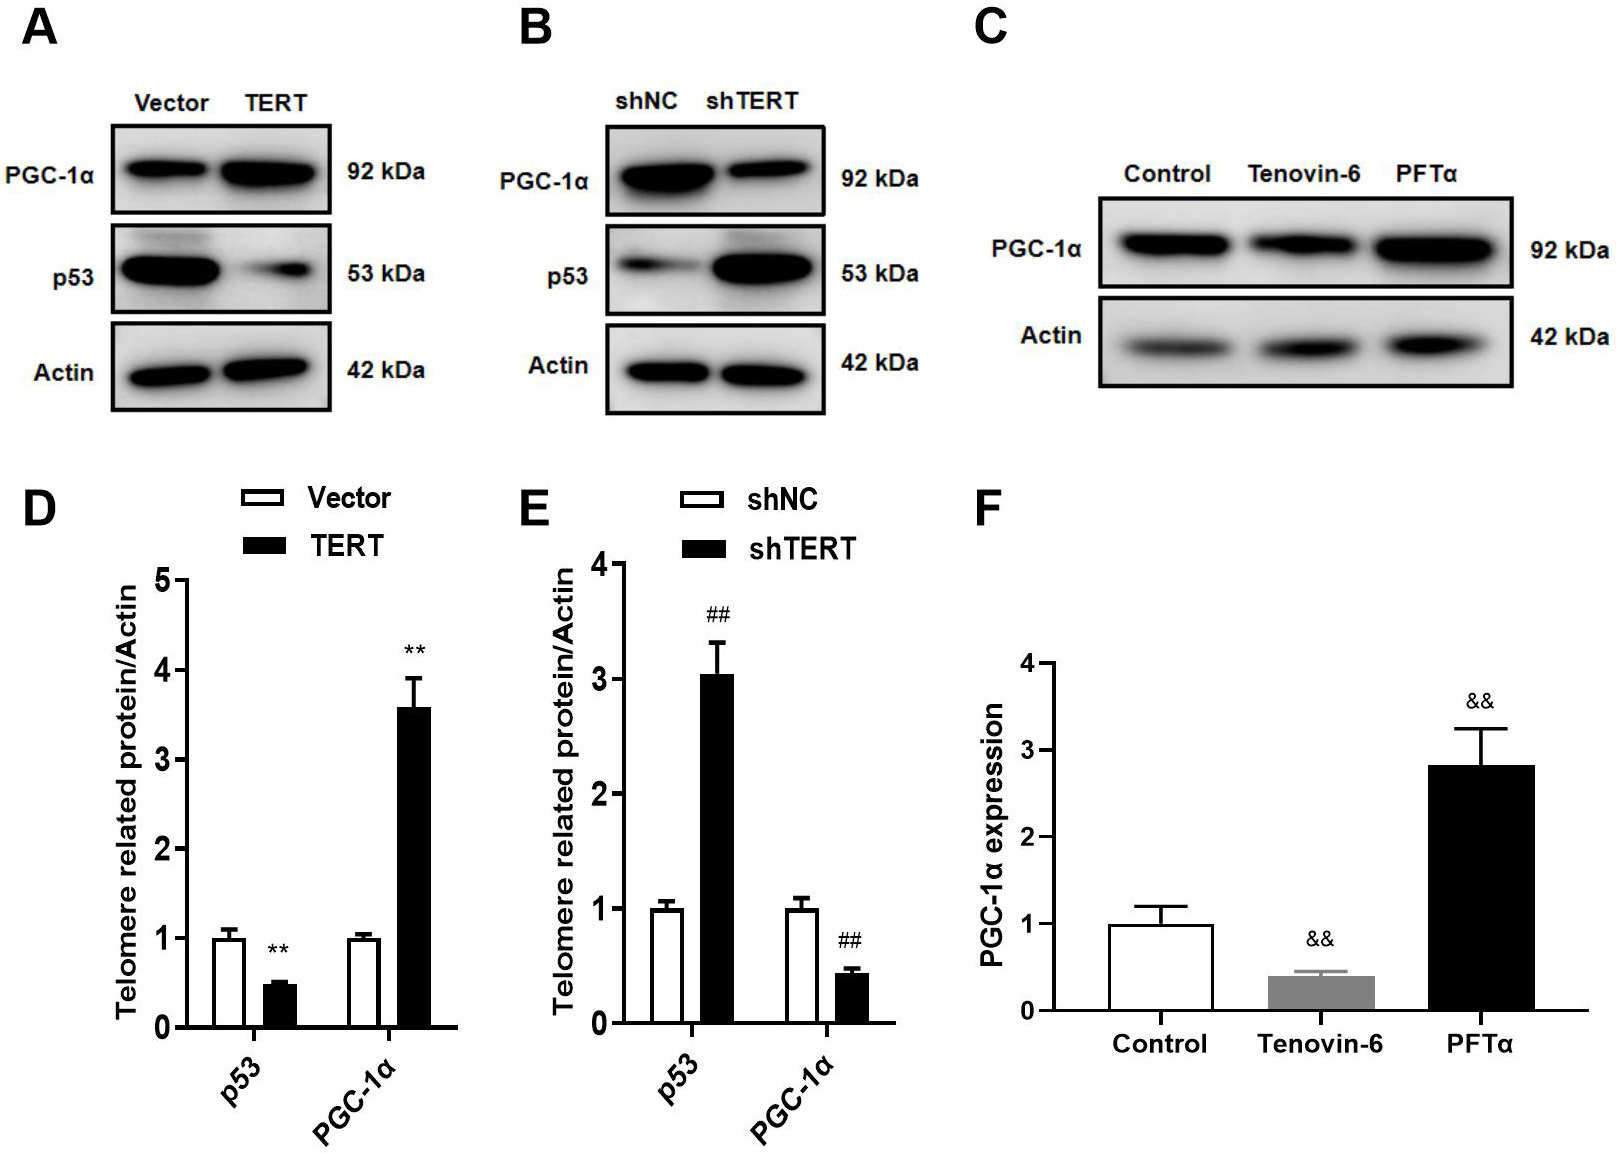 Fig. 6.
TERT regulates the p53/PGC-1 pathway. (A,D) WB in
TERT-overexpressed cells. (B,E) WB in TERT-silenced cells. (C,F) WB after
treatment with the p53 agonist Tenovin-6 and inhibitor PFT. **p 0.01 vs. Vector group; p 0.01 vs.
shNC group; p 0.01 vs. Control group. TERT,
telomerase reverse transcriptase; PGC-1, peroxisome
proliferator-activated receptor gamma coactivator 1-alpha.
3.6 PGC-1 Regulates Intracellular Ca and Induces
Electrical Remodeling
PGC-1 is known for its role in mitochondrial biosynthesis, but its
effect on intracellular Ca has been less studied. In this study, we
treated HL-1 cells with the PGC-1 agonist ZLN005 and PGC-1
inhibitor SR-18292 to observe their effects on cellular electrophysiology,
intracellular Ca, and Ca transporters. The results showed that the
SR-18292 led to decreased I, intracellular Ca overload, increased
ROS, and decreased MMP, OCR, and SOD activity. In addition, the expression of
SERCA2a, CaV1.2, and NCX1.1 was downregulated (Figs. 7,8). However, ZLN005
treatment increased I (Fig. 7A,B) and decreased intracellular Ca
levels (Fig. 7C,D). Additionally, ZLN005 upregulated the expression of SERCA2a,
CaV1.2, and NCX1.1 (Fig. 7E,F). Furthermore, we also found that ZLN005 reduced
ROS levels and increased SOD activity, MMP, and OCR compared with the control
group (Fig. 8). These results indicate that ZLN005 has similar effects as TERT
overexpression, and coculture with SR-18292 resulted in similar effects as TERT
silencing. Therefore, PGC-1 may be a new target for the treatment of
cardiovascular diseases.
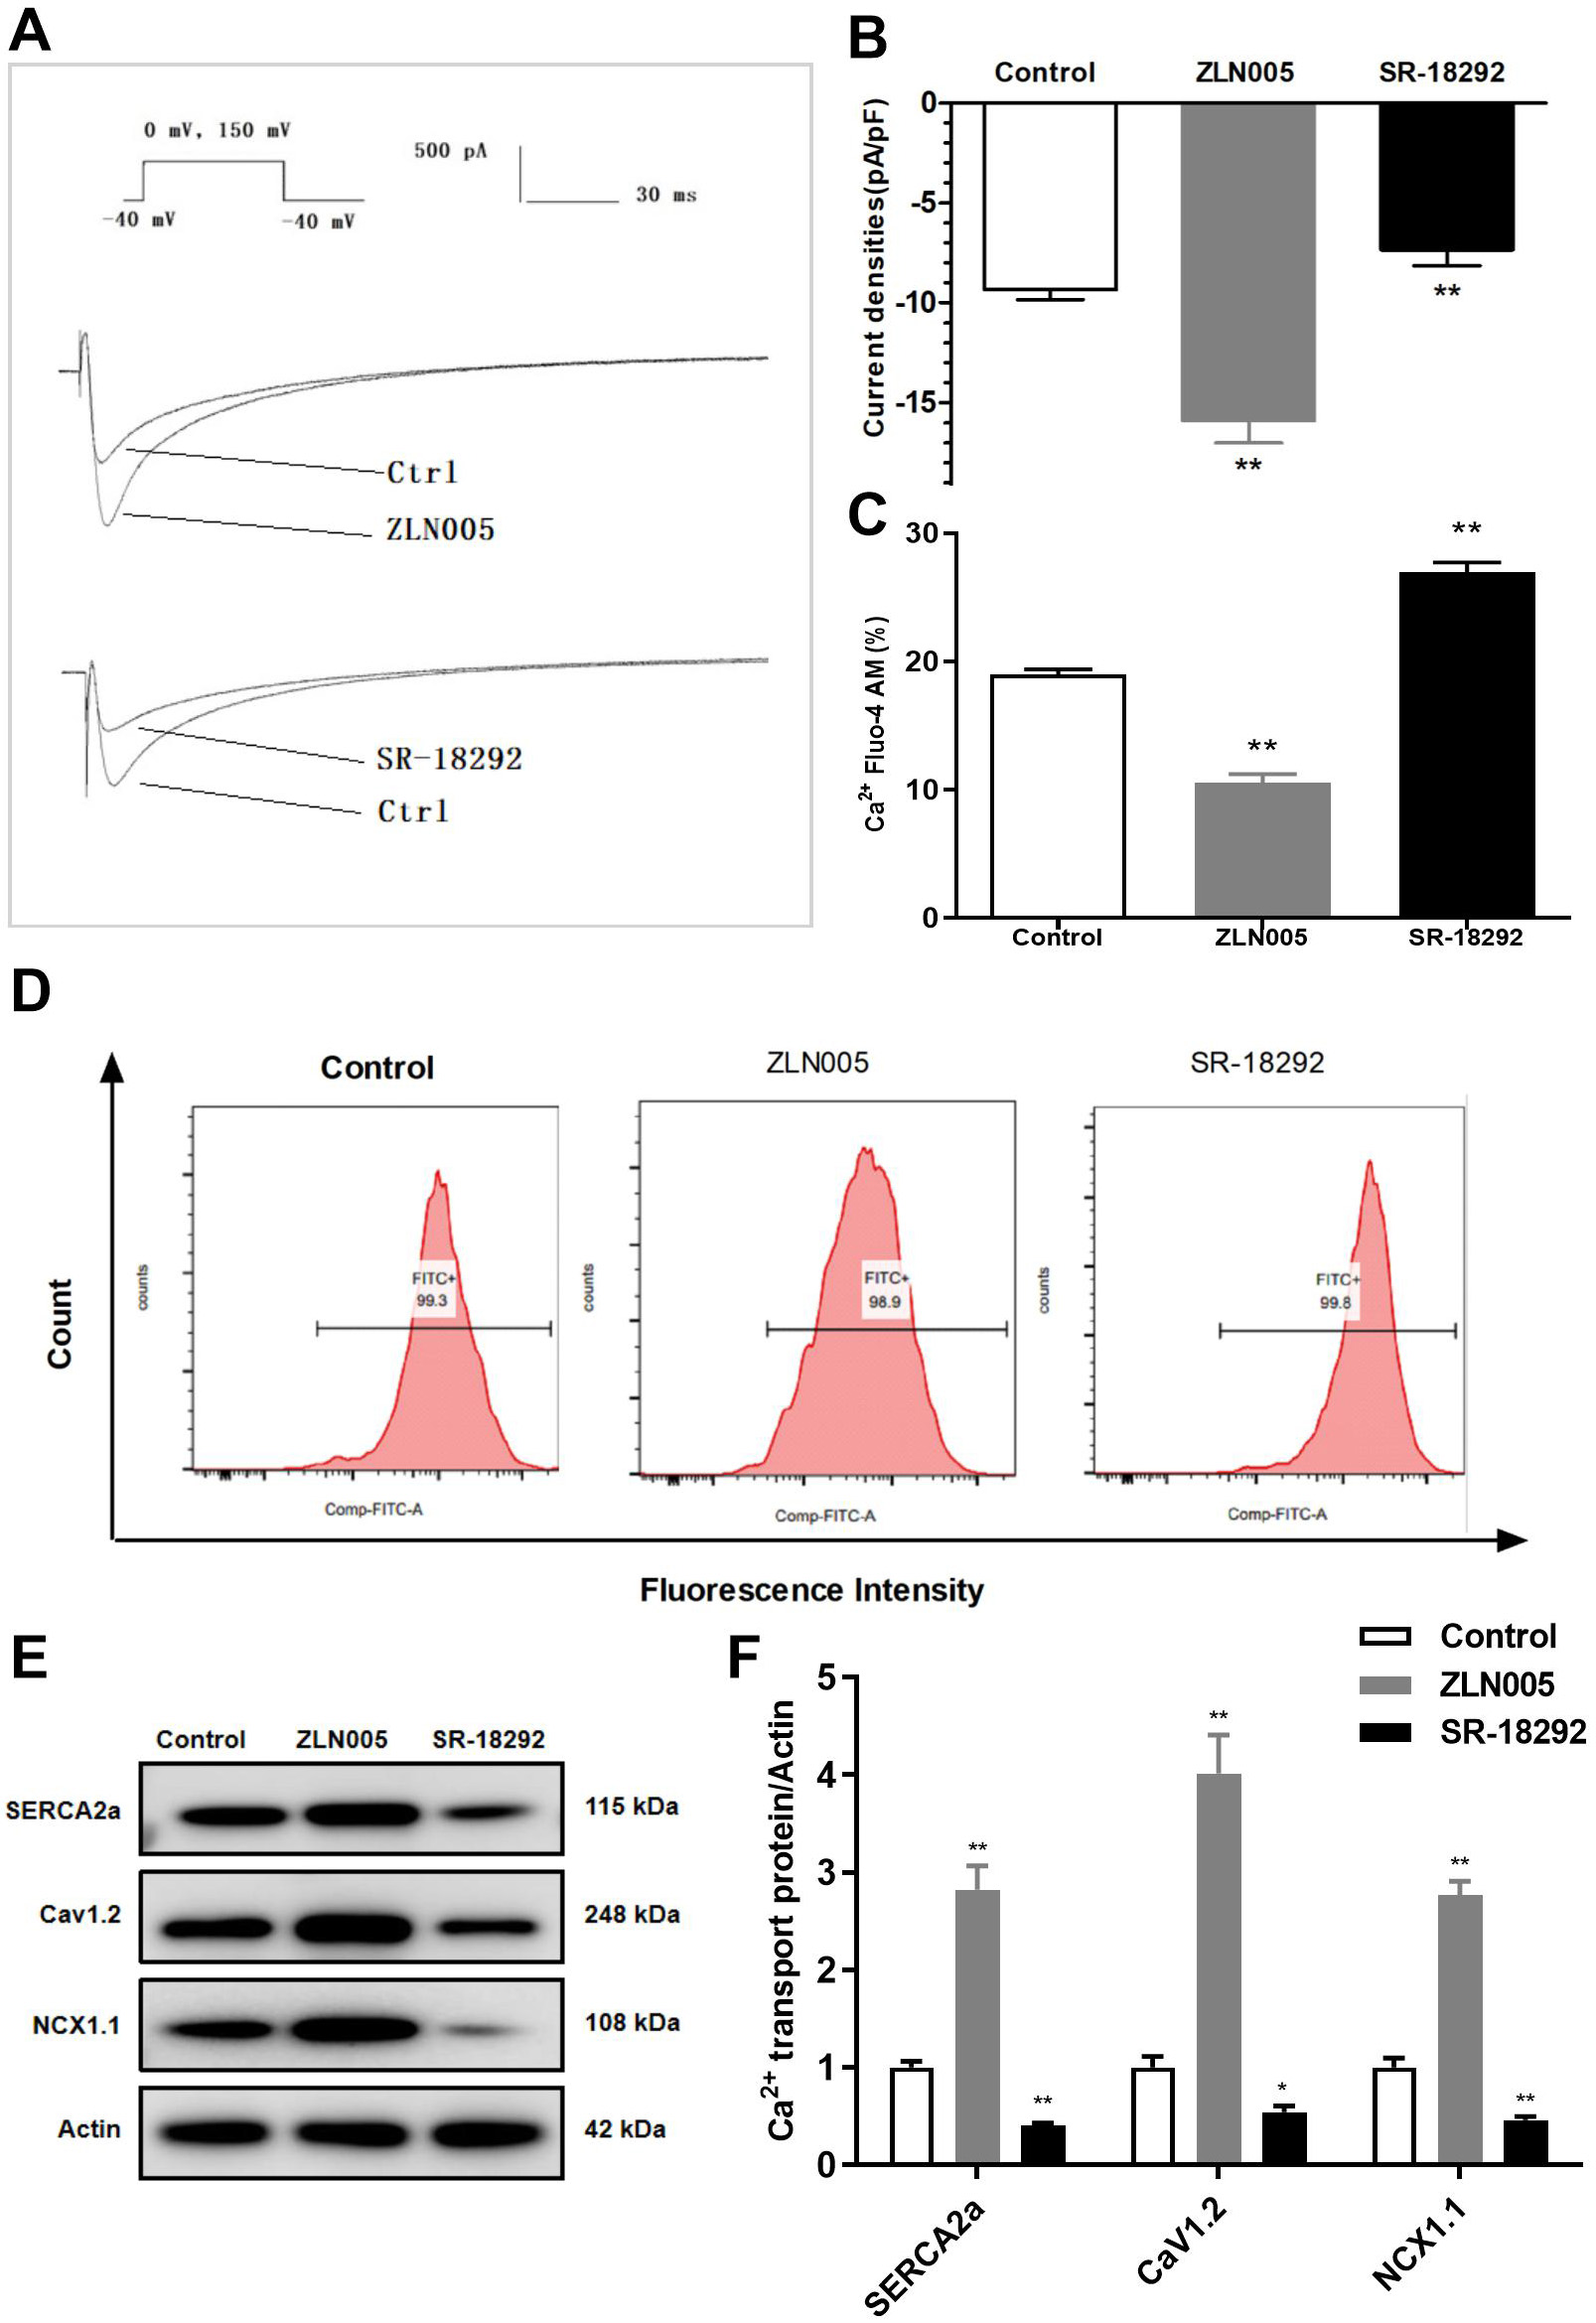 Fig. 7.
Effects of PGC-1 on I, intracellular
Ca, and Ca transporters. (A) Original record of I. (B)
Role of PGC-1 on I current density. (C) Quantification of
intracellular Ca. (D) Representative images of Ca concentration
detected by flow cytometry. (E,F) WB analyses of Ca transporters.
*p 0.05, **p 0.01 vs. Control group.
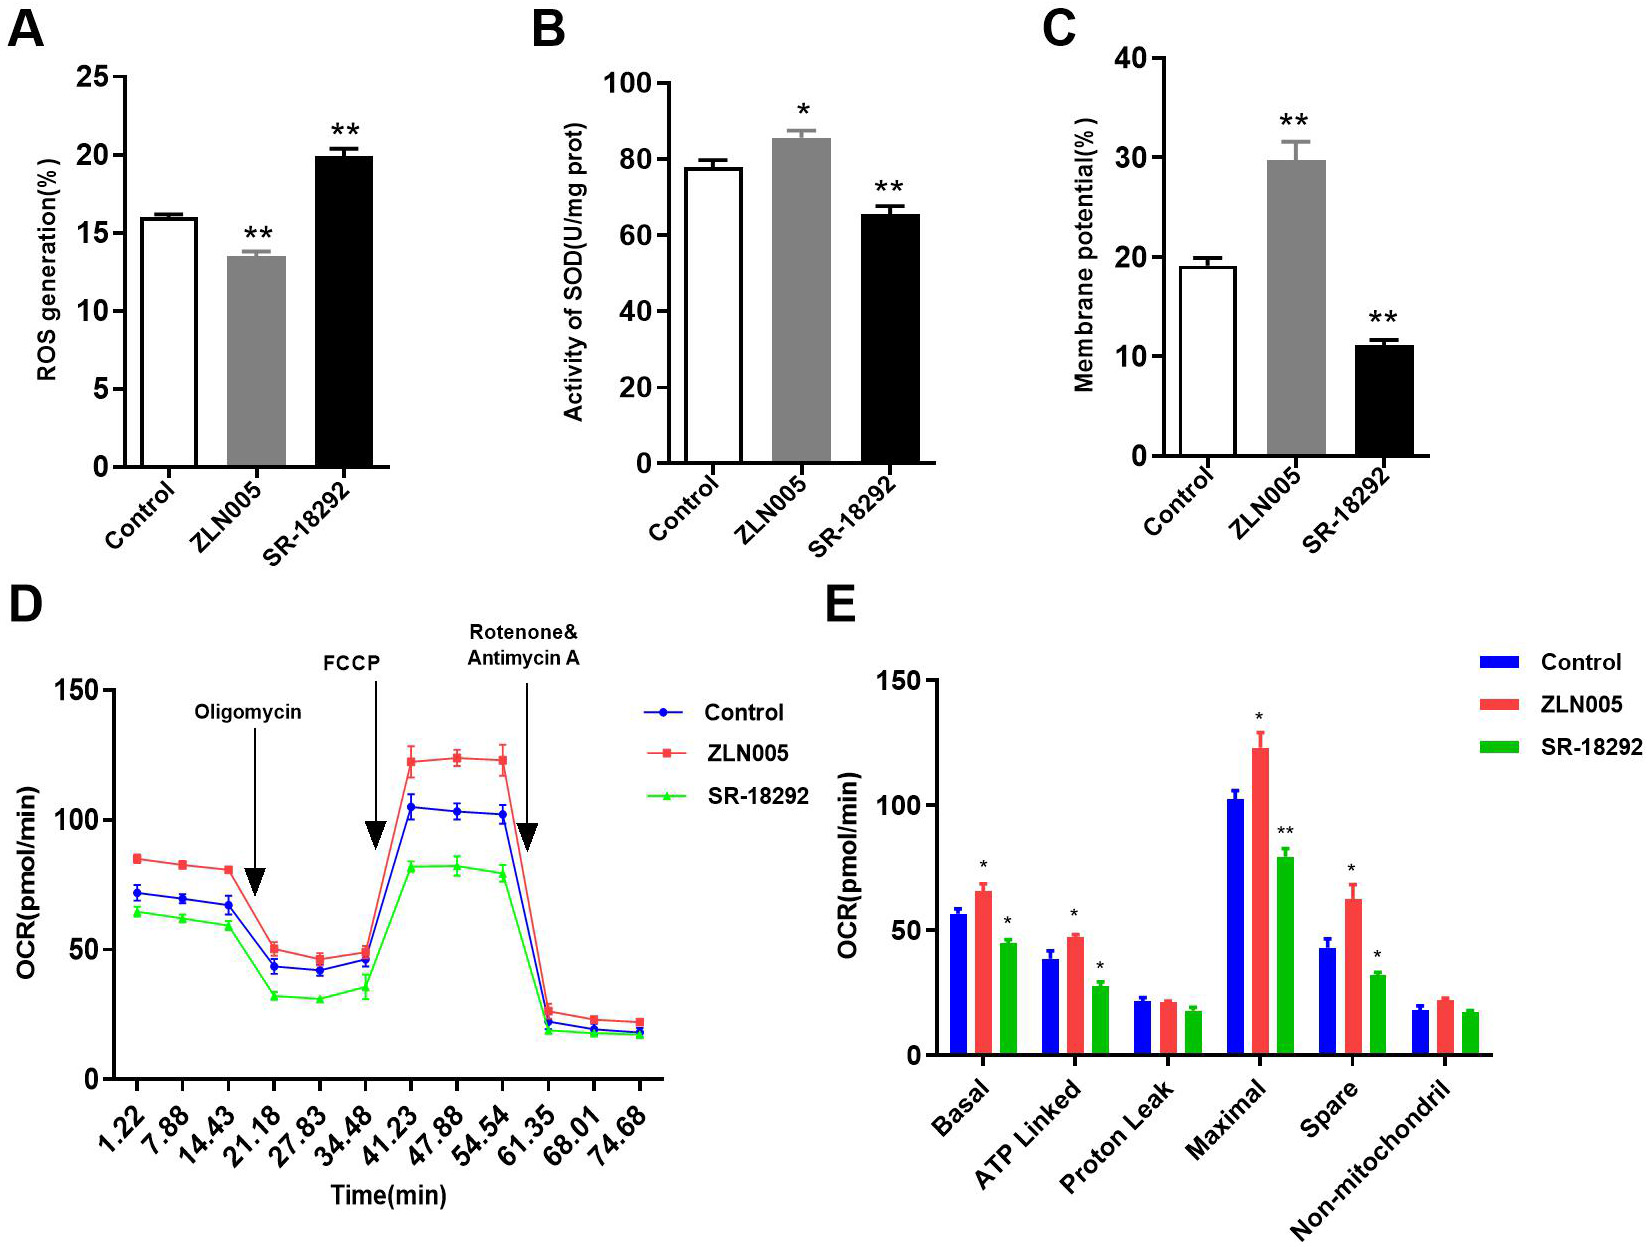 Fig. 8.
Effects of PGC-1 on mitochondrial function. (A) Role
of PGC-1 on ROS. (B) Role of PGC-1 on SOD activity. (C) Role
of PGC-1 on MMP. (D) The OCR curve of HL-1 cells treated with ZLN005
and SR-18292. (E) Effects of PGC-1 on the OCR. *p 0.05,
**p 0.01 vs. Control group. ROS, reactive oxygen species;
SOD, superoxide dismutase; MMP, mitochondrial membrane potential; OCR, oxygen
consumption rate; FCCP, carbonyl cyanide 4-(trifluoromethoxy) phenylhydrazone;
ATP, adenosine triphosphate.
4. Discussion
In this study, we demonstrated that TERT silencing led to intracellular
Ca overload, shortened APD, and decreased I, forming a critical
electrophysiological basis for arrhythmias (Fig. 9). Conversely, TERT
overexpression not only prevented the induction of arrhythmias but also appeared
to reduce the risk of arrhythmia, suggesting its safety in treating cardiac
diseases. Additionally, we established that TERT regulates intracellular
Ca homeostasis and mitochondrial function via the p53/PGC-1
pathway. Finally, we found that PGC-1 is a key downstream effector
molecule of TERT, and for the first time, we explored the role of PGC-1
in atrial myocyte electrophysiology. We found that PGC-1 has potential
as a novel target for arrhythmia intervention, such as in AF, suggesting that
intervention for AF should not be limited to abnormal cation handling.
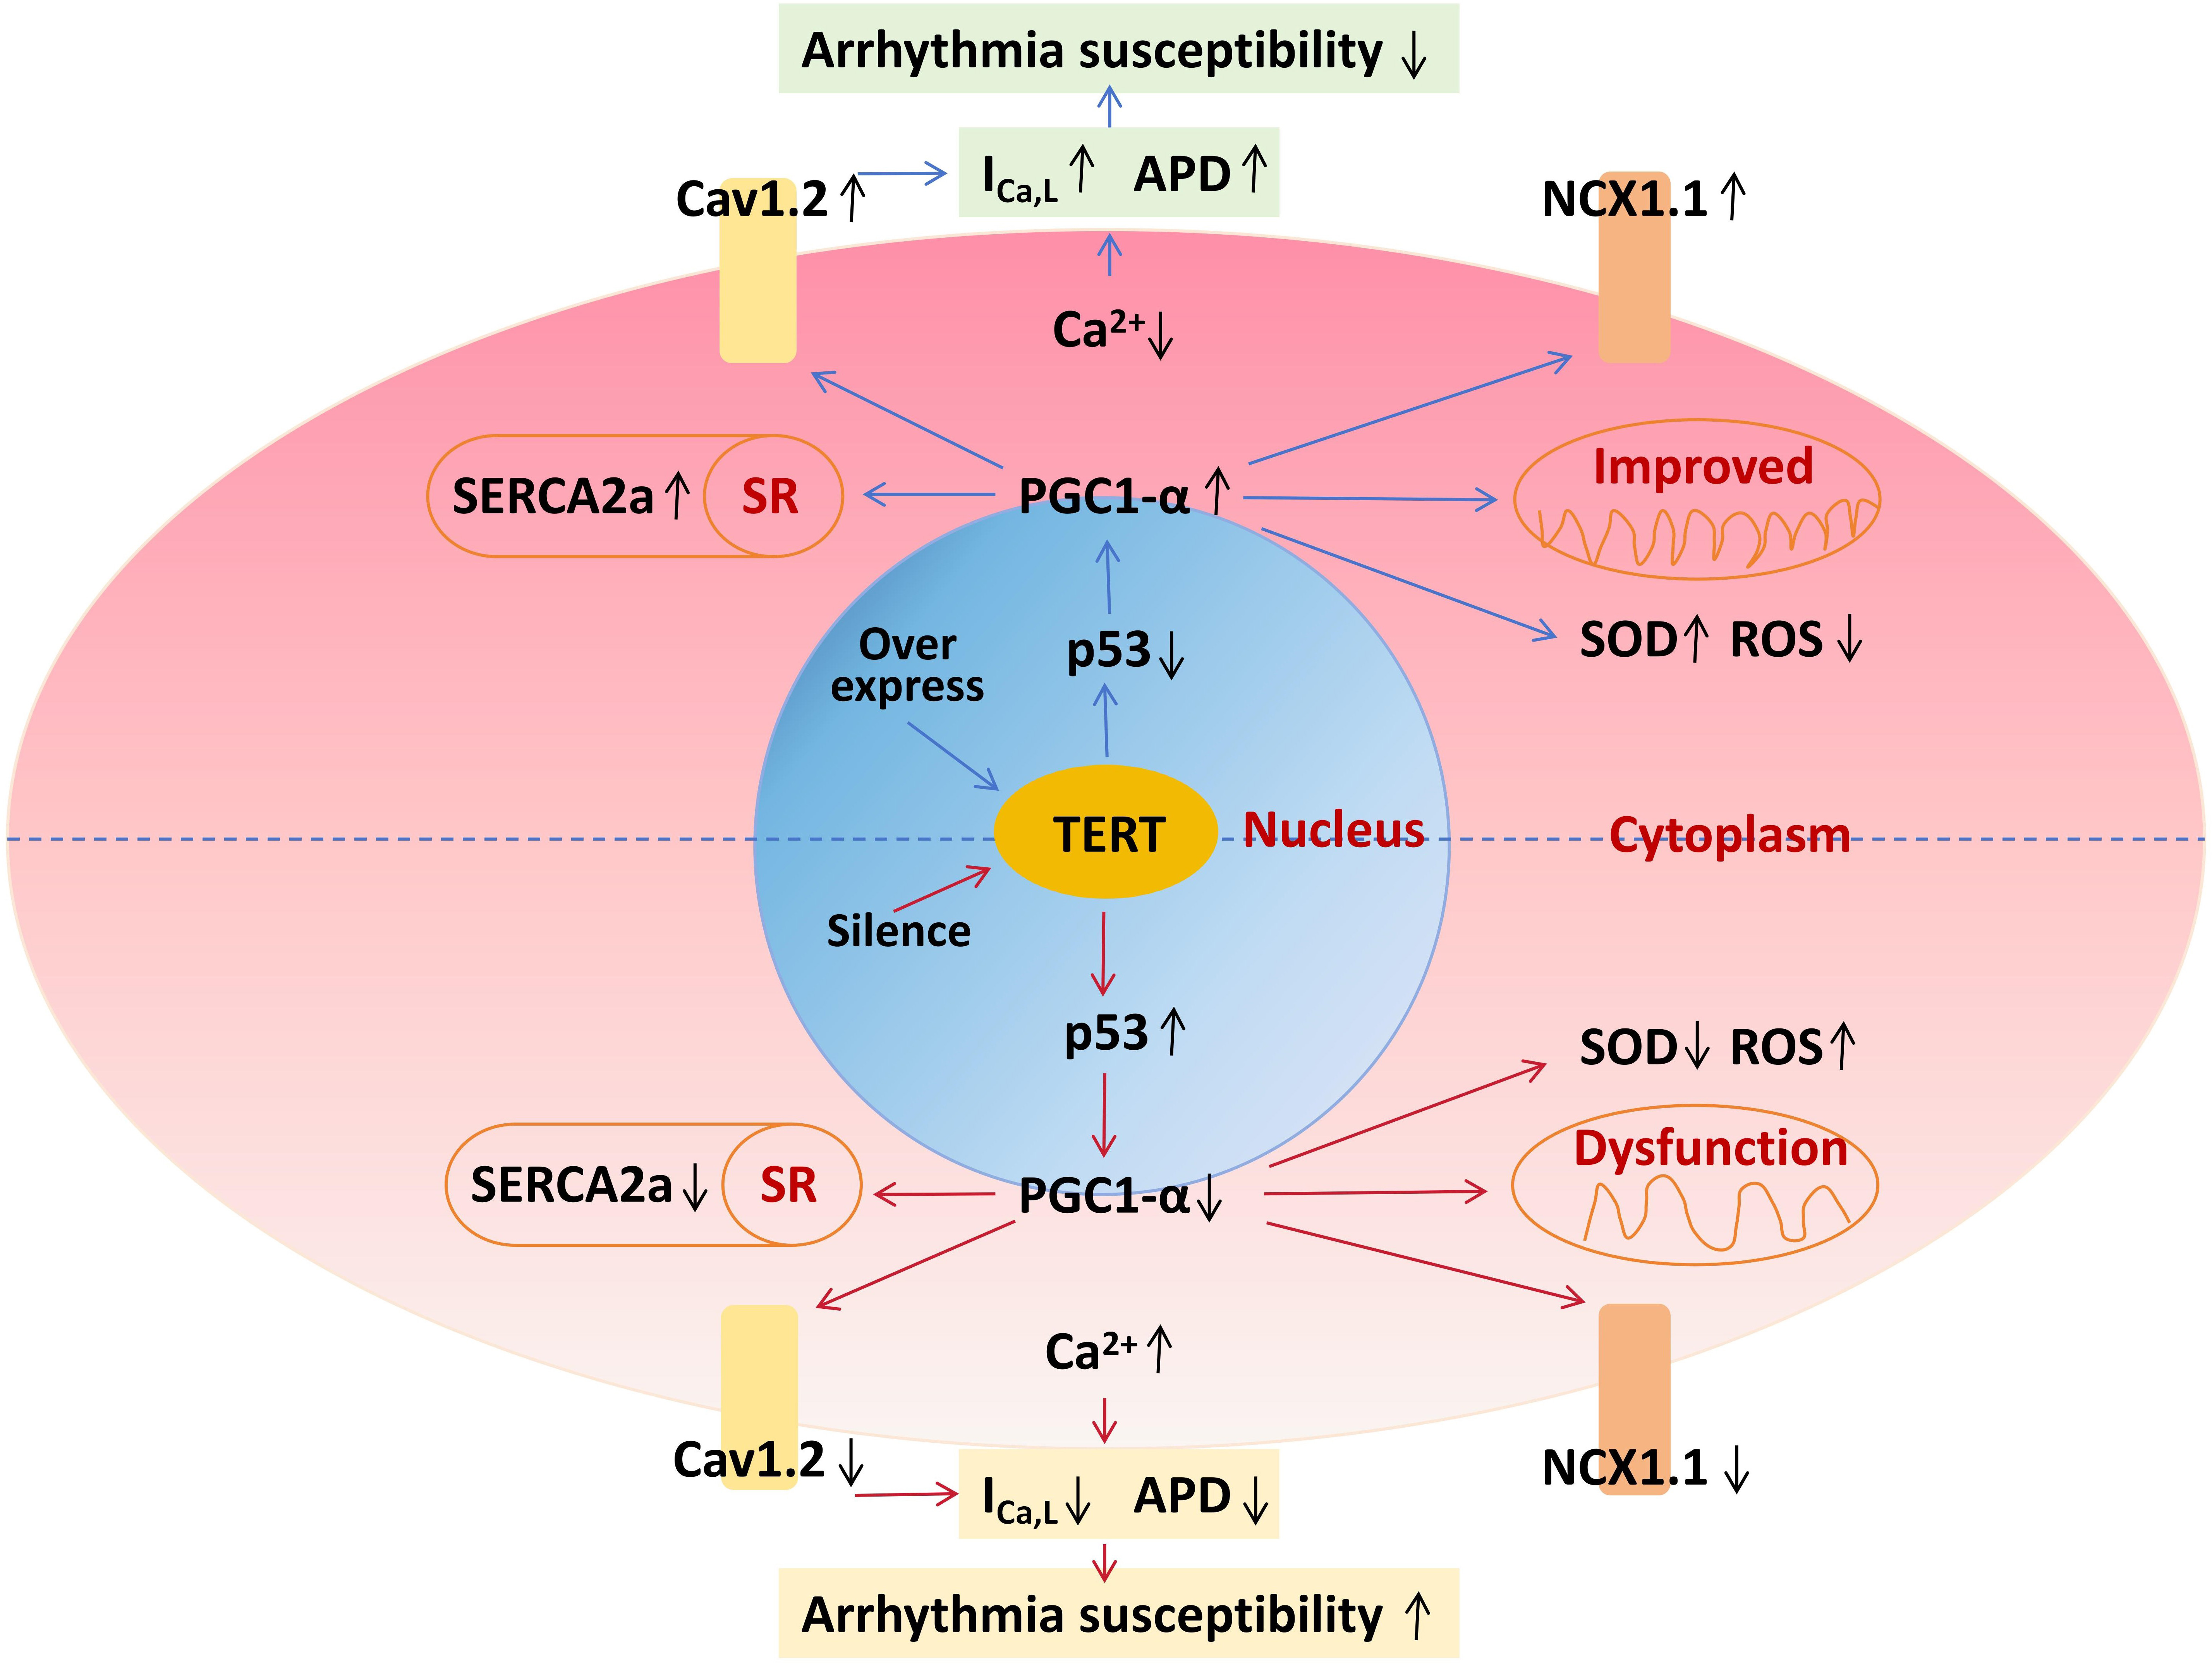 Fig. 9.
Schematic diagram of TERT on cell electrophysiology. TERT,
telomerase reverse transcriptase; PGC-1, peroxisome
proliferator-activated receptor gamma coactivator 1-alpha; APD, action potential
duration; ROS, reactive oxygen species; SOD, superoxide dismutase; SR, sarcoplasmic reticulum.
The therapeutic potential of TERT overexpression in various cardiac diseases has
been recognized, but previous research has focused primarily on the effects on
disease, and there are no reports on the effects of TERT on the electrophysiology
of cardiomyocytes [9, 10, 11, 12, 13]. Our study, conducted on mouse atrial myocytes,
demonstrated that TERT overexpression can improve cellular mitochondrial
function, reduce intracellular Ca accumulation, and prolong APD,
indicating a potential for reducing arrhythmia risk. Chen et al. [34]
found that growth differentiation factor 11 alleviated myocardial I/R injury by
activating TERT and improving mitochondrial function, consistent with our
findings. Similarly, Chatterjee et al. [12] observed that overexpression
of TERT attenuated the cardiotoxic effects of doxorubicin, possibly through
mitochondrial function enhancement. AF is a common age-related disease, the
prevalence of which increases significantly with age, but its pathogenesis is not
fully understood, with most studies showing an association with telomere
shortening [1, 2, 35, 36]. It has been reported that telomere length and telomerase
activity may serve as predictors of AF recurrence after radiofrequency ablation
and as indicators of arrhythmias in patients with ischemic cardiomyopathy
[35, 37]. Our findings indicate that TERT silencing can lead to the overloading of
intracellular Ca, shortening of APD, amd decrease of I, which are
crucial electrophysiological underpinnings for AF, suggesting an important role
for TERT in age-associated AF.
TERT regulates intracellular Ca homeostasis and mitochondrial function
via the p53/PGC-1 pathway in HL-1 cells. Sahin et al. [8]
observed that telomere shortening in mouse cardiomyocytes was accompanied by
increased p53 protein expression and decreased PGC-1 expression,
leading to mitochondrial oxidative stress and an increase in ROS generation.
Those results led them to propose the “Telomere/p53/PGC-1 regulatory
axis” concept [7], which has been verified by other studies [18, 38, 39]. Given
that TERT is the rate-limiting enzyme of telomerase and directly determines
telomere length, we hypothesized that TERT could regulate intracellular Ca
and mitochondrial function through the p53/PGC-1 pathway. Our findings
support this hypothesis, revealing that TERT silencing upregulated p53 and
downregulated PGC-1. Treatment with the p53 agonist Tenovin-6 decreased
PGC-1 expression, while TERT overexpression and PFT treatment
had the opposite effects. These results suggest that TERT may act through the
p53/PGC-1 pathway.
PGC-1 can directly or indirectly reduce intracellular Ca by
inhibiting cellular oxidative stress [20, 21]. By contrast, p53 has the opposite
effect on intracellular Ca [40]. Birket et al. [41] found that
PGC-1 knockdown mice had increased systolic Ca and Ca
transients. Summermatter et al. [42] demonstrated that PGC-1
reduced Ca release from the SR of skeletal muscle cells. Additionally, as
a key regulator of mitochondrial function, PGC-1 also reduced oxidative
stress by decreasing mitochondrial ROS production, thereby lowering intracellular
Ca levels [43]. In our study, we observed that TERT silencing led to
intracellular Ca overload by altering Ca transporter protein
expression and gated channel inactivation, shortening APD, and decreasing
I, which culminated in the electrical remodeling of atrial myocytes.
Taken together, our study confirms that TERT regulates intracellular Ca
homeostasis and mitochondrial function via the p53/PGC-1 pathway in
HL-1 cells.
PGC-1 shows promise for treating heart diseases such as AF.
PGC-1 is a key factor in mitochondrial energy metabolism. The
disturbance of mitochondrial energy production will lead to abnormal electrical
conduction and Ca imbalance, which will directly lead to the reduction of
ATP production, slow down the local electrical signal conduction in the
myocardium, enhance the heterogeneity, and promote the occurrence of AF. In
addition, insufficient ATP synthesis will also affect the opening of ion
channels, such as the Na/K pump and ATP-dependent Ca pump,
leading to intracellular Ca overload and promoting the occurrence and
maintenance of AF [32]. By comparing the preoperative and postoperative serum
PGC-1 levels of patients with coronary artery bypass graft surgery
(CABG), Jeganathan et al. [44] found that the PGC-1 level in
patients with postoperative AF was significantly lower than that before surgery
(p = 0.002), suggesting that serum PGC-1 level can be used as
a predictor of new-onset AF after CABG. We previously found that the serum level
of PGC-1 was lower in patients with AF than in controls in an elderly
male population [36]. Li et al. [45] found that the PGC-1
agonist ZLN005 protected cardiomyocytes from high glucose-induced cytotoxicity in
neonatal mouse cardiomyocytes. Liu et al. [46] found in human
pluripotent stem cell-derived cardiomyocytes that treatment with ZLN005 could
upregulate the expression of mitochondrial function-related genes and promote
energy metabolism, while improving cellular Ca handling capacity and
enhancing intercellular connectivity. Xu et al. [47] confirmed in PC12
cells and rats that ZLN005 can upregulate the expression of antioxidant genes
SOD1 and heme oxygenase 1, improve the activity of SOD, and effectively improve
neuronal damage caused by ischemia. However, treatment of AF with PGC-1
has not been reported. In our study, we found that PGC-1 inhibitors
cause intracellular Ca overload and impaired mitochondrial function in
atrial myocytes, leading to electrical remodeling, a result similar to the effect
of TERT silencing. By contrast, PGC-1 agonists exerted opposite
effects. These findings offer theoretical support for the feasibility of
PGC-1 interventions in AF treatment.
This study had several potential limitations worth noting. First, while studying
cellular Ca homeostasis, our focus was on changes in the expression of
Ca transporters without assessing their activity, which are susceptible to
external environmental factors. Second, our discussion of mechanisms primarily
revolved around Ca dynamics; however, other ions such as K and
Na also warrant further exploration. Finally, this study was only conducted
at the cellular level, and the findings were not validated in animal experiments.
Since in vivo experiments are influenced by more factors than in
vitro, the effectiveness and mechanisms need to be further explored.
5. Conclusions
In this study, we found that TERT regulated intracellular Ca homeostasis
and mitochondrial function via the p53/PGC-1 pathway in HL-1 atrial
myocytes, which might be one mechanism of age-related AF. Additionally, we
confirmed that TERT overexpression was safe and did not increase the risk of
arrhythmia. Finally, we verified the effects of PGC-1 on intracellular
Ca and expression of the Ca transporter protein in vitro.
The results suggest that PGC-1a might be a novel target for AF and intervention
for AF should not be limited to abnormal cation handling.
Abbreviations
TERT, telomerase reverse transcriptase; APD, action potential duration;
I, L-type calcium currents; MMP, mitochondrial membrane potential; OCR,
oxygen consumption rate; ROS, reactive oxygen species; AF, atrial fibrillation;
CHD, coronary heart disease; I/R, ischemia/reperfusion; PGC-1, peroxisome
proliferator-activated receptor gamma coactivator-1; WB, western blot; AP, action
potential; APA, action potential amplitude; RMP, resting membrane potential;
FCCP, carbonyl cyanide 4-(trifluoromethoxy) phenylhydrazone; shRNA, small hairpin
RNA; SOD, superoxide dismutase; SR, sarcoplasmic reticulum.
Availability of Data and Materials
The original contributions presented in this study are included in the
article/supplementary material, and further inquiries can be directed to the
corresponding author.
Author Contributions
CL, KL, QX, and YL designed the research study. ZX, YC, DL, JF, NL and XW
performed the research. YC, SG and QX analyzed the data. CL, ZX, QX and YL wrote
the manuscript. All authors contributed to editorial changes in the manuscript.
All authors read and approved the final manuscript. All authors have participated
sufficiently in the work and agreed to be accountable for all aspects of the
work.
Ethics Approval and Consent to Participate
Not applicable.
Acknowledgment
Not applicable.
Funding
This research was funded by National Nature Science Foundation of China
(82200366, 82370327), Beijing Nova Program (20220484020), Young Talent Project of
Chinese PLA General Hospital (20230433).
Conflict of Interest
The authors declare no conflict of interest.


 , Kun Lin 2,†, Zhonghui Xie 3,†, Dawei Li 4, Jiao Fan 5, Yating Chen 2, Shan Gao 5, Xueping Wang 2, Nian Liu 6,7, Qiao Xue 2,*
 , Yang Li 2,*