


1 Department of General Surgery, The Fourth Affiliated Hospital of Harbin Medical University, 150001 Harbin, Heilongjiang, China
†These authors contributed equally.
Abstract
Background: Improving the clinical outcome of colorectal cancer (CRC) patients remains a major challenge. This study aimed to develop a new predictive classifier for CRC and to examine its relationship with the immune environment and therapeutic response. Methods: A comprehensive bioinformatics analysis was applied to develop a risk panel comprised of cancer function status-related genes (CFSRGs). This panel was evaluated for prognostic utility by Area Under the Curve (AUC) and Kaplan-Meier (KM) analyses. Differences between high- and low-risk groups were subsequently investigated using multi-omics data. Immunohistochemistry (IHC), quantitative real-time polymerase chain reaction (qRT-PCR), and cell phenotype assays were also employed to ascertain the clinical value of STC2 expression. Results: Significant differences were observed in the survival rate between high- and low-risk groups defined by our 7-CFSRG panel, both in internal and external CRC patient cohorts. The AUC for prediction of survival at 1-, 3- and 5-years was satisfactory in all cohorts. Detailed analysis revealed that tumor mutation burden, drug sensitivity, and pathological stage were closely associated with the risk score. Elevated expression of STC2 in CRC tissues relative to normal paraneoplastic tissues was associated with less favorable patient outcomes. qRT-PCR experiments confirmed that STC2 expression was significantly upregulated in several CRC cell lines (HCT116, SW480, and LOVO) compared to a normal intestinal epithelial cell line (NCM460). The proliferation, migration, and invasion of CRC cells were all significantly inhibited by knockdown of STC2. Conclusions: Our 7-CFSRG panel is a promising classifier for assessing the prognosis of CRC patients. Moreover, the targeting of STC2 may provide a novel therapeutic approach for improving patient outcomes.
Keywords
- colorectal cancer
- cancer functional states
- prognostic panel
- immune cell infiltration
- drug sensitivity
- STC2
Colorectal cancer (CRC) is the most prevalent gastrointestinal malignancy and is
a significant health concern due to its high morbidity and mortality rates [1, 2]. The early symptoms of CRC are insidious, and thus in many cases the diagnosis
is often made at intermediate or advanced stages of disease [3, 4]. Despite the
improved survival of CRC patients after a comprehensive surgical regimen,
patients who experience recurrence and metastasis have a 5-year survival rate of
Heterogeneity is often cited as an important cause of treatment resistance in tumors. The complexity and diversity of tumor heterogeneity makes it extremely challenging to develop effective treatment plans for individual patients [10]. Tumor evolution resulting from molecular biological or genetic changes leads to distinct phenotypes with differences in cancer cell proliferation, migration, invasion, and drug sensitivity. Immunotherapy has gained considerable clinical attention in recent years, with immune checkpoint blockers (ICB) now used in the treatment of several cancer types [11]. However, multiple immune-related components can infiltrate tumors during their dynamic evolution, and malignant cells may also gradually diversify and thus produce heterogeneity of immunity [12]. Only a small proportion of CRC patients exhibit a good response to immune checkpoint inhibitor (ICI) therapy. Hence, there is a pressing need to determine which patients are likely to respond to this treatment.
Many studies have been conducted on the classification of CRC, with most authors focusing on specific cancer features [13, 14, 15]. Epithelial-mesenchymal transition (EMT)-related gene signatures can predict the recurrence of stage II/III CRC [16]. Angiogenic tumors are characterized by multifactorial, multistep, complex biological processes, with anti-angiogenic therapy emerging as a potential treatment for CRC patients [17]. Hypoxia is the inevitable result of tumor growth and vascular system disorder. Cancer cells develop resistance to immunotherapy through a mechanism involving hypoxia compensation [18]. The investigation of hypoxia-related micro-environmental features may therefore help to identify novel biomarkers for predicting response to immunotherapy. However, current classification signatures lack the specificity and sensitivity to assess the multiple functional states of cancer in a comprehensive and systematic manner. It is therefore important to develop new CRC prognostic signatures that are based on multiple, cancer-related functional features.
The aim of the present study was therefore to develop a gene panel for the prediction of CRC patient outcomes based on functional features of cancer, including the tumor microenvironment (TME), immune landscape, and drug sensitivity. The involvement of hub genes in the malignant progression of CRC was also investigated. Our approach establishes a theoretical framework for improving the prediction of clinical outcomes in CRC patients.
RNA sequencing (RNA-seq) profiles, mutation data, and clinical data for CRC patients were obtained from The Cancer Genome Atlas (TCGA), comprising 51 normal and 650 tumor samples. Two external CRC datasets and corresponding clinicopathological data were also sourced from the Gene Expression Omnibus (GEO) as validation cohorts (GSE17536 and GSE39582). Patients with less than one month of follow-up information were excluded. A total of 14 malignant tumor features were included for the study of CRC patient prognosis. Supplementary Table 1 integrates the cancer-associated functional status of all gene sets derived from the CancerSEA database [19].
Pathway enrichment analysis was conducted on a total of 1575 genes linked to cancer. Heatmaps were used to visualize the enrichment pathways, and interactive network diagrams were created based on the Metascape database. Next, single nucleotide variation (SNV) and copy number variation (CNV) in these 1575 genes were analyzed using the Gene Set Cancer Analysis (GSCA) database. In addition, genes with a high mutation frequency were visualized utilizing the “maftools” R package (v4.1.3). To investigate underlying molecular mechanisms, differentially expressed genes (DEGs) between high- and low-risk patient groups were analyzed using Gene Ontology (GO) and the Kyoto Encyclopedia of Genes and Genomes (KEGG).
Cancer functional status-related genes (CFSRGs) with differential expression
between para-cancerous and CRC tissues were identified utilizing the “limma”
package (v3.19) (False Discovery Rate
Two independent GEO cohorts (nGSE17536, n = 177; nGSE39582, n = 573) were employed to validate the clinical value of the CFSRG panel in CRC patients. The R package was utilized to filter and standardize the chip data before evaluating prognostic performance. KM and area under the curve (AUC) analyses were subsequently performed for each cohort.
Associations between the risk score and different clinical parameters were evaluated, including age, sex, and tumor stage. Independent prognostic markers for CRC were identified by multivariate Cox regression analysis. The accuracy of the CFSRG-based prognostic panel for predicting the outcome of CRC patients was subsequently evaluated using a nomogram, and tested using a calibration curve. ROC curves were used to assess its predictive power on the training, test, and combined cohorts. Differences in clinical characteristics between high- and low-risk groups were visualized using heatmaps and KM survival curves.
Seven algorithms (QUANTISEQ, TIMER, EPIC, XCELL, MCPCOUNTER, CIBERSORT-ABS, and CIBERSORT) were employed to study the associations between immune cell infiltration and risk scores. Infiltrating immune and stromal cells are known to play vital roles in tumorigenesis. Based on gene expression values, we computed the immune, stromal, and tumor purity scores of CRC patients by estimating the ratio of stromal and immune cells [20]. Single sample Gene Set Enrichment Analysis (ssGSEA) was then used to calculate the proportion of immune cells and the immune response in different samples within a given data set. Gene Set Enrichment Analysis (GSEA) specifically explores the major signaling pathways in patient samples using the “GSVA” R package (v4.1.3).
Since somatic mutations are strongly associated with cancer, the mutation status
of the top 15 genes in patients classified as high- or low-risk was initially
assessed by employing the “maftools” package (v4.1.3). Subsequently, the R software
packages “survival” (v3.6.4) and “survminer” (v0.4.9) were employed to ascertain the optimal TMB
threshold and to perform KM survival analysis in combination with the risk
scores. Subsequently, CRC patients were classified into distinct immune subtypes,
including wound healing (C1), Interferon gamma Antibody (IFN-
The “Prophetic” R package (v4.1.3) was applied according to cancer drug
sensitivity genomics (GDSC) to predict how CRC patients respond to common
chemotherapy drugs. The Wilcoxon test was performed to compare the half-maximal
inhibitory concentration (IC
CRC cell lines (SW480, HCT-116, LOVO) and a normal colon epithelial cell line
(NCM460) were purchased from Wuhan Procell Life Science and Technology.
Dulbecco’s Modified Eagle Medium (DMEM; Gibco, Thermo Fisher Scientific, Waltham,
MA, USA) containing 10% fetal bovine serum (FBS; Gibco, Thermo Fisher
Scientific, Waltham, MA, USA) was used to culture the cells in a humidified
incubator at 37 °C with 5% CO
The proliferation status of CRC cells was quantified with a Cell Counting Kit-8
(CCK-8; Gibco, Thermo Fisher Scientific, Waltham, MA, USA). Transfected LOVO and
SW480 cells were seeded into 96-well plates (1
Transfected cells were cultured in 6-well plates until confluence was reached. An incision along a straight line on the bottom of the culture dish was performed with a 200 µL pipette tip. Floating cells were removed and closure of the wound was measured at 0 h and 48 h.
Non-matrigel-coated Transwells were employed to evaluate the migration ability of cells. Serum-free culture medium was introduced into the upper chamber of Transwells containing transiently transfected cells. Complete medium containing 20% FBS was then introduced into the culture dish. Following a 24 h incubation period, the upper chamber cells were removed, whereas the lower layer cells were fixed, stained, and counted. The invasion assay used Transwells coated with Matrigel, and all other steps were the same as for the cell migration experiment.
RNA-plus reagent (Thermo Fisher Scientific, Waltham, MA, USA) was utilized to
isolate total RNA from cells. qRT-PCR was conducted according to the protocol
provided with the ReverTra Ace qPCR RT Kit (Toyobo, Shanghai, China).
Complementary DNA (cDNA) was synthesized using oligonucleotide primers. The
expression of STC2 was evaluated by qRT-PCR using 2
Tissue samples were obtained from CRC patients who underwent surgery at the Fourth Affiliated Hospital, Harbin Medical University. Sample collection for this study was approved by the Research Ethics Committee of the Fourth Affiliated Hospital, Harbin Medical University (No. 2023-LLSC-04). All patients have given informed written consent.
Tissue slices were dewaxed and then subjected to a 30 minute treatment at 100 °C with 10 mM sodium citrate buffer (Yeasen Biotechnology, Shanghai, China) (pH 6.0) to unmask antigens. The sections were then blocked with normal serum and subsequently incubated overnight at 4 °C with primary antibody against STC2 (1:100, Proteintech, Wuhan, China). They were then washed and incubated with a secondary antibody (Zsgb-Bio, Beijing, China). Signal amplification was performed using SignalUp™ Immunostaining Enhancer as directed by the manufacturer (Beyotime, Shanghai, China). Images showing positive staining (brown color) were recorded with an optical microscope (Nikon, Tokyo Metropolis, Japan).
siRNA-mediated silencing of STC2 was achieved by transfecting cells with synthetic siRNA duplex molecules for 24–96 h. The siRNA sequences are listed in Supplementary Table 2. The negative control was a siRNA with no sequence homology to mammalian STC2 (GenePharma, Shanghai, China).
Statistical analyses were conducted using R 4.1.3 (https://www.r-project.org/,
Boston, MA, USA), GraphPad Prism 9.4 (v9.4.0, GraphPad Software Inc., San Diego,
CA, USA), and SPSS 26.0 (R26.0.0.0, IBM-SPSS Statistics, Chicago, IL, USA). KM
survival analysis and log-rank tests were performed to compare the survival
probability between different risk groups. Spearman’s rank correlation test was
used to examine correlations between CFSRGs and the abundance of immune cells. A
two-sided p-value of
The molecular mechanisms involving 1575 CFSRGs were studied using a heatmap to
display the top 20 enriched signaling pathways. The CFSRGs participate mainly in
cell proliferation (GO:0008283), DNA repair (R-HSA-73894), cell cycle
(R-HSA-1640170), and epithelial cell differentiation (GO:0030855)
(Supplementary Fig. 1A). Interactive network maps revealed connections
between various pathways, such as DNA repair being closely linked to the cell
cycle (Supplementary Fig. 1B). Missense mutations were shown to
be the most common type of somatic mutation in CRC patients from the TCGA
database (Supplementary Fig. 1C). Single-nucleotide
polymorphism (SNP) variants also occurred more frequently than deletions (DEL) or
insertions (INS), with C
The workflow diagram for this study is shown in Fig. 1. Overall, 2632 DEGs were
identified between adjacent normal tissues and CRC, of which 1361 were
upregulated and 1271 were downregulated (Fig. 2A and Supplementary Table 3). Of these 2632 DEGs, 360 were CFSRGs (Fig. 2B). Ten CFSRGs with
substantial prognostic value were identified by univariate analysis, of which 6
were associated with better patient outcome (EPHB2, CDC25C,
CCNF, EREG, CXCL11, and MMP3) and 4 with
worse outcome (GPM6A, CCBE1, TIMP1, and STC2)
(Fig. 2C). Hub CFSRGs were identified utilizing LASSO-Cox regression analysis,
with a graph used to show the correlation between the log (
 Fig. 1.
Workflow diagram for this study. CRC, Colorectal cancer; TCGA, The Cancer Genome Atlas; GEO, Gene Expression Omnibus; FC, Fold Change; STC2, Stanniocalcin 2; qRT-PCR, Real-Time Reverse Transcription Polymerase Chain Reaction; KM, Kaplan-Meier; ROC, Receiver operating characteristic analysis; AUC, Area Under Curve; CCK-8, Cell Counting Kit-8.
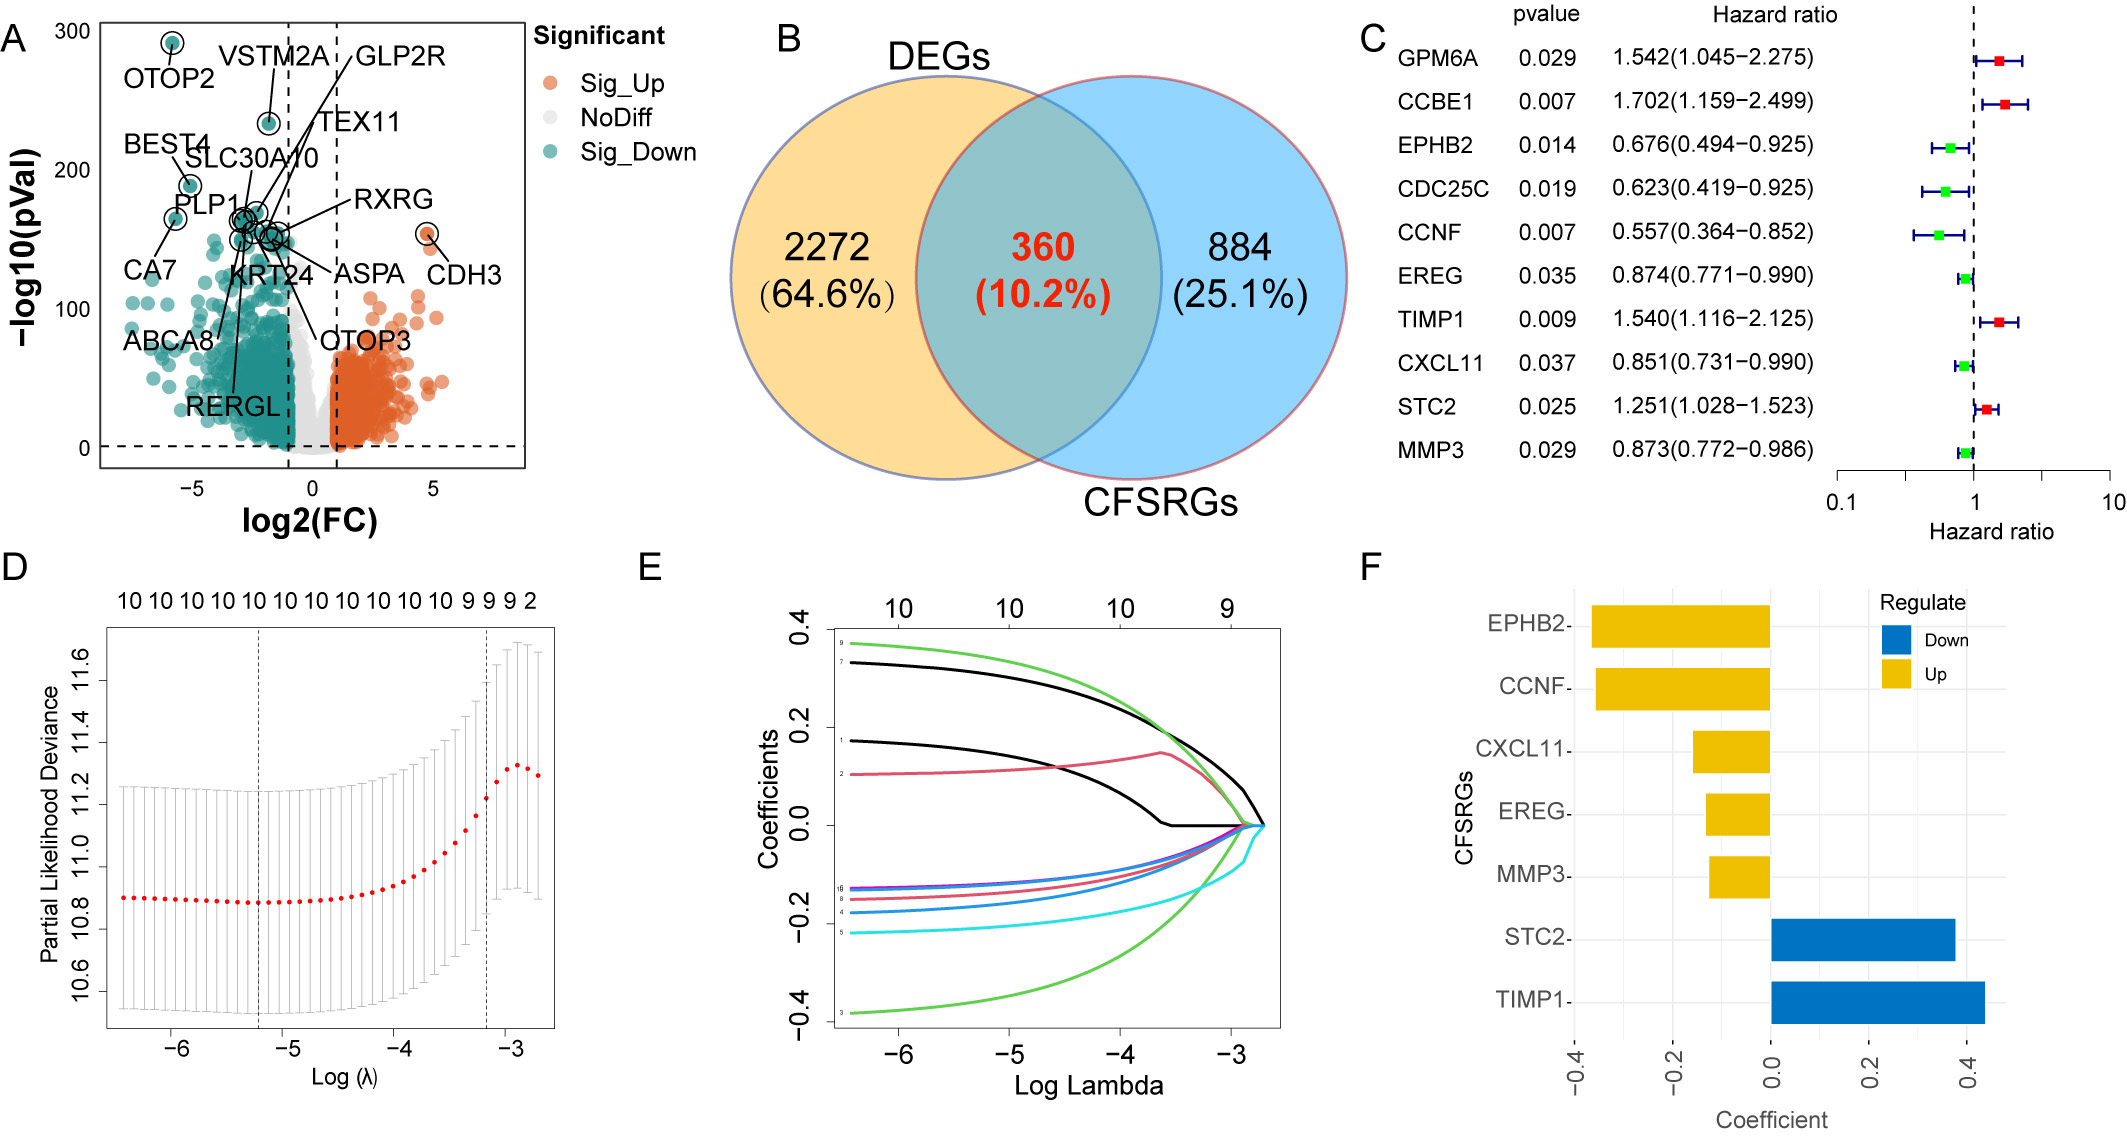 Fig. 2.
Differential expression analysis and construction of a
prognostic panel. (A) Differentially expressed genes between normal and
colorectal cancer (CRC) tissues are displayed by the Volcano plot. (B) Venn
diagram showing the differentially expressed cancer function status-related genes
(CFSRGs). (C) Univariate Cox regression analysis of differential CFSRGs linked to
prognosis, with p
The expression and risk coefficients for each CFSRG were integrated to create a prognostic signature. Additionally, the median risk score was used to categorize each CRC patient into low- and high-risk groups, corresponding to better and worse outcomes, respectively. The TCGA dataset was evenly divided into two groups, namely the training and test cohorts. Fig. 3A–F shows the scatter distributions for the training, test, and overall cohorts in terms of survival time and survival status, as well as correlations with the risk score. As the risk score increased, a marked reduction was observed in patient survival. In all study cohorts, KM analysis revealed unfavorable survival for high-risk patients (Fig. 3G–I). High-risk patients also had worse progression-free survival (PFS) compared to low-risk patients (Fig. 3J–L). Time-dependent ROC curves were generated for the training, test, and overall cohorts. For the training cohort, the corresponding AUCs at 1-, 3-, and 5-years were 0.742, 0.762, and 0.785, respectively (Fig. 4A), for the test cohort they were 0.686, 0.703, and 0.662, (Fig. 4B), and for the overall cohort they were 0.715, 0.733, and 0.728 (Fig. 4C).
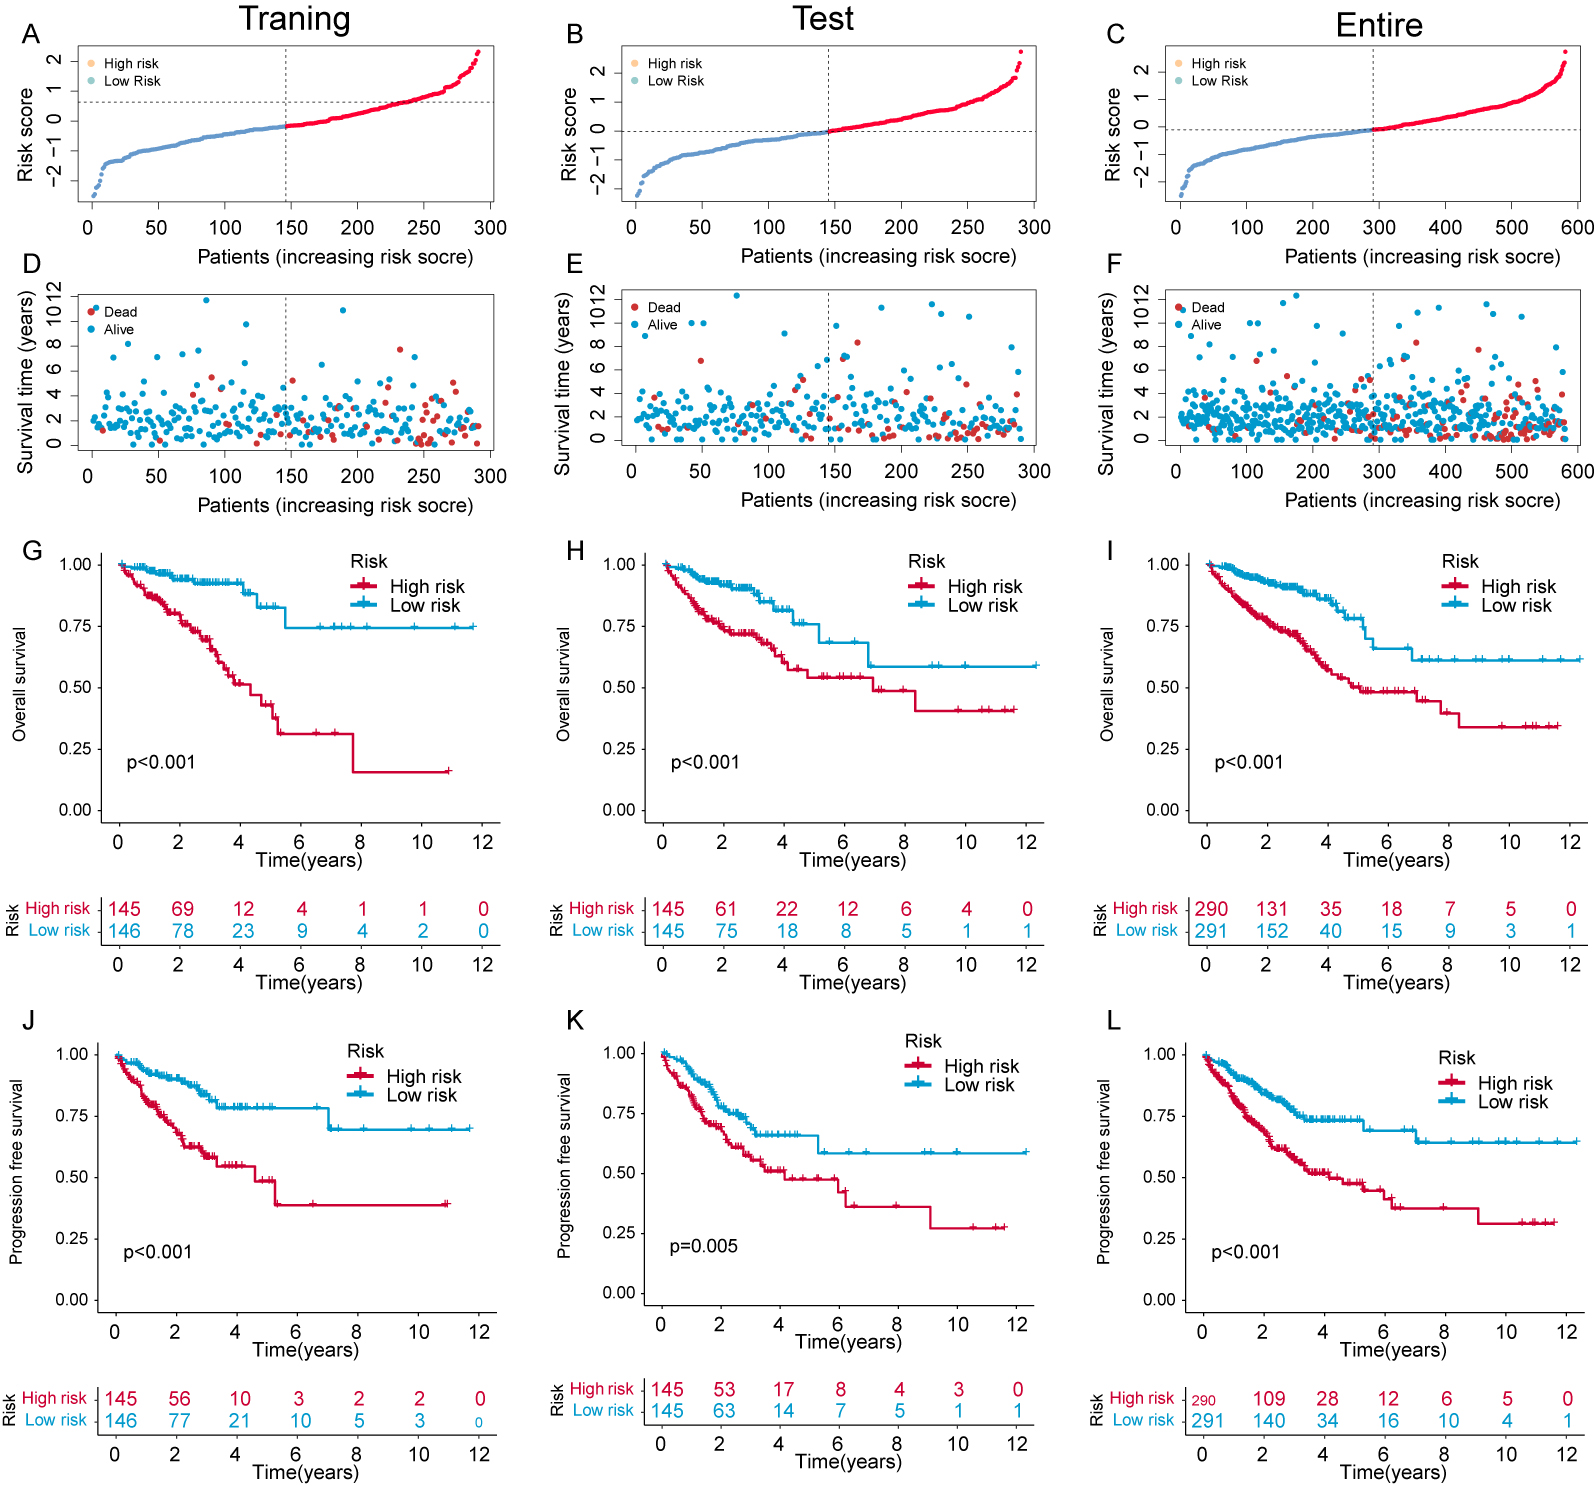 Fig. 3.
Evaluation of the risk panel in the The Cancer Genome Atlas (TCGA) cohort. (A–C) Risk score and survival status distribution across the training, test, and overall cohorts. (D–F) The survival time for different samples is represented by a scatter plot corresponding to their risk scores. (G–I) Kaplan-Meier (KM) curves that compare the overall survival (OS) of the training, test, and overall cohorts between groups with high and low risk. (J–L) KM curves comparing disease-free survival (DFS) of the training, test, and overall cohorts between groups with high and low risk.
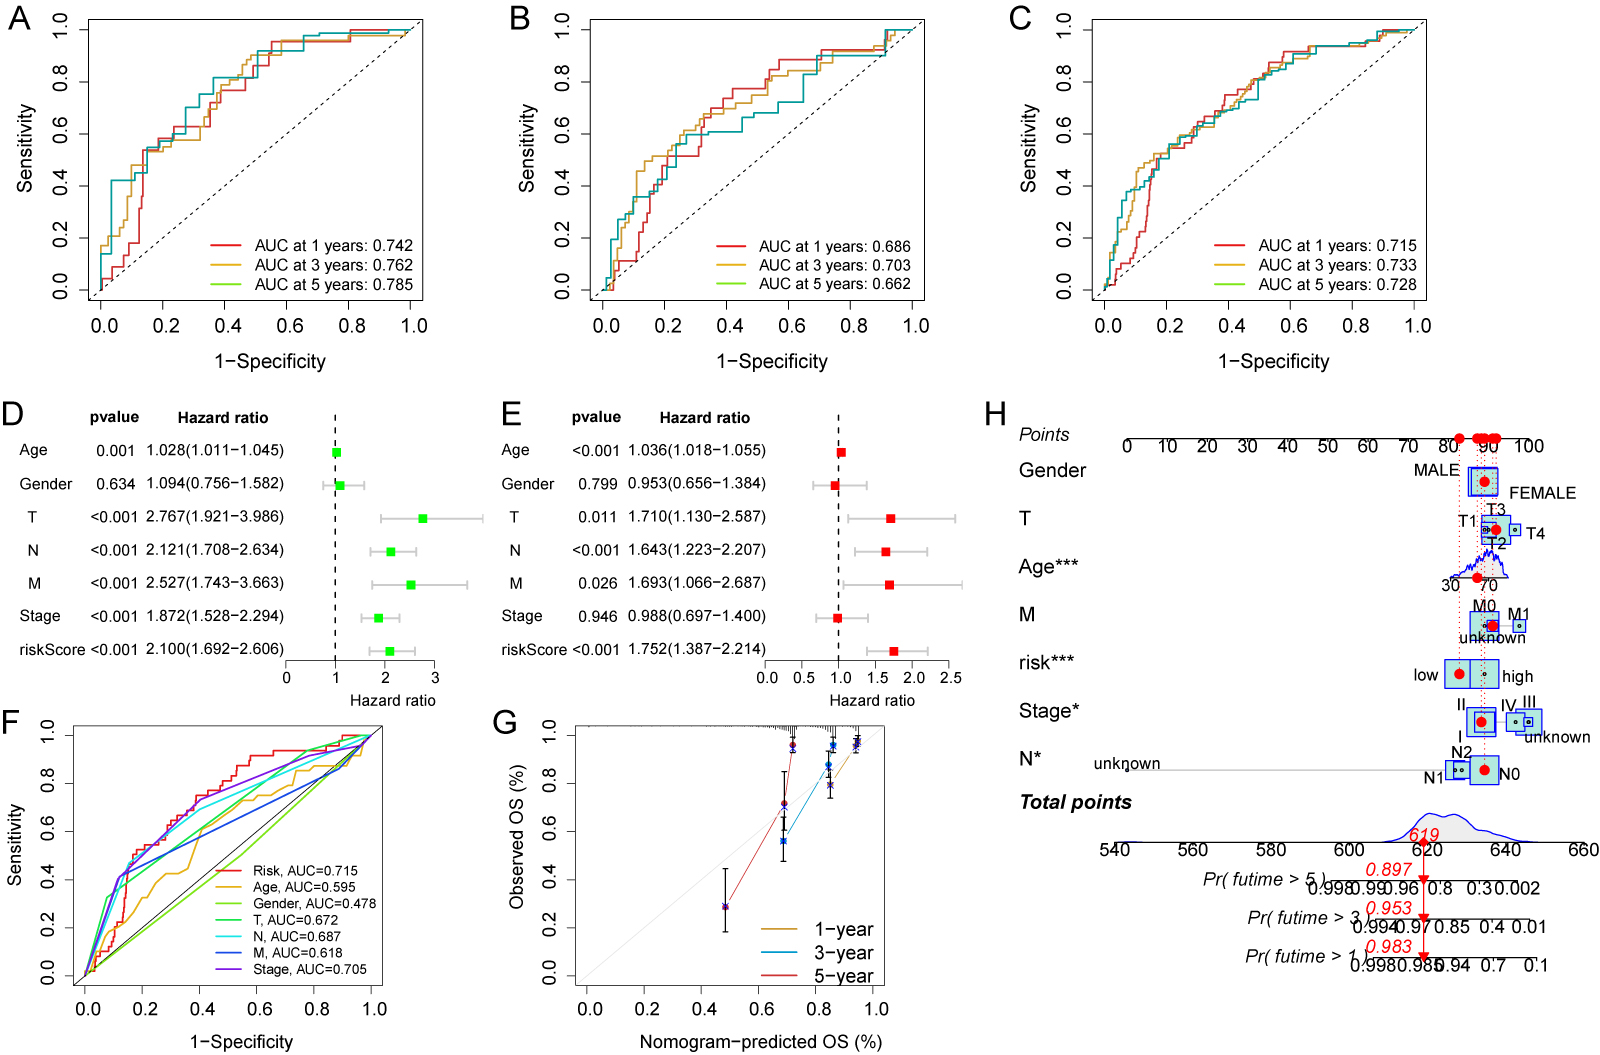 Fig. 4.
Evaluation of independent prognostic value and construction of
nomograms. Time-dependent receiver operating characteristic (ROC) curves for the
prediction of 1-, 3- and 5-year OS in the training (A), test (B), and overall
cohorts (C). (D) Clinicopathological parameters and risk scores are subjected to
univariate Cox analysis. (E) Clinicopathological parameters and risk scores are
subjected to multivariate Cox analysis. (F) Area under the curve (AUC) comparison
between the risk score and other clinicopathological features. (G) Nomogram
calibration curves were utilized to predict OS at one, three, and five years. (H)
Survival probability predictions at 1, 3, and 5 years for CRC patients using a
nomogram that combines clinicopathological parameters with risk scores. * p
Additional analyses were performed to assess the clinical relevance of the risk
score for CRC patients. The risk score, TNM stage, and age all showed significant
correlations with patient survival in univariate analysis (p
Risk score heatmaps that incorporated clinical variables and the various T, M,
and tumor stages were generated for the two risk groups (Supplementary
Fig. 2A). With all clinical features, KM analysis showed that high-risk patients
have reduced survival compared to low-risk patients. This included age (
Two independent and external GEO cohorts (nGSE17536, n = 177; nGSE39582, n = 573) were used to test the predictive ability of the 7-CFSRG panel for CRC patient survival. The median risk score for each patient group was positively associated with survival (Fig. 5A,D), with high-risk groups showing shorter survival times (Fig. 5B,E). Moreover, the 1-, 3- and 5-year AUC values for the GSE17536 cohort were 0.682, 0.650, and 0.598, respectively, and 0.669, 0.651, and 0.605 for the GSE39582 cohort (Fig. 5C,F). These results indicate the CFSRG panel is a robust and accurate predictor of CRC patient outcome.
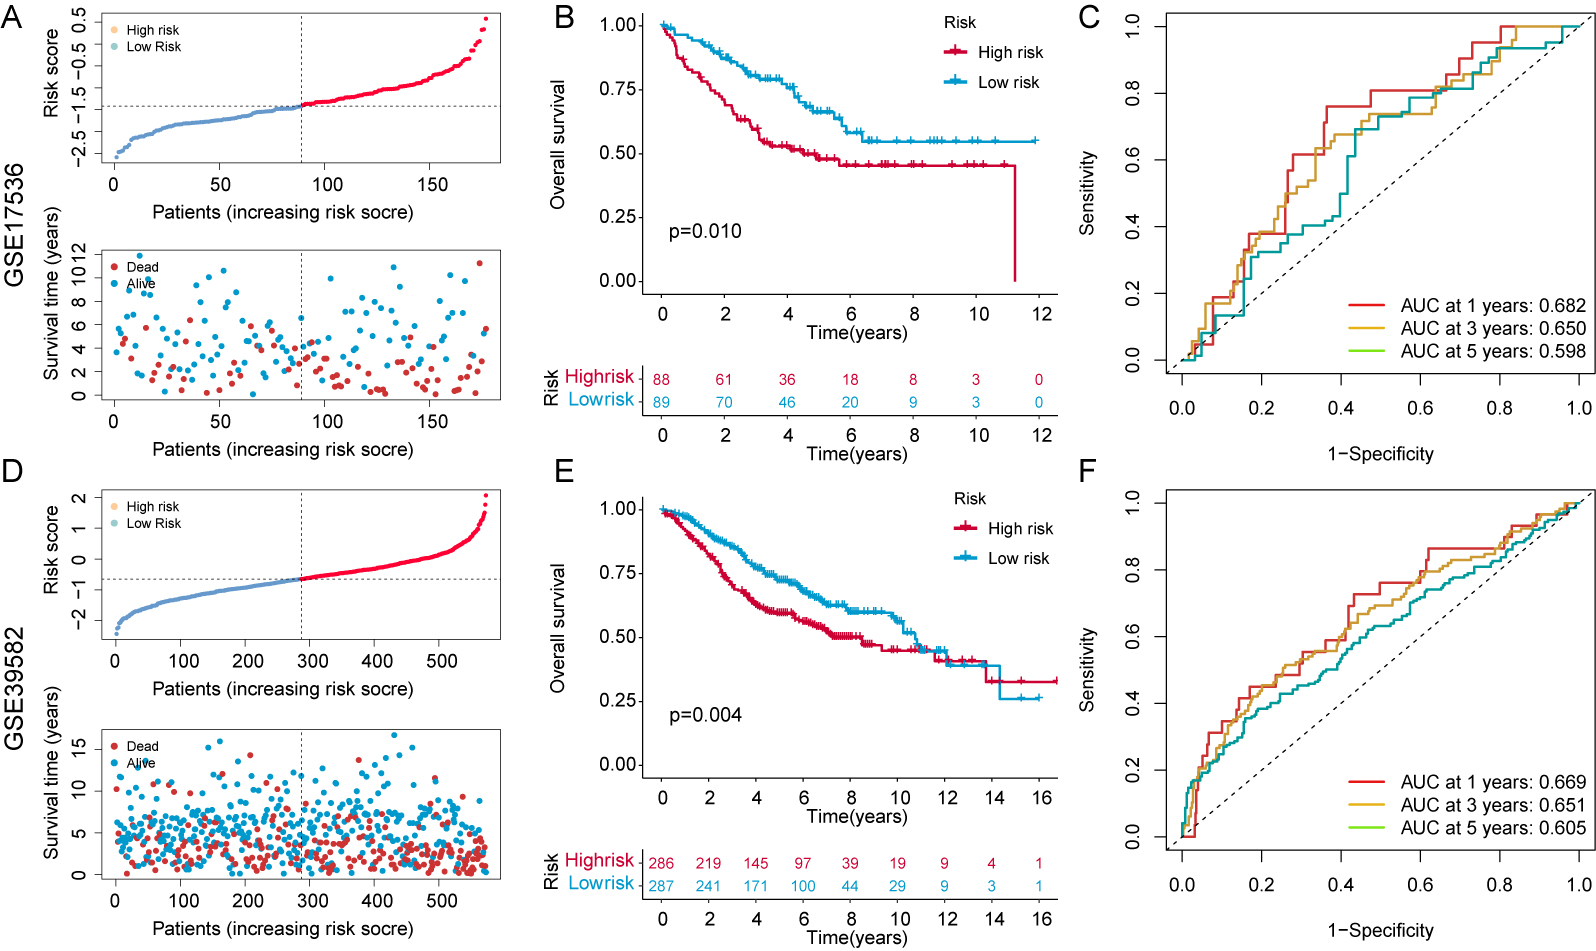 Fig. 5.
Risk score validation in the Gene Expression Omnibus (GEO) cohorts. (A) Scatter plot illustrating the risk scores, survival status, and survival time distribution in the GSE17536 cohort. (B) KM curves for the OS in the GSE17536 cohort for high- and low-risk patients. (C) Prediction of 1-, 3-, and 5-year OS in the GSE17536 cohort using time-dependent ROC curves. (D) Scatter plot illustrating the risk scores, survival status, and survival time distribution in the GSE39582 cohort. (E) KM curves for the OS in the GSE39582 cohort for high- and low-risk patients. (F) Predicting 1-, 3-, and 5-year OS in the GSE39582 cohort using time-dependent ROC curves. A higher AUC value signifies a more robust predictive capability exhibited by the signature.
The composition and proportion of immune and stromal cells in the TME are major determinants of tumor progression. Gene expression levels provide the basis for the MCP-counter and xCell algorithms, while the other five algorithms are based on deconvolution [22, 23]. A total of 22 cell types were therefore assessed using 7 algorithms: XCELL, CIBERSORT, QUANTISEQ, EPIC, MCPCOUNTER, CIBERSORT-ABS, and TIMER (Fig. 6A). Analysis of gene expression in immune and stromal cells using the ESTIMATE algorithm allowed calculation of the corresponding immune and stromal scores. Notably, the stromal scores for high-risk patients were significantly higher than low-risk patients (p = 0.0026, Fig. 6B). However, the two risk groups could not be distinguished by the ESTIMATE and immune scores (Fig. 6C,D). Moreover, significant activation of the APC_co_stimulation, inflammation-promoting, and MHC_class I pathways was observed (Fig. 6E,G). We next compared 22 immune cell types between patients with and without CRC. Significantly more macrophages were found in CRC patients, but there were significantly less Treg, Th1, Th2, pDC, and NK cells. These results indicate the occurrence of an immunosuppressive TME in high-risk patients (Fig. 6F).
 Fig. 6.
Analysis of CFSRG-based risk scores and infiltrating immune
cells. (A) The following tools were used to examine the link between the risk
score and infiltrating immune cells: TIMER, CIBERSORT, quanTIseq, EPIC, MCP
counter, CIBERSORT-ABS, and xCell. (B–D) Immune, stromal, and estimation scores
for both the high- and low-risk populations are displayed in a box plot. (E)
Heatmap showing the risk scores and enrichment degree of 13 immune-related
functions in the two risk groups. (F) The two risk groups’ risk scores for 16
different kinds of immune cells are presented in a box plot. (G) Box plots
illustrate the risk scores and enrichment degrees of 13 immune-associated
functions in the two risk groups. * p
The 7-CFSRG panel and potentially related biological mechanisms were further investigated by GSEA. High-risk patients showed a remarkable enrichment for focal adhesion and ECM-receptor interactions, indicating strong tumor invasive properties (Supplementary Fig. 3A). Multiple pathways associated with cell death were enriched in low-risk patients, as well as the cell cycle, DNA replication, and peroxisomes (Supplementary Fig. 3B). Next, we examined the 15 genes with the highest frequency of mutations. A waterfall plot showed that CSMD3, RYR2, KRAS, LRP1B, FAT4, MUC16, ZFHX4, TTN, and TP53 were more often mutated in high-risk patients, whereas SYNE1, PIK3CA, OBSCN, FBXW7, and DNAH5 were less frequently mutated compared to low-risk patients. The frequency of APC mutation did not differ between the two groups (Supplementary Fig. 3C,D). The TMB and risk scores were combined to assess the prognostic significance. High-risk scores and high TMB were found to correlate with a worse outcome for CRC patients (Supplementary Fig. 3E). Additionally, the STEMNESS index showed a significant negative association with the risk score, indicating increased stem cell activity and tumor dedifferentiation in high-risk CRC patients (Supplementary Fig. 3F).
Despite advances in treatment methods, CRC patients still have poor prognosis due to tumor heterogeneity [24]. CRC patients from the TCGA cohort exhibited four distinct immune subtypes. Most high-risk patients had C3 or C4 immune subtypes, whereas the most frequent immune subtype in the low-risk group was C2. Additionally, significant differences in immune subtypes were found between the two risk groups (p = 0.002, Fig. 7A). TIDE may help to improve the selection of patients for ICB therapy [25]. Many patients classified as TIDE responders were observed to have a poor clinical outcome (Fig. 7B). The high-risk CRC group scored higher in TIDE, Dysfunction, and Exclusion (Fig. 7C), suggesting that it may be resistant to ICB therapy. Expression of the immune checkpoint genes CD200R1, ICOS, IDO1, TMIGD2, TNFRSF9, CD80, BTLA, IDO2, HHLA2, CTLA4, and CD274 was shown to be downregulated in high-risk patients, whereas VTCN1, TNFSF4, CD70, and TNFSF9 were highly expressed (Fig. 7D). Targeting of these immune checkpoint genes might therefore improve the efficacy of immunotherapy in high-risk populations.
 Fig. 7.
Prediction of immune response and risk score. (A) An
immunologic subtype bar chart is shown for the two different risk populations.
(B) Histogram showing responses to Tumor Immune Dysfunction and Exclusion (TIDE) among CRC patients. (C) Violin plots
represent differences in TIDE, dysfunction, and exclusion scores in the two
different risk groups. (D) Fifteen immune checkpoint genes are differentially
expressed between high- and low-risk groups. * p
To enhance the therapeutic effect of neoadjuvant chemotherapy in CRC patients,
we tested the ability of the 7-CFSRG panel to identify drugs that may be more
effective in treating CRC. The IC
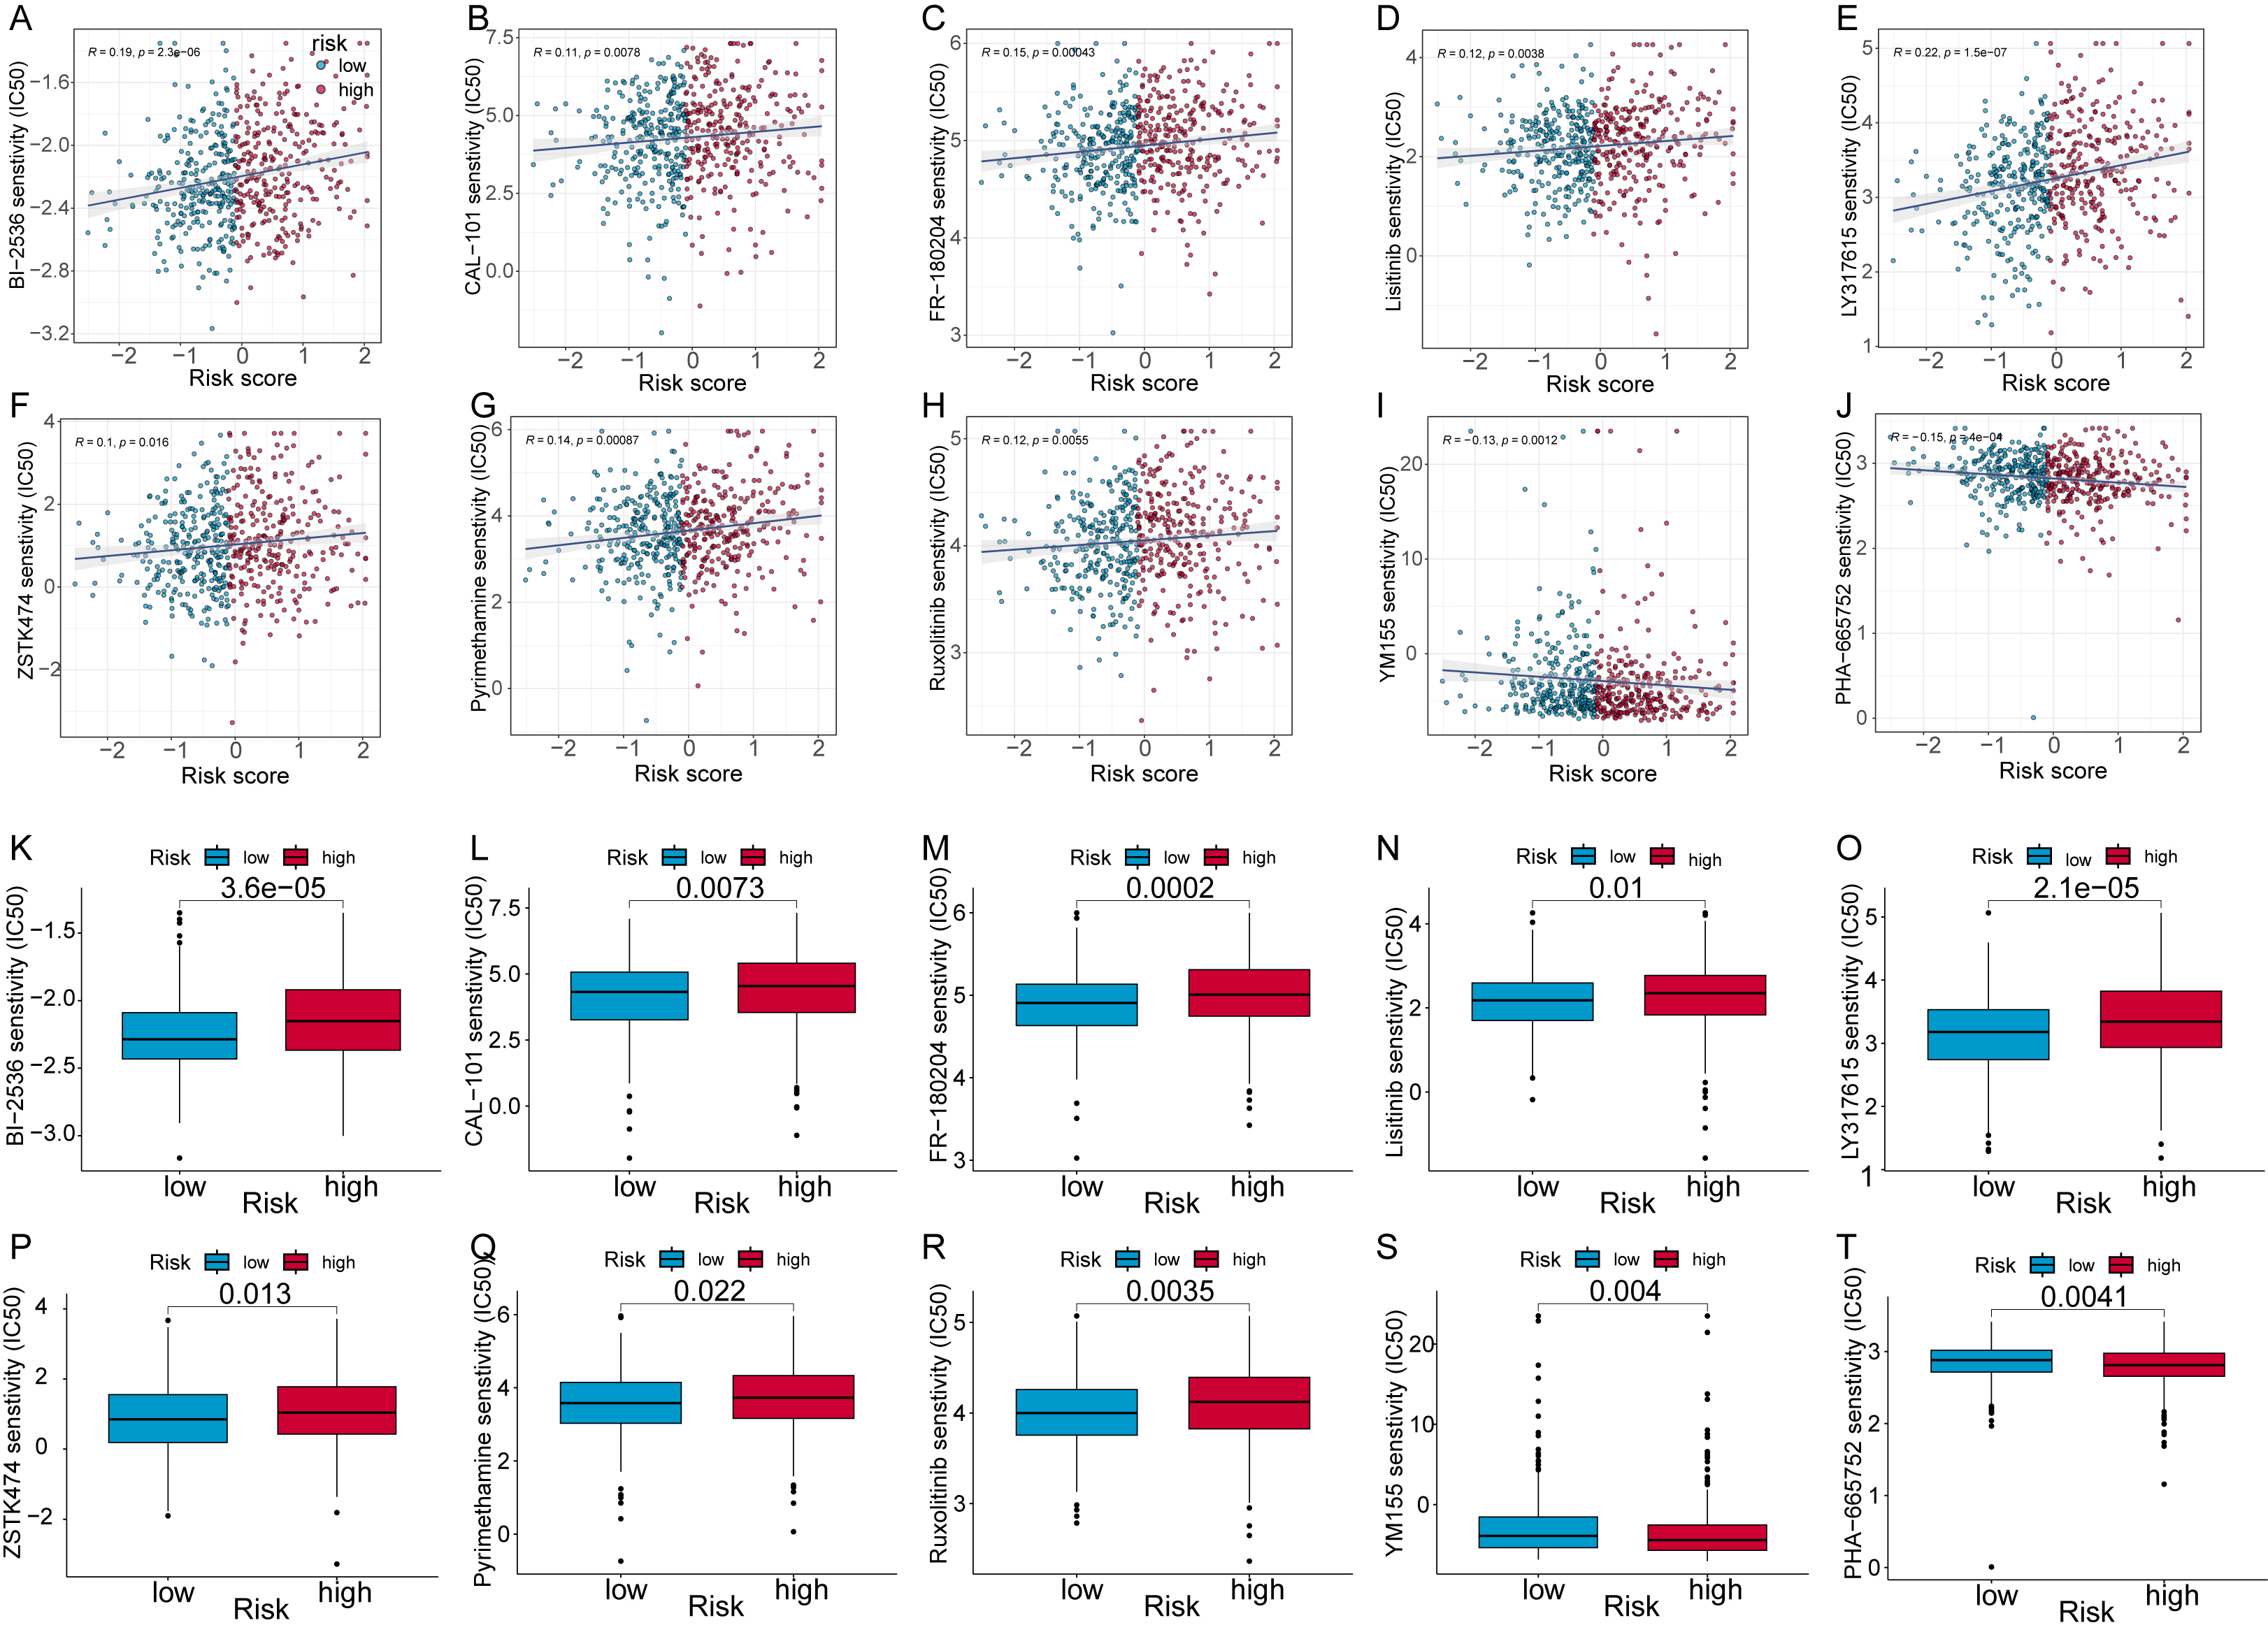 Fig. 8.
Analysis of CRC patient risk scores to predict small molecule
compounds. Scatter plots show the association of half-maximal inhibitory
concentration (IC
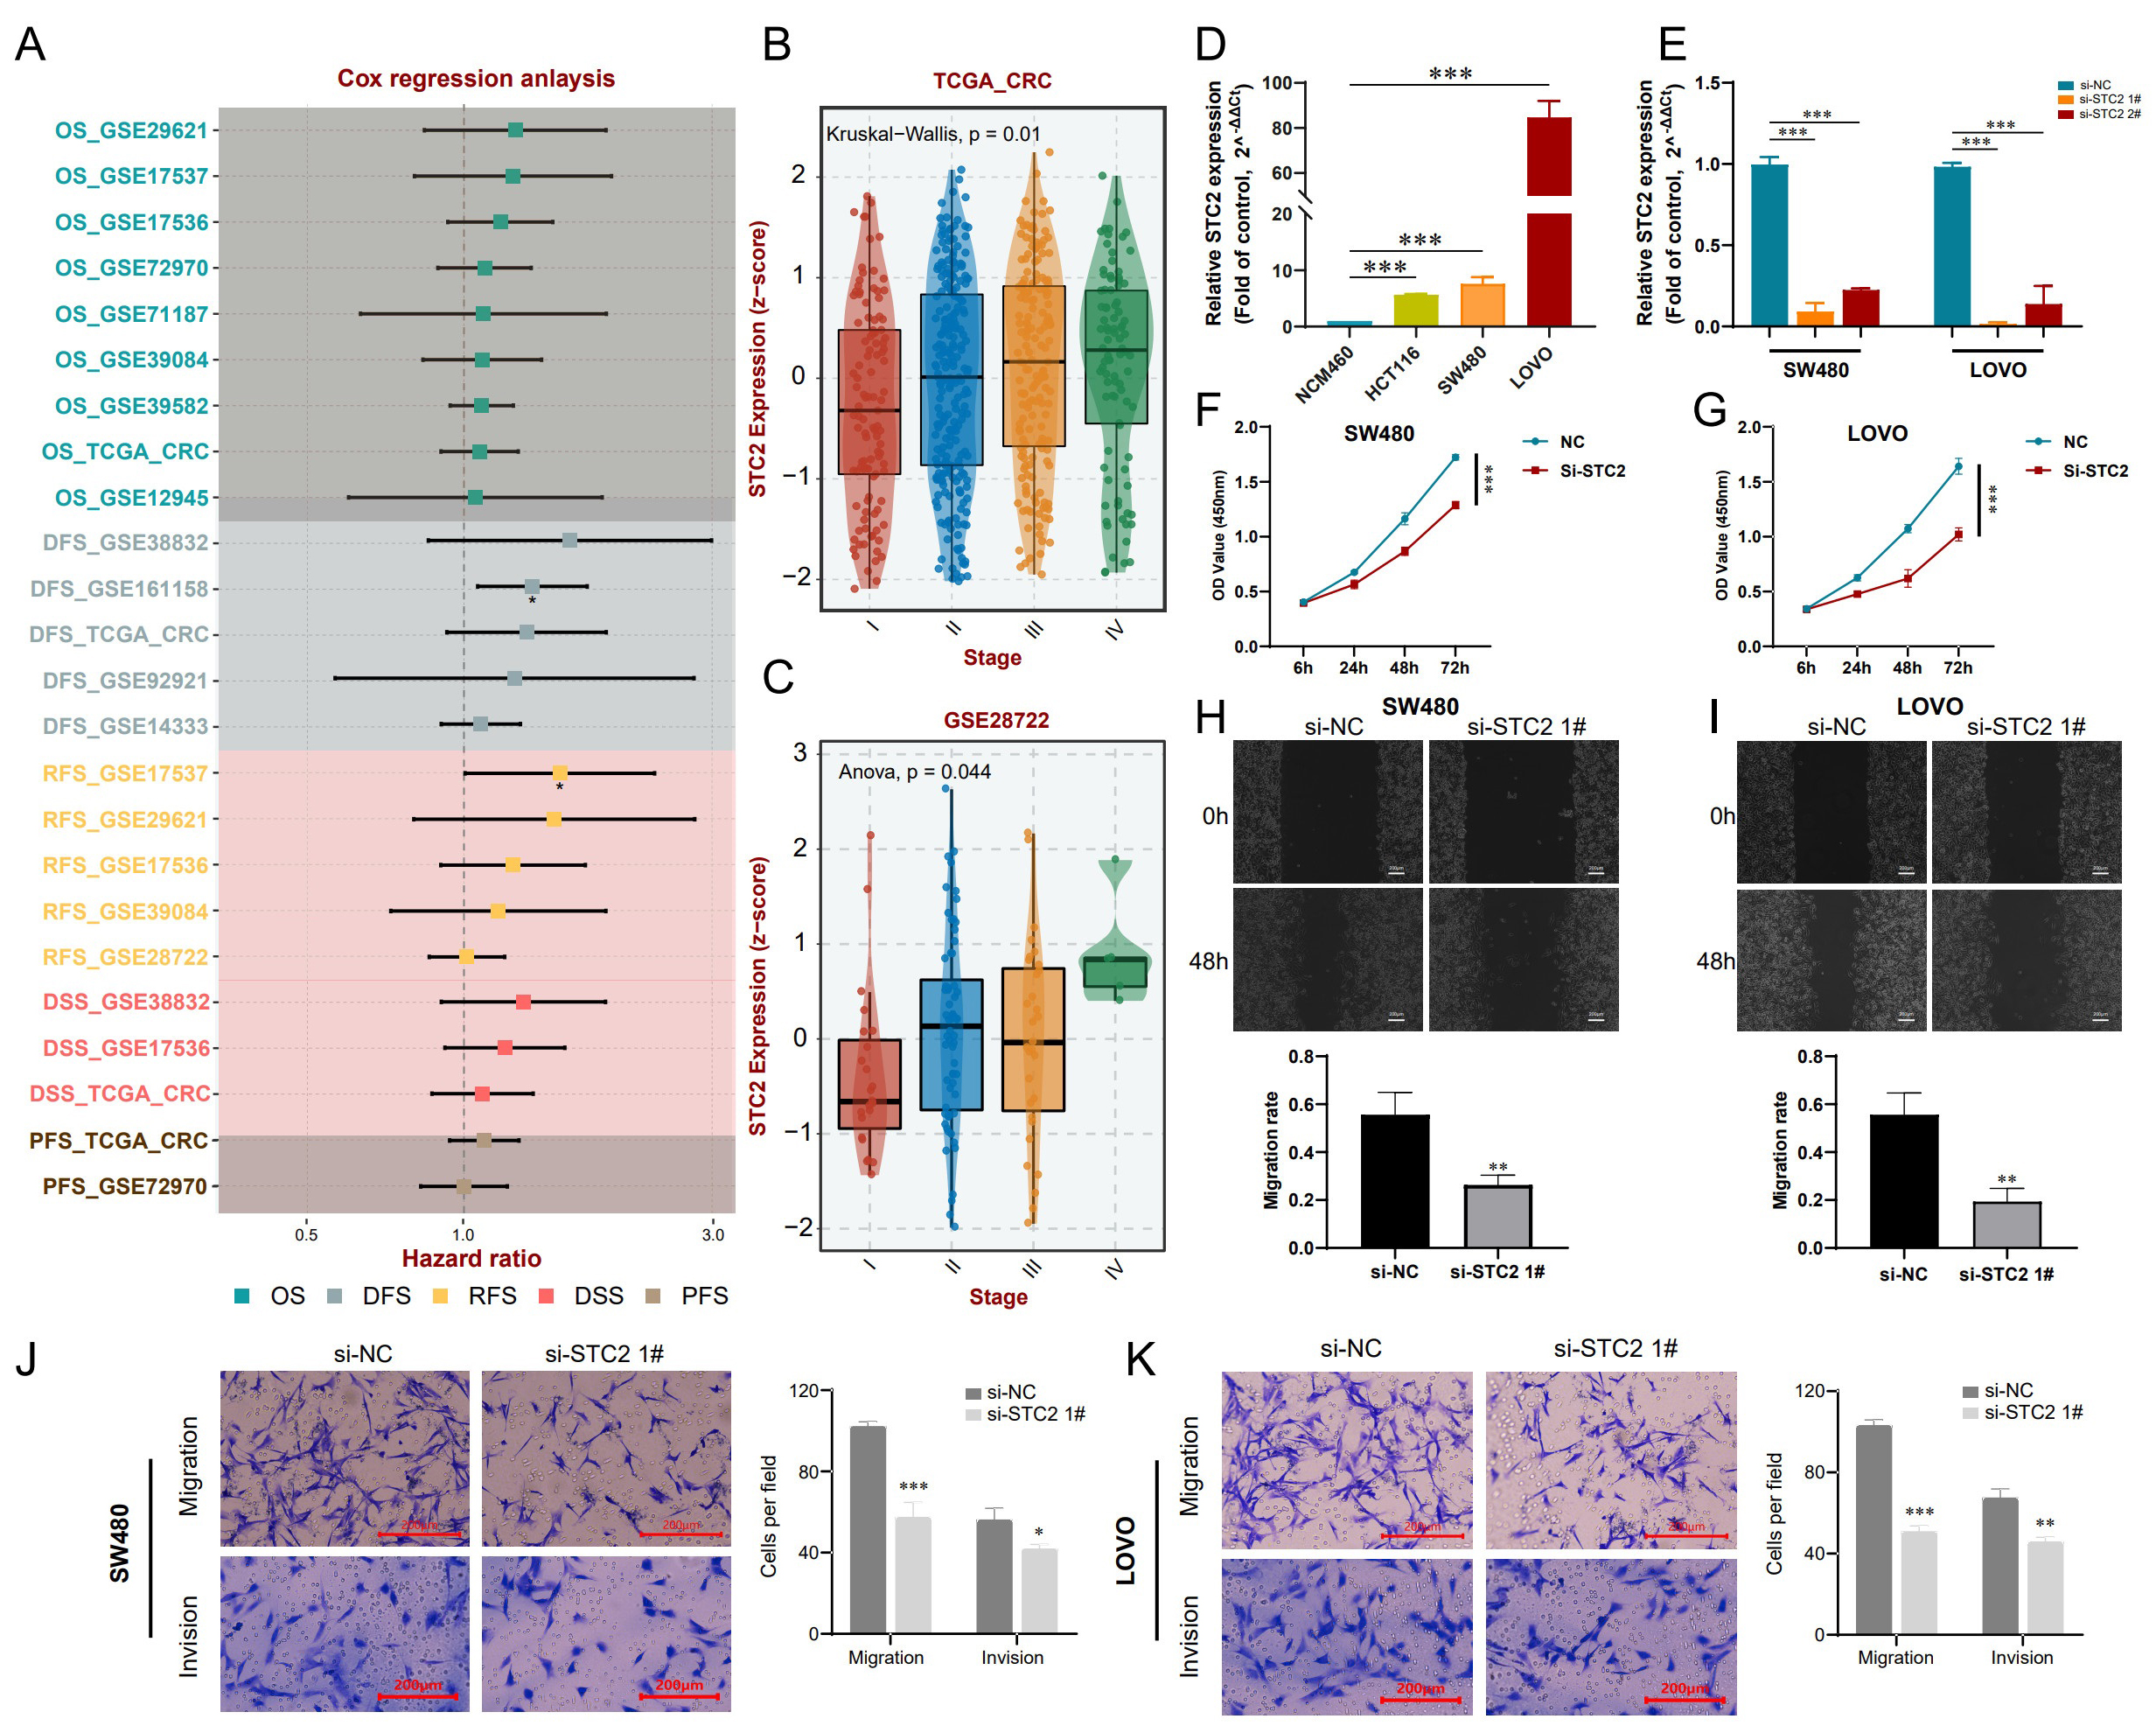
The TCGA results showed that all 7 hub CFSRGs were significantly upregulated in CRC tissues relative to normal tissues. Consistent with this, their expression was also higher in CRC cell lines compared to the normal cell line (Supplementary Fig. 4). Specifically, high expression of CXCL11, CCNF, EREG, EPHB2, and MMP3 correlated with better prognosis, whereas upregulation of STC2 and TIMP1 was associated with shorter survival time (Supplementary Fig. 4A–G). ROC analysis showed that STC2 (0.943) had a higher AUC value compared to TIMP1 (0.667) (Supplementary Fig. 4H,I). Furthermore, the high expression of STC2 was confirmed by qRT-PCR (Supplementary Fig. 4J). STC2 was therefore selected for subsequent cellular phenotyping experiments. Analysis of several GEO cohorts also confirmed that STC2 was upregulated in CRC tissues and was associated with worse prognosis (Fig. 9A,B). STC2 expression was further examined by IHC in 24 pairs of in-house clinical samples and found to be enhanced in CRC tissues compared with normal paraneoplastic tissues (Fig. 9C). Results in Supplementary Tables 5,6 show a strong correlation between STC2 expression and the pathologic characteristics of CRC patients. Thus, STC2 may serve as a biomarker of prognosis in CRC patients.
 Fig. 9.
SCT2 expression is upregulated in CRC tissues and is correlated
with poor outcomes. (A) Box plots showing significant up-regulation of
STC2 in CRC tissues from the 6 GEO cohorts. Comparison between groups
using the Wilcoxon test, with p
Cox analysis of the TCGA and GEO datasets showed that STC2 expression has significant prognostic value in CRC patients (Fig. 10A). STC2 expression was also positively correlated with pathological stage (Fig. 10B,C), and was highly expressed in three CRC cell lines (LOVO, SW480, and HCT116) compared to normal intestinal epithelial cells (NCM460) (Fig. 10D). In subsequent experiments, si-STC2-interfering plasmid and negative plasmid were transfected into SW480 and LOVO cells. qRT-PCR results showed that mRNA expression of STC2 was significantly decreased following transfection (Fig. 10E). Moreover, transfection with si-STC2 considerably decreased the proliferation rate of SW480 and LOVO cells, as determined by the CCK-8 assay (Fig. 10F,G). In addition, wound healing experiments showed that inhibition of STC2 effectively suppressed CRC cell migration compared to the controls (Fig. 10H,I). Transwell experiments also revealed that SW480 and LOVO cells had reduced migration and invasion ability following inhibition of STC2 (Fig. 10J,K). Based on these findings, we surmise that targeting of STC2 may be a novel approach for the treatment of CRC.
 Fig. 10.
Inhibition of STC2 suppresses the malignant properties of CRC
cells. (A) The hazard ratio for STC2 expression in CRC patients from
TCGA and GEO datasets was evaluated via Cox regression analysis. (B) Comparison
of different pathological stages of CRC from the TCGA based on the SCT2
z-score. Comparative analyses between groups via the Kruskal-Wallis test, with
p
Despite significant surgical advances in recent years, the overall clinical outcome of CRC patients remains unsatisfactory. Next-generation sequencing techniques have been used to identify genome alterations in various cancer types [26, 27]. However, effective prognostic biomarkers for CRC patients are still lacking. Many studies have shown that malignant features such as metastasis [28], angiogenesis [29], stemness [30], and inflammation [31] are strongly linked to the onset and progression of CRC. Nevertheless, the detailed molecular mechanisms involving cancer functional status during the progression of CRC remain unknown. In light of this, we reasoned that CFSRGs have been largely overlooked as possible prognostic indicators in CRC patients. The present study is the first in which a panel derived from cancer functional status genes was developed to predict the outcome of CRC patients. Furthermore, the risk score derived from this panel was validated in external datasets. Finally, STC2 expression in our cohort was evaluated using IHC, with the results suggesting that targeting of STC2 may improve clinical outcomes in CRC.
In this work, we developed a risk stratification panel for CRC patients based on 7 cancer functional status genes. Two external datasets were used to demonstrate the robustness of this novel 7-CFSRG panel. The independence of the risk score derived from the panel was demonstrated after adjusting for various clinical characteristics such as age, sex, and stage. Moreover, the 7-CFSRG panel showed good performance based on calibration curves and nomograms. CRC patients were classified into low- and high-risk groups corresponding to better and worse survival, respectively, and then characterized in further detail. Notably, the high-risk patients exhibited a functional status related to tumor progression, poor survival and high immune cell infiltration, amongst others. In contrast, low-risk patients were characterized by low cancer functional status, good prognosis, low immune cell infiltration, high cytotoxicity, and good response to immunotherapy. These findings support the individualized treatment of CRC patients. Moreover, IHC showed that STC2 was strongly up-regulated in CRC tissue and was a prognostic indicator of worse outcome in CRC patients. Inhibition of the proliferative, migratory, and invasive abilities of SW480 and LOVO cells following STC2 knockdown suggests that STC2 may be an innovative target for CRC therapy.
Seven CFSRGs (EPHB2, CCNF, EREG, TIMP1, CXCL11, STC2, MMP3) were selected for integration and construction of the risk panel for CRC patients. EPHB2 is a crucial member of the EPH receptor family and shows abnormal expression in many cancer types, including CRC, gastric cancer, and hepatocellular carcinoma [32]. Upregulation of EPHB2 expression correlated with worse prognosis. Ephb2 is known to promote cancer stem cell proliferation and resistance to sorafenib by driving the SRC/AKT/GSK3 signaling cascade. In contrast, knockdown of EPHB2 significantly reversed this phenotype [33]. The differentiation of intestinal mucosa stem cells is controlled by Epha22 and EPHB. Moreover, the EPHB2-stem regulatory network contributes synergistically to the progression of advanced cancer, thus serving as a prognostic biomarker for CRC [34]. The current study confirmed the upregulation of EPHB2 expression in CRC tissues, suggesting it could represent a possible therapeutic target. A close relationship has been reported between CCNF and cancer progression [35]. A mutation in IDH1 gives rise to the oncogenic variant IDH1R132H. CCNF induced by metabolic stress can attenuate the oncogenic function of IDH1R132H in an RBPJ-dependent manner [36]. A previous study also reported that CCNF may be a risk factor for CRC [37]. Epiregulin (EREG) is a ligand for the epidermal growth factor receptor (EGFR) and is expressed at low levels in most normal tissues. However, high expression of EREG can exert an oncogenic effect by activating the EGFR signaling pathway [38, 39]. Ma et al. [40] reported that TIMP1 increases the cell proliferation potential and invasiveness of right-sided colon cancer via FAK/Akt signaling. Intriguingly, EV-derived Timp-1 is a non-invasive, independent prognostic marker for CRC liver metastasis [41]. Inflammatory bowel disease (IBD) is a potential risk factor for CRC, and CXCL10 and CXCL11 are biomarkers of carcinogenesis associated with colitis [42]. A SNP in the gene promoter of MMP3 is a risk factor for CRC, while MMP3 is also a biomarker of CRC metastasis [43, 44]. The upregulation of STC2 in CRC may be a promising biomarker given the well-known clinical and pathological significance of this gene [45, 46, 47]. Despite this, the oncogenic role of STC2 in CRC remains largely unknown, although our results confirm that STC2 is a prognostic factor for CRC, consistent with previous studies. Importantly, inhibition of STC2 significantly hindered the malignant progression of CRC cells, suggesting the possibility of targeting this gene.
Tumor development, recurrence, metastasis, and treatment response are significantly influenced by the interaction between cancer cells and the TME [48]. Current evidence suggests that both innate (dendritic cells, macrophages, natural killer cells) and adaptive (B and T cells) immune cells play a role in tumor progression. Cancer cells and proximal immune cells ultimately interact to generate a pro-cancer microenvironment [49]. Our results showed the 7-CFSRG risk score was strongly linked to a variety of immune cells, with a higher macrophage score in high-risk patients compared to low-risk patients. Extensive research has established that tumor-associated macrophages (TAMs) are active and abundant in cancer. These inflammatory cells infiltrate the TME and affect tumor cell proliferation, invasiveness, migration, angiogenesis, and immunosuppression [50]. Nevertheless, clinical evidence for a specific role of TAMs in CRC remains ambiguous. The high-risk group in the present study had elevated stromal scores and lower immune scores compared to the low-risk group, suggesting that immunotherapy could be less effective in these patients. By integrating expression profiles associated with T cell dysfunction and exclusion, the TIDE computational approach simulates tumor immune evasion and predicts the clinical response to ICB [25]. We calculated TIDE scores for the high- and low-risk groups in order to predict how CRC patients might respond to ICB. A marked difference in TIDE scores was found between these groups, with the low-risk group likely to be more sensitive to ICB treatment. The 7-CFSRG risk panel developed here could therefore assist with clinical treatment decision-making.
We also calculated IC
Despite the positive findings, there are several limitations to this study. First, more large in-house cohorts are needed to verify the potential clinical utility of the 7-CFSRG risk stratification panel. Second, we could not assess the performance of different risk combinations in our CRC cohort due to insufficient follow-up information. Third, we have only preliminary evidence that STC2 plays a role in CRC progression based on in vitro experiments. Finally, elucidation of the molecular mechanisms involving the remaining CFSRGs will require further in vitro and in vivo experiments.
We developed a cancer functional status-based model to predict CRC patient outcome. This model reflects the infiltrating immune cell and TME landscape, and can also suggest latent compounds for the treatment of CRC. The overexpression of STC2 in CRC was demonstrated by IHC and its oncogenic role validated in preliminary in vitro studies. The STC2 biomarker may help to improve therapeutic decision-making for CRC patients.
Data are supporting the conclusions of this study included in the article and its Supplementary files. Other public data were obtained from TCGA (https://portal.gdc.cancer.gov/), GEO (https://www.ncbi.nlm.nih.gov/geo/), CancerSEA (http://biocc.hrbmu.edu.cn/CancerSEA/), Metascape (https://metascape.org/gp/index.html), GSCA (http://bioinfo.life.hust.edu.cn/GSCA/#/), and GDSC (https://www.cancerrxgene.org/).
HSC conceptualized and designed the study. XL and NJW carried out the bioinformatics analysis and cell experiments, and wrote the original manuscript. HSC contributed to supervising and editing, as well as funding support. All authors contributed to editorial changes in the manuscript. All authors read and approved the final manuscript. All authors have participated sufficiently in the work and agreed to be accountable for all aspects of the work.
The Ethics Committee of the Fourth Affiliated Hospital of Harbin Medical University approved this study (No. 2023-LLSC-04). All patients were fully informed and provided written consent. The current study complies with the provisions outlined in the Helsinki Declaration.
We also thank Figdraw 2.0 (https://www.figdraw.com/) and OmicStudio (https://www.omicshare.com/tools/) for the preparation of Figures.
This work was supported by the Natural Science Foundation of Heilongjiang Province (No. H201425), and the project “Epigenetic mechanisms by which chemokines promote invasive metastasis in colorectal cancer” (No. 2021003).
The authors declare no conflict of interest.
References
Publisher’s Note: IMR Press stays neutral with regard to jurisdictional claims in published maps and institutional affiliations.