


 , Jason Dictenberg 1,2,3,*
1 Department of Biological Sciences, Hunter College, City University of New York, New York, NY 10065, USA
2 Biology Program, The Graduate School and University Center of the City University of New York, New York, NY 10016, USA
3 SUNY Downstate Medical Center and AccelBio Labs, Brooklyn, NY 11226, USA
Abstract
Spatial-temporal control of mRNA translation in dendrites is important for synaptic plasticity. In response to pre-synaptic stimuli, local mRNA translation can be rapidly triggered near stimulated synapses to supply the necessary proteins for synapse maturation or elimination, and 3′ untranslated regions (UTRs) are responsible for proper localization of mRNAs in dendrites. Although FISH is a robust technique for analyzing RNA localization in fixed neurons, live-cell imaging of RNA dynamics remains challenging.
In this study, we optimized existing RNA visualization techniques (MS2-tagging and microinjection of fluorescently-labeled mRNAs) to observe novel behaviors of dendritic mRNAs.
We found that the signal-to-noise ratio (SNR) of MS2-tagged mRNAs was greatly improved by maximizing the ratio of the MS2-RNA to MS2 coat protein-fluorescent protein (MCP-FP) constructs, as well as by the choice of promoter. Our observations also showed that directly fluorescently labeled mRNAs result in brighter granules compared to other methods. Importantly, we visualized the dynamic movement of co-labeled mRNA/protein complexes in dendrites and within dendritic spines. In addition, we observed the simultaneous movement of three distinct mRNAs within a single neuron. Surprisingly, we observed splitting of these complexes within dendritic spines.
Using highly optimized RNA-labeling methods for live-cell imaging, one can now visualize the dynamics of multiple RNA / protein complexes within the context of diverse cellular events. Newly observed RNA movements in dendrites and synapses may shed light on the complexities of spatio-temporal control of gene expression in neurons.
Keywords
- mRNA
- MS2
- microinjection
- localization
mRNAs are localized to subcellular domains in neurons as a mechanism to facilitate localized gene expression and functional targeting of proteins [1, 2]. Recent methods to detect mRNAs have expanded greatly, yet the use of live-cell imaging to study mRNA dynamics remains limited [3]. Previous work using the bacteriophage-derived MS2-MS2-Coat Protein (MCP) system to detect dynamic fluorescent protein-labeled mRNAs in living cells has demonstrated diverse aspects of RNA biology [4, 5]. Yet many reports indicated that the signal-to-noise ratio (SNR) is too low to reliably detect RNA movements, given the instantaneous velocities of RNA granules at greater than one micrometer per second [6]. The local translation of mRNA is critical for many forms of synaptic plasticity [7], and a better understanding of mRNA dynamics in dendrites is required. Both the MS2 tagging and microinjection methods have been used to a limited degree to detect neuronal mRNA dynamics, with the MS2 tagging being a more readily available approach [8]. However, there remain several obstacles to imaging mRNAs in living neurons [5]. Therefore, to gain a deeper understanding of mRNAs trafficking in cells, improved detection methods are required.
Several reports have applied microinjected fluorescently-labeled mRNAs to track
their movements in dendrites [9, 10]. However, successful use of this method
requires specialized equipment and training, and yet still, mRNAs synthesized
in vitro may not recapitulate dynamics similar to their endogenous
counterparts. Notwithstanding these caveats, microinjected RNAs have shown the
capability to form particles and undergo nuclear-cytoplasmic shuttling in live
cells [11]. Alternatively, the MS2 system, which utilizes genetic encoding of MS2
mRNAs, allows for single particle tracking [8, 12] and has been used to study
mRNAs such as Calcium/Calmodulin-dependent protein kinase type II subunit alpha
(CaMKII
We sought to improve the SNR of the MS2 system in neurons to better observe mRNA dynamics, given how few RNAs have been imaged in dendrites, and compared this to an improved microinjection method. We showed that the choice of promoter and ratio of RNA to fluorescent protein construct are critical to use MS2 successfully. Unexpectedly, we also observed that the majority of significantly displaced mRNAs are the smallest and dimmest ones detected. By optimization of both MS2 and microinjection methods, we observed mRNAs moving actively into and out of synapses, as well as splitting off from larger granules, and that they co-transport with their cognate mRNA-binding proteins (RBPs) in dendrites. We characterized the mRNAs and demonstrated that they fell into three distinct sizes, the smallest of which actively transports in dendrites with multiple copies of diverse mRNAs.
FVB/129 mice of either sex were kept in a controlled environment. Animal facility protocols were approved by the Institutional Animal Care and Use Committee (IACUC). Mice were housed in the American Association for Laboratory Animal Science (AALAC)-approved animal facility at Hunter College. Mice were bred between two and twelve months old. One male and four female mice were breeding together after maturity. Low-density–dissociated neuronal cell cultures were prepared as described from postnatal day 0 (P0) pups. As described in reference [4], after P0 pups were decapitated, hippocampi from P0 mice were separated from the rest of the brain, collected, and digested with trypsin for 15 minutes, and dissociated in the plating medium (minimum Eagle’s medium, 10% fetal bovine serum, 10 mM HEPES, 33 mM glucose) with glass pipettes and plated at low density (25,000 cells/cm2) on poly-l-lysine–coated (0.1 mg/mL) 1-well chambers (Ibidi). Two hours after plating, the plating medium was replaced with maintenance medium (astrocytes-conditioned Neurobasal/ B27/GlutaMAX). 48–72 hours after plating, if required, 1-β-d-arabinofuranosylcytosine (AraC) was added to a final concentration of 2.5 μM to curb glial proliferation. Arac eliminates all actively dividing cells, leaving only neurons in the culture. Also, neurons are identified in the experiments using standard techniques of microtubule associated protein 2 (MAP2) staining.
The MS2-RNA plasmids consisted of the LacZ coding sequence, 8x MS2-binding sites and 3′ Untranslated Regions (3′ UTR) as indicated (“MS2-RNA”; LacZ(CDS)-8xMS2-3′UTR; ~12,000 bp plasmid length). The MCP-FP plasmid consisted of a Nuclear Localization Signal (NLS) followed by HA followed an MS2 Coat Protein (MCP)-TagRFP fusion (“MCP-RFP”; ~6600 bp plasmid length) (sequences provided in Supplementary Material 1). For experiments using a 1:3 mass ratio of MCP-FP:MS2-RNA, 500 ng of MCP-RFP and 1500 ng of MS2-RNA plasmids were used. For experiments using a 1:9 mass ratio, 225 ng of MCP-FP and 2025 ng of MS2-RNA plasmids were used. Neurons were transfected between 4 and 7 days in vitro (DIV) using Lipofectamine LTX (Invitrogen, Waltham, MA, USA), following the manufacturer’s recommendations.
Immunostaining was performed as described [17]. Antibodies against Tau (Abcam,
Cambridge, UK) and microtubule associated protein 2 (MAP2) (Sigma, St. Louis, MO, USA) were used. Alexa Fluor-488,
-546, and -647 goat anti-mouse, rabbit, and goat IgG (Invitrogen) were used as
secondary antibodies. Neurons were fixed (4% paraformaldehyde in 1
For microinjection experiments, 200 ng of PCR-amplified DNA was used as the template for in vitro transcription under T7 RNA Polymerase (T7 MegaScript Kit; Life Technologies, Waltham, MA, USA), using a 1:4 ratio of UTP to 5-(3-aminoallyl)-UTP (aaUTP). A total of 10 µg of aaUTP-labeled RNA was conjugated with Alexa Fluor-succinimidyl ester dyes (Alexa Fluor Decapack Set; Life Technologies, Waltham, MA, USA), purified, and the injection solution was diluted to 200–300 ng/µL before injection into the nucleus. The RNA was centrifuged at full speed for 15min and immediately loaded into the injection capillary. Eppendorf Injectman NI2 and FemtoJet were used with Eppendorf Femtotips injection capillaries (Eppendorf, Hamburg, Germany); injection was performed at 120–140 hPa injection pressure, 20 hPa compensation pressure and 0.1–0.3 sec injection time. Neurons were allowed to recover from microinjection for at least 30min before imaging.
Mouse primary hippocampal neurons were plated in chambered coverglass. Chambers were kept at 37 °C during the experiment, and CO2 and humidity were maintained with the TOKAI HIT microscopy (TOKAI HIT USA Inc., Bala Cynwyd, PA, USA) closed-stage incubation system. Images were acquired with a Nikon Eclipse Ti inverted microscope and were converted into videos using NIS-Elements software (Nikon, Tokyo, Japan).
The stationary images were captured using 0.1-µm Z-steps in three
dimensions on a Nikon ECLIPSE TE200-U–inverted fluorescence microscope with a
60
The one-way analysis of variance was performed on experiments with multiple
groups. If multiple comparisons were required, Tukey’s multiple comparisons test
was carried out. For p-value significance, * denotes p
To accomplish this study, we needed to significantly improve the transfection efficiency since this was the rate-limiting step in our efforts to image RNAs with MS2 in primary hippocampal neurons. We co-transfected CFP (driven by cytomegalovirus (CMV) promoter) with MS2-RNA as a marker for transfected cells and tested several transfection protocols. To our surprise, the greatest factor improving transfection of neurons was the presence of dividing glia, as the omission of the routine primary neuronal additive cytosine arabinoside (AraC, to prevent glial proliferation) yielded ~3-fold higher transfection rates (Fig. 1A). This was in the presence of a similar density of neurons as demonstrated by Tau staining (Fig. 1B). Given the abundance of transfected glial cells, we developed plasmids that carry the Synapsin promoter to drive the expression of fluorescent proteins exclusively in neurons but not glial cells (Fig. 1C).
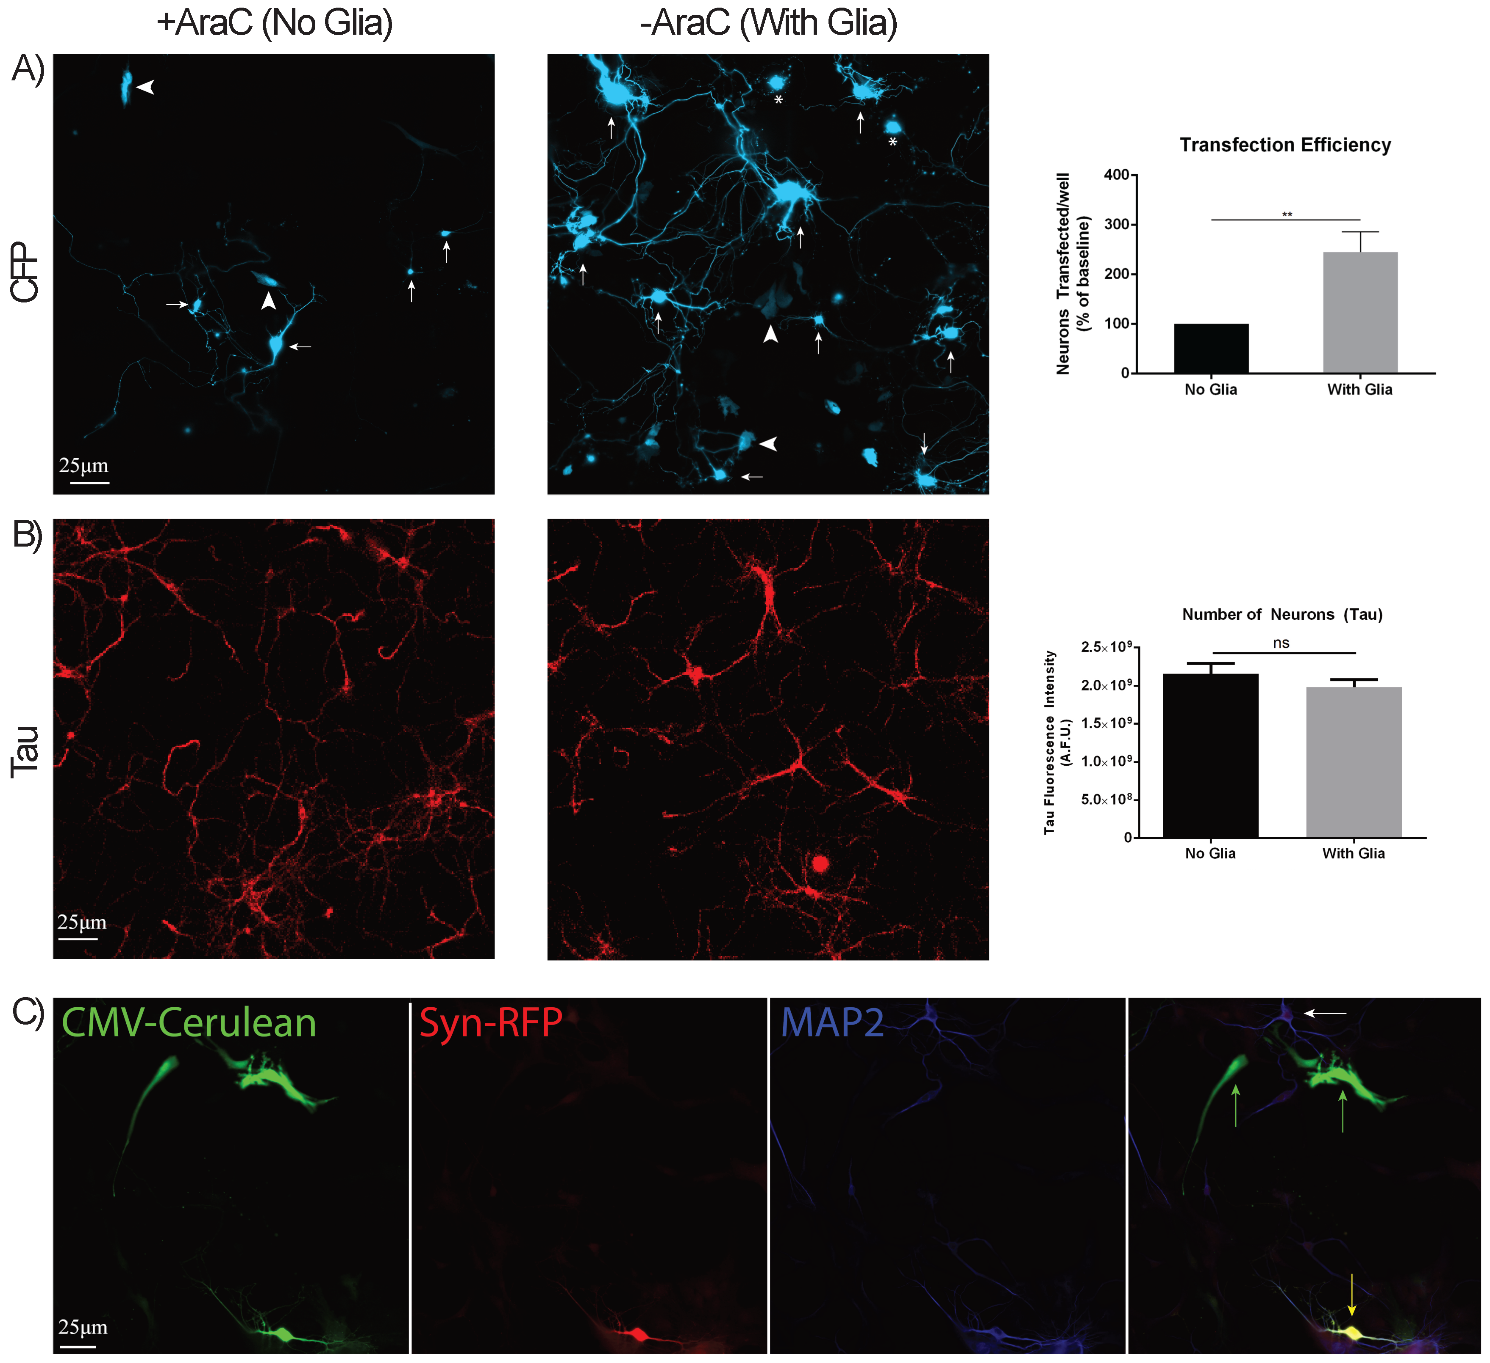 Fig. 1.
Optimization of transfection conditions. (A) Neurons were
transfected with CFP in the absence or presence of glial cells; transfected
neurons were manually counted (arrows) and quantified (N = 8 separate
transfections). Transfected glial cells (arrowheads) and non-viable neurons
(asterisk) were not included. The transfection efficiency of neurons in the
presence or absence of glial cells was plotted (right). (B) Neuronal
cultures were stained for Tau and quantified in the absence or presence of glial
cells. The number of neurons found in the presence or absence of glial cells was
plotted (right). (C) Neuronal cultures were co-transfected with Cerulean
(driven by cytomegalovirus (CMV) promoter) and RFP (driven by the mouse Synapsin promoter), fixed,
and stained for microtubule associated protein 2 (MAP2). Images show Cerulean+ glial cells (green arrows) and
Cerulean+RFP+ neurons (yellow arrow), as confirmed by the colocalization of RFP
and MAP2. White arrow denotes an untransfected neuron. ** denotes p
We found that a critical aspect of MS2-RNA labeling requires optimizing the
expression of the MS2 Coat Protein-Fluorescent Protein (MCP-FP) relative to the
MS2-RNA (Fig. 2A). This aspect has been highlighted previously [4]. Without the
optimal ratio of expression, too few or no visible granules are formed, with
diffuse MCP-FP background obstructing visualization. To optimize the MS2-RNA
labeling system, we made some improvements on three parameters that affect
MS2-RNA granule formation: the MCP-FP:MS2-RNA ratio; MS2-RNA promoter; and MCP-FP
promoter. To assess the effects of a given parameter on RNA granule
visualization, we quantified the number and brightness of the motile population,
which were small RNA granules (
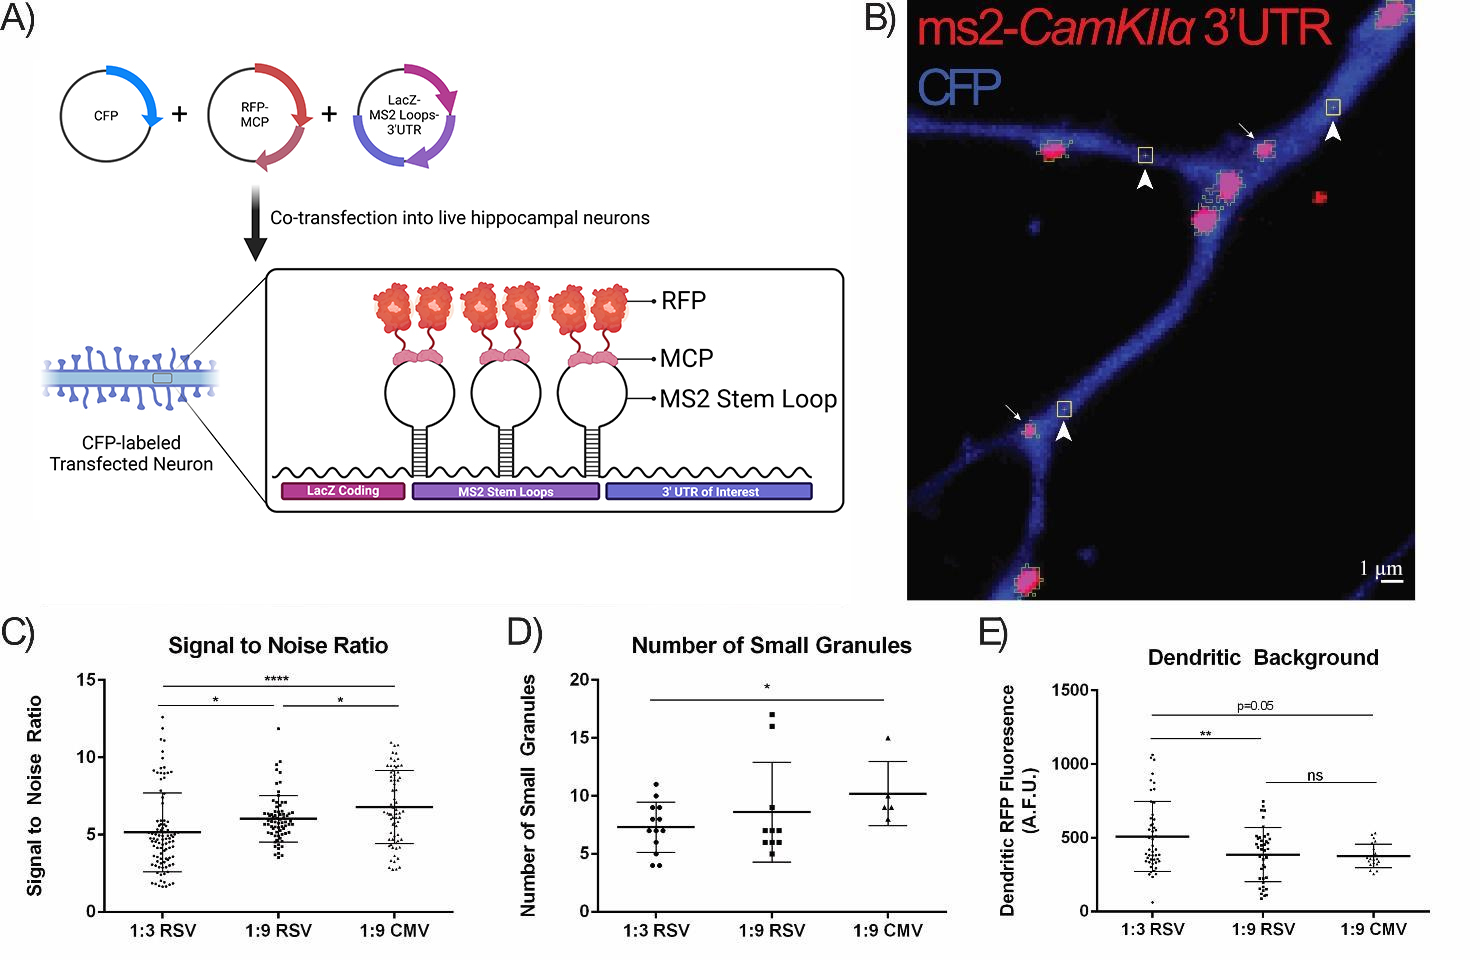 Fig. 2.
Optimization of the MCP-FP:MS2-RNA Ratio and MS2-RNA Promoter.
(A) Schematic of the MS2-RNA MCP-FP system. Three plasmids are co-transfected into primary living neurons: a CFP-expression plasmid to identify transfected cells; a LacZ-MS2 RNA stem-loop fused to an mRNA sequence of interest; and an MCP-RFP fusion protein that binds to the MS2 stem-loop-containing mRNAs. RNA granules are thus visualized in living cells. Created with BioRender.com. (B) Neurons were co-transfected with the
MS2-CamKII
Firstly, we compared the different ratios of MCP-RFP (red fluorescent protein):MS2-RNA using an established dendritic mRNA 3′ UTR reporter,
CaMKII
We next assessed the effects of the promoter driving the MCP-RFP on RNA granule
visualization and found it to be of critical importance. While most reports using
the MS2-RNA labeling system use the CMV promoter to drive MCP-FP [1, 18], we
found that this promoter leads to a vast excess of MCP-RFP in dendrites which
results in a very high dendritic background that obstructs RNA granule
visualization. MCP-RFP driven by weaker promoters such as Ubiquitin (Ubc) or
Synapsin (Syn) exhibited a ~50% decrease in the dendritic
background when compared to MCP-RFP driven by the CMV promoter (Fig. 3A,B, Ubc
vs. CMV and Syn vs. CMV). Furthermore, the MCP-RFP brightness
in the nucleus was quantified as a means to assess the amount of excess MCP-RFP
within a neuron under the different promoters since the MCP-RFP contains a
nuclear localization signal (NLS) that sequesters free MCP-RFP back to the
nucleus. This analysis showed that neurons expressing MCP-RFP under the CMV
promoter had a 3-fold and 10-fold higher nuclear MCP-RFP fluorescence than those
using the Ubc or Syn promoters, respectively (Fig. 3C,D, Ubc vs. CMV
and Syn vs. CMV). These weaker promoters resulted in a 50% reduction in
the number of large RNA granules (
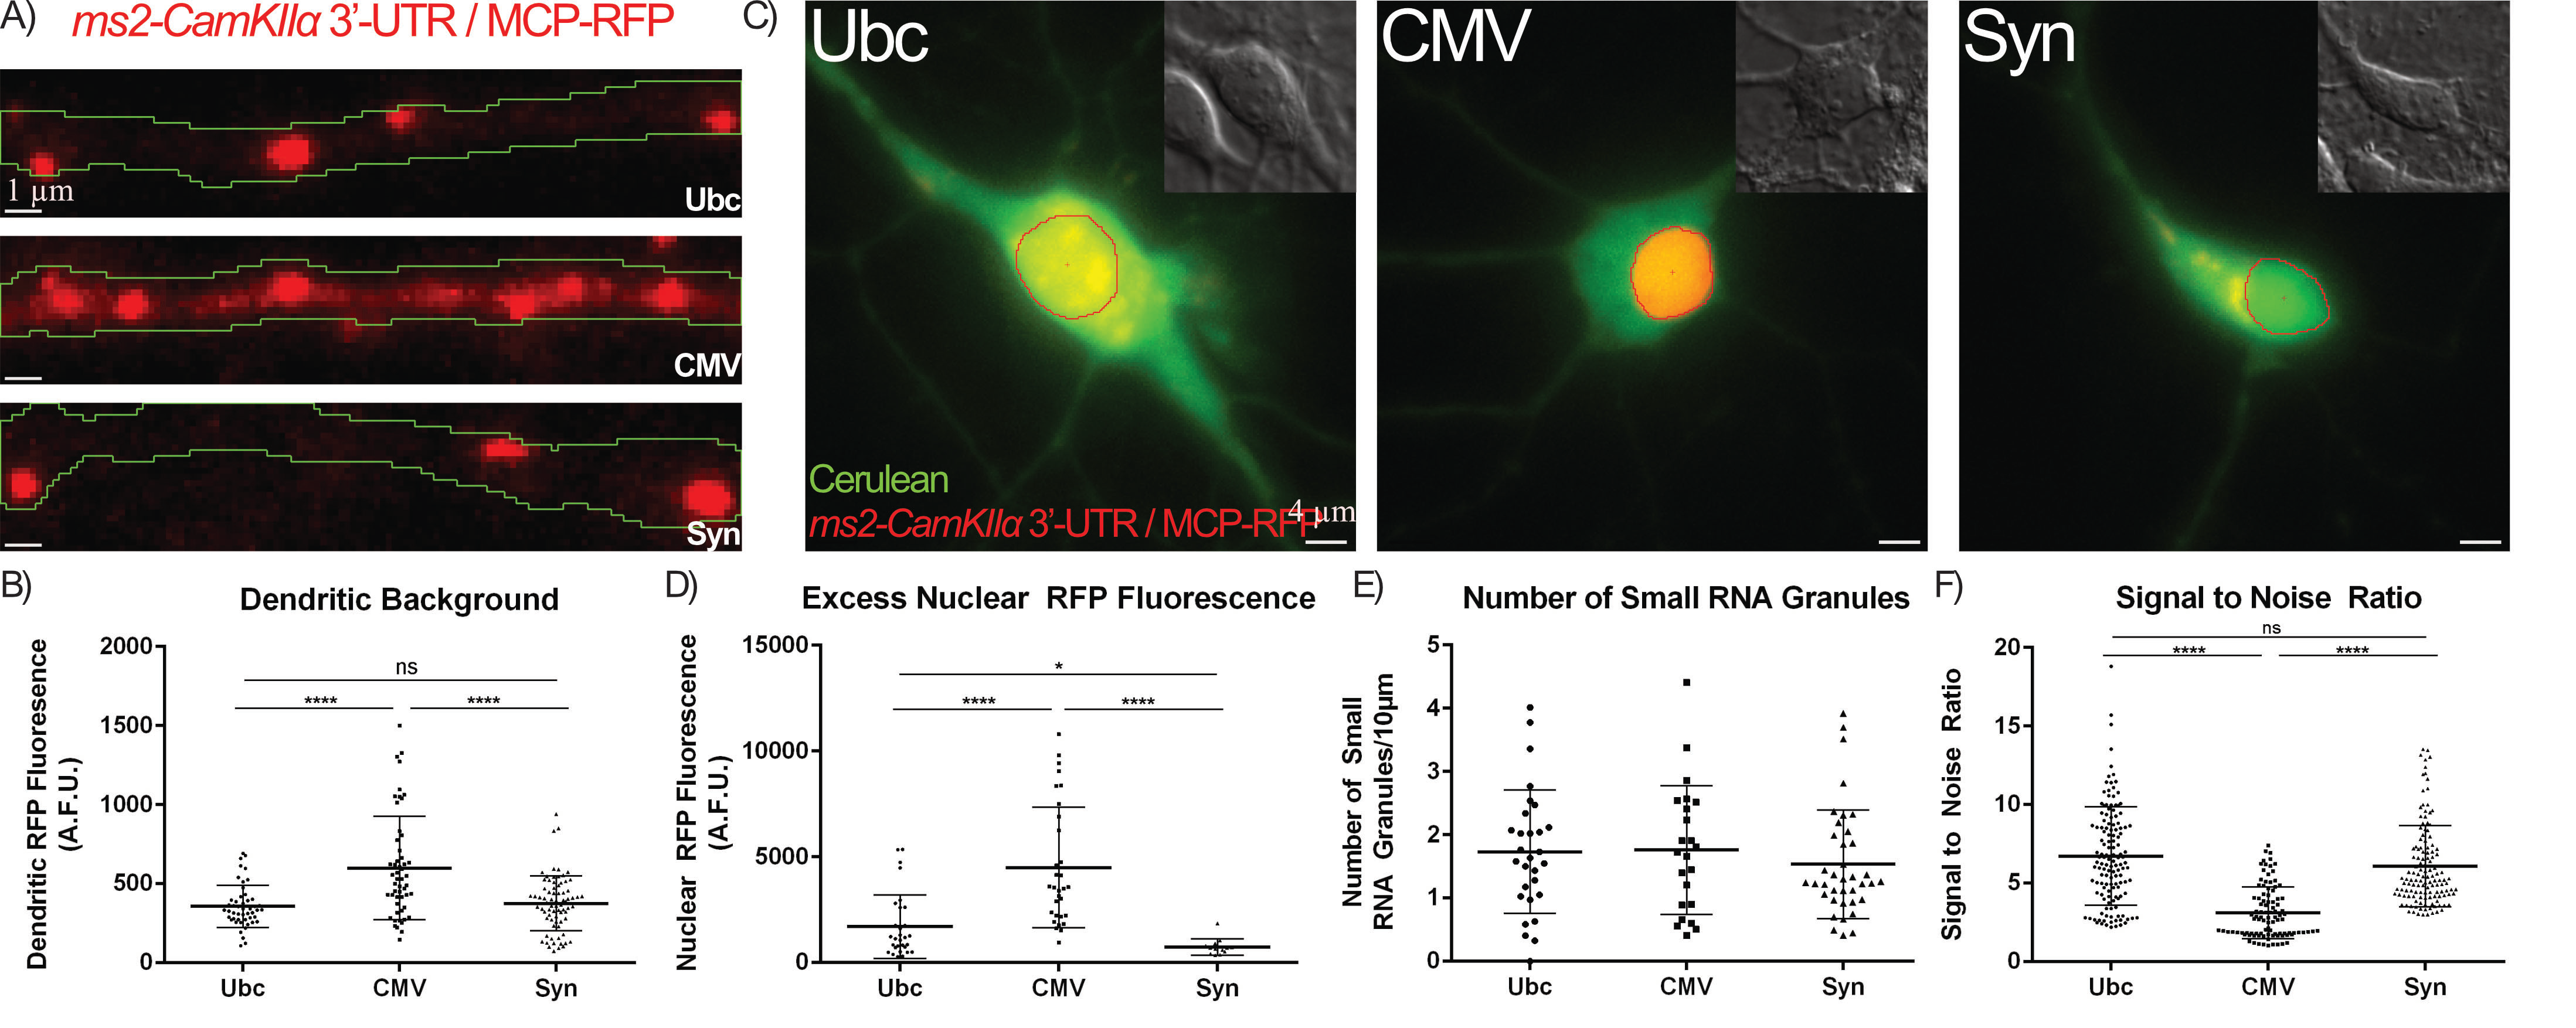 Fig. 3.
Optimization of the MCP-FP Promoter reduces MCP-FP background
and improves SNR. (A,B) Neurons were transfected with the
MS2-CamKII
Other reports have successfully used microinjected mRNAs in neurons to track
granules [19]. Therefore, we compared the optimized MS2 system to microinjected
fluorescently labeled mRNAs. The mRNAs were microinjected into the nucleus, where
they were initially restricted, and then were accumulated at the cell body of
hippocampal neurons (Fig. 4A,B). Microinjected mRNAs in dendrites exhibited
~100% higher SNR over MS2-RNAs with Syn-MCP-RFP and
~300% higher than MS2-RNAs with CMV-MCP-RFP (Fig. 4C). In
addition, microinjected neurons exhibited 2-fold more small moving granules in
dendrites, although there were also 2-fold large (
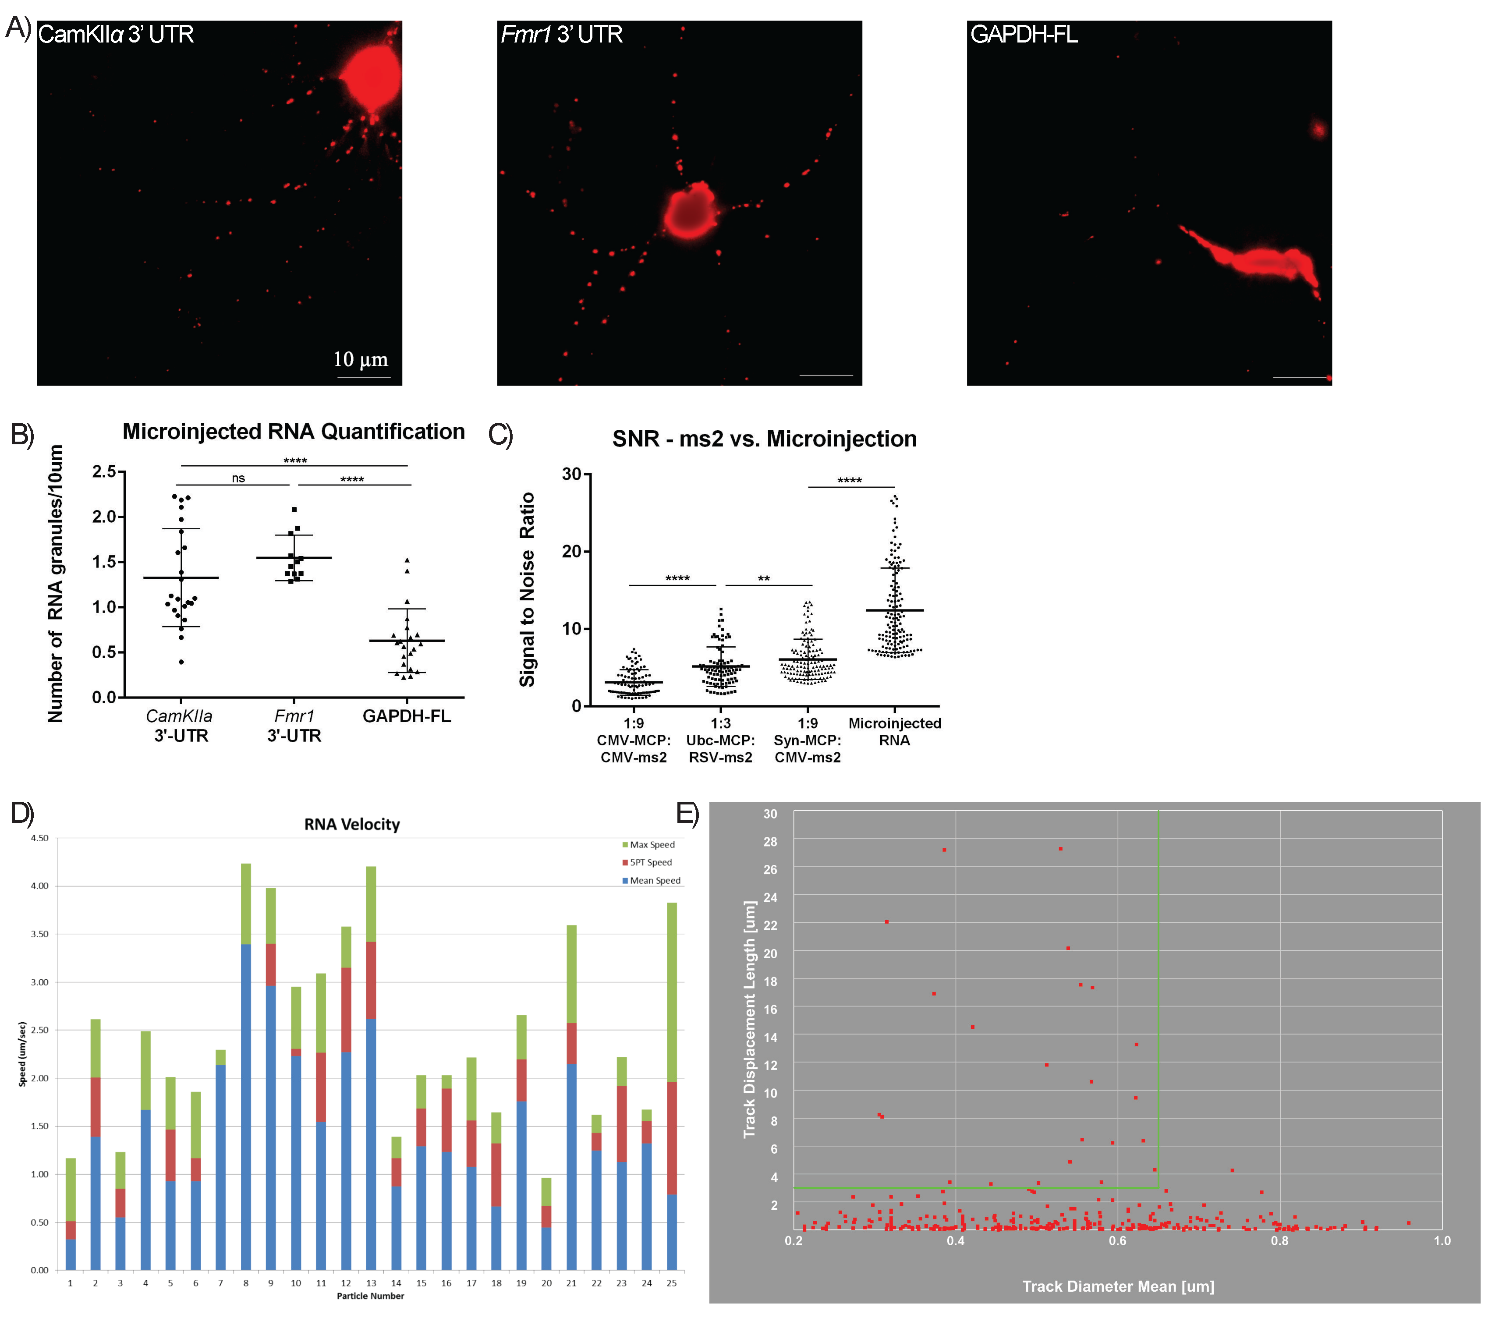 Fig. 4.
Microinjected RNAs show increased SNR and are motile. (A)
Representative images of neurons microinjected with Alexa Fluor 555-labeled
CamKII
Given the increased number of motile mRNA granules that microinjected neurons
exhibited, as well as improved SNR, we aimed to use both microinjected and MS2
techniques to observe novel RNA dynamics in a time-lapse manner, notwithstanding
the caveat that microinjected mRNAs may not undergo the same nuclear processing
as endogenous counterparts and therefore, may not function as similarly as those
genetically encoded like MS2-RNAs. To test the fidelity of microinjected mRNAs,
several established localized mRNAs were microinjected, which exhibited granular
dendritic motility (Fig. 4A,B). These included the 3′ untranslated regions
(UTRs) of CaMKII
Using RNA granule-tracking software (Imaris, Abingdon, United Kingdom), we observed that the number of smaller granules, i.e., ones that had diameters of 0.250–0.625 µm and showed processive movements greater than 3 µm, represented the majority of motile RNA granules. Larger granules of 0.625–1.0 µm were more sparsely observed and were less motile, with oscillatory movements, typically less than 3 µm net displacements (Fig. 4E). Highly motile small granules often merged with these larger granules briefly before moving further in subsequent frames. Many small granules paused within these larger complexes on their trajectory. Most microinjected RNA granules exhibited speeds of more than 1 µm/s, in agreement with previous reports (Fig. 4D) [6, 20].
To visualize novel aspects of RNA dynamics in hippocampal dendrites, we first
used the optimized MS2 system (1:9 ratio of Syn-MCP:CMV-MS2). We co-transfected
the MS2-CamKII
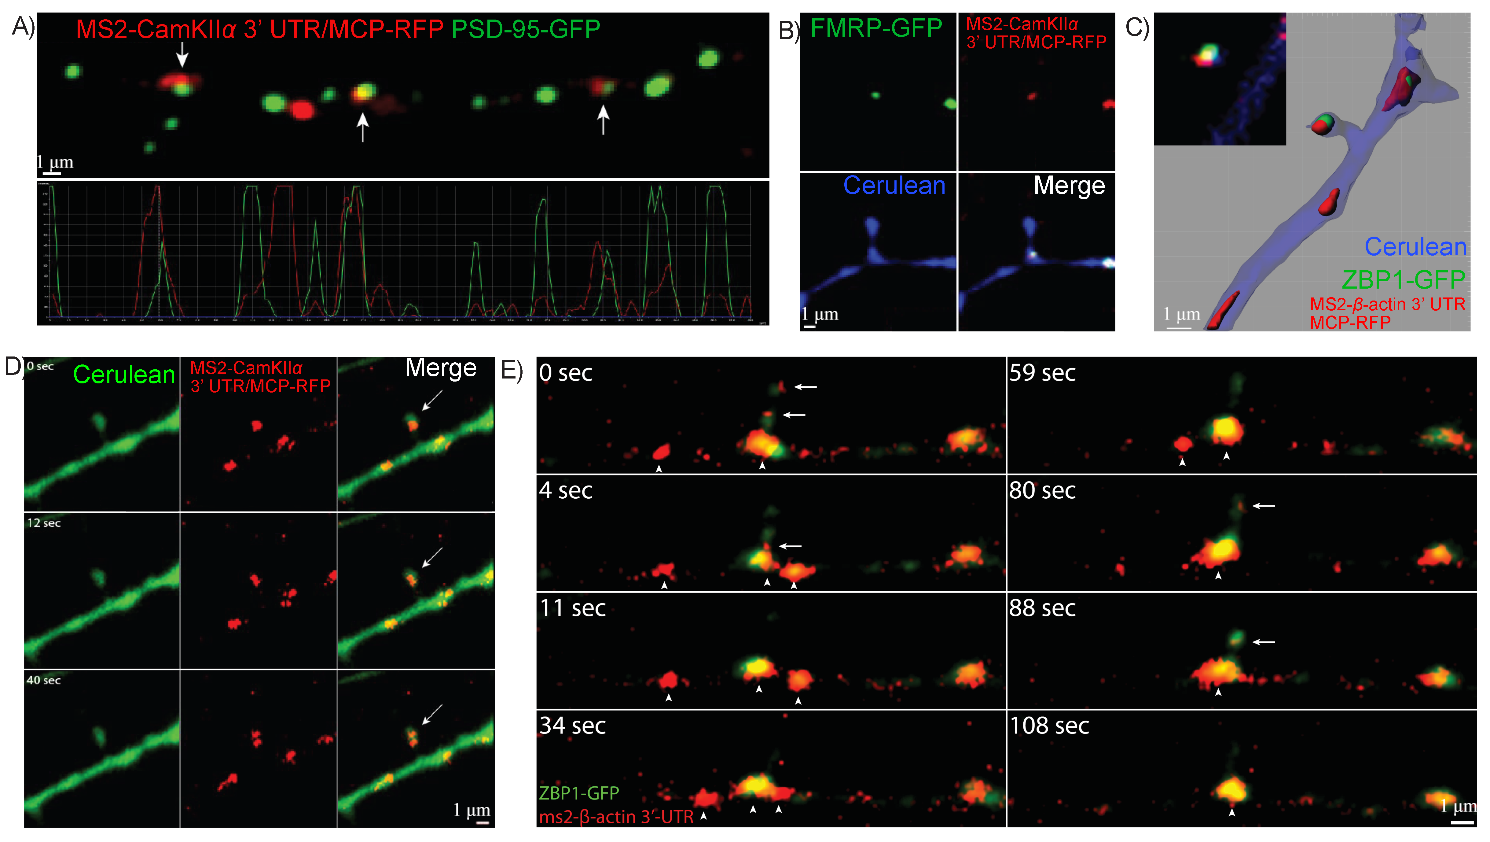 Fig. 5.
RNA granules containing specific 3′UTRs associate with dendritic
synapses. (A) Colocalization of MS2-CamKII
To further visualize and characterize the dynamic of mRNAs and cognate RBPs
using the improved methods, dual-colored mRNPs were followed.
MS2-CaMKII
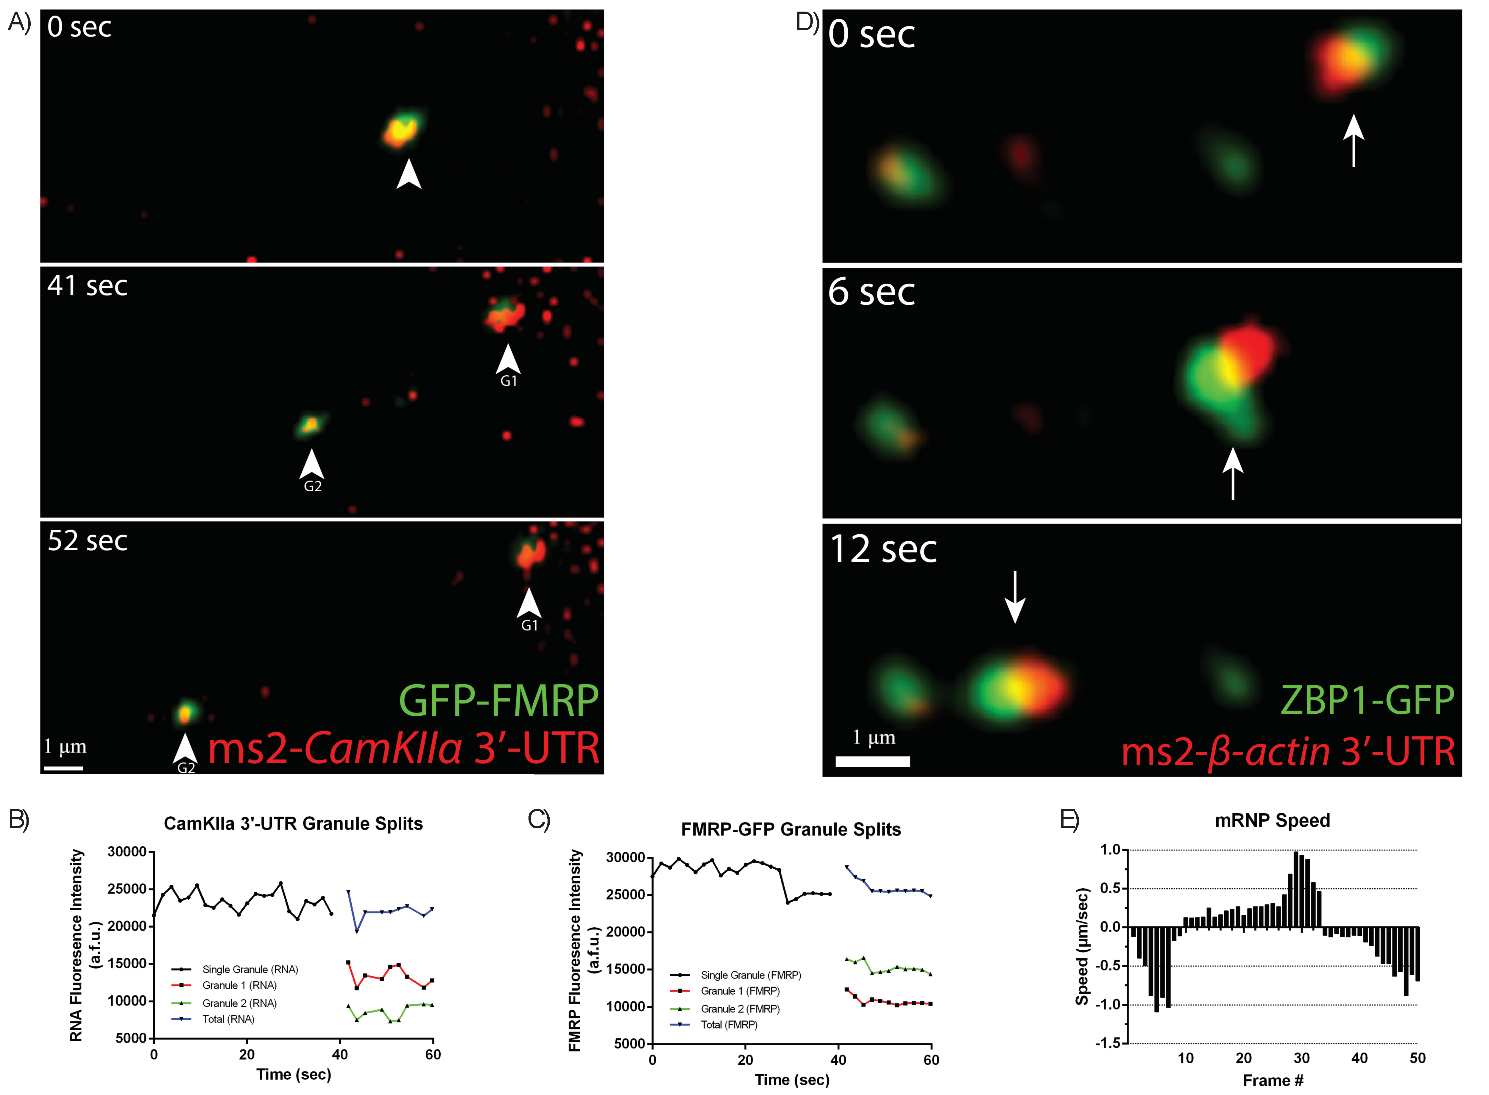 Fig. 6.
MS2-RNA granules are actively transported within dendrites with
their cognate RNA Binding Proteins (RBP). (A) Neurons were transfected with
MS2-CamKII
To more directly test whether motile mRNPs contain more than one mRNA, both
CaMKII
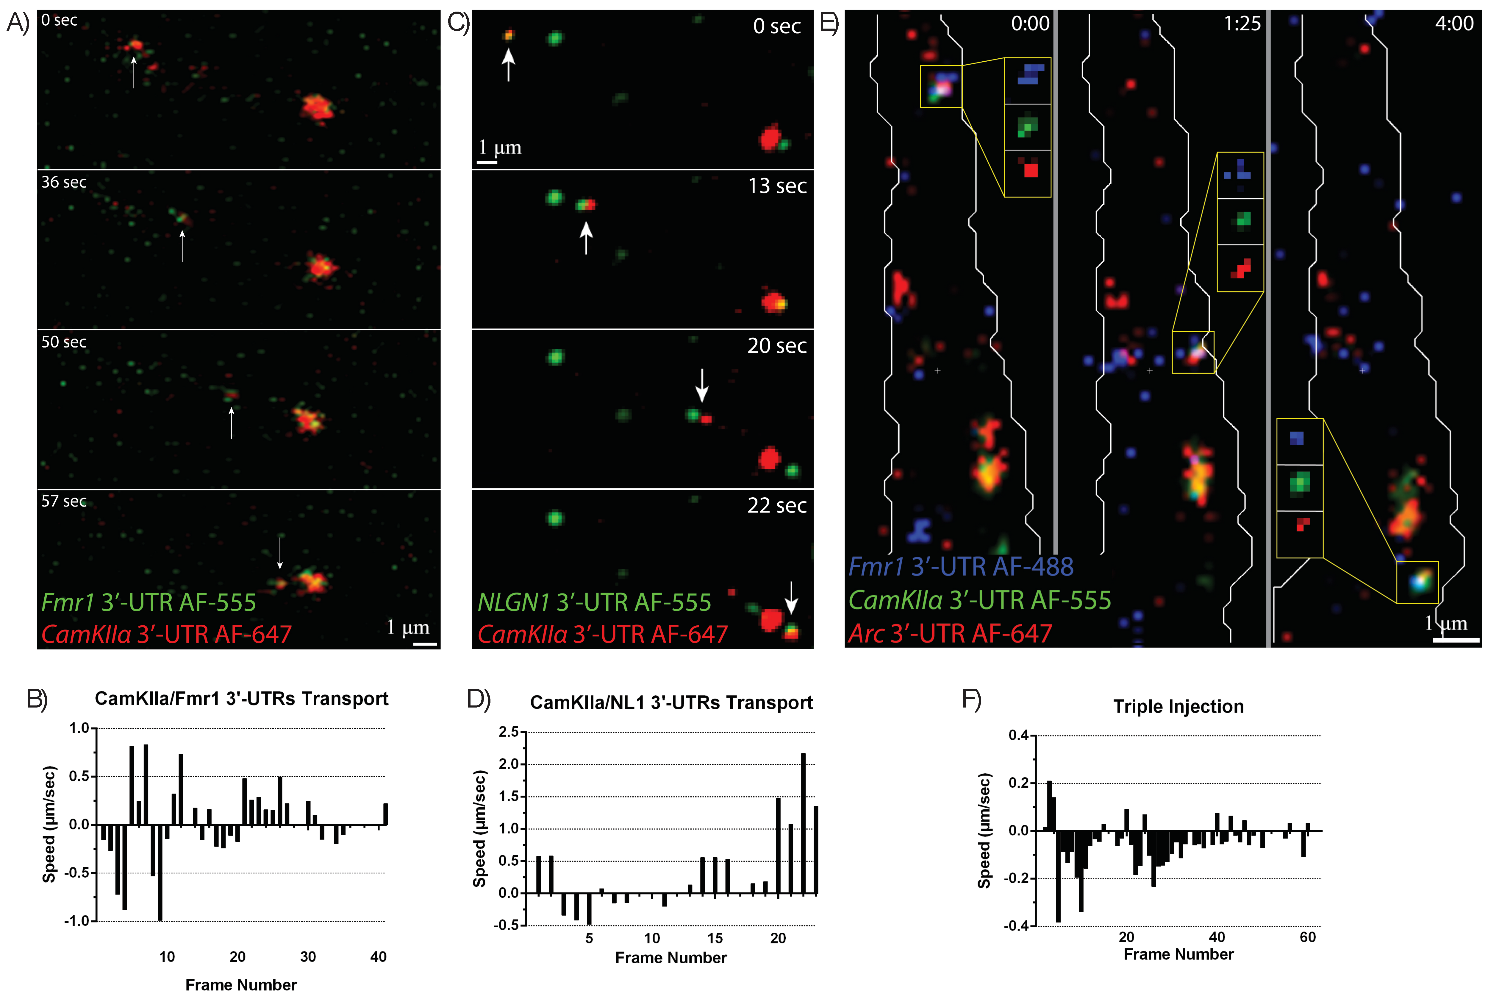 Fig. 7.
Fluorescently-labeled mRNA granules containing multiple 3′UTRs
are co-transported together in dendrites. (A) CamKII
Dendritic mRNA localization is a key aspect of synaptic plasticity, as it allows the rapid and site-specific delivery of proteins required for synaptic modulation. In this study, we have optimized existing methods to visualize dendritic mRNAs in live neurons, providing an important tool for the study of synaptic activity-dependent mRNA transport. We focused on MS2 and microinjection as they are the most commonly used methods to study mRNA transport in live cells. Our first trials with the MS2 system yielded very few transfected cells with very high fluorescent backgrounds and very few particles undergoing directed transport. To resolve these issues, we first optimized transfection conditions to yield more transfectants and then optimized the plasmids to increase MS2-RNA expression and decrease MCP-FP expression. We found that the presence of glial cells in neuronal cultures increased the transfection efficiency and that the Lipofectamine LTX transfection reagent was far superior to the commonly used Lipofectamine 2000 (data not shown). Further, increasing the ratio of MCP-FP:MS2-RNA from 1:3 to 1:9 yielded brighter RNA granules. Additionally, placing the MS2-RNA under a stronger CMV promoter and the MCP-FP under weaker promoters (Ubiquitin and the neuron-specific Synapsin promoter) also yielded granules with highly increased SNRs.
We also studied microinjection as an alternative method for observing dynamic
mRNA granules. Although microinjected RNAs don’t undergo nuclear processing to
the extent of endogenous or overexpressed MS2 mRNAs, they do have a degree of
nuclear processing when injected into the nucleus, as RNAs injected directly into
the cytoplasm form mostly small granules but not larger granules that likely
represent mature mRNPs (data not shown). To ensure bright mRNA granules, the
in vitro transcribed RNA was labeled indirectly with fluorescent dyes,
which yielded 3
Using these optimized approaches, we detected many novel behaviors for mRNA
particles. We observed RNA particles undergoing fast bidirectional transport, as
expected, and also found that these particles not only stop momentarily at the
base of dendritic spines, but some also travel into spines. We confirmed this
result using the MS2 system, where we observed an mRNP composed of both
While mRNPs have been thoroughly described in the past through biochemical and
fixed cell methods, the co-transport of an mRNA and its cognate RBPs has not been
demonstrated in live cells. This may be due to the difficulty in co-transfecting
three plasmids into primary neurons, coupled with the fact that until now, the
MS2 system yielded relatively few actively transporting granules. Optimized
transfection conditions and MS2 plasmid construction allowed us to obtain a large
number of transfected cells with sufficiently bright transporting granules. We
were thus able to visualize the rapid transport of CamkII
The scope of this study was to optimize live-cell mRNA visualization techniques to further understand the role of dendritic mRNA transport in local translation during synaptic plasticity. Microinjection provides brighter and more motile RNA granules than the MS2 system, making it ideal for studying the fast dynamics of mRNA transport. However, microinjection requires expensive equipment. The MS2 system, on the other hand, is widely available, and substantial improvements were observed by just changing the ratio of plasmids. Optimized transfections resulting in brighter RNA granules make MS2 ideal for studying mRNP dynamics.
Several studies have suggested that mRNAs travel singly in dendrites (Batish et al. [22]). Approximately ~800 mRNAs have been identified in dendrites, suggesting that colocalization of dendritic mRNAs is higher than can be currently measured; our microinjection data showed up to three different synaptic plasticity-related mRNA species transporting together, showing that the dendritic machinery is capable of transporting at least up to three different mRNAs together. Further, new methods to study the transcriptome in-situ promise to provide genome-wide localization of RNAs in neurons [23, 24, 25]. These techniques will confirm whether different mRNAs travel alone or are co-transported together in dendrites.
All data analyzed during this study are included in this published article. Raw data sets for current study are available from the author (IC, HW and JD) upon request.
IJC, HW and JD designed the research study. IJC performed the research. TZ and MN provided help and advice on the design. IJC and JD analyzed the data. IJC, HW and JD wrote the manuscript. All authors contributed to editorial changes in the manuscript. All authors read and approved the final manuscript. All authors have participated sufficiently in the work and agreed to be accountable for all aspects of the work.
Mice were housed in the AALAC-approved animal facility at Hunter College. Animal facility protocols were approved by the Institutional Animal Care and Use Committee (IACUC) of Hunter College (approval number: HC49032).
Not Applicable.
IJC received funding from the Howard Hughes Medical Institute Undergraduate Research Scholar Program and the Research Initiative for Scientific Enhancement (RISE) Program at CUNY Hunter College. This work was supported by National Institutes of Health Grants GM084805 and National Science Foundation (NSF) Grants 0819022 and 0960367 to JD.
The authors declare no conflict of interest.
Supplementary material associated with this article can be found, in the online version, at https://doi.org/10.31083/j.fbl2912430.
References
Publisher’s Note: IMR Press stays neutral with regard to jurisdictional claims in published maps and institutional affiliations.