


 , Dan Zhou 1,*
1 Department of Breast Surgery, The First People’s Hospital of Foshan, 528100 Foshan, Guangdong, China
2 Breast Center, Nanfang Hospital, Southern Medical University, 510515 Guangzhou, Guangdong, China
3 Clinical Research Institute, The First People’s Hospital of Foshan, 528100 Foshan, Guangdong, China
4 Department of General Surgery, Zhujiang Hospital, Southern Medical University, 51000 Guangzhou, Guangdong, China
†These authors contributed equally.
Abstract
The current study aimed to develop an experimental approach for the direct co-culture of three-dimensional breast cancer cells using single-cell RNA sequencing (scRNA-seq).
The following four cell culture groups were established in the Matrigel matrix: the untreated Michigan Cancer Foundation (MCF)-7 cell culture group, the MCF-7 cell culture plus cisplatin group, the untreated co-culture group, and the cell co-culture plus cisplatin group. For cell co-culture, MCF-7 cells, human mammary fibroblasts, and human umbilical vein endothelial cells were mixed at a ratio of 1:1:1. Cisplatin was applied at a concentration of 1.25 μg/mL, and the cells were harvested after 2 days and subjected to scRNA-seq. Data were analyzed using a single-cell RNA sequencing data analysis pipeline with R language.
The response of MCF-7 cells to cisplatin differed among the four groups. The transcriptomic response of MCF-7 cells to cisplatin in the co-culture model was not as significant as that in the mono-culture model. Moreover, the pathways related to apoptosis, DNA damage, hypoxia, and metastasis in the co-culture groups were enriched in the genes that were differentially expressed based on cisplatin treatment.
scRNA-seq analysis revealed that the response of MCF-7 cells to cisplatin in the co-culture model was lower than that in the mono-culture model. Therefore, the three-dimensional cell co-culture model can be applied to tumor research to better mimic the pathophysiological environment in vivo and can be a well-modified research method.
Keywords
- three-dimensional cell coculture
- single-cell RNA sequencing
- MCF-7 cells
- breast cancer
Laboratory tumor modeling is essential to improve the understanding of tumor biology and to develop novel treatment strategies for breast cancer. Cell-based tumor experiments are ubiquitous in cancer research. However, traditional two-dimensional (2D) cell line experiments cannot reproduce the complexity of in vivo tumors. Cell co-culture experiments (e.g., those using the Transwell incubator) can be used to assess cell interactions. However, these cell co-culture approaches involve communication between extracellular vesicles and other factors, not direct contact between cells [1, 2]. Researchers have developed methods for the three-dimensional (3D) culture of cancer cells. These models can better mimic the biological behavior of in vivo tumors than traditional culture methods [3, 4], particularly in the co-cultures of multiple cell types, and can reproduce cell heterogeneity. Therefore, 3D culture can better reflect the actual condition of tumors than 2D culture [5]. The application of 3D breast cancer cell culture, particularly in drug resistance mechanisms and individualized therapy, has been comprehensively evaluated. Tatara et al. [6] showed that compared with 2D culture, 3D culture is more effective in simulating trastuzumab-induced apoptosis and the cytological and biochemical mechanisms of trastuzumab resistance associated with phosphatidylinositol-4, 5-bisphosphate 3-kinase catalytic subunit alpha (PIK3CA) mutations. Lugert et al. [7] developed Ptx functionalized superparamagnetic iron oxide nanoparticles coated with lauric acid and human serum albumin. Moreover, their efficacy in different breast cancer cell lines in 2D and 3D cultures was examined [7]. Fuzer et al. [8] analyzed and compared the anticancer activity of [9] gingerol in breast cancer HMT-3522 cells grown in 3D culture lr-extracellular matrix and non-malignant S1 cells [9]. Gingerol enhances the cytotoxicity of linear HMT-3522 (T4-2) cells and induces the apoptosis of breast cancer HMT-3522 (T4-2) cell line [8]. Meanwhile, single-cell RNA sequencing (scRNA-seq), a novel experimental method, has been increasingly used in basic and clinical tumor research [10]. Thus, direct cell co-culture can be performed, and different cells and functions at the single-cell level can be identified [9]. Cisplatin is effective against various types of cancers including ovarian cancer, metastatic testicular cancer, bladder cancer, lung cancer, and breast cancer [11]. Cisplatin treatment alone has a lower cure rate in patients with breast cancer. Thus, it is commonly used in combined therapy for breast cancer. The current study used cisplatin as an intervention drug acting on cultured cells.
In the current experiment, Michigan Cancer Foundation (MCF)-7 cells, human mammary fibroblasts (HMFs), and human umbilical vein endothelial cells (HUVECs) were mixed for 3D culture and treated with cisplatin. Then, the transcriptional changes in MCF-7 cells were observed at the single-cell level. This study aimed to validate the superiority of scRNA-seq combined with 3D cell direct co-culture in breast cancer research. Results showed that scRNA-seq combined with 3D cell direct co-culture can be a promising in vitro cancer cell culture approach.
MCF-7 cells (ZQ0071) and HUVECs (ZQ1099) were acquired from Shanghai Zhongqiao
Xinzhou Biotechnology Co., Ltd. (Shanghai, China). HMFs (MZ-2683) were obtained
from Ningbo Mingzhou Biotechnology Co., Ltd. (Ningbo, China). Cell lines were
authenticated by the Genomics Unit, using ShortTandem
Repeat profiling (AmpFLSTR® ldentifler® Plus PCR
Amplification Kit, Waltham, MA, USA). Mycoplasma test was perfomed in all cell lines every other
week using the lycoAlertMycoplasma Detection Kit (LONZA, Basel,
Switzerland), The test results were negative. MCF-7 cells, HMFs, and HUVECs were
mixed at a ratio of 1:1:1 [12] and then cultured in a previously prepared
Matrigel matrix (356237, Corning Co., Shanghai, China) to construct a 3D
co-culture model. In the MCF-7 cell 3D culture, only MCF-7 cells were added in
the Matrigel matrix. For preparation, the Matrigel matrix was removed from –80
°C and placed in a 4 °C refrigerator for 2 h. Cells were
collected and re-suspended in the Dulbecco’s Modified Eagle Medium-high
(DMEM-H) medium supplemented with 15% fetal bovine serum (FBS)
and mixed with the Matrigel matrix together at a final concentration of 4.5 mg/mL
for Matrigel and 6
Using the Single Cell 3′ Library and Gel Bead Kit V3 (10
Cells were revived and processed using BD Rhapsody single cell analysis system the BD Rhapsody Express Single-Cell Analysis System (BD Biosciences, Franklin Lake, NJ, USA), according to the manufacturer’s instructions. Briefly, an average of 20,000–30,000 pooled cells was loaded in each cartridge on the BD Rhapsody express single cell analysis system for single cell capture, and the library was prepared using BD™ Single-Cell Multiplexing Kit-Human and BD Rhapsody Single Cell Multiplexing Kit as per manufacturer’s guide (Doc ID: 214419 Rev. 2.0). Final libraries were quantified using Qubit and Agilent TapeStation and pooled to achieve a final concentration of 5 nM. The libraries were sequenced using NovaSeq 6000 by Novogene Biotech Co., Ltd. (Beijing, China).
To control quality, cells expressing
Total RNA was extracted from MCF-7 cells in 3D culture group and 3D co-culture model group (see 2.1) using TRIzol (Invitrogen, Carlsbad, CA, USA). Then, RNA was aliquoted to synthesize cDNA using the Reverse Transcription System (Promega, Madison, WI, USA). Quantitative reverse transcriptase polymerase chain reaction (qRT-PCR) products were amplified using a SYBR green PCR Master Mix kit (Qiagen, Germantown, PA, USA) according to the manufacturer’s instructions on the ABI Prism 7500 Detection System (Applied Biosystems, Carlsbad, CA, USA). Data were analyzed using the 2-ΔΔCt method, and GAPDH was regarded as an internal control [13]. The following q-PCR primer sequences were used: S100P forward, 5′-GCACCATGACGGAACTAGAGACA‑3′, and reverse, 5′-CAGGTCCTTGAGCAATTTATCCAC‑3′; HSPB1 forward, 5′-CTGACGGTCAAGACCAAGGATG-3′, and reverse, 5′-GTGTATTTCCGCGTGAAGCACC-3′; COX6C forward, 5′-GTAGCATTCGTGCTATCCCTGG-3′, and reverse, 5′-GATACCAGCCTTCCTCATCTCC-3′; CRABP2 forward, 5′-TTGAGGAGCAGACTGTGGATGG-3′, and reverse, 5′-GTTCTCTGGTCCACGAGGTCTT-3′; SOD2 forward, 5′-CTGGACAAACCTCAGCCCTAAC-3′, and reverse, 5′-AACCTGAGCCTTGGACACCAAC-3′; GAPDH forward, 5′-GCACCGTCAAGGCTGAGAAC‑3′ and reverse, 5′-TGGTGAAGACGCCAGTGGA‑3′. Analysis between two groups was performed using an unpaired Student’s t-test.
Two types of 3D culture were established. One was constructed for individual MCF-7 cell 3D culture. Under a microscope, it appeared messy, and it had a rough edge (Fig. 1A–C). The other was established for MCF-7 cells co-cultured with HMFs and HUVECs. The cell masses presented with a smoother and more regular edge (Fig. 1D–F).
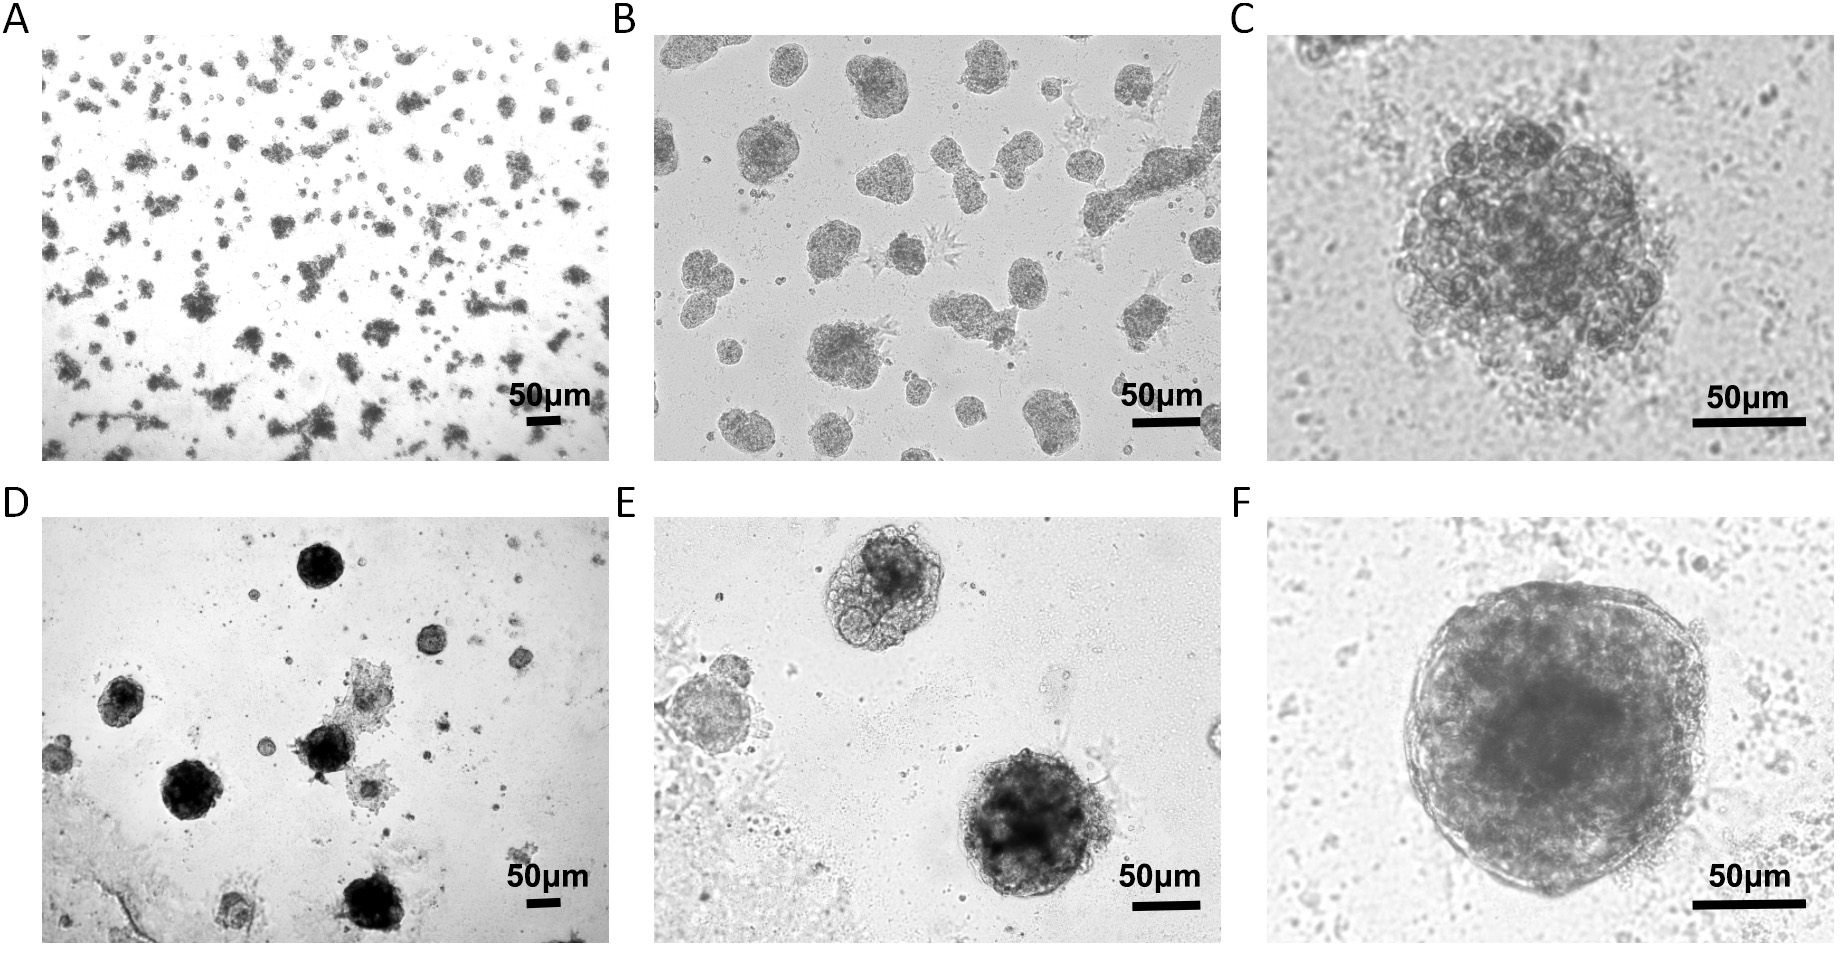 Fig. 1.
Cell morphology in the 3D culture. (A–C) Individual MCF-7 cells in the 3D culture produced irregular cell spheres. (D–F) Three-dimensional co-culture model for MCF-7 cells, HMFs, and HUVECs formed 3D structures with smooth edges. Scale bar value: 50 µm. MCF, michigan Cancer Foundation; HMFs, human mammary fibroblasts; HUVECs, human umbilical vein endothelial cells.
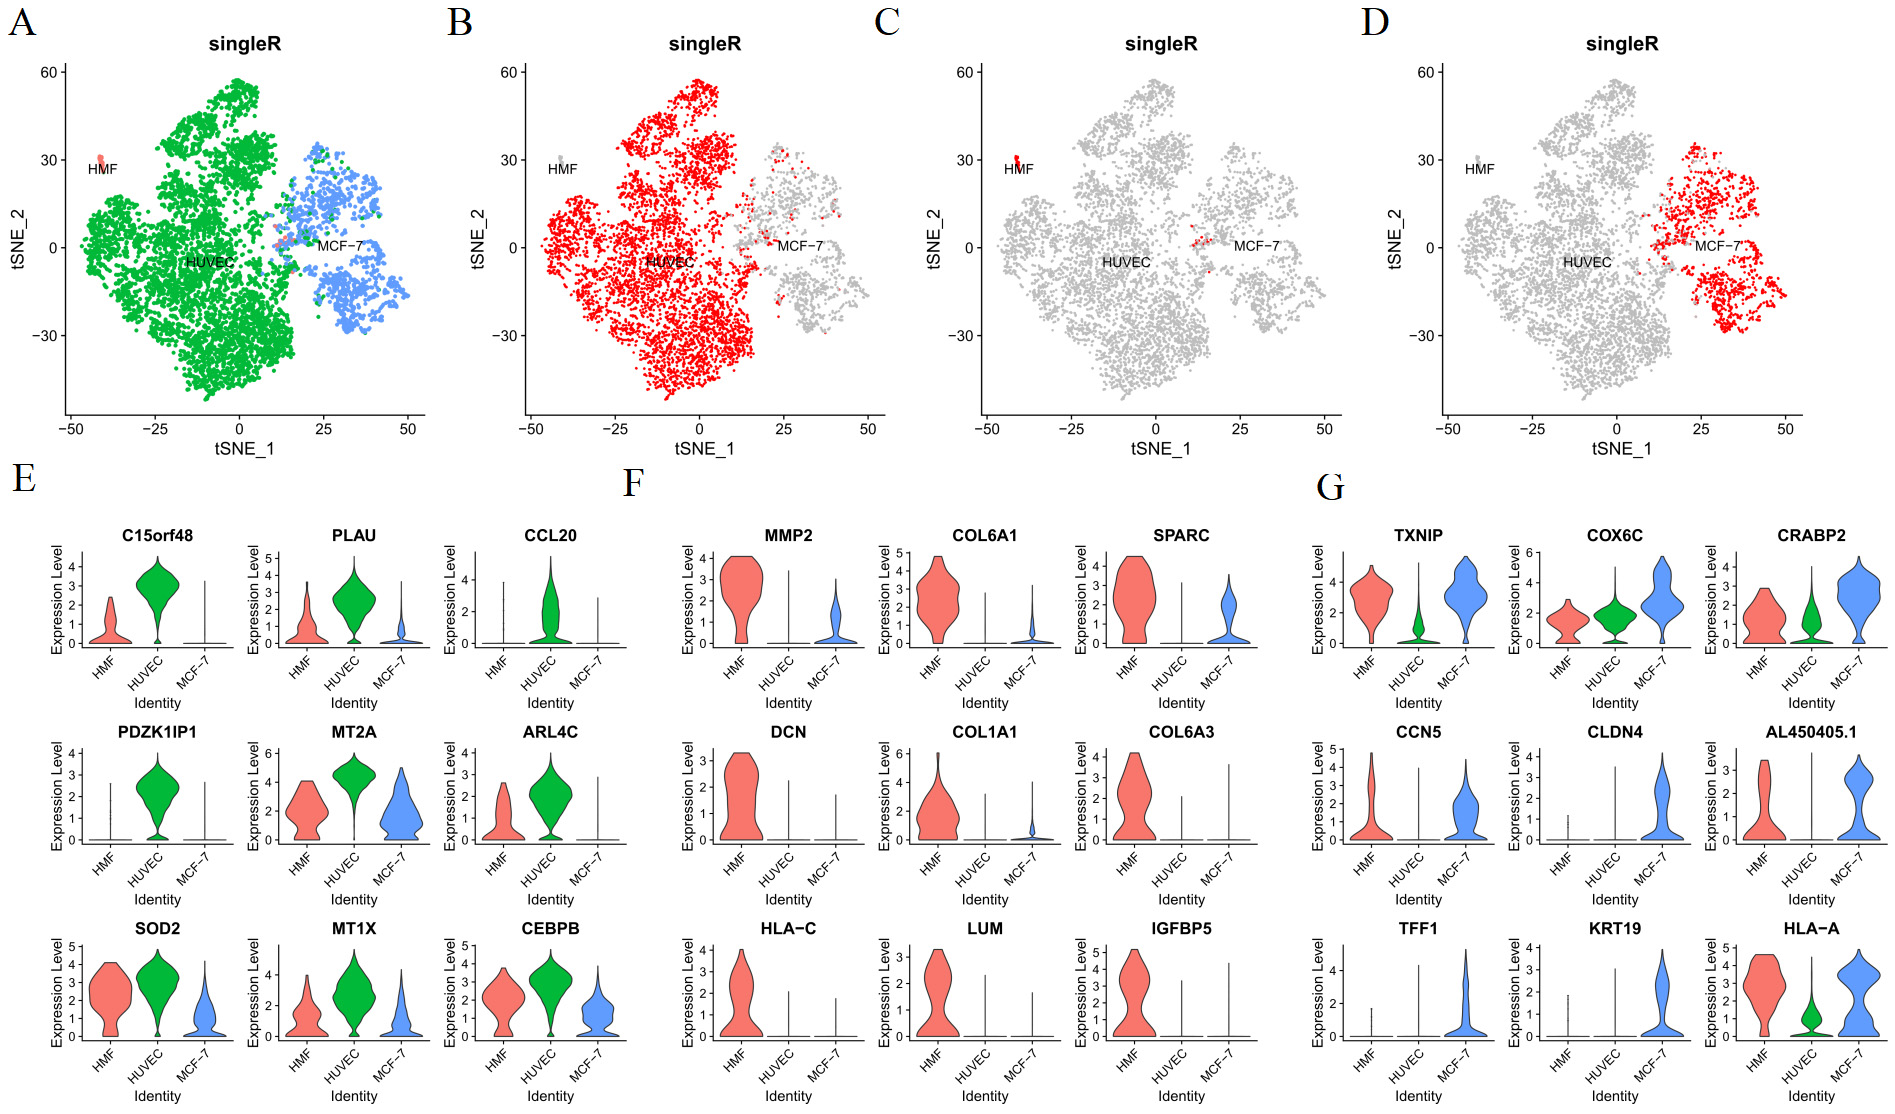
After controlling the quality of single-cell analysis (Fig. 2A), dead or injured cells were eliminated. Eventually, we obtained 2041 cells in MCF-7 cells in the 3D culture, 1043 cells in MCF-7 cells in the 3D culture treated with cisplatin, 2421 cells in the 3D co-culture model, and 4667 cells in the 3D co-culture model with cisplatin. The cells of the 3D co-culture model (from the 3D co-culture model and 3D co-culture model with cisplatin) were clustered into six according to the hypervariable gene using the standard data analysis tool K-means in Seurat package (Fig. 2B). Next, the cells were visualized in the t-SNE map. The heatmap presented the expressions of the top 5 differentially expressed genes in each of the six cluster (Fig. 2C, Table 1). The differentially expressed genes were analyzed using the Kruskal–Wallis test in R package. The cell type was identified with marker genes and the characteristic genes of each cell type. The HUVECs, HMFs, and MCF-7 cells of the 3D co-culture model, which was shown in the t-SNE map, were separated (Fig. 3A). Each cell type was featured individually in the sole t-SNE map (Fig. 3B–D). The heatmap depicted the expressions of the top 10 differentially expressed genes in HUVECs, MCF-7 cells, and HMFs (Fig. 2D, Table 2). Fig. 3E presents the characteristic genes of HUVECs including CCL20, MT2A, SOD2, MT1X, and CEBPB. In addition, the relative expressions of C15ORF48, PLAU, PDZK1IP1, and ARL4C in the three cell types were examined, as these genes had relatively high expression levels in HUVECs (Fig. 3E). Similarly, Fig. 3F depicts the characteristic genes of HMFs such as MMP2, SPARC, and COL1A1. In addition, the relative expressions of COL6A1, DCN, COL6A3, HLA-C, LUM, and IGFBP5 in the three cell types were examined, as these genes had a relatively high expression levels in HMFs (Fig. 3F). Further, Fig. 3G presents the characteristic genes of MCF-7 cells including TXNIP, COX6C, CRABP2, CCN5, CLDN4, TFF1, KRT19, and HLA-A. Fig. 3G shows the relative expressions of AL450405.1 in the three cell types, as it had a relatively high expression level in MCF-7 cells.
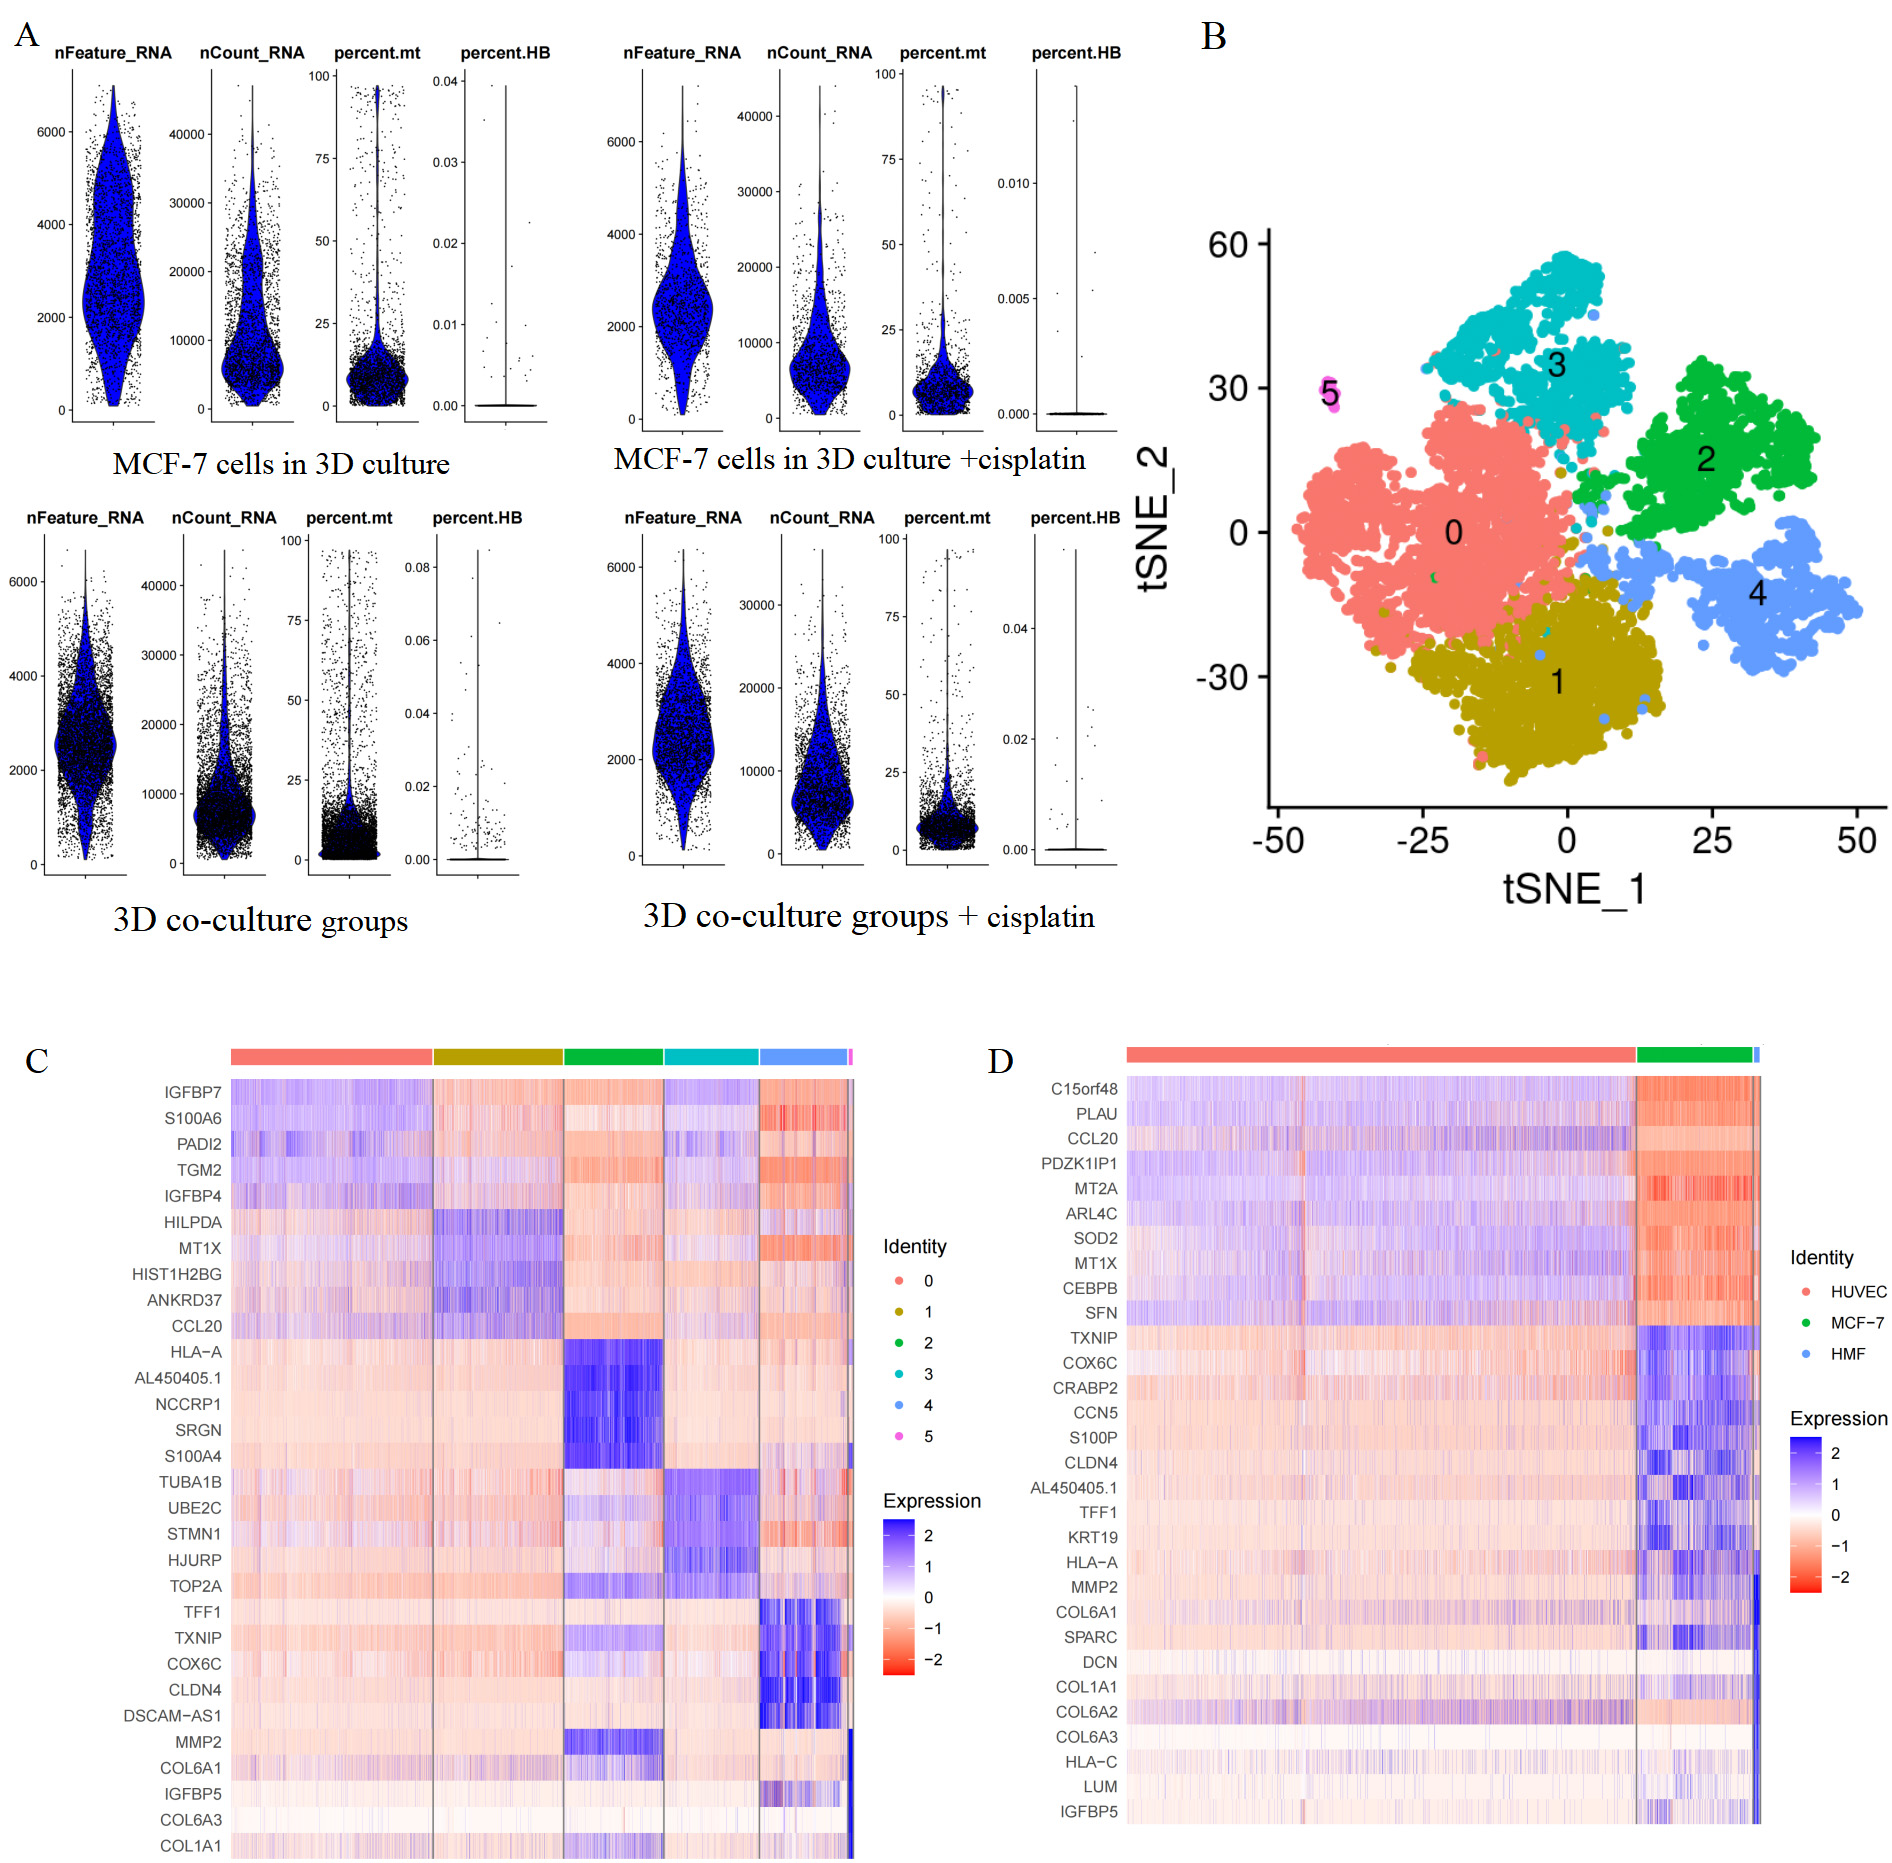 Fig. 2.
Cell cluster and single-cell transcriptome sequencing atlas. (A) Quality control for scRNA-seq. Violin plot of nFeature_RNA presented the number of genes captured in a sample cell. Violin plot of nCount_RNA presented the number of the total number of genes expressed in the cells. Violin plot of percent.mt presented the mitochondrial gene expression ratio. Violin plot of the erythrocyte gene expression ratio. (B) Cells of the 3D co-culture model were clustered into six. (C) The heatmap showed the expressions of the top 10 differentially expressed genes in each of the six clusters. (D) The heatmap showed the expressions of the top 10 differentially expressed genes in HUVECs, MCF-7 cells, and HMFs. scRNA-seq, single-cell RNA sequencing; tSNE, t-distributed Stochastic Neighbor Embedding; HUVECs, human umbilical vein endothelial cells; HMFs, human mammary fibroblasts.
 Fig. 3.
Identification of cell types. (A) The map of the identification of all cells. (B–D) The map of distribution of HUVECs, HMFs, and MCF-7 cells. (E) The relative expressions of the characteristic genes of HUVECs. (F) The relative expressions of the characteristic genes of HMFs. (G) The relative expressions of the characteristic genes of MCF-7 cells.
| Clusters | Genes | ||||
|---|---|---|---|---|---|
| Cluster 1 | IGFBP7 | S100A6 | PADI2 | TGM2 | IGFBP4 |
| Cluster 2 | HILPD4 | MT1X | HIST1H2BG | ANKRD37 | CCL20 |
| Cluster 3 | HLA-A | AL450405.1 | NCCRP1 | SRGN | S100A4 |
| Cluster 4 | TUBA1B | UBE2C | STMN1 | HJURP | TOP2A |
| Cluster 5 | TFF1 | TXNIP | COX6C | CLSN4 | DSCAM-AS1 |
| Cluster 6 | MMP2 | COL6A1 | IGFBP5 | COL6A3 | COL1A1 |
| Cells | Genes |
|---|---|
| HUVEC | C15orf48, PLAU, CCL20, PDZK1IP1, MT2A, ARL4C, SOD2, MT1X, CEBPB, SFN |
| MCF-7 | TXNIP, COX6C, CRABP2, CCN5, S100P, CLDN4, AL450405.1, TFF1, KRT19, HLA-A |
| HMF | MMP2, COL6A1, SPARC, DCN, COL6A1, COL6A2, COL6A3, HLLA-C, LUM, IGHBP5 |
To further assess the 3D co-culture model, the function differentialGeneTest in R package was used to calculate the differentially expressed genes in each pairwise comparison. As shown in Fig. 4A, the heatmap presented the expressions of the top 20 differentially expressed genes in MCF-7 cells in the 3D culture and MCF-7 cells in the 3D co-culture model. Further, as shown in Fig. 4B, the heatmap depicted the expressions of the top 20 differentially expressed genes in MCF-7 cells in the 3D culture with cisplatin and MCF-7 cells in the 3D co-culture model with cisplatin. According to the two figures, they showed plenty of similarities. With or without cisplatin, the expressions of SOD2, CEBPB, PLAU, SFN, IGFBP7, MT2A, and VIM were relatively high in MCF-7 cells in the 3D culture but relatively low in MCF-7 cells in the 3D co-culture model. Meanwhile, the expressions of S100P, ALDOC, HSPA1B, HSPB1, COX6C, CRABP2, TXNIP, and AQP3 were relatively low in MCF-7 cells in the 3D culture but relatively high in MCF-7 cells in the 3D co-culture model. RT-qPCR results demonstrated that SOD2 mRNA level was downregulated, while S100P, HSPB1, COX6C and CRABP2 mRNA expressions were upregulated in the 3D co-culture model in comparison to in the 3D culture alone (Supplementary Fig. 1A–E), which consistent to above analysis. As shown Fig. 4C, the heatmap depicted the expressions of the top 20 differentially expressed genes in MCF-7 cells in the 3D culture and MCF-7 cells in the 3D culture with cisplatin. Further, as depicted in Fig. 4D, the heatmap presented with the expressions of the top 20 differentially expressed genes in MCF-7 cells in the 3D co-culture model and MCF-7 cells in the 3D co-culture model with cisplatin. As shown in the two figures, regardless if the MCF-7 cells were co-cultured with other cells or not, the ZFP36 expressions were partially low in cells without cisplatin but relatively high in cells with cisplatin.
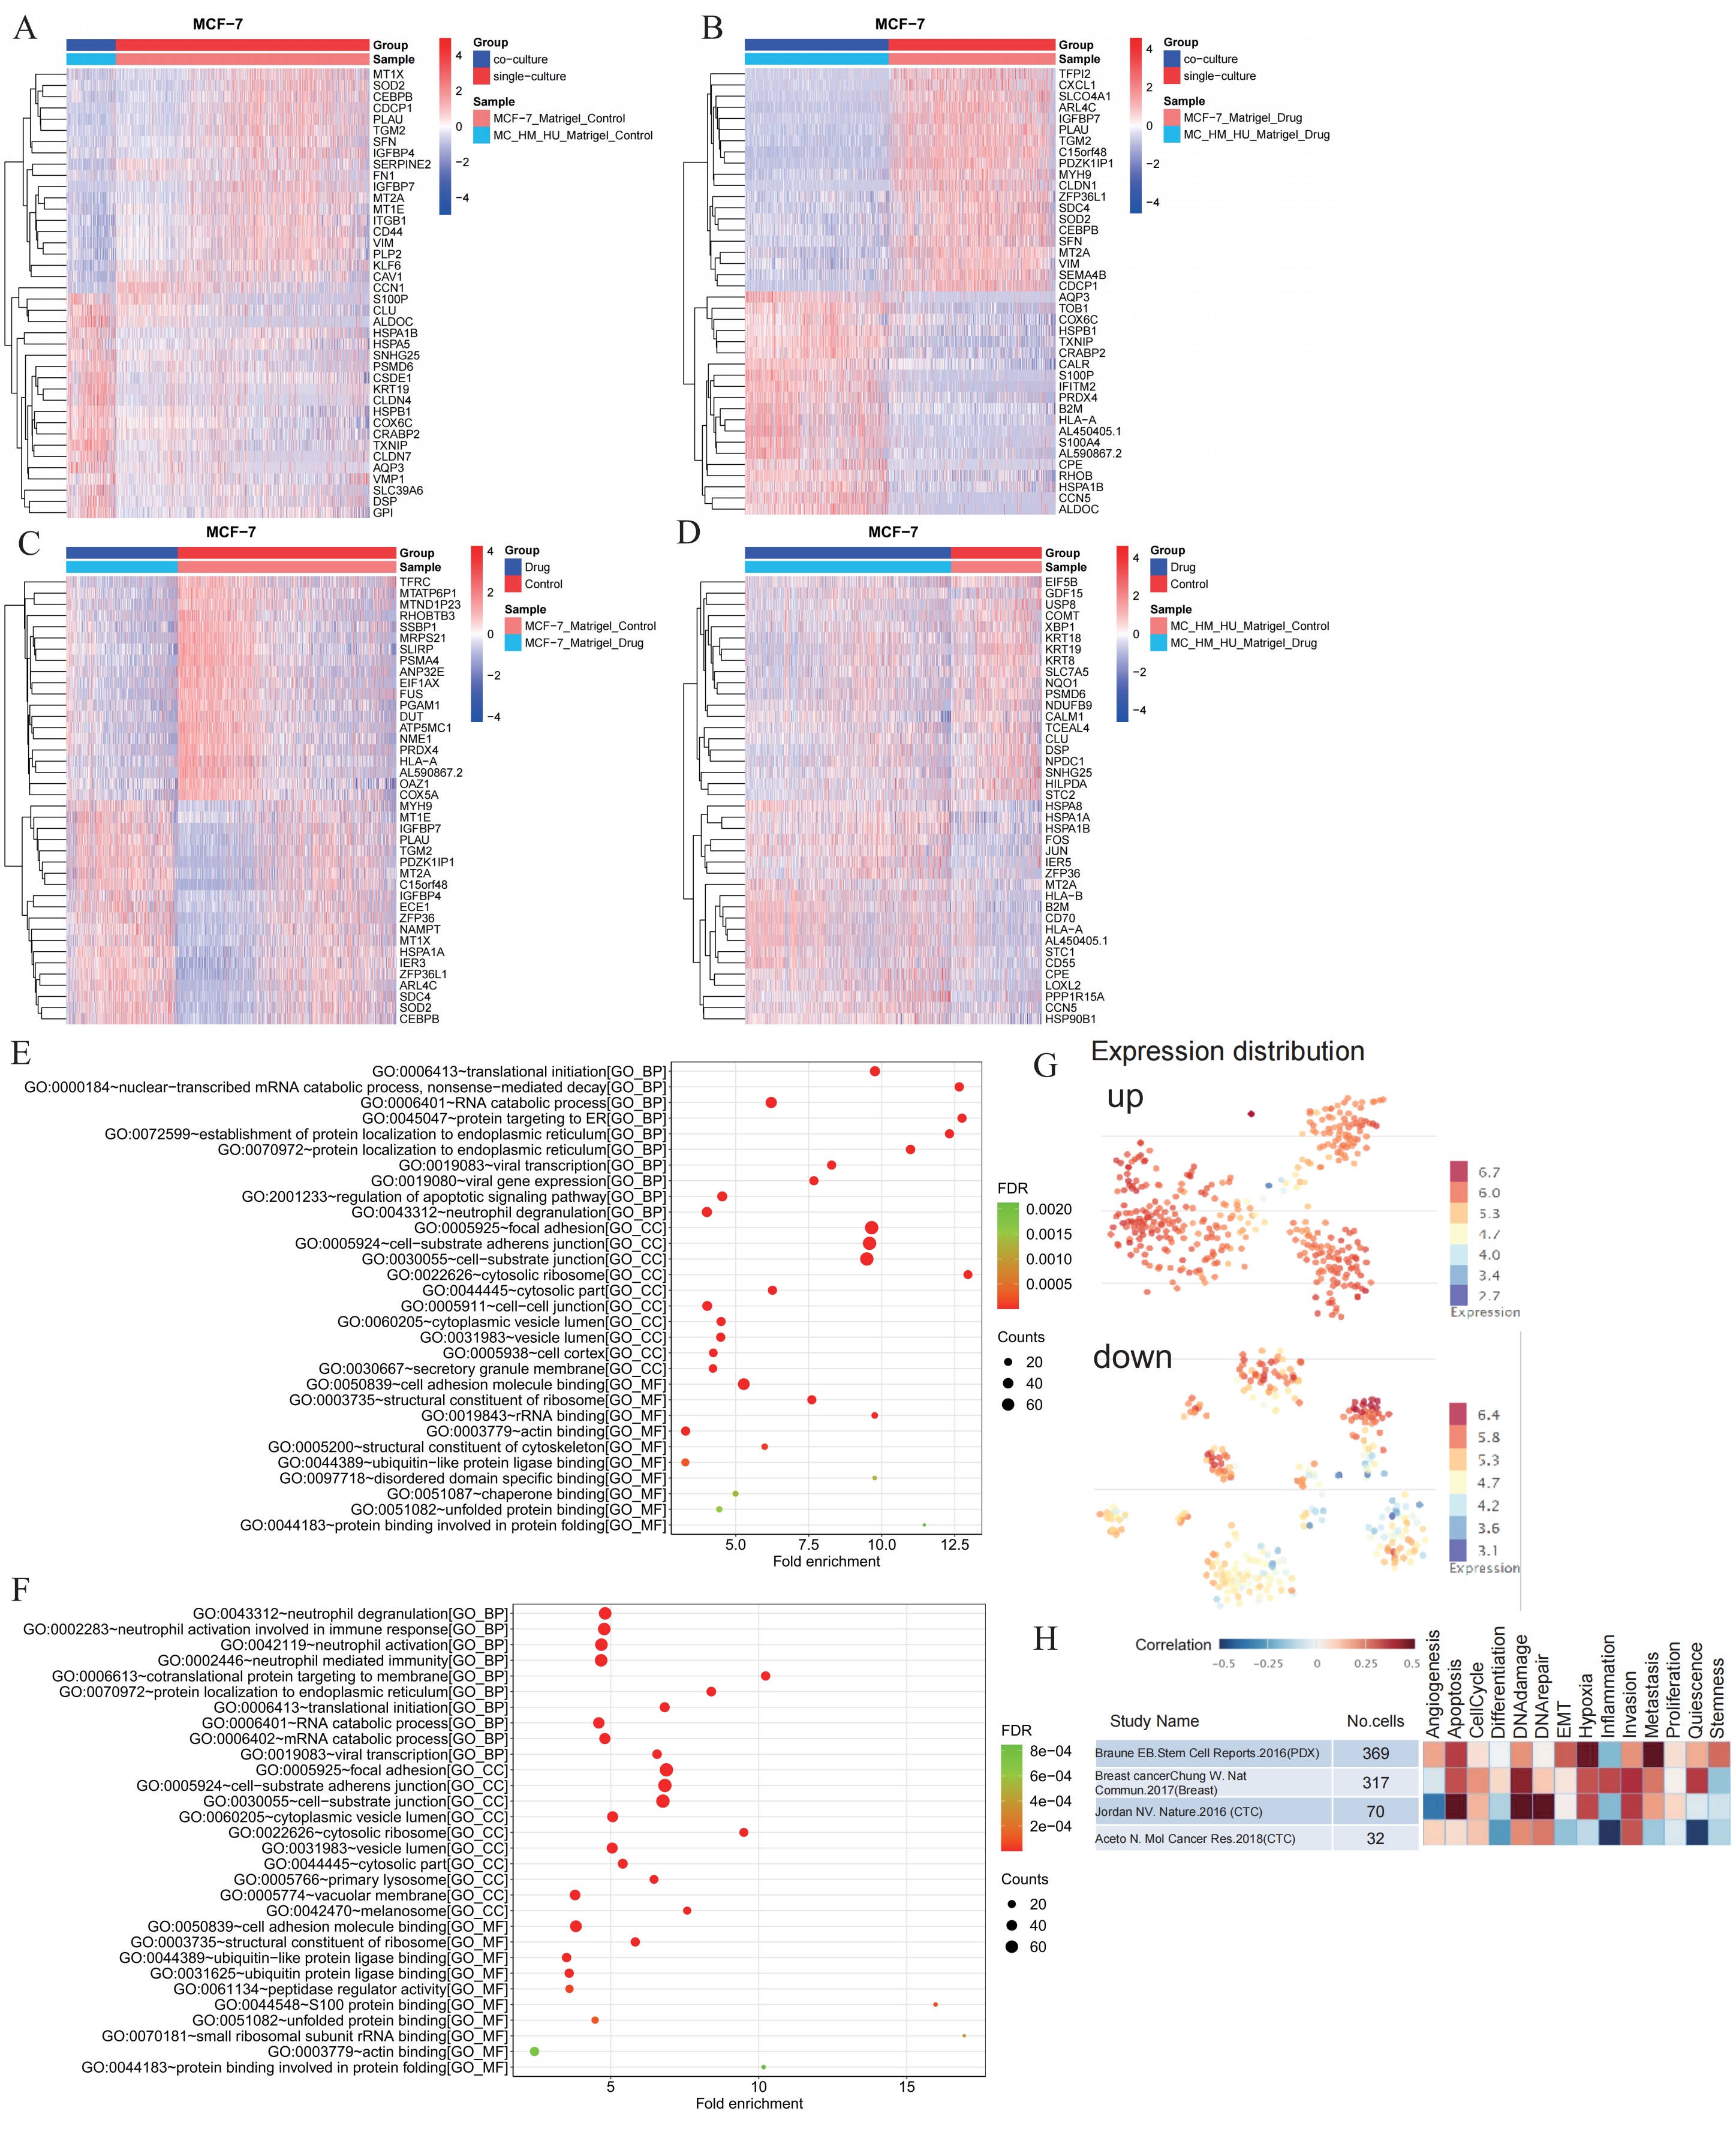 Fig. 4.
Analysis of differentially expressed genes and GO pathway enrichment based on single-cell RNA sequencing in MCF-7 cells. (A) The heatmap showed the expressions of the top 20 differentially expressed genes in MCF-7 cells in the 3D culture and MCF-7 cells in the 3D co-culture model. (B) The heatmap showed the expressions of the top 20 differentially expressed genes in MCF-7 cells in the 3D culture with cisplatin and MCF-7 cells in the 3D co-culture model with cisplatin. (C) The heatmap showed the expressions of the top 20 differentially expressed genes in MCF-7 cells in the 3D culture and MCF-7 cells in the 3D culture with cisplatin. (D) The heatmap showed the expressions of the top 20 differentially expressed genes in MCF-7 cells in the 3D co-culture model and MCF-7 cells in the 3D. (E) GO pathway enrichment between MCF-7 cells in the 3D culture and MCF-7 cells in the 3D co-culture model. (F) GO pathway enrichment between MCF-7 cells in the 3D culture with cisplatin and MCF-7 cells in the 3D co-culture model with cisplatin. (G) Expression level of each differentially expressed gene in each breast cancer cell from the CancerSEA website database. (H) Functional correlation analysis was performed for differentially expressed genes of MCF-7 cells in 3D co-culture models and MCF-7 cells in 3D co-culture models of cisplatin from 4 different datasets of CancerSEA website. GO, Gene Ontology; TME, tumor microenvironment. FDR, false discovery rate
The bubble graph displayed the top 30 differential GO pathway enrichment between MCF-7 cells in the 3D culture and MCF-7 cells in the 3D co-culture model (Fig. 4E), including the pathways of focal adhesion, cell-substrate adherens junction, and cell-substrate junction. The bubble graph showed the top 30 differential GO pathway enrichment between MCF-7 cells in the 3D culture with cisplatin and MCF-7 cells in the 3D co-culture model with cisplatin (Fig. 4F), including focal adhesion, cell-substrate adherens junction, and cell-substrate junction.
The differentially expressed genes between MCF-7 cells in the 3D co-culture model and MCF-7 cells in the 3D co-culture model with cisplatin were uploaded to further understand the influence of the 3D co-culture model treated with cisplatin. The map explained the expression level of each differentially expressed gene in each breast cancer cell from the CancerSEA website database (Fig. 4G). Moreover, the heatmap performed the functional correlation analysis of differentially expressed genes between MCF-7 cells in the 3D co-culture model and MCF-7 cells in the 3D co-culture model with cisplatin from four different datasets in the CancerSEA website, which include mechanisms such as apoptosis, DNA damage, hypoxia, and metastasis (Fig. 4H).
This study showed that MCF-7 cell clusters in the 3D co-culture model had smoother edges compared with those in the mono-cultured model. Single-cell RNA analysis revealed that the expression of SOD2 was low. Meanwhile, the expression of S100P, HSPB1, COX6C, and CRABP2 in MCF-7 cells in the 3D co-culture model was higher than that in MCF-7 cells in the 3D mono-culture model. Functional enrichment analysis showed that differentially expressed genes between the 3D co-culture group and the 3D co-culture group with cisplatin were enriched in the pathways associated with apoptosis, DNA damage, hypoxia, and metastasis.
This study aimed to improve the traditional cell co-culture technique using the single-cell sequencing technology to mimic the real environment in vivo. Currently, the generic 3D in vitro culture models used for scientific and preclinical studies comprise a single type of cells [14]. In contrast, the interactions between tumors and the stroma and cells remain complex, and they are still not identified and, thus, should not be disregarded. With advancements in the manufacturing technology, more biomaterials can be used to construct 3D culture models that mimic the internal microenvironment of tumors [15]. Collagen, sodium alginate, hyaluronic acid, sericin, and gelatin have been used to construct 3D breast cancer models [16, 17]. Corning matrix gel is a natural extracellular matrix-based hydrogel containing laminin, type IV collagen, acetyl heparan sulfate proteoglycan, pentosan/nestin, and various growth factors, which are widely suitable for in vitro 3D culture [18]. If direct in vitro 3D culture is performed with scRNA-seq, it will be more relevant to evaluate the pathogenesis of different tumors including breast lesions or conduct studies such as those on clinical drug sensitivity screening.
With single-cell sequencing, three types of co-cultured cells were isolated, and more cells could be assessed. The environment in which tumor cells invaded the body at the time of onset was considered. A recent report revealed that with surrounding HMFs, fibroblasts may modulate endoplasmic reticulum (ER) signaling in MCF-7 cells to decrease apoptosis [19]. Several studies on 2D co-culture with HUVECs and MCF-7 cells revealed that MCF-7 cells can promote HUVECs under specific conditions [20, 21]. Hence, a 3D co-culture model containing HUVECs, HMFs, and MCF-7 cells, which has never been reported until now, was constructed. The edges of cell masses of MCF-7 cells co-cultured with HUVECs and HMFs were smoother than that of MCF-7 cells cultured individually. This may be attributed to the various sizes of the three types of cells, which makes it easier for their intercellular spaces to fuse with each other when forming a cell mass.
As shown in Fig. 4A,B, co-culture influenced the expressions of marker genes in
MCF-7 cells. The overexpression of SOD2 in MCF-7 cells may decrease cell death
[22], and the SOD2 expression can be low in the 3D co-culture model. S100P
suppressed the cytotoxicity of IFN-
The current study had several limitations. That is, co-culture cell types did not use immune cells, and there were also differences in the actual biological environment in vivo. Therefore, changes that occur in cell types other than breast cancer cells after cisplatin treatment and the effects of cisplatin treatment on the interactions between different cell types should be analyzed. In addition, the proportion of HMF was relatively low at the end of the experiment, and the proportion of cells used in constructing cell co-culture models must be further optimized.
A novel 3D co-culture model of breast cancer was successfully constructed based on the single-cell RNA sequencing technology. Results revealed that the experimental results met the expected scientific properties. According to our experimental method, there was a significant improvement in the traditional cell experimental method, which can be recommended for drug development or drug resistance research and used for general experimental research on cell–cell interactions.
The datasets used and/or analyzed during the current study are available from the corresponding author on reasonable request.
DZ and WLi conceived and designed the experiments. WLuo, PXC, and SQY performed the experiments. KRL, TCH and XFM analyzed the data. HQH searched the literature. GYY, GLY, and AGW draw charts. GYY and DZ drafted, proofread and revised the manuscript. All authors contributed to editorial changes in the manuscript. All authors read and approved the final manuscript. All authors have participated sufficiently in the work and agreed to be accountable for all aspects of the work.
Not applicable.
The authors want to thank Guangzhou GenCoding Co., Ltd. and Guangzhou ASD Biomedical Tech Co., Ltd. for their technical support in this study.
This work was supported by the Guangdong Medical Research Fund (grant number: A2019329), and Foshan 14th Five-Year High-Level Key Specialty Construction Project.
The authors declare no conflict of interest.
This manuscript was submitted as a pre-print at https://www.researchsquare.com/article/rs-634121/v1.
Supplementary material associated with this article can be found, in the online version, at https://doi.org/10.31083/j.fbl2912406.
References
Publisher’s Note: IMR Press stays neutral with regard to jurisdictional claims in published maps and institutional affiliations.