


 , Elena V. Nosova 2, Alexandra V. Rozhkova 2, Margarita A. Vinogradina 2, Veronika B. Baserova 1, Mikhail A. Popov 3, Svetlana A. Limborska 2, Liudmila V. Dergunova 2
1 Laboratory of Structural Fundamentals of Lipoprotein Metabolism, National Medical Research Center for Therapy and Preventive Medicine, 101990 Moscow, Russia
2 Laboratory of Human Molecular Genetics, National Research Center “Kurchatov Institute”, 123182 Moscow, Russia
3 Cardiosurgery Department, M.F. Vladimirsky Moscow Regional Research and Clinical Institute MONIKI, 129090 Moscow, Russia
Abstract
The associations of high-density lipoprotein (HDL) level and functionality with lipid metabolism, inflammation, and innate immunity in coronary artery disease (CAD) remain controversial. The differential expression of a set of genes related to HDL metabolism (24 genes) and atherogenesis (41 genes) in peripheral blood mononuclear cells (PBMC) from CAD and control patients with varied HDL cholesterol (HDL-C) levels was compared.
76 male patients 40–60 years old with CAD diagnosed by angiography and 63 control patients were divided into three groups with low, normal (1.0–1.4 mM), and increased HDL-C levels. Transcript levels were measured by real-time PCR. The differentially expressed genes (DEGs) and associated metabolic pathways were analyzed for three groups, with prevalent CAD as an outcome.
The common feature was the increased odds ratio values for liver X receptor (LXR) gene expression for three patient groups. CAD patients with low HDL-C possessed 24 DEGs with lower expression of genes involved in cholesterol efflux, and down-regulated SREBF1 and ABCG1 are suggested as gene signatures. CAD patients with normal HDL-C possessed nine DEGs with down-regulated ITGAM and ALB as gene signatures. CAD patients with increased HDL-C possessed 19 DEGs with down-regulated APOA1 and HMGCR as gene signatures. With gene expression signatures, one standard deviation higher average gene expressions were associated with 5.1-, 48.8-, and 38.9-fold fewer CAD cases for three patient groups. As HDL-C increased in CAD patients, the expression of ABCG1, CUBN, and HDLBP genes increased, while the expression of HMGCR and NPC2 genes, involved in cholesterol synthesis and trafficking, decreased. The expression of CD14, CD36, S100A8, S100A9, S100A12, TLR5, TLR8, and VEGFA genes, involved in angiogenesis and inflammation mainly via nuclear factor-κB (NF-κB), decreased.
The increased accumulation of cholesteryl ester in PBMC from patients with low HDL-C was suggested. This assumption contrasts with the suggested accumulation of free cholesterol in PBMC from patients with increased HDL-C, concomitant with suppression of cholesterol synthesis and traffic to the plasma membrane, and with an inflammatory state controlled by depressed CD36-mediated and upregulated apoE-mediated immunometabolic signaling. Gene signatures may be used for the diagnosis, prognosis, and treatment of CAD in dependence on HDL-C levels.
Keywords
- atherosclerosis
- coronary artery disease
- differentially expressed genes
- HDL metabolism
- inflammation
- transcript
Atherosclerosis of coronary arteries involves disturbances in lipid metabolism, inflammation, and immune state in macrophages, endothelium, and smooth muscle cells. These disturbances result in cell rewiring, the growth of atherosclerotic plaques in the vessel wall, and revascularization [1, 2]. Lipids have been regarded for a long time as exogenous molecules in immune responses. However, lipid metabolism is increasingly becoming evident to play a central role in macrophage activation and reprogramming via the regulation of signal transduction and gene expression [1]. Macrophage heterogeneity results in the visualization of three main clusters, including resident-like, inflammatory, and triggering receptors expressed on myeloid cells-2 (Trem2ℎ𝑖), as the major subtypes of monocyte-derived foam cells in atherosclerotic plaques [2]. Of note, the foamy macrophages are not related to inflammatory reactions [3, 4].
Intracellular cholesterol stationary concentration is determined by several pathways that include cholesterol synthesis and uptake of cholesterol-containing lipoproteins, cholesterol traffic between the plasma membrane, Goldgi, and endoplasmic reticulum, and cholesterol efflux. These pathways, in turn, are controlled by positive and negative feedback mechanisms that track intracellular cholesterol accumulation. The liver X receptors (LXRs) NR1H2 and NR1H3 promote cholesterol excretion and catabolism by the direct binding of cholesterol derivatives via the positive forward mechanism [5]. The expression of the HMGCR gene, which encodes the rate-limiting enzyme in cholesterol synthesis, and the LDLR gene, which encodes the receptor involved in the uptake of cholesterol-containing low-density lipoprotein (LDL) particles, is controlled by the sterol regulatory element binding protein 2 (SREBP2) transcription factor via a negative feedback mechanism [6]. Cholesterol efflux proceeds through energy-dependent transport processes with ATP binding cassette subfamily A member 1 (ABCA1) and ABCG1 transporters, facilitated diffusion with scavenger receptor class B type 1 (SR-B1), and passive diffusion with albumin molecules as a shuttle [7, 8]. Cholesterol and phospholipid molecules effluxed from macrophages by ABCA1 are accepted exclusively by the lipid-free apolipoprotein apoA-I, which is the major protein moiety of high-density lipoprotein (HDL), whereas those effluxed by ABCG1 are accepted by HDL [9]. Cholesterol efflux is a first and rate-limited step in reverse cholesterol transport from peripheric cells to the liver. The subsequent steps include the esterification of effluxed cholesterol in HDL by lecithin: cholesterol acyltransferase coded by the LCAT gene, hetero-exchange of cholesteryl ester and triglyceride molecules between HDL and LDL, and, finally, the selective capture of cholesteryl ester molecules in HDL via SR-B1 and the uptake of a whole LDL particle by the LDL receptor in the liver. The ability of HDL to accept cholesterol effluxed from macrophage foam cells overloaded with cholesteryl ester underlies its beneficial effects in acute coronary syndrome and cardiovascular disease [9]. The impairment of reverse cholesterol transport and systemic and vascular inflammation has been proposed to convert HDL to a dysfunctional form that has impaired antiatherogenic effects [10] that may be restored by HDL-based nanomedicine [11]. Moreover, the recent findings revealed the U-shaped dependency between HDL-C and cardiovascular disease mortality [12].
Recently, based on bioinformatic approaches, we annotated the limited gene set sensitive to HDL metabolism and atherogenesis [13] and further applied it to the study of differential expression in coronary artery disease (CAD) without stratification by HDL-C levels [14]. Here, we extended this study by applying such stratification to three groups with low, normal, and high HDL-C levels in the same cohort of CAD patients to reveal HDL-C-specific gene signatures for more accurate prognosis and treatment in CAD. The use of a combined set of several biomarkers for the diagnosis and prognosis of CAD is increasingly recognized [15]. Our primary goal was to measure the expression level of 65 genes related to HDL metabolism and atherogenesis in RNA from peripheral blood mononuclear cells (PBMC) from CAD and control patients in dependence of HDL-C levels. It is a common practice to use PBMC to reveal differentially expressed genes in CAD [16, 17]. Compared to those in the controls, the gene expression in CAD patients was dependent on HDL-C level and was characterized by the common downregulation of genes involved in reversed cholesterol transport in hypoalphalipoproteinemia. However, free cholesterol seems to accumulate in PBMC from CAD patients with hyperalphalipoproteinemia, concomitant with suppression of cholesterol synthesis and traffic to the plasma membrane, and the inflammatory state is assumed to be controlled by depressed CD36– and upregulated apoE-mediated immunometabolic signaling. These HDL-associated changes in lipid metabolism and inflammation state in PBMC are further assumed to reflect macrophage rewiring in the coronary arteries in CAD.
The control cohort included 63 patients without coronary atherosclerosis, and
the second one included 76 patients with CAD and stenosis of coronary arteries
confirmed by coronary angiography. The hemodynamically significant stenosis was
diagnosed in a case of more than 50% luminal narrowing in at least one vessel.
The number of stenosis in CAD patients varied from 1 to 4 lesions. The patients
in the control cohort were without any visible stenosis or with hemodynamically
insignificant (
PBMC preparation, total RNA isolation, cDNA synthesis, gene-specific primers, and real-time PCR conditions were described in our preceding paper [14]. Two gene clusters were selected to follow HDL metabolism and atherogenesis [13]. HDL cluster (24 genes) included ALB, A2M, AMN, APOA1, APOE, ABCA1, ABCA5, ABCG1, BMP1, CETP, CUBN, HDLBP, HMGCR, LCAT, LIPC, LPL, LDLR, PLTP, PRKACA, PRKACB, PRKACG, SCARB1, SOAT1, and ZDHHC8 genes. Atherogen cluster (41 genes) included ASGR2, CD14, CD36, F5, CSF1R, CSF2RB, CXCL5, CYBA, ITGA2B, ITGAM, ITGB3, ICAM1, IL1B, IL1R1, IL18, IL18R1, IL18RAP, JAM3, LTA, MMP9, MGST1, NPC1, NPC2, NR1H2, NR1H3, OLR1, PCTP, PLA2G7, PRKCQ, S100A12, S100A8, S100A9, SLPI, SLC7A11, SREBF1, SOD2, TNFRSF1A, TNFRSF1B, TLR5, TLR8, and VEGFA genes. Housekeeping genes included GAPDH, LDHA, and RPL3 genes.
Functional enrichment analysis was done with the Gene Ontology (GO, http://geneontology.org) [19, 20] and Reactome [21] pathway databases. GO categories and Reactome pathways were detected with the online tool Database for Annotation, Visualization and Integrated Discovery (DAVID) [22] (https://david.ncifcrf.gov/). The protein-protein interactions (PPI) were analyzed with the Search Tool for the Retrieval of Interacting Genes (STRING) database [23] (https://string-db.org/) and subsequent visualization with Cytoscape [24]. The CytoHubba plugin, with the maximal clique centrality (MCC) algorithm as the best node ranking method [25], was used to find the hub genes. The p value for PPI enrichment is an indicator of interaction efficiency.
Statistica 13 software (StatSoft, Inc. STATISTICA (data analysis software
system), version 13. https://www.statsoft.com) was used. The Kolmogorov-Smirnov test was
used to check for normality. Differences in continuous variables between groups
were analyzed by the Mann-Whitney test. The statistical significance limit was
accepted as p
The prevalence of the overall differentially expressed gene (DEG) sets in CAD and the performance of the hub genes as gene signatures for CAD patients with low, normal, and high HDL-C values were evaluated with logistic regression and ROC analysis. The Z score [29] was used for the calculation of the odds ratio per unit standard deviation (SD) increase to predict CAD prevalence with the proposed gene signature in dependence on HDL-C level. The raw expression values for two genes, which were considered specific gene signatures for groups with different HDL-C levels, were initially transformed into average composite Z scores and then used in logistic regression analysis together with individual Z scores for covariates. The area under the curve (AUC), sensitivity, and specificity were the measures of the overall performance of the procedure. These calculations were performed with MedCalc Statistical Software version 22.016 (MedCalc Software, Ostend, Belgium).
The subjects were divided into Group 1, Group 2, and Group 3 with low, normal, and elevated HDL-C. Anthropometric and laboratory data for each group are given in Table 1. For the control cohort, the numbers of patients in the three groups were equal to 19, 25, and 19 patients, respectively. These groups did not differ from each other by body mass index (BMI) or age. However, the mean HDL-C and apoA-I values significantly increased, while the atherogenicity index decreased with the increase in HDL-C, as expected. The mean levels of total cholesterol, LDL-C, non-HDL-C, and apoB for Groups 2 and 3, as compared with Group 1, were significantly higher. Patients with hyperalphalipoproteinemia possessed the lowest triglyceride (TG) and very low-density lipoprotein cholesterol (VLDL-C) levels (Table 1). For the CAD cohort, three groups of patients with low, normal, and increased HDL-C levels included 34, 23, and 19 patients, respectively. The above-mentioned changes in lipid and anthropometric data for between-group comparison for the control cohort generally existed for between-group comparison for CAD patients as well (Table 1). However, the identical groups in two cohorts differed significantly from each other by age, HDL-C, apoA-I, and atherogenicity index, LDL-C, non-HDL-C, and TG. Importantly, CAD patients with hyperalphalipoproteinemia possessed increased HDL-C and apoA-I levels. Also, the significant decrease of total cholesterol and LDL-C in Groups 1 and 2 for CAD patients, together with a tendency for Group 3 in comparison with the analogous groups from the control cohort, may originate from the prevalence of small, dense LDL in the blood of CAD patients with the concomitant decrease of the atherogenicity index. Small, dense LDL are characterized by a decreased cholesterol level per single apoB molecule [30].
| Control | CAD | |||||
| Group 1 (n = 19) | Group 2 (n = 25) | Group 3 (n = 19) | Group 1 (n = 34) | Group 2 (n = 23) | Group 3 (n = 19) | |
| HDL-C, mM | 0.82 |
1.18 |
1.78 |
0.78 |
1.16 |
2.06 |
| Chol, mM | 4.00 |
5.23 |
5.84 |
3.39 |
4.45 |
5.39 |
| LDL-C, mM | 2.43 |
3.23 |
3.52 |
1.86 |
2.53 |
2.88 |
| VLDL-C, mM | 0.78 |
0.82 |
0.54 |
0.76 |
0.75 |
0.45 |
| nonHDL-C, mM | 3.18 |
4.05 |
4.06 |
2.61 |
3.29 |
3.33 |
| TG, mM | 1.67 |
1.74 |
1.18 |
1.89 |
1.64 |
0.98 |
| AI | 4.12 |
3.44 |
2.36 |
3.59 |
2.81 |
1.67 |
| apoA-I, mg/dL | 112.08 |
131.29 |
180.57 |
121.36 |
154.95 |
226.41 |
| apoB, mg/dL | 77.44 |
91.81 |
91.52 |
79.51 |
93.53 |
82.07 |
| BMI, kg/m2 | 28.48 |
28.70 |
28.68 |
28.81 |
26.90 |
28.46 |
| age, year | 47.26 |
49.12 |
50.74 |
54.29 |
53.70 |
54.11 |
Mean
The differential expression as transcript level in CAD versus control (fold change) was analyzed separately for three groups with the REST software, and the data are given in Fig. 1A–C. Twenty-four DEGs existed in Group 1 (low HDL-C), with five up-regulated and nineteen down-regulated genes. The PPI network was constructed with STRING and Cytoscape (Fig. 2A). The top five hub genes revealed by the Cytohubba maximal clique centrality (MCC) algorithm include ABCA1, SREBF1, ABCG1, SCARB1, and LPL genes in decreasing significance order. Nine DEGs existed in Group 2 (normal HDL-C) with five up-regulated and four down-regulated genes (Fig. 2B). The top five hub genes include the APOE, ITGAM, ALB, CD14, and NR1H3 genes. Nineteen DEGs existed in Group 3 (elevated HDL-C) with six up-regulated and thirteen down-regulated genes (Fig. 2C). The top five hub genes include APOE, APOA1, HMGCR, LCAT, and OLR1. Thus, the DEG profiles in the three groups of CAD patients with different HDL-C levels were quite different from each other, and Group 2 with normal HDL-C was much more uniform compared to the profiles in CAD Groups 1 and 3 with low and elevated HDL-C.
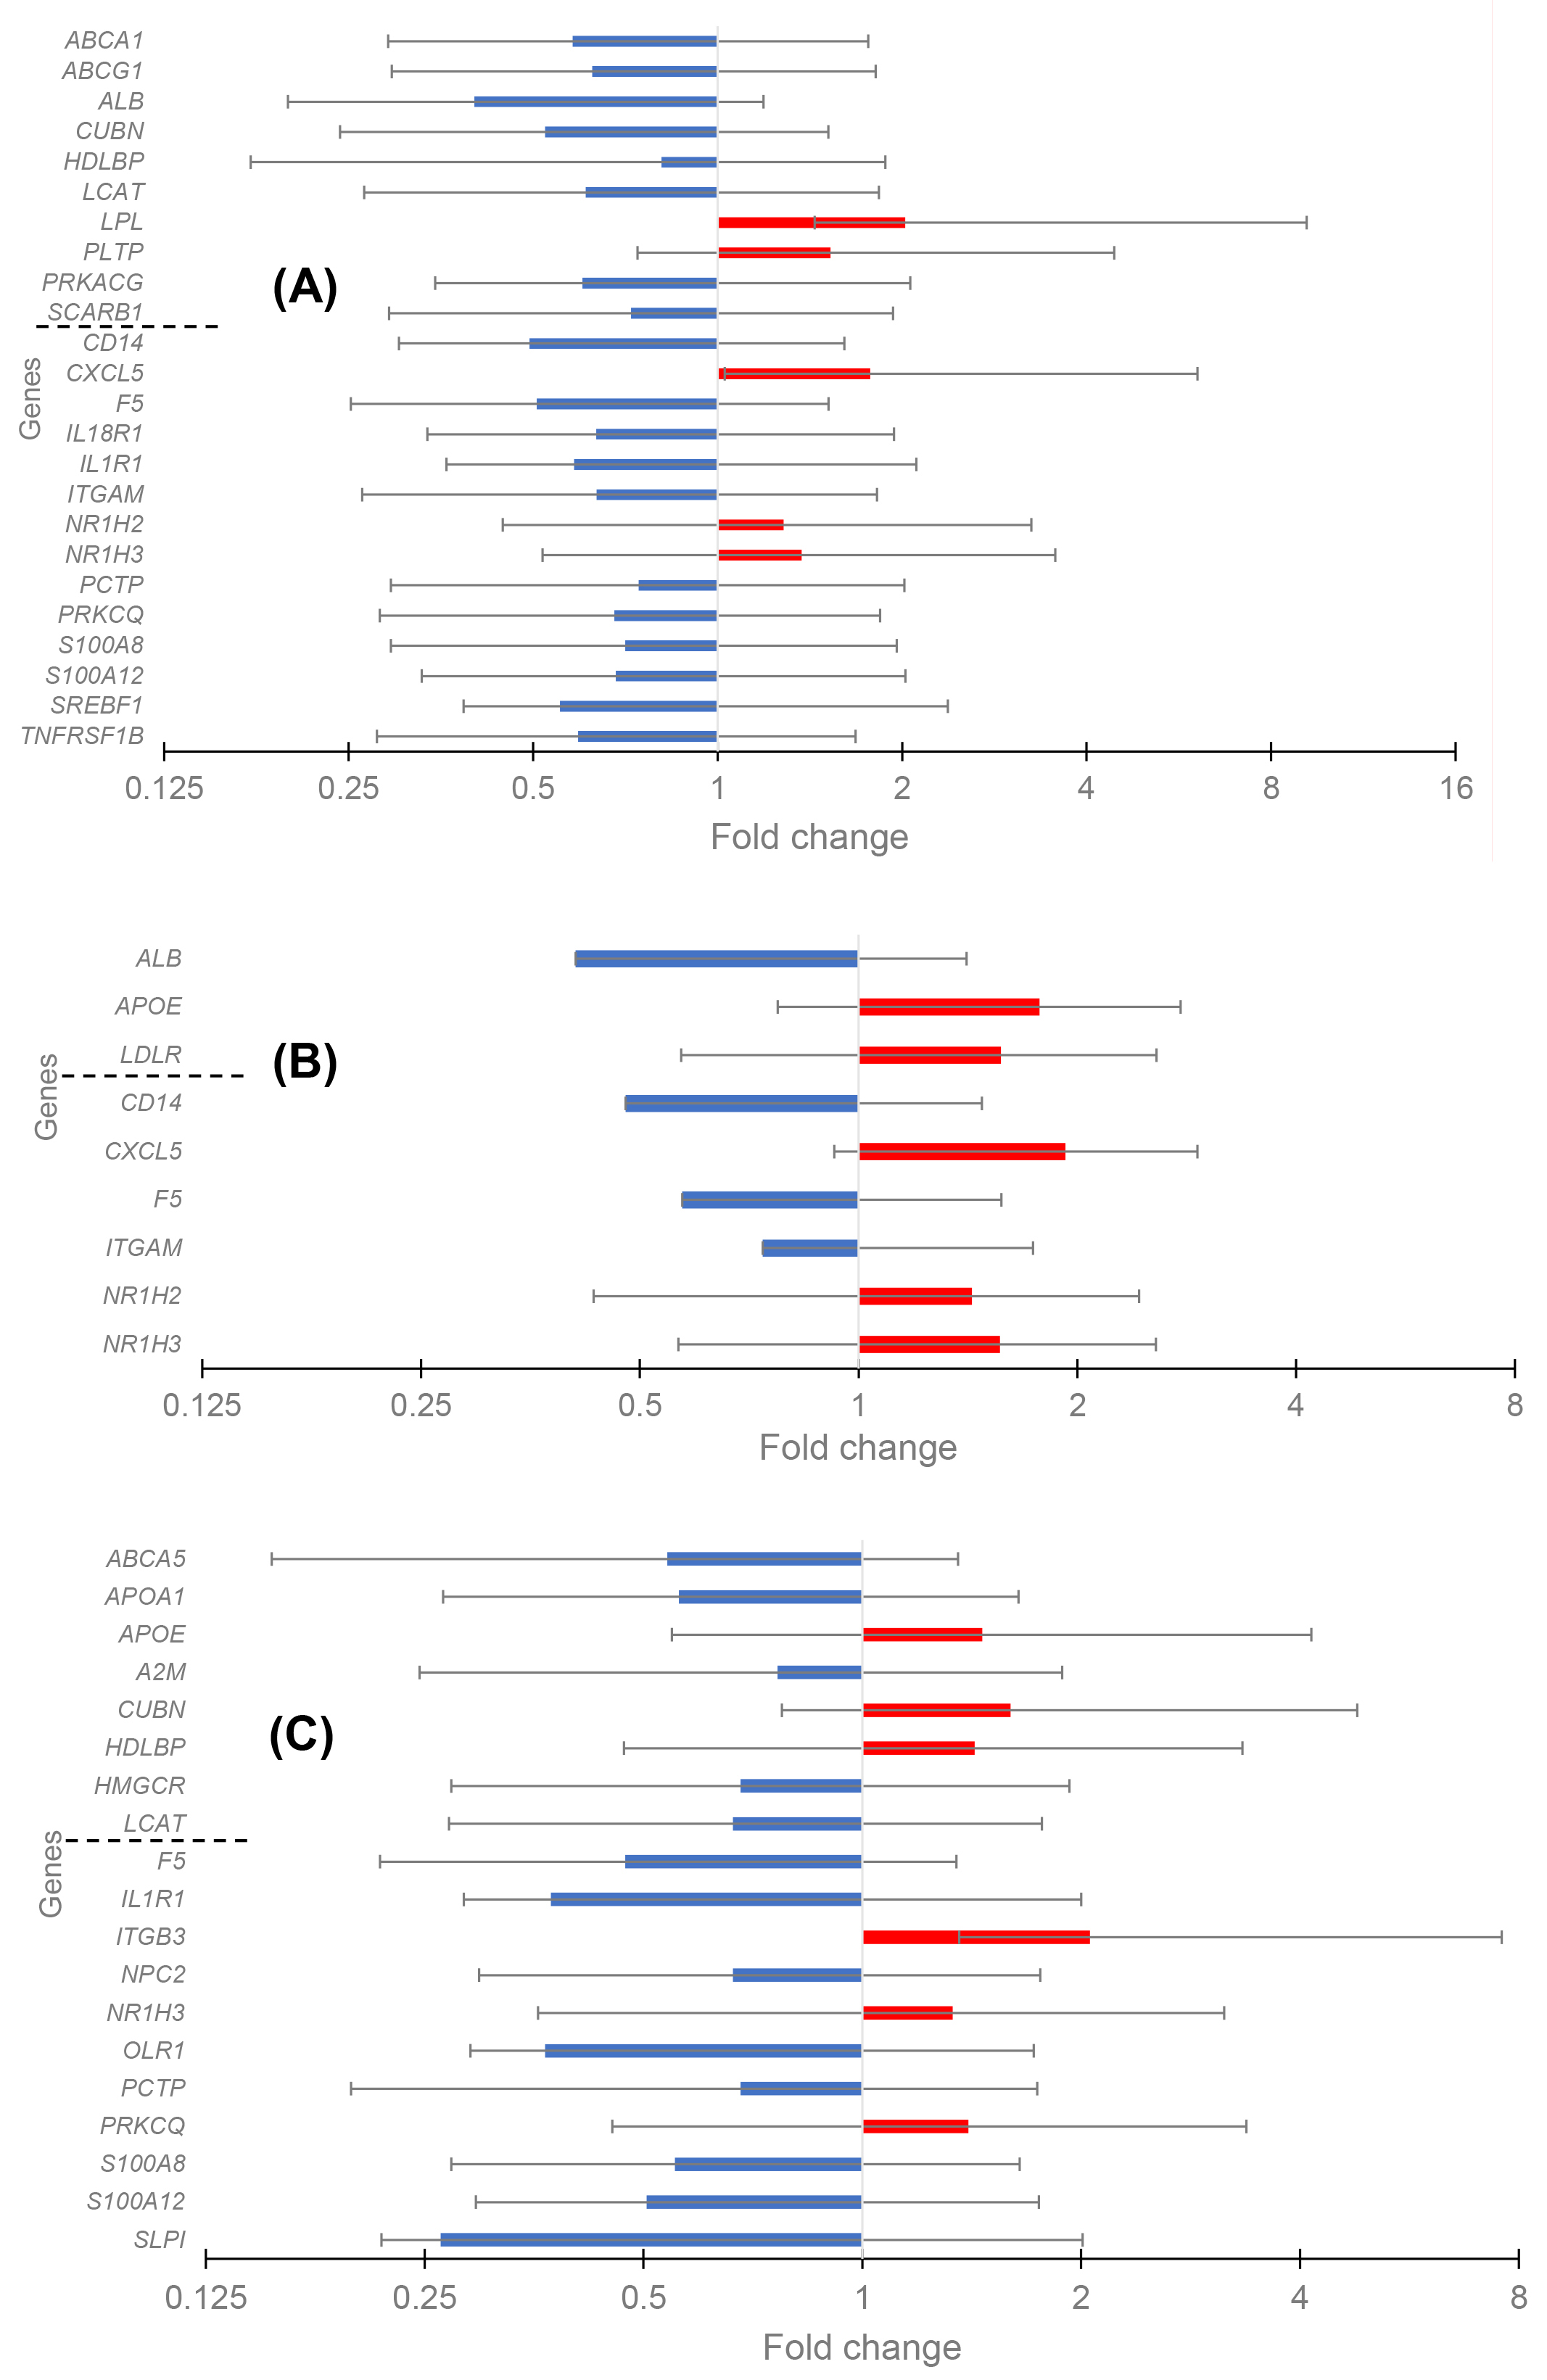 Fig. 1.
The change of gene expression in coronary artery disease (CAD) in three groups of patients. High-density lipoprotein (HDL) cluster and atherogen cluster are separated to upper and lower parts. (A) Differentially expressed genes (DEGs) in the Group 1 with low HDL-C level. (B) DEGs in the Group 2 with normal HDL-C level. (C) DEGs in the Group 3 with high HDL-C level.
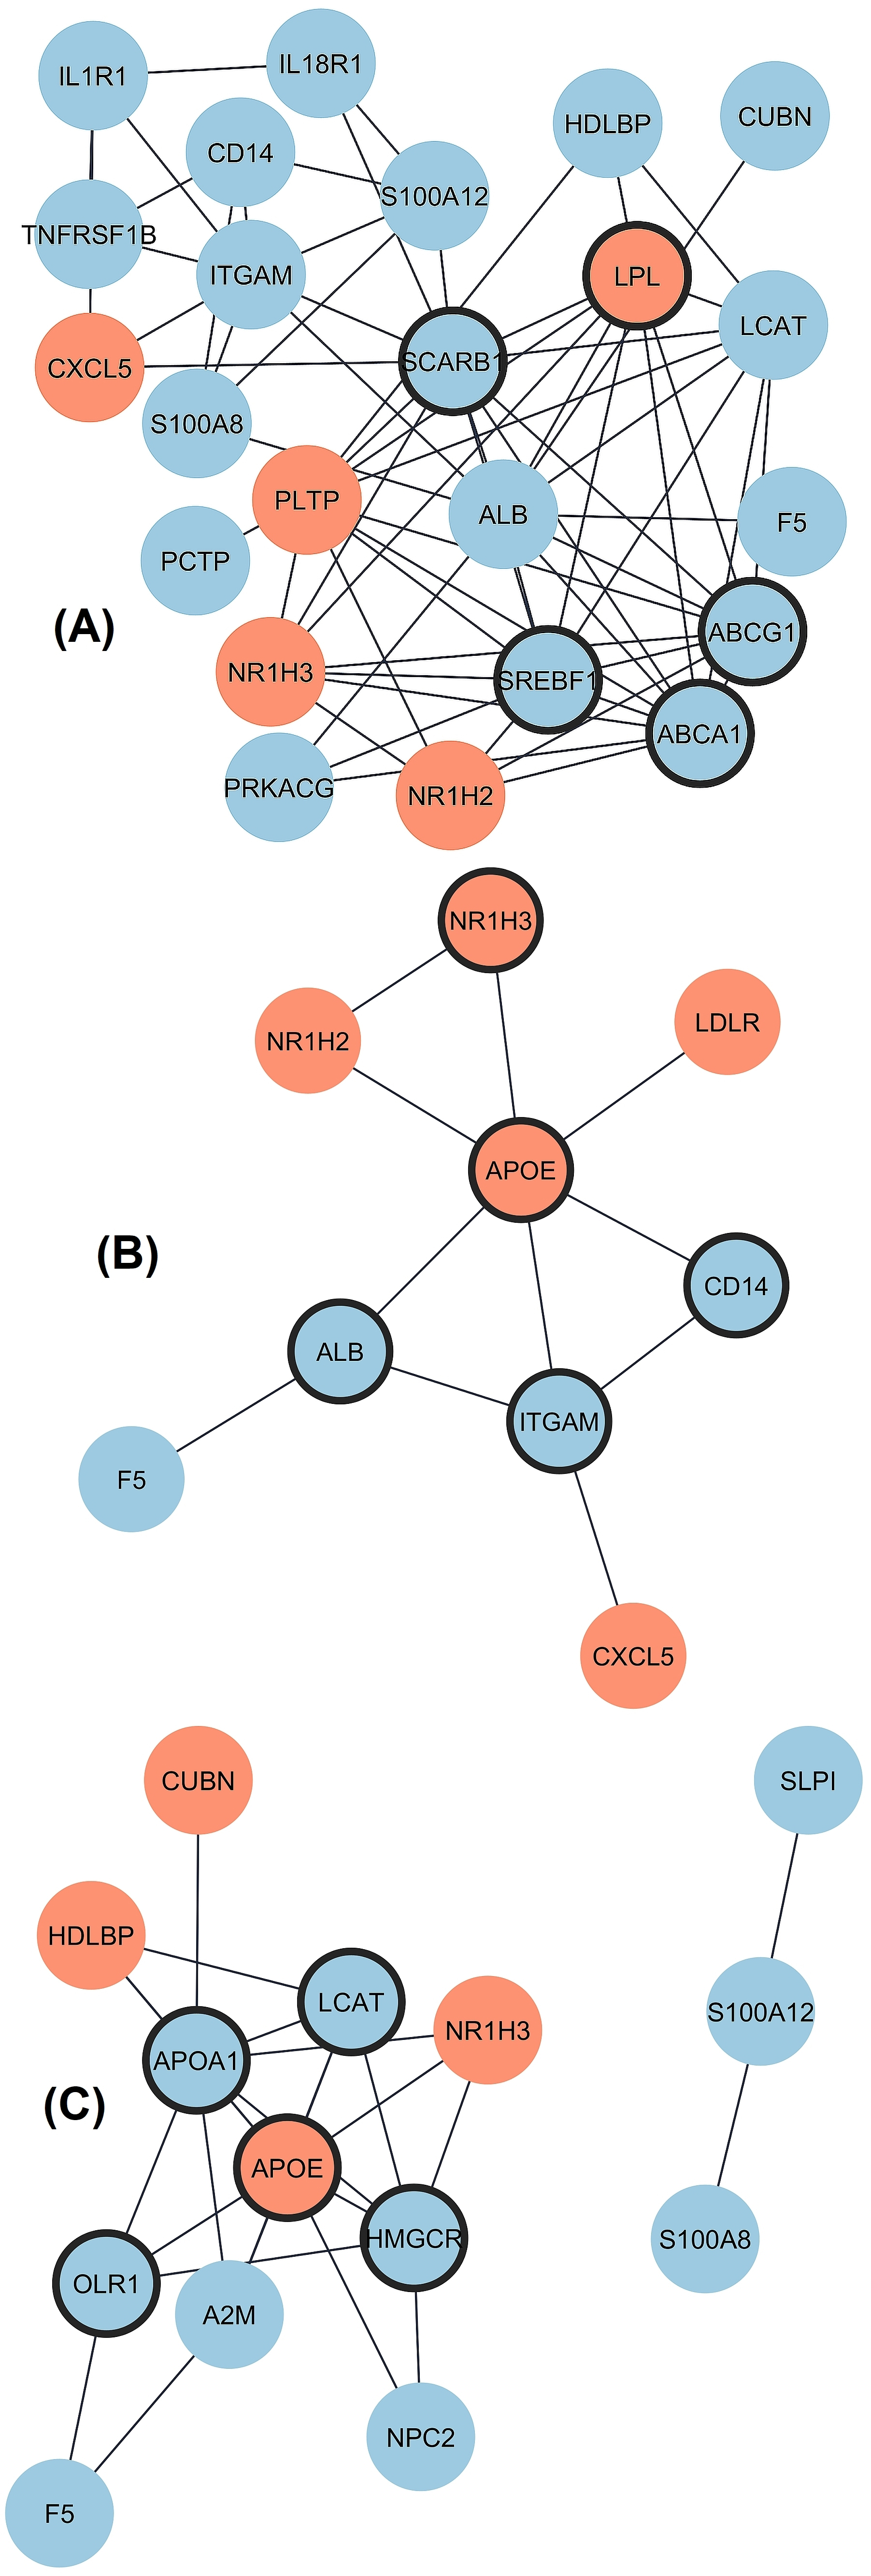 Fig. 2.
Interaction of proteins coded by DEGs in three groups
of CAD patients divided by HDL-C level. Upregulated and downregulated genes are
marked by red and blue color, respectively and hub genes are marked by thick
borderline. (A) Network for Group 1 includes 23 connected nodes (1 disconnected)
and 67 edges with protein-protein interactions (PPI) enrichment p-value
The differential expression for control and CAD patients with different HDL-C levels was evaluated to reveal the possible HDL-associated atheroprotective effect. For the control cohort, only four DEGs, all with down-regulated expression (CUBN, MGST1, PRKCQ, and TLR8), were present in the comparison of high HDL-C versus low HDL-C groups. The data for CAD patients with high (n = 19) and low (n = 34) HDL-C levels are given in Fig. 3. Totally twenty-nine DEGs existed, with ten up-regulated and nineteen down-regulated genes.
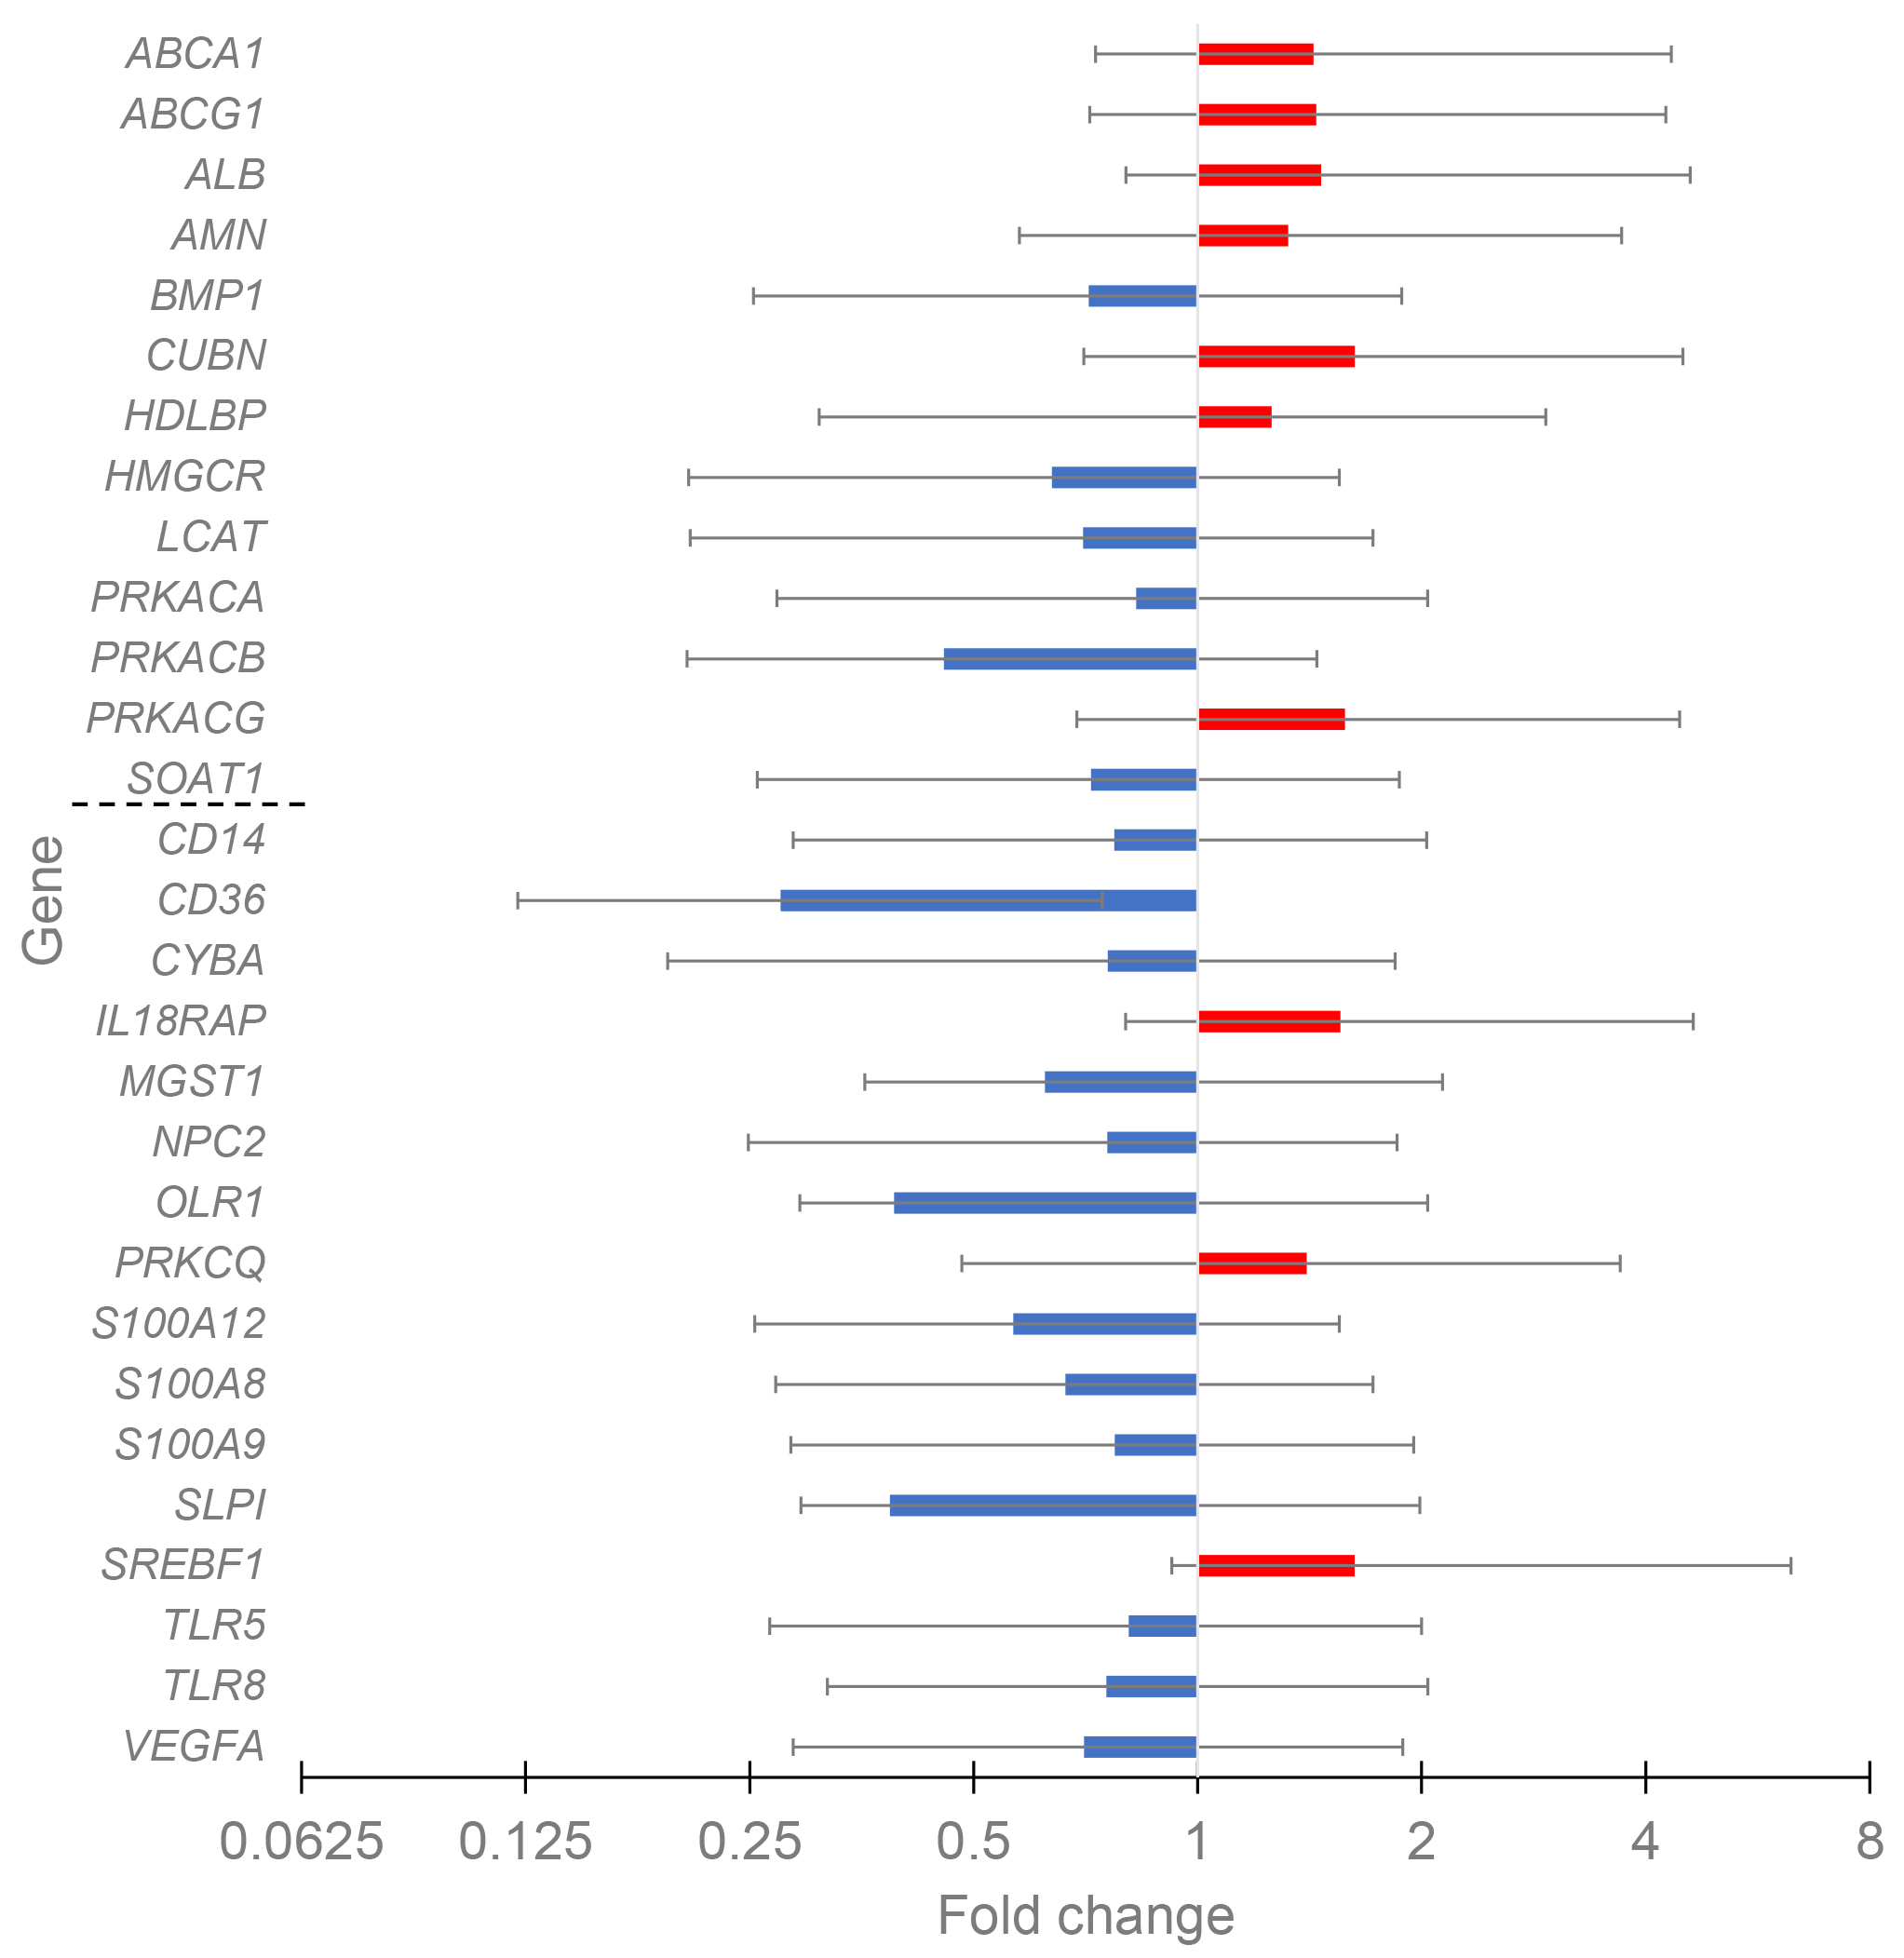 Fig. 3.
The change of gene expression in CAD groups with HDL-C high vs. HDL-C low. The groups included 19 and 34 patients, respectively. HDL cluster and atherogen cluster are separated by thin line to upper and lower parts.
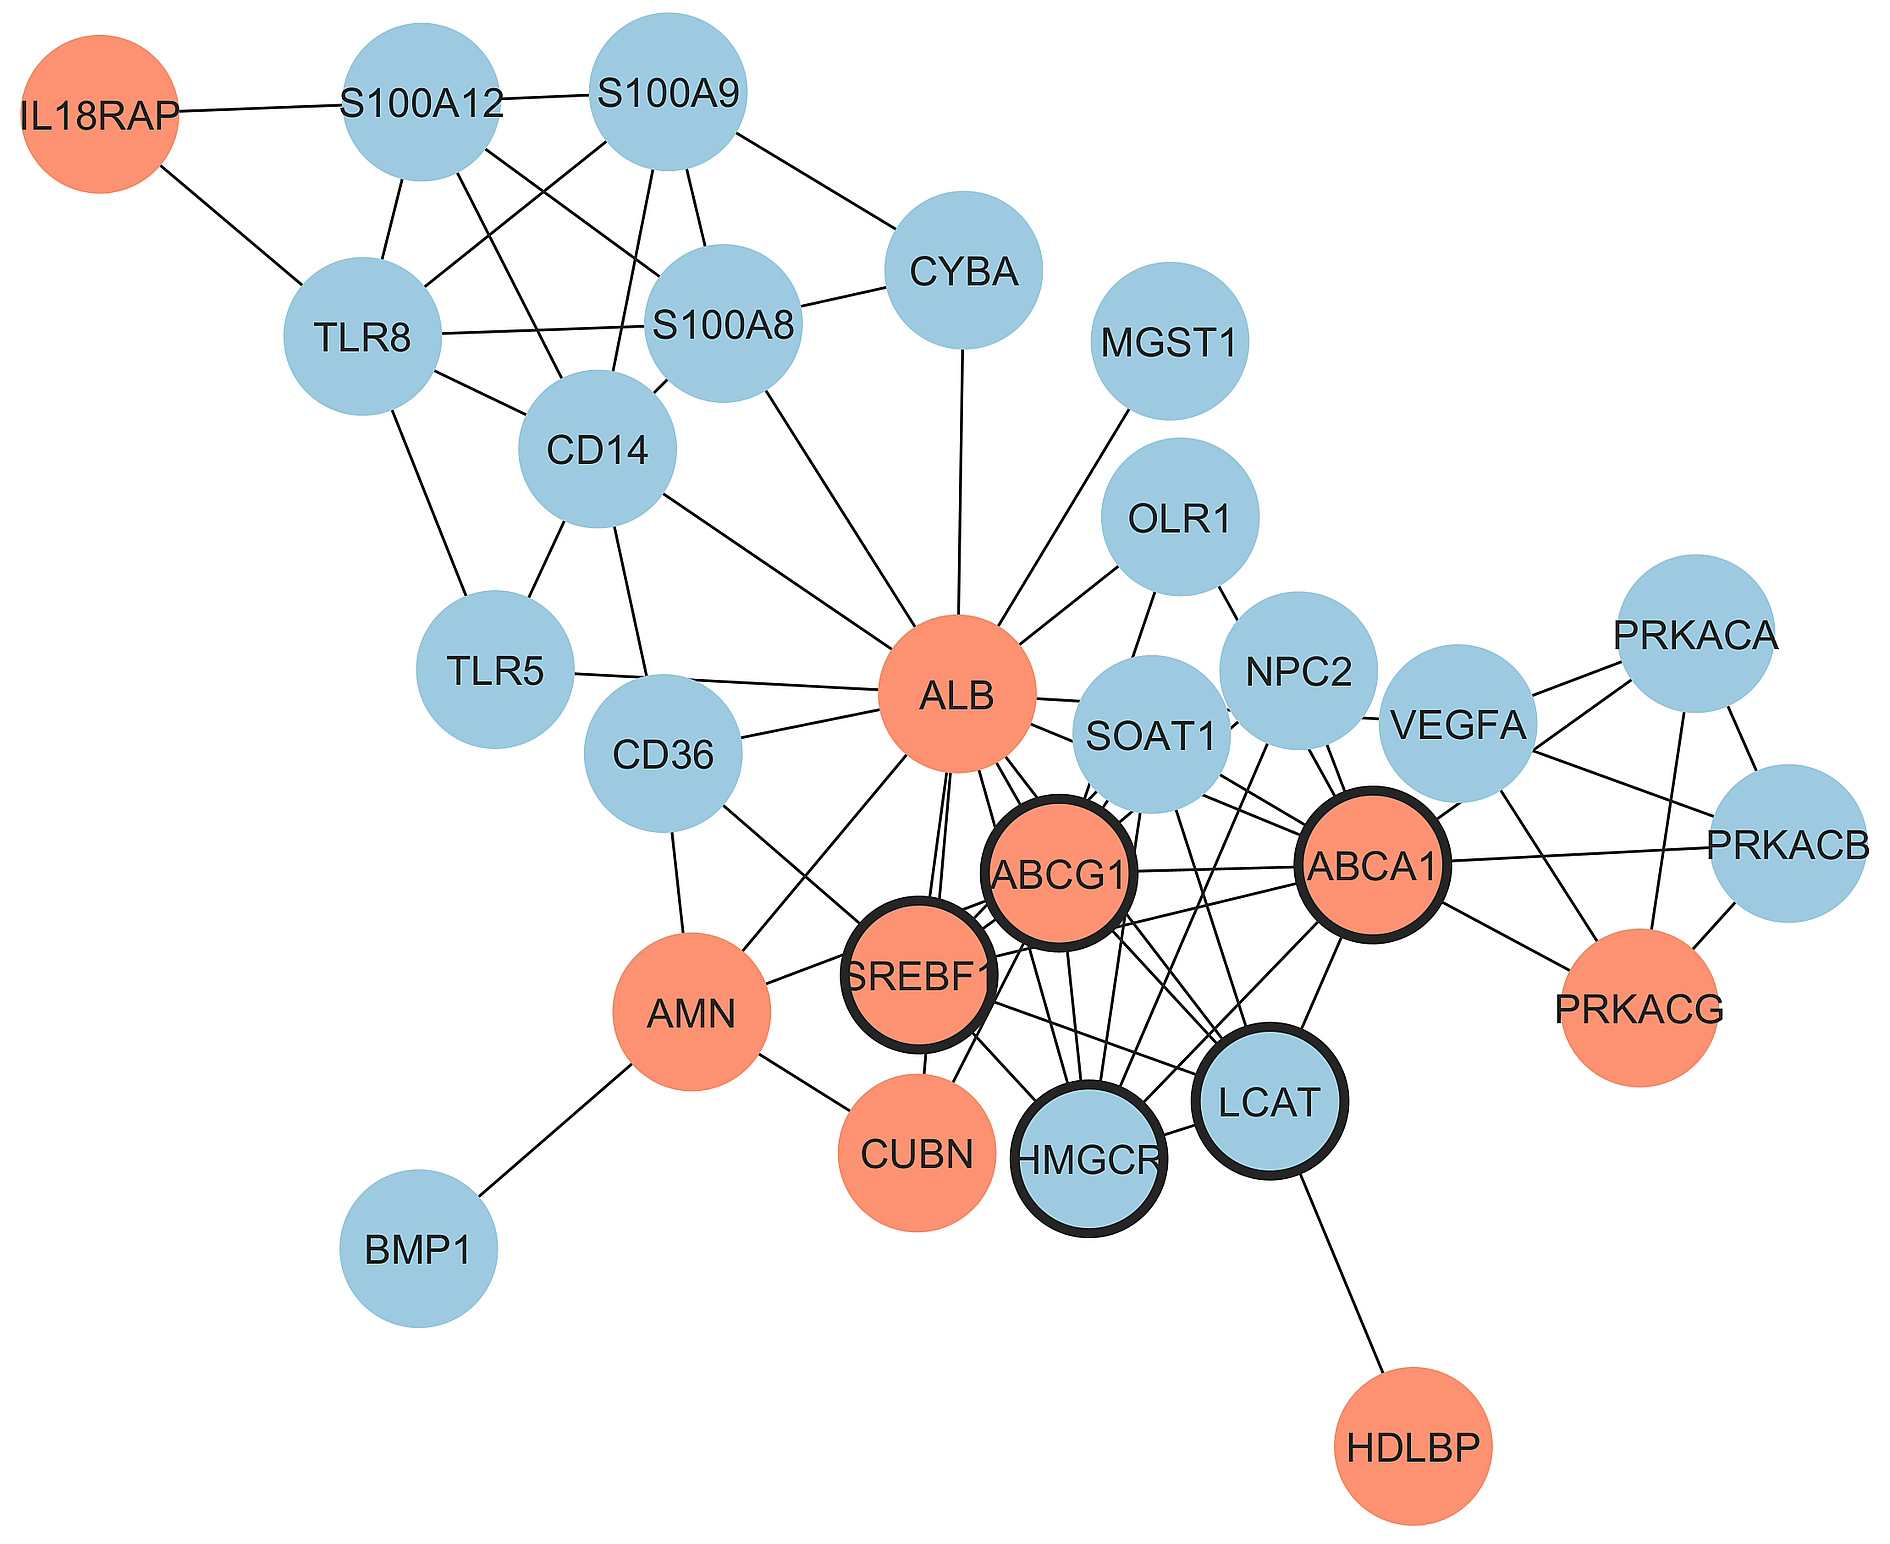
Notably, in the HDL cluster among thirteen genes with significant fold change, the expression of seven genes increased with the increase of HDL-C, while in the atherogen cluster among sixteen genes with significant fold change, the expression of only three genes increased. Thus, the balance between proatherogenic and atheroprotective properties of HDL moves in the atheroprotection direction with the increase of HDL-C in CAD patients. Major effects belong to the increased expression of genes involved in reverse cholesterol transport (ABCA1, ABCG1, and ALB) and to the decreased expression of immunity- and inflammation-prone genes (CD14, CD36, OLR1, S100A12, S100A8, S100A9, TLR5, and TLR8). The PPI network for DEGs in CAD groups with different HDL-C levels was constructed with STRING and Cytoscape (Fig. 4). The top five hub genes revealed by the Cytohubba MCC algorithm include ABCG1, ABCA1, HMGCR, SREBF1, and LCAT genes, all belonging to cholesterol reverse transport.
 Fig. 4.
Protein-protein interactions for the comparison of
CAD_HDL-C_high vs. CAD HDL-C_low groups. Upregulated and
downregulated genes are marked by red and blue color, respectively and hub genes
are marked by thick borderline. Network includes 27 connected nodes (2
disconnected) and 68 edges with PPI enrichment p-value:
The functional enrichment of DEGs based on Gene Ontology categories (Biological Process, Molecular Function, and Cellular Component) was done with the DAVID online tool, and the data are given in Supplementary Table 1 for between-cohort comparisons of three groups of CAD patients and control patients with similar HDL-C. DEG for in-cohort comparisons of CAD patients with high and low HDL-C is also included in Supplementary Table 1. The common biological process for all three between-cohort comparisons included GO:0010875 (positive regulation of cholesterol efflux). However, GO:0008203 (cholesterol metabolic process) and GO:0006954 (inflammatory response) existed only for the between-cohort comparison of Groups 1 and 3 with low and high HDL-C, respectively. Notably, the different genes are involved in the same biological process in dependence on HDL-C. For instance, APOE inclusion in GO:0010875 (positive regulation of cholesterol efflux) for between-cohort comparisons of Groups 2 and 3 is remarkable. Also, SREBF1 for the Group 1 comparison and ABCA5 and NPC2 for Group 3 were associated with HDL-C. Thus, besides other biological processes that existed for CAD-control comparisons for groups with similar HDL-C, the most significant are the regulation of cholesterol efflux and inflammatory response processes. Functional enrichment by molecular function for between-cohort comparisons of CAD patients with controls revealed various molecular interactions specific for a given HDL-C range (Supplementary Table 1).
Biological processes unique for DEGs in the cohort comparison of CAD patients with high and low HDL-C include GO:0051092 (positive regulation of NF-kappaB transcription factor activity), GO:0045087 (innate immune response), and GO:0032367 (intracellular cholesterol transport). Functional enrichment by molecular function for in-cohort comparison of CAD patients with high and low HDL-C revealed the involvement of GO:0004691 (cAMP-dependent protein kinase activity) and GO:0050786 (RAGE receptor binding).
Functional enrichment by cellular component GO category for both between-cohort and in-cohort comparisons revealed the various intracellular, membrane, and extracellular regions as DEG targets (Supplementary Table 1).
The GO analysis was further complemented by Reactome pathway analysis (Supplementary Table 2). Reactome pathways were also HDL-C-specific, and the common pathways R-HSA-174824 (Plasma lipoprotein assembly, remodeling, and clearance), R-HSA-382551 (Transport of small molecules), and R-HSA-8964043 (Plasma lipoprotein clearance) included different genes for between-cohort comparisons. Notably, the expression of CUBN and HDLBP, downregulated in Group 1 and upregulated in Group 3, may modify the underlying pathway reactions. The R-HSA-9029569 (NR1H3 and NR1H2 regulate gene expression linked to cholesterol transport and efflux) pathway was significant only for Groups 1 and 2. The particular pathway pool, existing only in Group 3, included R-HSA-76002 (Platelet activation, signaling and aggregation), R-HSA-114608 (Platelet degranulation), and R-HSA-76005 (Response to elevated platelet cytosolic Ca2+), thus evidencing the contribution of elevated HDL concentration to platelet function.
The five most significant pathways responsible for lipoprotein and HDL metabolism for in-cohort comparison of CAD patients with high and low HDL-C included R-HSA-174824 (Plasma lipoprotein assembly, remodeling, and clearance), R-HSA-8963896 (HDL assembly), R-HSA-8963898 (Plasma lipoprotein assembly), R-HSA-8964043 (Plasma lipoprotein clearance), and R-HSA-8964011 (HDL clearance). The gene expression changes in these pathways coincide with the improvement of HDL metabolism with the increase of HDL-C in CAD patients. The pathways unique for DEGs for in-cohort comparison of CAD patients with high and low HDL-C included R-HSA-168249 (Innate Immune System), R-HSA-168256 (Immune System), R-HSA-5602358 (Diseases associated with the TLR signaling cascade), R-HSA-6798695 (Neutrophil degranulation), R-HSA-4420097 (VEGFA-VEGFR2 Pathway), and R-HSA-1280218 (Adaptive Immune System). Again, the gene expression change in these pathways coincides with the improvement of inflammation and immune status with the increase of HDL-C in CAD patients.
Logistic regression and ROC analysis with CAD presence as the output (CAD = 1,
control = 0) were used to estimate the prevalence of transcript levels with CAD
in relation to HDL-C. The values of the relative gene expression for different
genes varied by several orders of magnitude, which excluded the correct
comparison of odds ratios (OR) within and between patient groups. For a correct
comparison, the Z scores for all included variables in various models were used
in the logistic regression and ROC analyses. Thus, the odds ratio for a
particular transcript was adjusted for lipids and age. With this adjusted OR, the
odds of the outcome increase at OR
| DEG | OR (95% CI) | p | AUC (95% CI) | Sensitivity | Specificity | Model | |
| CAD vs. control (HDL-C low, 34/19) | |||||||
| ABCA1 | 0.15 (0.04 to 0.57) | 0.006 | 0.95 (0.86 to 0.99) | 91.18 | 89.47 | TG, nonHDL-C, age*, HDL-C | |
| ABCG1 | 0.29 (0.11 to 0.75) | 0.011 | 0.91 (0.79 to 0.97) | 91.18 | 84.21 | TG, age*, HDL-C | |
| ALB | 0.00 (0.00 to 0.71) | 0.036 | 0.96 (0.87 to 1.00) | 91.18 | 94.74 | TG, nonHDL-C, age*, HDL-C | |
| CD14 | 0.00 (0.00 to 0.26) | 0.019 | 0.97 (0.88 to 1.00) | 91.18 | 94.74 | TG, nonHDL-C*, age*, HDL-C | |
| CUBN | 0.12 (0.02 to 0.75) | 0.023 | 0.96 (0.86 to 0.99) | 76.47 | 100.00 | TG, nonHDL-C, age*, HDL-C | |
| CXCL5 | 3.45 (1.31 to 9.13) | 0.013 | 0.80 (0.67 to 0.90) | 55.88 | 94.74 | TG, nonHDL-C, HDL-C | |
| F5 | 0.01 (0.00 to 0.65) | 0.029 | 0.97 (0.89 to 1.00) | 88.24 | 100.00 | TG, nonHDL-C, age*, HDL-C | |
| HDLBP | 0.06 (0.01 to 0.56) | 0.013 | 0.94 (0.85 to 0.99) | 82.35 | 100.00 | TG*, nonHDL-C*, age*, HDL-C | |
| IL18R1 | 0.09 (0.01 to 0.88) | 0.038 | 0.96 (0.86 to 0.99) | 79.41 | 100.00 | TG, nonHDL-C, age*, HDL-C | |
| IL1R1 | 0.00 (0.00 to 0.85) | 0.045 | 0.98 (0.90 to 1.00) | 88.24 | 100.00 | TG, nonHDL-C*, age*, HDL-C* | |
| ITGAM | 0.00 (0.00 to 0.37) | 0.024 | 0.97 (0.89 to 1.00) | 85.29 | 100.00 | TG, nonHDL-C, age*, HDL-C | |
| LCAT | 0.05 (0.01 to 0.46) | 0.008 | 0.96 (0.87 to 1.00) | 97.06 | 89.47 | TG, nonHDL-C, age*, HDL-C | |
| LPL | 31.21 (1.30 to 750.76) | 0.034 | 0.92 (0.82 to 0.98) | 82.35 | 100.00 | TG, age*, HDL-C* | |
| NR1H2 | 2.19 (1.05 to 4.59) | 0.037 | 0.75 (0.62 to 0.86) | 58.82 | 84.21 | TG, nonHDL-C*, HDL-C | |
| NR1H3 | 6.76 (1.08 to 42.17) | 0.041 | 0.93 (0.83 to 0.98) | 79.41 | 100.00 | TG, nonHDL-C, age*, HDL-C | |
| PCTP | 0.09 (0.01 to 0.71) | 0.022 | 0.94 (0.85 to 0.99) | 91.18 | 94.74 | TG, nonHDL-C*, age*, HDL-C | |
| PRKACG | 0.28 (0.10 to 0.85) | 0.024 | 0.82 (0.69 to 0.91) | 61.76 | 94.74 | TG, nonHDL-C*, HDL-C | |
| PRKCQ | 0.09 (0.01 to 0.63) | 0.015 | 0.95 (0.85 to 0.99) | 97.06 | 77.78 | TG, nonHDL-C, age*, HDL-C | |
| S100A8 | 0.23 (0.06 to 0.98) | 0.046 | 0.93 (0.82 to 0.98) | 85.29 | 94.74 | nonHDL-C, age*, HDL-C* | |
| SCARB1 | 0.21 (0.06 to 0.68) | 0.009 | 0.95 (0.86 to 0.99) | 85.29 | 94.74 | TG, nonHDL-C*, age*, HDL-C | |
| SREBF1 | 0.35 (0.15 to 0.82) | 0.016 | 0.76 (0.62 to 0.87) | 94.12 | 63.16 | TG, nonHDL-C, HDL-C | |
| S100A12 | 0.40 (0.18 to 0.92) | 0.031 | 0.78 (0.65 to 0.88) | 94.12 | 63.16 | TG, nonHDL-C*, HDL-C | |
| TNFRSF1B | 0.08 (0.01 to 0.49) | 0.006 | 0.97 (0.88 to 1.00) | 94.12 | 94.74 | TG, nonHDL-C, age*, HDL-C | |
| CAD vs. control (HDL-C normal, 23/25) | |||||||
| ALB | 0.01 (0.00 to 0.51) | 0.024 | 0.92 (0.81 to 0.98) | 86.96 | 91.3 | TG, nonHDL-C, age*, HDL-C | |
| APOE | 2.65 (1.10 to 6.42) | 0.030 | 0.77 (0.62 to 0.88) | 91.3 | 59.09 | TG, HDL-C | |
| CD14 | 0.10 (0.00 to 2.61) | 0.006 | 0.91 (0.80 to 0.98) | 91.3 | 80.00 | TG, nonHDL-C, age, HDL-C | |
| CXCL5 | 20.42 (2.01 to 206.98) | 0.011 | 0.91 (0.79 to 0.97) | 86.96 | 92.00 | TG, nonHDL-C*, age, HDL-C | |
| F5 | 0.18 (0.05 to 0.68) | 0.012 | 0.89 (0.77 to 0.96) | 95.65 | 73.91 | TG, nonHDL-C, age, HDL-C | |
| ITGAM | 0.26 (0.08 to 0.85) | 0.026 | 0.87 (0.73 to 0.95) | 86.96 | 81.82 | TG, nonHDL-C, age*, HDL-C | |
| LDLR | 2.61 (1.11 to 6.14) | 0.028 | 0.86 (0.72 to 0.94) | 78.26 | 78.26 | TG, nonHDL-C, age*, HDL-C | |
| NR1H2 | 5.49 (1.66 to 18.11) | 0.005 | 0.89 (0.77 to 0.96) | 95.65 | 75.00 | TG, nonHDL-C, age*, HDL-C | |
| NR1H3 | 4.17 (1.35 to 12.85) | 0.013 | 0.88 (0.75 to 0.96) | 86.96 | 80.00 | TG, nonHDL-C, age*, HDL-C | |
| CAD vs. control (HDL-C elevated, 19/19) | |||||||
| ABCA5 | 0.31 (0.00 to 0.36) | 0.005 | 0.96 (0.84 to 1.00) | 100 | 84.21 | TG, nonHDL-C, age, HDL-C | |
| APOA1 | 0.00 (0.00 to 0.32) | 0.017 | 0.94 (0.82 to 0.99) | 78.95 | 100.00 | TG, nonHDL-C*, age, HDL-C | |
| APOE | 4.17 (1.10 to 15.88) | 0.036 | 0.88 (0.74 to 0.97) | 94.74 | 68.42 | TG, nonHDL-C, age, HDL-C | |
| CUBN | 2.90 (1.02 to 8.29) | 0.047 | 0.86 (0.70 to 0.95) | 84.21 | 78.95 | TG, nonHDL-C, age*, HDL-C | |
| F5 | 0.00 (0.00 to 0.05) | 0.009 | 0.92 (0.78 to 0.98) | 94.74 | 78.95 | TG, nonHDL-C, age, HDL-C | |
| HDLBP | 2.60 (1.04 to 6.54) | 0.042 | 0.82 (0.66 to 0.93) | 84.21 | 66.67 | TG, age*, HDL-C | |
| HMGCR | 0.26 (0.09 to 0.79) | 0.018 | 0.91 (0.78 to 0.98) | 89.47 | 89.47 | TG, nonHDL-C*, age, HDL-C | |
| IL1R1 | 0.06 (0.00 to 0.74) | 0.029 | 0.93 (0.79 to 0.99) | 100.00 | 84.21 | TG, nonHDL-C, age, HDL-C | |
| ITGB3 | 8.97 (1.06 to 76.25) | 0.045 | 0.88 (0.74 to 0.96) | 78.95 | 89.47 | TG, nonHDL-C, age* | |
| LCAT | 0.06 (0.01 to 0.54) | 0.013 | 0.91 (0.77 to 0.98) | 68.42 | 100.00 | TG, nonHDL-C, age, HDL-C | |
| NPC2 | 0.02 (0.00 to 0.74) | 0.033 | 0.85 (0.69 to 0.94) | 94.74 | 68.42 | TG, nonHDL-C, HDL-C | |
| NR1H3 | 3.90 (1.09 to 13.99) | 0.037 | 0.89 (0.75 to 0.97) | 94.74 | 77.78 | TG, nonHDL-C*, age, HDL-C | |
| PCTP | 0.00 (0.00 to 0.57) | 0.032 | 0.89 (0.74 to 0.97) | 78.95 | 78.95 | TG, nonHDL-C, age, HDL-C | |
| PRKCQ | 53.81 (2.24 to 1295.19) | 0.014 | 0.94 (0.82 to 0.99) | 100.00 | 84.21 | TG, nonHDL-C, age, HDL-C | |
| SLPI | 0.18 (0.03 to 0.97) | 0.046 | 0.86 (0.71 to 0.95) | 94.74 | 63.16 | TG, nonHDL-C, age | |
| S100A12 | 0.03 (0.00 to 0.79) | 0.036 | 0.83 (0.67 to 0.93) | 73.68 | 89.47 | TG, nonHDL-C | |
| S100A8 | 0.03 (0.00 to 0.82) | 0.038 | 0.83 (0.67 to 0.93) | 89.47 | 73.68 | TG, HDL-C | |
| CAD (HDL-C elevated, n = 19) vs. CAD (HDL-C low, n = 34) | |||||||
| ABCG1 | 2.05 (1.01 to 4.15) | 0.048 | 0.81 (0.68 to 0.90) | 73.68 | 88.24 | nonHDL-C*, age | |
| ALB | 3.40 (1.39 to 8.33) | 0.007 | 0.84 (0.71 to 0.92) | 78.95 | 85.29 | nonHDL-C*, age | |
| BMP1 | 0.27 (0.09 to 0.77) | 0.015 | 0.93 (0.83 to 0.98) | 84.21 | 97.06 | TG*, nonHDL-C*, age | |
| CD14 | 0.36 (0.15 to 0.89) | 0.026 | 0.78 (0.65 to 0.88) | 84.21 | 73.53 | nonHDL-C*, age | |
| CD36 | 0.00 (0.00 to 0.28) | 0.014 | 0.98 (0.89 to 1.00) | 100.00 | 97.06 | TG, nonHDL-C, age | |
| CUBN | 3.18 (1.28 to 7.91) | 0.013 | 0.89 (0.78 to 0.96) | 68.42 | 100.00 | TG*, age | |
| CYBA | 0.33 (0.13 to 0.82) | 0.017 | 0.87 (0.75 to 0.95) | 78.95 | 94.12 | TG*, age | |
| HDLBP | 4.29 (1.24 to 14.77) | 0.021 | 0.92 (0.81 to 0.97) | 89.47 | 94.12 | TG*, nonHDL-C*, age | |
| HMGCR | 0.30 (0.11 to 0.82) | 0.019 | 0.93 (0.83 to 0.98) | 89.47 | 91.18 | TG*, nonHDL-C*, age | |
| IL18RAP | 2.27 (1.13 to 4.40) | 0.021 | 0.89 (0.77 to 0.96) | 78.95 | 100.00 | TG* | |
| LCAT | 0.13 (0.02 to 0.70) | 0.018 | 0.95 (0.86 to 0.99) | 89.47 | 94.12 | TG*, nonHDL-C*, age | |
| NPC2 | 0.21 (0.05 to 0.79) | 0.021 | 0.89 (0.77 to 0.96) | 89.47 | 82.35 | TG*, age | |
| MGST1 | 0.17 (0.03 to 0.90) | 0.038 | 0.89 (0.77 to 0.96) | 84.21 | 85.29 | TG*, age | |
| OLR1 | 0.21 (0.05 to 0.95) | 0.043 | 0.73 (0.59 to 0.85) | 78.95 | 64.71 | age | |
| PRKACA | 0.41 (0.18 to 0.53) | 0.042 | 0.87 (0.75 to 0.95) | 84.21 | 91.18 | TG*, age | |
| PRKACB | 0.40 (0.16 to 0.40) | 0.038 | 0.92 (0.82 to 0.98) | 89.47 | 91.18 | TG*, nonHDL-C*, age | |
| PRKACG | 2.74 (1.20 to 6.24) | 0.017 | 0.78 (0.64 to 0.88) | 89.47 | 64.71 | age | |
| PRKCQ | 2.94 (1.21 to 7.15) | 0.018 | 0.88 (0.77 to 0.96) | 78.95 | 88.24 | TG*, age | |
| SREBF1 | 2.35 (1.09 to 1.13) | 0.038 | 0.80 (0.67 to 0.90) | 84.21 | 70.59 | nonHDL-C*, age | |
| S100A12 | 0.13 (0.03 to 0.65) | 0.013 | 0.92 (0.81 to 0.98) | 94.74 | 91.18 | TG*, age | |
| S100A8 | 0.23 (0.06 to 0.86) | 0.028 | 0.91 (0.80 to 0.97) | 94.74 | 88.24 | TG*, age | |
| S100A9 | 0.39 (0.16 to 0.95) | 0.039 | 0.90 (0.79 to 0.97) | 94.74 | 88.24 | TG*, age | |
| SLPI | 0.04 (0.00 to 0.59) | 0.019 | 0.84 (0.71 to 0.92) | 78.95 | 82.35 | nonHDL-C*, age | |
| SOAT1 | 0.18 (0.05 to 0.69) | 0.012 | 0.95 (0.85 to 0.99) | 94.74 | 85.29 | TG*, nonHDL-C*, age | |
| TLR5 | 0.35 (0.14 to 0.89) | 0.027 | 0.87 (0.75 to 0.95) | 94.74 | 76.47 | TG*, age | |
| TLR8 | 0.39 (0.17 to 0.90) | 0.028 | 0.69 (0.55 to 0.81) | 94.74 | 41.18 | age | |
| VEGFA | 0.31 (0.13 to 0.74) | 0.009 | 0.83 (0.70 to 0.92) | 73.68 | 85.29 | nonHDL-C*, age | |
Data are given for CAD vs. control for groups with low, normal and high HDL-C and for CAD patients for groups with elevated HDL-C vs. low HDL-C. The numbers of patients are given in parentheses. Data were adjusted for age, HDL-C, nonHDL-C and TG in different models and significant covariates are marked by asterisk (*). AUC, area under curve; OR, odds ratios; ROC, receiver operating characteristic.
| Gene signature | OR (95% CI) | p | AUC (95% CI) | Sensitivity | Specificity | Model | |
| CAD vs. control (HDL-C low, 34/19) | |||||||
| SREBF1 + ABCG1 | 0.20 (0.05 to 0.80) | 0.023 | 0.94 (0.84 to 0.99) | 94.12 | 84.21 | HDL-C, non-HDL, TG, age* | |
| CAD vs. control (HDL-C normal, 23/21) | |||||||
| ITGAM + ALB | 0.02 (0.00 to 0.39) | 0.010 | 0.91 (0.79 to 0.98) | 91.30 | 90.48 | HDL-C, non-HDL, TG, age | |
| CAD vs. control (HDL-C high, 19/19) | |||||||
| APOA1 + HMGCR | 0.03 (0.00 to 0.33) | 0.005 | 0.95 (0.83 to 0.99) | 94.74 | 94.74 | HDL-C, non-HDL, TG, age | |
| CAD (HDL-C high vs. CAD (HDL-C low), 19/34 | |||||||
| HMGCR + LCAT | 0.07 (0.01 to 0.44) | 0.005 | 0.96 (0.87 to 1.00) | 89.47 | 97.06 | non-HDL*, TG*, age | |
The raw expression values for two genes considered as specific gene signatures for groups with different HDL-C levels were initially transformed into average Z scores and then used in logistic regression analysis together with individual Z scores for covariates. Data are given for CAD vs. control for groups with low, normal, and high HDL-C and for CAD patients for groups with high HDL-C vs. low HDL-C. The numbers of patients are included. Data adjusted for age, HDL-C, nonHDL-C, and TG were compared in different models for each group, and the best models with maximal AUC values are included. (*), significant covariate. AUC, area under curve.
For the binary classification of patient groups with low HDL-C (Table 2), the
four genes with OR
For the binary classification of patient groups with normal HDL-C, the five
genes with OR
For the binary classification of patient groups with high HDL-C, the six genes
with OR
For the binary classification of CAD patients with high HDL-C versus CAD
patients with low HDL-C (Table 2), the odds for a positive outcome in cases with
high HDL-C are higher than in cases with low HDL-C for the eight genes with OR
The expression of 65 genes involved in HDL metabolism, inflammation, and
immunity reactions was compared between CAD patients (case) and patients without
coronary stenosis (control), each divided into three groups with low, normal, and
elevated HDL-C levels. The common feature was the increased OR values for LXR
gene expression in three patient groups, thus evidencing the increased oxysterol
level in CAD patients. In particular, the positive associations of the adjusted
OR values for NR1H3 expression imply that, one standard deviation
higher, these values were associated with 6.8-, 4.2-, and 3.9-fold higher CAD
cases in low, normal, and high HDL-C groups, respectively. However, the
expression of LXR-target genes ABCA1 and ABCG1 and
SCARB1 as major cholesterol transporters [8] in the CAD group with low
HDL-C was significantly decreased with OR
Expression profiles and OR values were much more uniform in the CAD group with a normal HDL-C level. The increased OR value for LDLR gene expression in CAD observed in the present study diverges from the coordinate activation of cholesterol excretion through the LXR-controlled pathway and the depression of cholesterol uptake by the LDL receptor through the SREBF-controlled pathway [5]. However, the direct involvement of the hepatic LDL receptor in reverse cholesterol transport from macrophages to the liver has been identified [35].
For CAD patients with elevated HDL-C, the upregulation of CUBN and
HDLBP genes (OR
The possible atheroprotective effect of HDL particles in CAD may be analyzed by the adjusted OR values for CAD patients with high HDL-C versus CAD patients with low HDL-C. Based on the decrease in HMGCR and SOAT1 expression, the decreased synthesis of both cholesterol and cholesteryl ester may be suggested due to the accumulation of intracellular cholesterol in CAD patients with high HDL-C. The suggested intracellular cholesterol accumulation coincides with the increased expression of SREBF1 with the increase of HDL-C. Cholesterol efflux becomes more efficient due to the increase of ABCG1 and ALB expression as cholesterol transporters [8].
What could be a driving force for cholesterol accumulation in PBMC in CAD patients with high HDL-C? We speculate on the complex interplay between HDLBP, CUBN, and BMP gene expression. The specific Reactome pathway (R-HSA-8964043~Plasma lipoprotein clearance) indicates a HDLBP pivotal role in HDL clearance at high HDL-C levels. HDL levels in plasma from CAD patients may also be controlled by the increased and decreased OR values for CUBN and BMP1 expression, respectively. However, the decreased OR for BMP1 may be associated with the loss of the maturation of proapoA-I and increased clearance of uncleaved apoprotein [41]. The decrease of LCAT expression with the increase of HDL-C in CAD patients may be associated with the accompanying increase of HDL atheroprotective effect due to the higher efficiency of smaller HDL particles that accumulate at lower LCAT expression as promoters of macrophage cholesterol efflux by the ABCA1 and ABCG1 transporters [42]. Of note, decreased LCAT gene expression also served as a candidate gene signature in the comparison of the expression of hub genes in CAD patients with high HDL-C versus low HDL-C.
The increased expression of CXCL5 as a pro-inflammatory cytokine that
accumulates at efferocytosis [43] and decreased expression of SREBF1 in
CAD patients with low HDL-C levels may evidence the limited inflammation in CAD
due to the linkage of SREBF1 expression to the innate immune response
[44]. The decreased innate immune response with lower SREBF1 expression
in CAD patients with low HDL-C may be further suggested. Besides the increased
CXCL5, the pro-inflammatory effect may also be attributed to
the decreased OR for ITGAM (integrin subunit alpha M or CD11b)
expression. This down-regulation may suggest the decreased formation of a
heterocomplex between alpha M and beta integrin 2 chains. This complex is
important in the adherence of neutrophils and monocytes to stimulated
endothelium. Macrophage ITGAM was significantly correlated with tissue immune
infiltration within atherosclerotic tissues [45]. Also, macrophages deficient in
CD11b were characterized by enhanced activation of nuclear factor-
In CAD patients with normal HDL-C, the increased expression of CXCL5 also existed, thus evidencing the pro-inflammatory event. Again, the pro-inflammatory effect may also be attributed to the decreased OR for ITGAM expression. However, the expression of both IL1R1 and IL18R1 receptors, contrary to CAD patients with low HDL-C, did not differ between CAD patients and controls with normal HDL-C, suggesting normalization of the corresponding signaling pathways in CAD patients with normal HDL-C. In contrast to this observation, CD14 expression decreased in two groups of CAD patients with low and normal HDL-C. The cell surface antigen CD14 is primarily understood to act as a co-receptor for Toll-like receptors to activate innate immunity responses to pathogens and tissue injury in macrophages and monocytes [51], thus suggesting limited inflammation in CAD patients with low and normal HDL-C groups relative to controls.
In CAD patients with elevated HDL-C, the expression of some new genes became
significant. Expression of ITGB3 (integrin beta chain beta 3) was
upregulated, evidencing increased cell adhesion as well as cell-surface-mediated
signaling. Integrin beta 3 is found along with the alpha IIb chain in platelets.
Circulating monocyte-platelet aggregates are a robust marker of platelet activity
and monocyte inflammation and are significantly elevated in subjects with CVD
[52]. Of note, the expression of ITGAM as a component of the other
integrin heterocomplex between alpha M and beta 2 integrin did not change in CAD
patients versus controls, contrasting with two other groups. The pRKCQ
(protein kinase C theta) gene was also up-regulated in CAD patients with elevated
HDL-C. This kinase is important for T-cell activation. It is required for the
activation of the transcription factors NF-
The comparison of gene expression profiles for CAD patients with elevated and low HDL-C revealed the increased expression of SREBF1 with a decrease in the expression of several genes connected to inflammation and angiogenesis (CD14, CD36, S100A8, S100A9, S100A12, TLR5, TLR8, and VEGFA). Of note, the profound decrease in CD36 gene expression with an OR of 0.00 (95% CI 0.00 to 0.28) may suggest the contribution of CD36 gene expression to the inflammation state of CAD patients with an increase in HDL-C. However, the expression of pro-inflammatory PRKCQ with an OR of 2.94 (95% CI 1.21 to 7.15) was significantly increased with an increase in HDL-C. Moreover, the diminished expression of the CUBN and PRKCQ genes in control patients with an increase in HDL-C level, contrasting with the increased expression of these genes in CAD patients, may attenuate the HDL-associated atheroprotective effect in CAD. Both the upregulation of the expression of genes involved in lipid efflux (ABCG1, ALB) and the downregulation of HMGCR and SOAT1 expression suggest the accumulation of free cholesterol and the decreased synthesis of cholesterol and cholesteryl ester.
The novelties of our study are, first, the use of a content-dependent transcriptome-like approach to suggest gene signatures, specific to HDL-C levels, for accurate prognosis and treatment in CAD, which seems to correct the known heterogeneity in the transcriptome approach [57]. Second, the impairment of reverse cholesterol transport and limited inflammation seem to be the major features of HDL metabolism and innate immune response in CAD patients with hypoalphalipoproteinemia. Third, both pro- and anti-inflammatory effects seem to exist in CAD patients with elevated HDL-C. Finally, the intracellular accumulation of cholesteryl ester and free cholesterol is suggested in CAD patients with low and high HDL-C groups, respectively.
The usage of only expression data, without any protein and/or activity measurements, for a limited number of genes is a major limitation of the study. However, it may be balanced by the potential wide use of real-time PCR analysis in clinical laboratories for a large number of patients with CAD to apply targeted therapy to correct underlying disturbances. Also, the ongoing measurements of cholesterol efflux capacity with cholesterol-loaded cell culture and HDL preparations as cholesterol acceptors will associate in future HDL-specific gene expression profiles with efflux efficiencies.
The expression profiles of selected genes involved in HDL metabolism and
atherogenesis in monocytes were HDL-C-sensitive and seemed to be mostly balanced
in CAD patients with normal HDL-C compared to controls. HDL metabolism is
functionally deficient due to the downregulation of the expression of cholesterol
transporters at low HDL-C. However, the increase in HDL-C was associated with the
increase in apolipoprotein E (APOE) expression. The lower OR values for the expression of genes
involved in angiogenesis and inflammation, mainly via NF-
The datasets used and/or analyzed during the current study are available from the corresponding author on reasonable request.
Conceptualization: ADD, LVD and SAL; Writing – Draft Preparation: ADD, LVD and EVN; Investigation: EVN, AVR, VBB, MAV; Data analysis and interpretation: ADD, LVD and SAL; Figure and Tables: AVR and VBB; Writing – Review & Editing: ADD, EVN, LVD and SAL; Patients: MAP; Supervision: ADD and LVD ; Curation and Project Administration: LVD and SAL. All authors contributed to editorial changes in the manuscript. All authors have read and agreed to the published version of the manuscript. All authors have participated sufficiently in the work and agreed to be accountable for all aspects of the work.
The study was approved by the Ethics Committee of the M. F. Vladimirsky Moscow Regional Research and Clinical Institute (MONIKI), Russia (Protocol No. 12479/2019, February 17, 2019) and carried out in accordance with the WMA Declaration of Helsinki (2004). Written informed consent was obtained from each patient or their families/legal guardians included in the study.
Not applicable.
This research received no external funding.
The authors declare no conflict of interest.
Supplementary material associated with this article can be found, in the online version, at https://doi.org/10.31083/j.fbl2911396.
References
Publisher’s Note: IMR Press stays neutral with regard to jurisdictional claims in published maps and institutional affiliations.