


1 Science & Technology Park, Xizang Key Laboratory of Veterinary Drug, Xizang Vocational Technical College, 850030 Lasa, Xizang, China
2 Institute of Vegetables, Institute of Food Science and Technology, Institute of Agricultural Product Quality Standard and Testing Research, Tibet Academy of Agricultural and Animal Husbandry Sciences, 850000 Lasa, Xizang, China
3 College of Resources and Environment, Innovative Institute of Animal Healthy Breeding, Zhongkai University of Agriculture and Engineering, 510225 Guangzhou, Guangdong, China
4 School of Life Sciences, Sun Yat-sen University, 510006 Guangzhou, Guangdong, China
Abstract
Zophobas atratus larval meal (ZLM) is a high-quality feed supplement with potential activities that can improve fish growth performance and promote meat quality. However, there have been limited recent studies investigating the metabolic effects of ZLM. Therefore, this study aims to uncover the metabolomic mechanism through which ZLM improves tilapia meat flavor using metabolomic strategies.
In this study, soybean meal in the basal diets was replaced with 15%, 30%, or 60% ZLM, where anti-nutrient factors were destroyed by high temperature treatment. After being fed these ZLM supplements for 30 days, dorsal muscles were collected from tilapia for meat sensory evaluation tests. Liver samples were also collected for metabolomic analysis using the gas chromatography-mass spectrometry (GC-MS) platform and combined with biochemical assays to verify metabolism-related enzyme activities and reveal crucial metabolic pathways and critical biomarkers associated with ZLM’s ability to improve meat flavor.
In tilapia livers, ZLM enhanced the activity of enzymes involved in energy metabolism including succinate dehydrogenase (SDH), pyruvate dehydrogenase (PDH), α-ketoglutarate dehydrogenase (α-KGDH), NADP-malate dehydrogenase (NAD-MDH) and mitochondrial isocitrate dehydrogenase (ICDHm). This resulted in increased levels of reduced nicotinamide adenine dinucleotide (NADH), acetyl CoA and ATP which led to accumulation of flavor fatty acids such as arachidonic acid, linoleic acid (9,12-Octadecadienoic acid), linolenic acid (9,12,15-Octadecatrienoic acid) and oleic acid (9-Octadecenoic acid). Additionally, there was an increase in flavor nucleotides like guanosine adenosine-5′-monophosphate and uridine-5′-monophosphate while off-flavor metabolites like inosine and hypoxanthine decreased. Furthermore, beneficial metabolomic responses led to a decrease in off-flavor metabolites such as 2-methylisoborneol trimethylamine and geosmin while increasing umami metabolites like 2-methyl-3-furanthiol and nonanal.
This metabolomic study demonstrates that inclusion of ZLM diets enhances the flavor profile of tilapia dorsal muscle. The accumulation of flavor compounds, coupled with a reduction in earthy taste and off-flavor metabolites, contributes to an improved meat flavor and freshness. Additionally, there is an increase in the levels of flavor-related amino acids and nucleotides. These previously unidentified metabolic effects highlight the potential significance of ZLM as a dietary supplement for enhancing the biosynthesis of flavor metabolites in tilapia.
Keywords
- Zophobas atratus larval meal (ZLM)
- Oreochromis niloticus
- metabolome
- meat flavor
- metabolomic effect
Recently, due to the escalating prices of fish meal and other raw diet materials in global markets [1], coupled with the gradual depletion of marine fishery resources [2], the cost of tilapia feed has also been steadily increasing [1, 3]. Aquaculture poses a threat to natural resources by depleting sea stocks for fish meal supply [4]. The utilization of alternative protein sources in aquafeeds can offer a viable solution, particularly those derived from agricultural waste in underdeveloped regions, thereby mitigating feed production expenses. According to the report of Food and Agriculture Organization of the United Nations, tilapia farming is predominantly concentrated in underdeveloped areas (https://www.fao.org/in-action/globefish/news-events/news/news-detail/Increasing-domestic-demand-in-major-producers/en). Moreover, the persistent surge in fish meal prices has had detrimental consequences on tilapia farming within these regions, further exacerbating economic challenges faced by local farmers (https://www.fao.org/in-action/globefish/news-events/news/news-detail/Production-faces-challenges-positive-trade-outlook/en). Typically characterized by agricultural production dominance, these areas also generate substantial amounts of waste [5]. Traditionally, this waste is directly utilized as pig feed [6]. However, it cannot be directly employed for feeding tilapia. In response to this crisis situation, studies have investigated and demonstrated that insect larvae meal can partially or completely substitute fish meal in their diet composition [1, 7].
There is a precedent for utilizing agricultural and food waste to cultivate insects, harvesting their larvae, and converting them into dry meal suitable for animal feed or human consumption [1, 7, 8]. Zophobas atratus Fab., commonly known as superworms, belonging to the order Coleoptera, family Pyrethidae, and genus Pyramid (mealy beetles), have been extensively used as both human food and animal feed with proven success [9]. The cultivation of Z. atratus is relatively straightforward due to its rapid growth rate and wide adaptability range surpassing even that of the renowned Tenebrio molitor L. [10]. Notably, Z. atratus larvae can be maintained for extended periods without pupation until subjected to dark treatment [11]. Additionally, these larvae can be reared using various sources such as bran, straw, substandard vegetables and fruits, kitchen waste etc., enabling efficient processing of larger quantities of waste compared to rapidly pupating insects like T. molitor or black soldier fly. Furthermore, Z. atratus larvae are rich in protein content along with amino acids, fatty acids and trace elements [1, 7, 8, 12], making them an ideal bait for breeding fish, frogs, turtles etc. Consequently, studies have been conducted aiming at substituting fish meal with Zophobas atratus larval meal (ZLM) yielding promising results so far [1, 7, 8, 12, 13].
Currently, significant progress has been made in the research on ZLM feed [1, 7, 8, 12, 13]. However, there is a lack of studies investigating the metabolomic effects of ZLM on tilapia dorsal muscle flavor. Therefore, after being fed with soybean meal replacements of 15%, 30%, and 60% ZLM for a period of 30 days, tilapias were cultured and samples from their dorsal muscles and livers were collected for sensory testing as well as metabolomic and biochemistry analysis. A functional metabolomic approach was employed to identify critical metabolic pathways and crucial biomarkers previously reported [14, 15, 16, 17]. These identified pathways and biomarkers could be utilized to assess the supplemental effects of ZLM in order to gain deeper insights into the underlying metabolomic mechanisms associated with tilapia fed by ZLM. The flavor compounds in tilapia meat primarily consist of flavor amino acids, nucleotides, and fatty acids [18]. These compounds have an impact on meat flavor; for instance, meaty flavor metabolites such as 2-methyl-3-furanthiol [19] and nonanal [20], as well as earthy fishy taste or off-flavor metabolites like triethylamine [21], geosmin, and 2-methylisoborneol [22]. Flavor plays a crucial role in consumer decision-making when purchasing meat products; therefore understanding the flavor effects resulting from ZLM supplementation in tilapia diets is highly relevant to consumers. Consequently, this study aims to investigate the metabolomic mechanism underlying the effects of ZLM on tilapia muscle flavor.
Until recently, we have employed this functional metabolomic approach to screen critical metabolic pathways and crucial biomarkers in the metabolomic research of ZLM supplemental diets. Subsequent estimation of the flavor metabolome was conducted after incorporating ZLM to replace 15%, 30%, and 60% of soybean meal in the basal diets. By combining enzymatic detection, we evaluated the effects of ZLM supplementation through responses of these flavor metabolites, thereby revealing an enhancement in muscle flavor of tilapia.
The NADP+/NADPH assay kit with WST-8, BCA protein assay kit,
enhanced ATP assay kit were purchased from Beyotime Institute of Biotechnology
(Beyotime®, catalog: S0116, S0179 and S0027, Shanghai, China).
The 1
Referring to the previous study [17] and nutritional standard (SCT1025-1998, China) for Nile tilapia formula feed, and all ingredients included ZLM were obtained from the Guangzhou feed market. After pulverizing all the ingredients, water was added until the water content reached 20% and thoroughly mixed. The mixtures were then pressed into particles using an automatic extruder (DGP60-C, Xingtai, China) from Yugong Technology Development Company Ltd., serving as a control for the basal diet without ZLM inclusion. Subsequently, these particles were dried at 65 °C until their water content decreased to less than 10%. The premix of minerals and vitamins used in this study were procured from two feed manufacturers: Guangzhou Southern Biotechnology Company Ltd. (Yulong®, Guangzhou, China) and Chelota Biotechnology Group Company Ltd. (Chelota®, Deyang, China). These premixes complied with executive standards of Guangdong feeding (2020) 01131 (Q/NFSW 19-2021) and Sichuan feed premix (2015) 05005 respectively. Following the aforementioned formula and standard guidelines, soybean meal at levels of 15%, 30%, and 60% was replaced by ZLM in experimental groups. Detailed descriptions mentioned previously [17], a dry extrusion method was carried out and then these feeds were granulated at 85 °C with screw rotary extrusion method with non-adjustable pressure settings. Then, these diet components and nutritional ingredients were shown in Supplementary Tables 1, 2.
According to a previous study [17], 60.00 g Nile tilapia fish
with an error range of
Referring to previous studies [14, 15, 16] and the national guideline (RB/T 061-2021), tilapias were euthanized by immersing them in an ice bath (mixture of ice slush and water, 5/1 (w/w), maintained at 4 °C) for a duration of 10 min, followed by an additional 20-min immersion after cessation of all movement to ensure death due to hypoxia. Subsequently, the fish were thoroughly wiped with sterilized gauze after rinsing with distilled water. Six livers were excised for preparation, from which approximately 50 mg samples were cut and immediately immersed in 1 mL methanol at –20 °C. The samples were then sonicated using an ultrasonic processor (JY92-IIDN, SCIENTZ, Ningbo, China) at a power of 10 W for 5 min and subsequently centrifuged at 12,000 rpm for 10 min at a temperature of 4 °C. Next, each sample’s supernatant was supplemented with ribitol (A103030, Aladdin®, concentration: 100 µg/mL; used as a quantitative standard internal reference). The supernatants were concentrated into dry extracts using a rotary vacuum centrifuge device (Eppendorf Concentrator plus, Eppendorf Innovation Company, Hamburg, Germany). For gas chromatography-mass spectrometry (GC-MS) detection employing oximated derivatization approach, the dried extracts were dissolved in 100 µL methoxyamine pyridine solution (M300386 and P111513, Aladdin®, concentration: 20 mg/mL) and incubated in an incubator shaker set at 37 °C and 200 rpm for 120 min. Subsequently, the mixture was silylated with 100 µL N,O-Bis(trimethylsilyl)trifluoroacetamide containing 1% trimethylchlorosilane (B118473, Aladdin®), followed by incubation under the same conditions mentioned earlier but for 30 min. Six biological replicates were performed for each experimental group.
According to previous studies [14, 15, 16], a splitless injection of 1 µL
derivatized extract was performed using an HP-5MS column (30 m
The AMDIS software, version Agilent OpenLAB CDS ChemiStation C.01.01
(Agilent®), was employed for the calibration and deconvolution of
the mass spectra (extracted ion chromatogram, XIC). GC-MS peaks with a
signal-to-noise ratio (S/N) less than 30 were excluded to avoid false positives
[14, 15, 16, 23]. The presence of these questionable artifact peaks was effectively
eliminated when compared to the solvent blank control. Metabolite mass spectra
were identified by retrieving from the GMD 2011 library (Golm Metabolome
Database, Germany) combined with NIST 2011 (National Institute of Standards and
Technology, USA), using the following criteria: reverse match value
Biochemical assays were conducted on six liver samples, followed by
determination of enzyme activity using the protocols provided in the respective
kit manuals. Briefly, 1 g of liver sample was fully rinsed with 1
Using WPS Office for Windows (Beijing Kingsoft Office Software,
Beijing, China), data manipulations and transformations were performed. The
differentiation of metabolites among these groups was assessed using analysis of
variance (ANOVA) with a significance level set at
Based on previous researches [14, 15, 16], metabolomic pathway enrichment analyses
included hypergeometric test (over representation analysis, ORA) and pathway
network topology assay (relative-betweeness centrality). Using an online tool
MetaboAnalyst 6.0 (https://www.metaboanalyst.ca/) with a Kyoto Encyclopedia of Genes and Genomes (KEGG) pathway library
(https://www.genome.jp/kegg/, version Oct 2019), Danio rerio (KEGG
No.7955) was selected as the model organism since it’s currently the only
zebrafish species available as a fish model organism. Default parameters were
used for other analyses before executing enrichment analyses. All significant
metabolites were used to define a reference metabolome which underwent
hypergeometric testing to calculate -log (p) values and impact values
reflecting each metabolic pathway’s influence. Only pathways with p
The values were recorded as means
Six dorsal muscle samples were subjected to sensory evaluation tests. The procedures and objectives of the sensory evaluation tests were explained to all recruited volunteers, who then provided informed consent. Following the approach described by Pu et al. [29], a ranking test was conducted with 20 trained volunteers (equally divided between males and females, aged 18–21 years, non-smokers and non-drinkers, without taste/odor disorders). The volunteers underwent a three-week training period. Taste solutions containing sweetness, sourness, saltiness, umami, bitterness, and fishiness standards were prepared and diluted in doubling dilutions up to 1/16 concentration. Specifically for the fishiness sensory test, participants were trained in sniffing techniques. The fishiness standard solution used was trimethylamine hydrochloride (TMA) at a concentration of 20 g/L (T818827; Shanghai Macklin Biochemical Technology Co., Ltd., Shanghai, China). According to the Chinese standard GB/T16291.1-2012 on sensory analysis methodology (https://www.cnki.net/) as well as previous research [17], these dorsal muscle samples were added into test bottles and randomly assigned to three groups for subsequent sensory analysis at one-hour intervals.
Furthermore, as depicted in Fig. 1, the meat sensory evaluation test was
conducted on tilapia fed with a basal diet supplemented with ZLM at levels of
15%, 30%, and 60%. The control group, consisting of fish fed only the basal
diet, exhibited predominantly sour and bitter taste attributes. Conversely, the
experimental groups receiving supplementation of ZLM at levels of 15%, 30%, and
60% displayed enhanced sweetness and umami characteristics. Notably, as the
level of ZLM supplementation increased, both umami perception and sweetness
intensity were significantly augmented (p
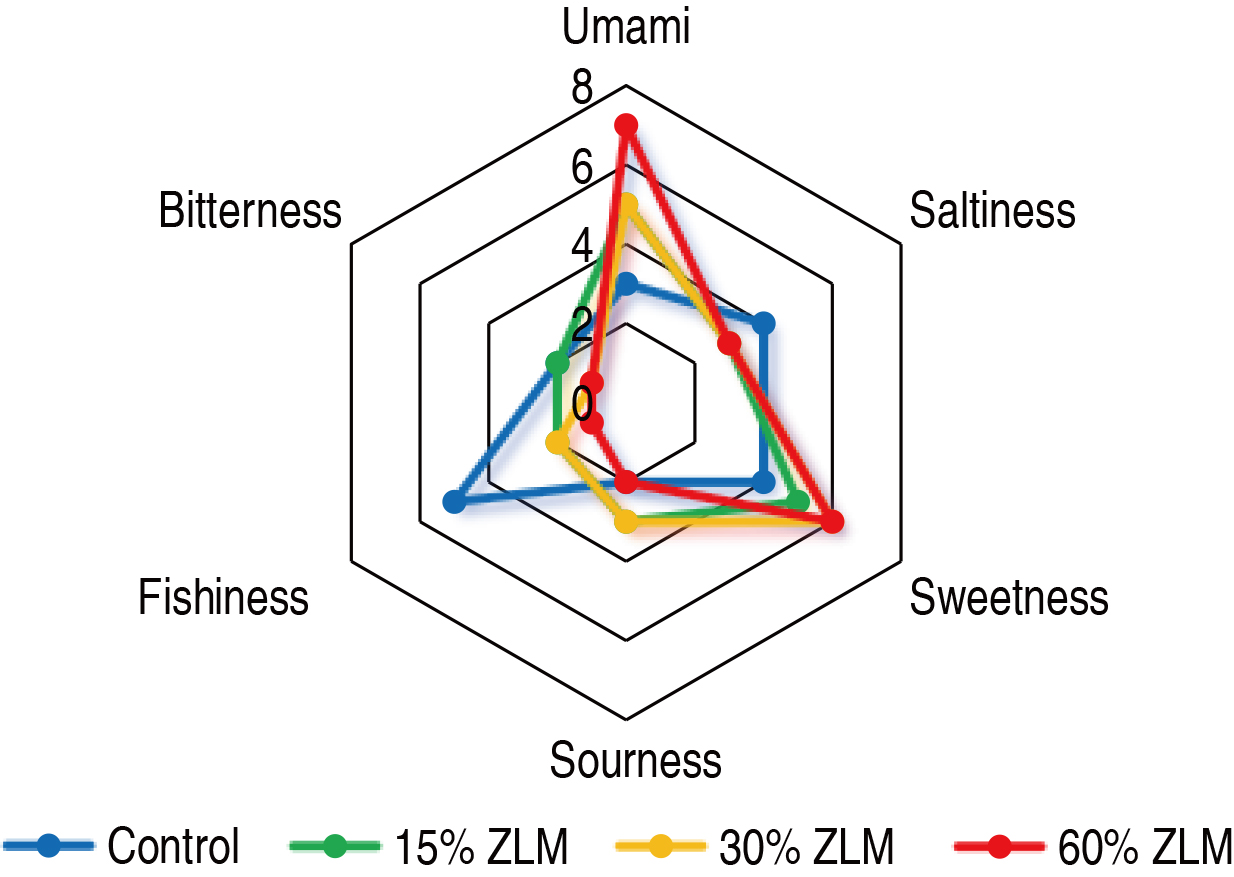 Fig. 1.
Sensory evaluation. The sensory perception of tilapia meat, when fed with 15%, 30%, and 60% Zophobas atratus larval meal (ZLM) feed in comparison to the basal diets, was evaluated.
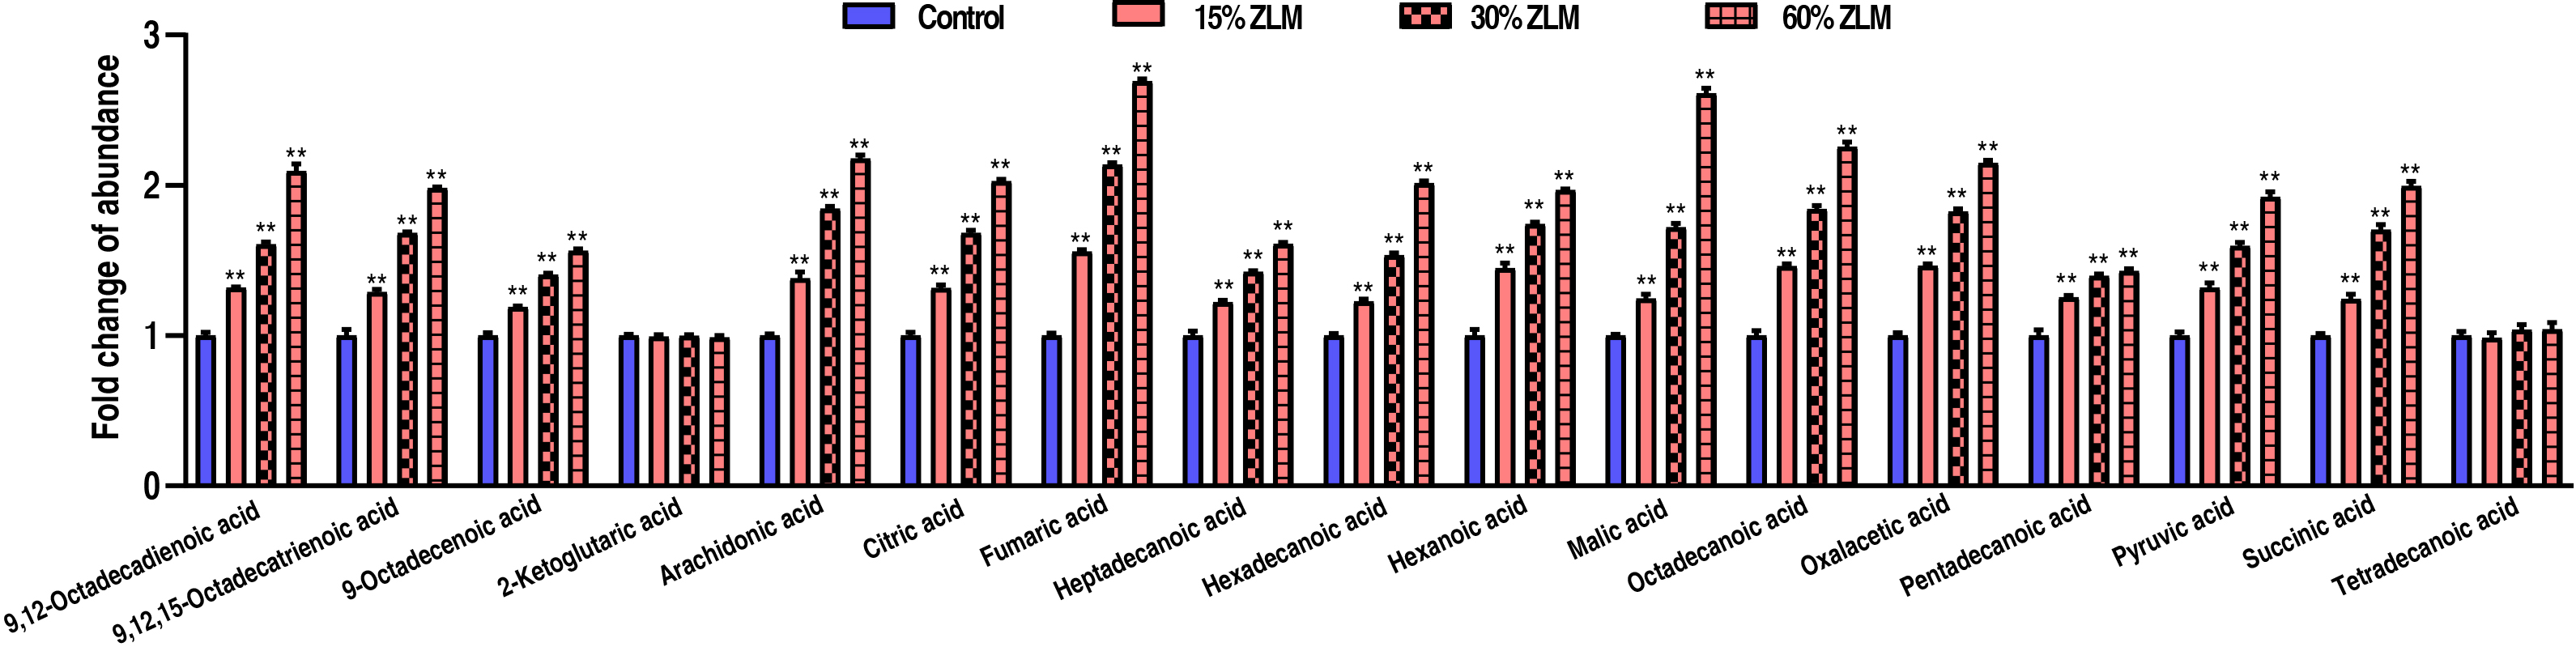
To highlight ZLM flavor effects of sensory evaluation test, then these flavor metabolites in tilapia livers were detected by GC-MS, and their abundances were calculated after fed for 30 days. Compared with basal diets, the fold change of these flavor metabolites’ GC-MS abundance was shown that with increasing ZLM (Fig. 2). In detail, flavor nucleotides guanosine, adenosine-5′-monophosphate, adenosine, inosine-5′-monophosphate, uridine, uridine-5′-monophosphate and xanthine increased, but inosine and hypoxanthine decreased (Fig. 2A). As shown in Fig. 2B, these meaty flavor metabolites of 2-methyl-3-furanthiol and nonanal were also measured with increased abundances following with an increasing ZLM supplement. Here, flavor amino acids of alanine, aspartic acid, glycine, proline, glutamic acid, threonine and serine increased, but these off-flavor amino acids of arginine, histidine, tyrosine and valine decreased (Fig. 2C). Flavor fatty acids and their derivatives of linoleic acid (9,12-Octadecadienoic acid), linolenic acid (9,12,15-Octadecatrienoic acid), oleic acid (9-Octadecenoic acid), 2-ketoglutaric acid, arachidonic acid, citric acid, fumaric acid, heptadecanoic acid, hexadecanoic acid, hexanoic acid, malic acid, octadecanoic acid, oxalacetic acid, pentadecanoic acid, pyruvic acid, succinic acid, tetradecanoic acid were accumulated as shown in Fig. 3. Here, there was no difference in 2-ketoglutaric acid and tetradecanoic acid. In addition, it was notable that, these fishiness metabolites 2-Methylisoborneol, geosmin and trimetlylamine were also determined with decreased abundances after ZLM supplement increased. Thereby, in the biosynthesis of tilapia livers, these positive metabolomic effects of ZLM were to accumulate these flavor metabolites and down-regulate off-flavor metabolites.
 Fig. 2.
The flavor and off-flavor metabolites. Taking into account the
variation range of the abundance of these metabolites and the coordination of the
histogram display, we took their fold change of gas chromatography-mass
spectrometry (GC-MS) abundance compared with basal diets groups. With an increase
in ZLM supplement, flavor nucleotides guanosine, adenosine,
adenosine-5′-monophosphate, xanthine, inosine-5′-monophosphate, uridine,
uridine-5′-monophosphate, inosine and hypoxanthine significantly increased
(A). We also detected meaty flavor metabolites of 2-methyl-3-furanthiol and
nonanal, and their abundance also increased with increased ZLM supplement.
Moreover, fishiness metabolites 2-Methylisoborneol, geosmin and trimetlylamine
were detected and down-regulated in 15%, 30% and 60% ZLM diet groups (B). And
flavor amino acids alanine, aspartic acid, glutamic acid, glycine, proline,
serine, threonine, arginine, histidine, tyrosine, valine (C) also increased. **
p
 Fig. 3.
The flavor fatty acids and their derivatives. Compared with
control groups, with an increase in ZLM supplement, flavor fatty acids and their
derivatives of arachidonic acid, linoleic acid (9,12-Octadecadienoic acid),
linolenic acid (9,12,15-Octadecatrienoic acid), oleic acid (9-Octadecenoic acid),
citric acid, fumaric acid, heptadecanoic acid, hexadecanoic acid, hexanoic acid,
malic acid, octadecanoic acid, oxalacetic acid, pentadecanoic acid, pyruvic acid,
succinic acid were significantly accumulated. Here, there was no difference in
2-ketoglutaric acid and tetradecanoic acid. ** p
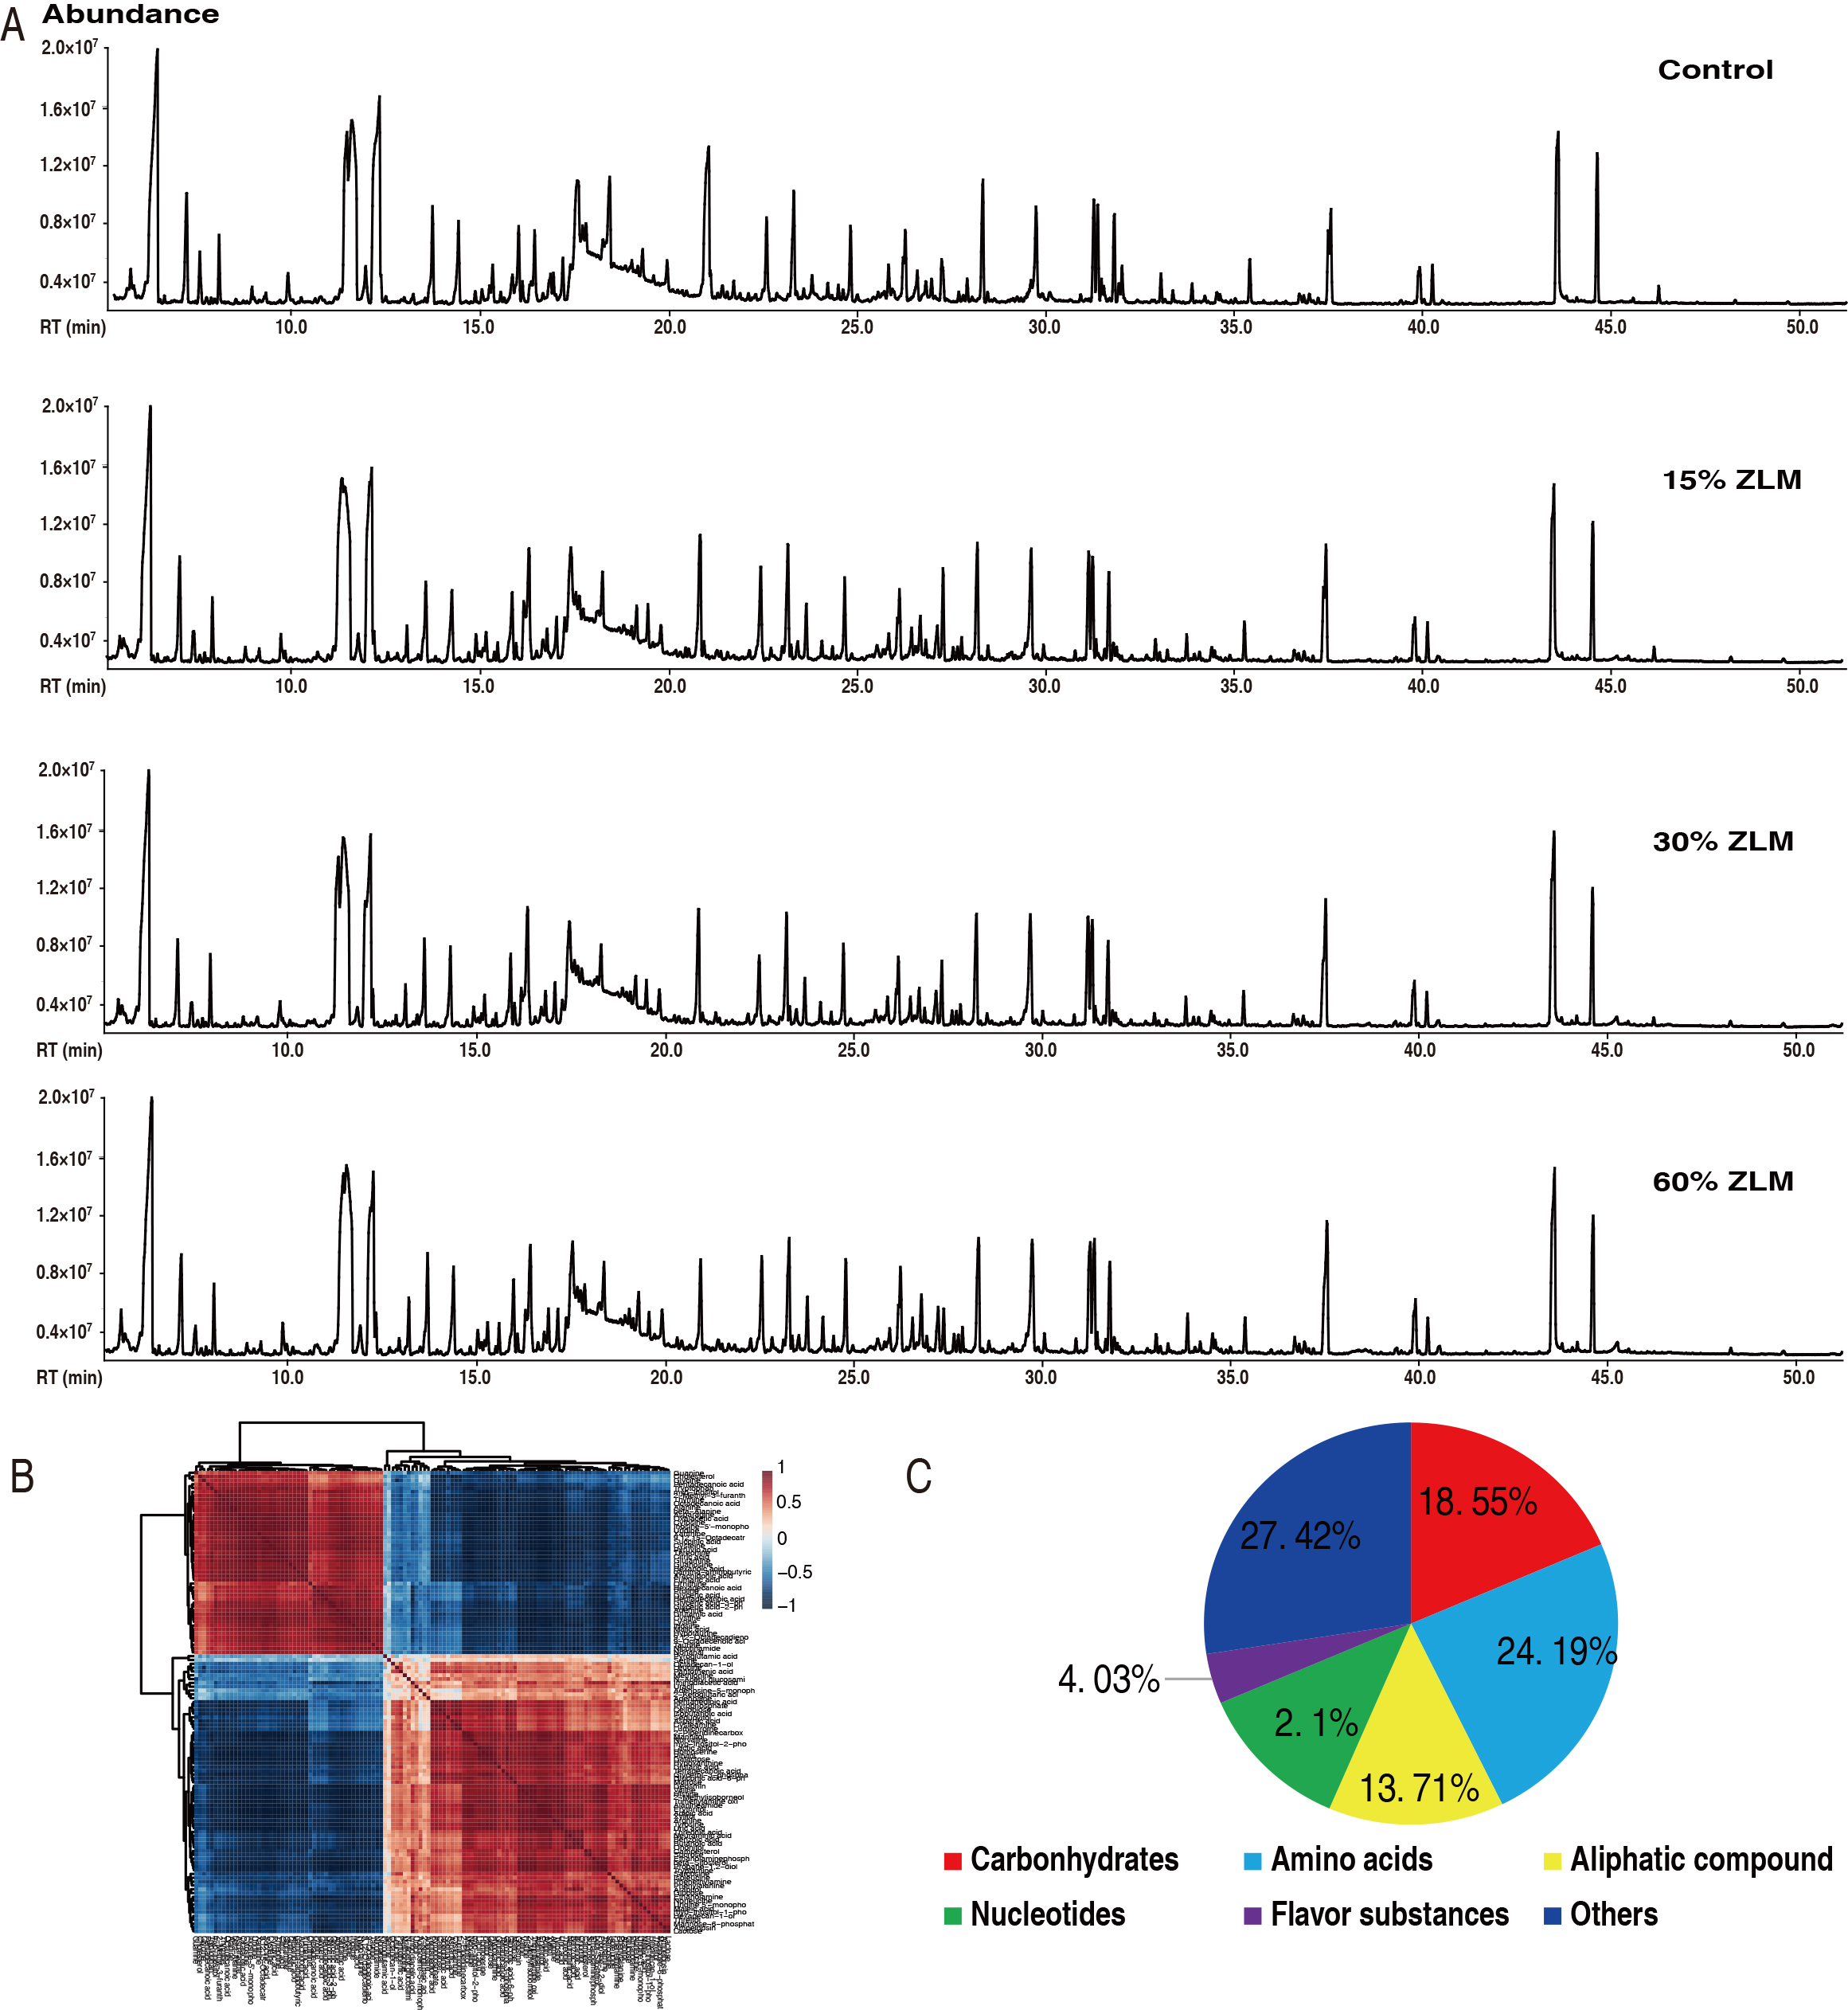
The ZLM metabolic effects on tilapia were investigated as outlined in Fig. 4.
Liver samples were taken from these fish fed by control basal diet and 15%,
30%, and 60% ZLM supplement for 30 days, and prepared for metabolomic
determination based on GC-MS approaches. Here, 48 datastes were obtained from 6
biological individuals with 2 technical replicates in these groups, which
representative total ion chromatograms (TIC) were listed in Fig. 4A. And
there were 301 aligned individual peaks accessed. The correlation coefficient of
their 2 technical replicates indicated the reliability of the GC-MS platform.
Then, their correlation coefficient between these technical replicates fluctuated
at range of 0.9971 to 0.9999, demonstrating the reproducibility and reliability
(Fig. 4B). The annotation of NCBI PubChem (https://pubchem.ncbi.nlm.nih.gov/) and
KEGG (http://www.kegg.jp/) was utilized to identify six categories among these
124 metabolites, including amino acids, carbohydrates, aliphatic compounds,
flavor compounds, nucleotides, and others. After removal of internal standard
ribitol and any known artificial peaks, 124 metabolites were identified. Of
these, 18.55%, 24.19%, 13.71%, 12.10%, 4.03% and 27.42% were categorized
respectively (Fig. 4C). After the removal of the internal standard ribitol and
any known artificial peaks, followed by integration of the same compounds, a
total of 124 metabolites exhibiting reliable signals were detected in each
sample. It was postulated that these experimental groups gave rise to distinct
metabolomes, thereby hypothesizing a correlation between metabolomic variations
and these constructed metabolomes. The metabolic biomarkers were uncovered using
a permutation test coupled with one-way ANOVA to distinguish these groups, and
the differential metabolites in the basal diet and 15%, 30%, and 60% ZLM
supplementary groups were identified. Thus, 69 metabolites with significant
differences were screened (p
 Fig. 4.
The metabolomic profile. (A) Representative total ion chromatography (TIC) from experimental groups. (B) Reproducibility of metabolomic profiling platform used in the discovery phase. Abundance of metabolites quantified in samples over two technical replicates is shown. Pearson correlation coefficient between technical replicates varies between 0.9971 and 0.9999. (C) Categories of the different metabolites. 124 metabolites with different abundance were searched against in Kyoto Encyclopedia of Genes and Genomes (KEGG) for their categories, and the pie chart was generated in WPS Office for Windows (Kingsoft®, Beijing, China).
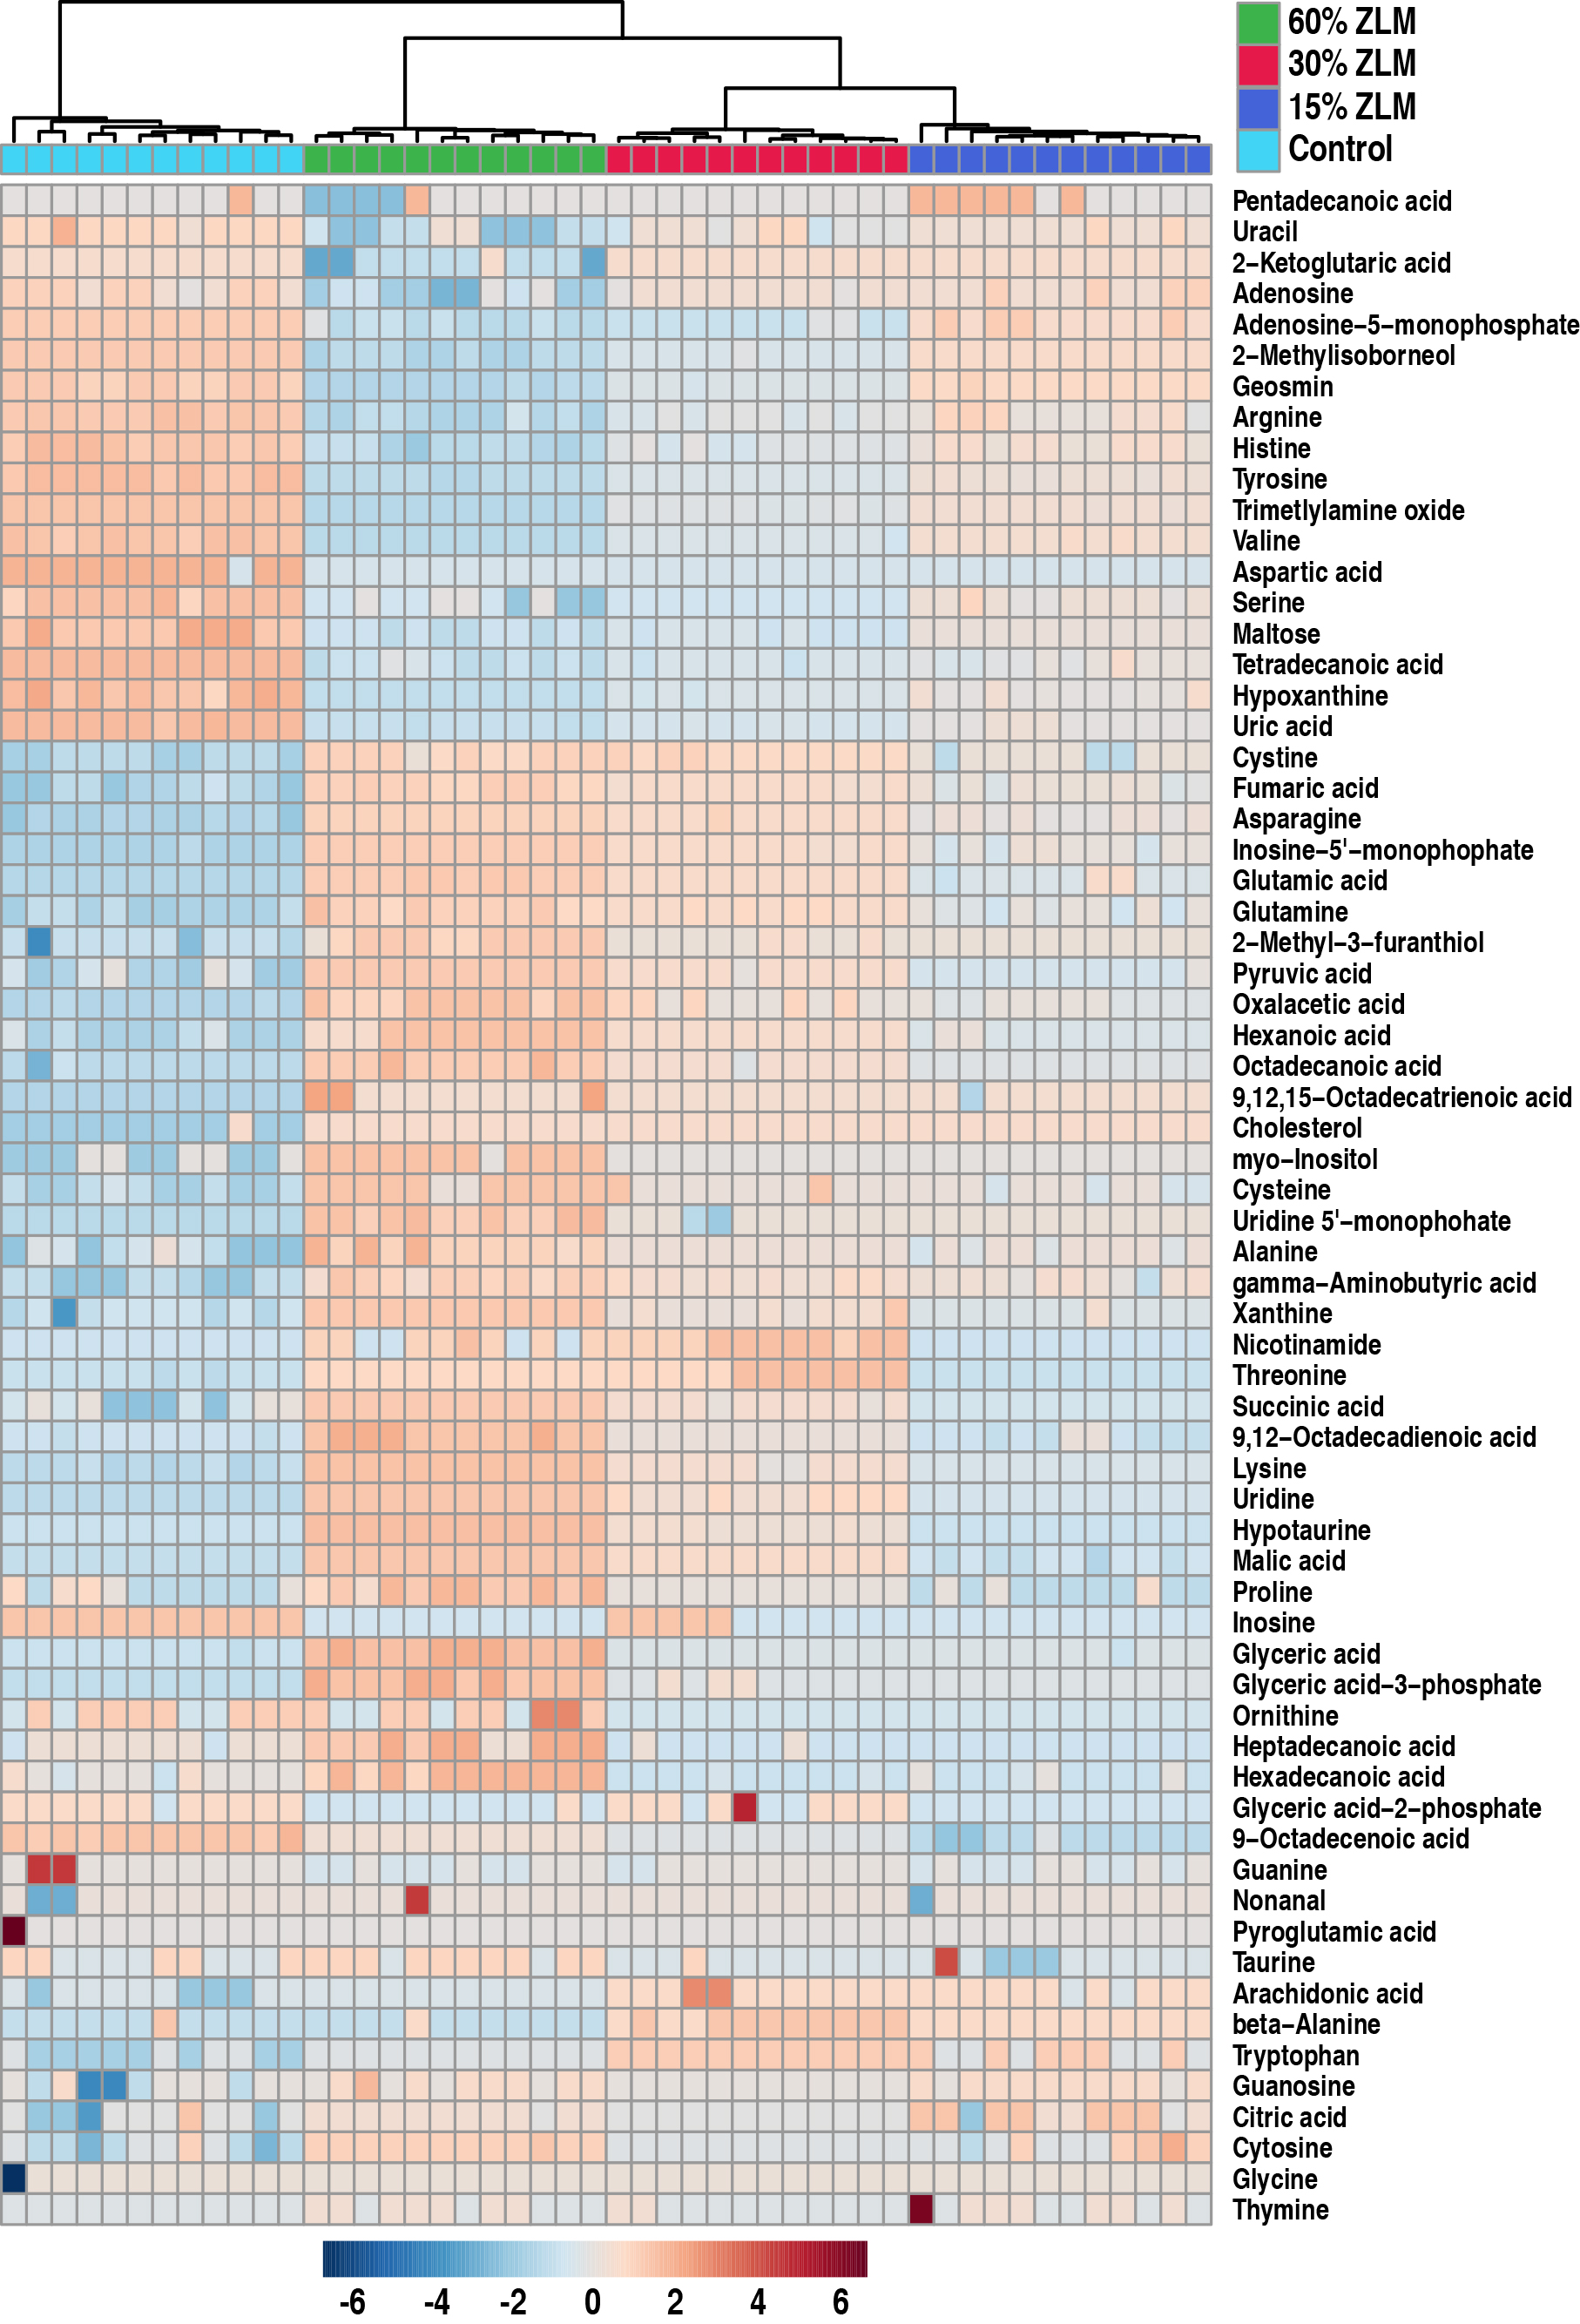
The heatmap in Fig. 5 illustrated the distribution of the 69 significant
metabolites (p
 Fig. 5.
Heat map and hierarchical clustering analysis. A heat map depicting the differential abundance of 69 metabolites was generated. Hierarchical clustering analysis revealed that the clustering tree exhibited four distinct main branches, corresponding to the four experimental groups. The color scale indicated an increase or decrease in metabolite levels relative to the median, with red representing an increase and blue indicating a decrease, respectively (see color scale).
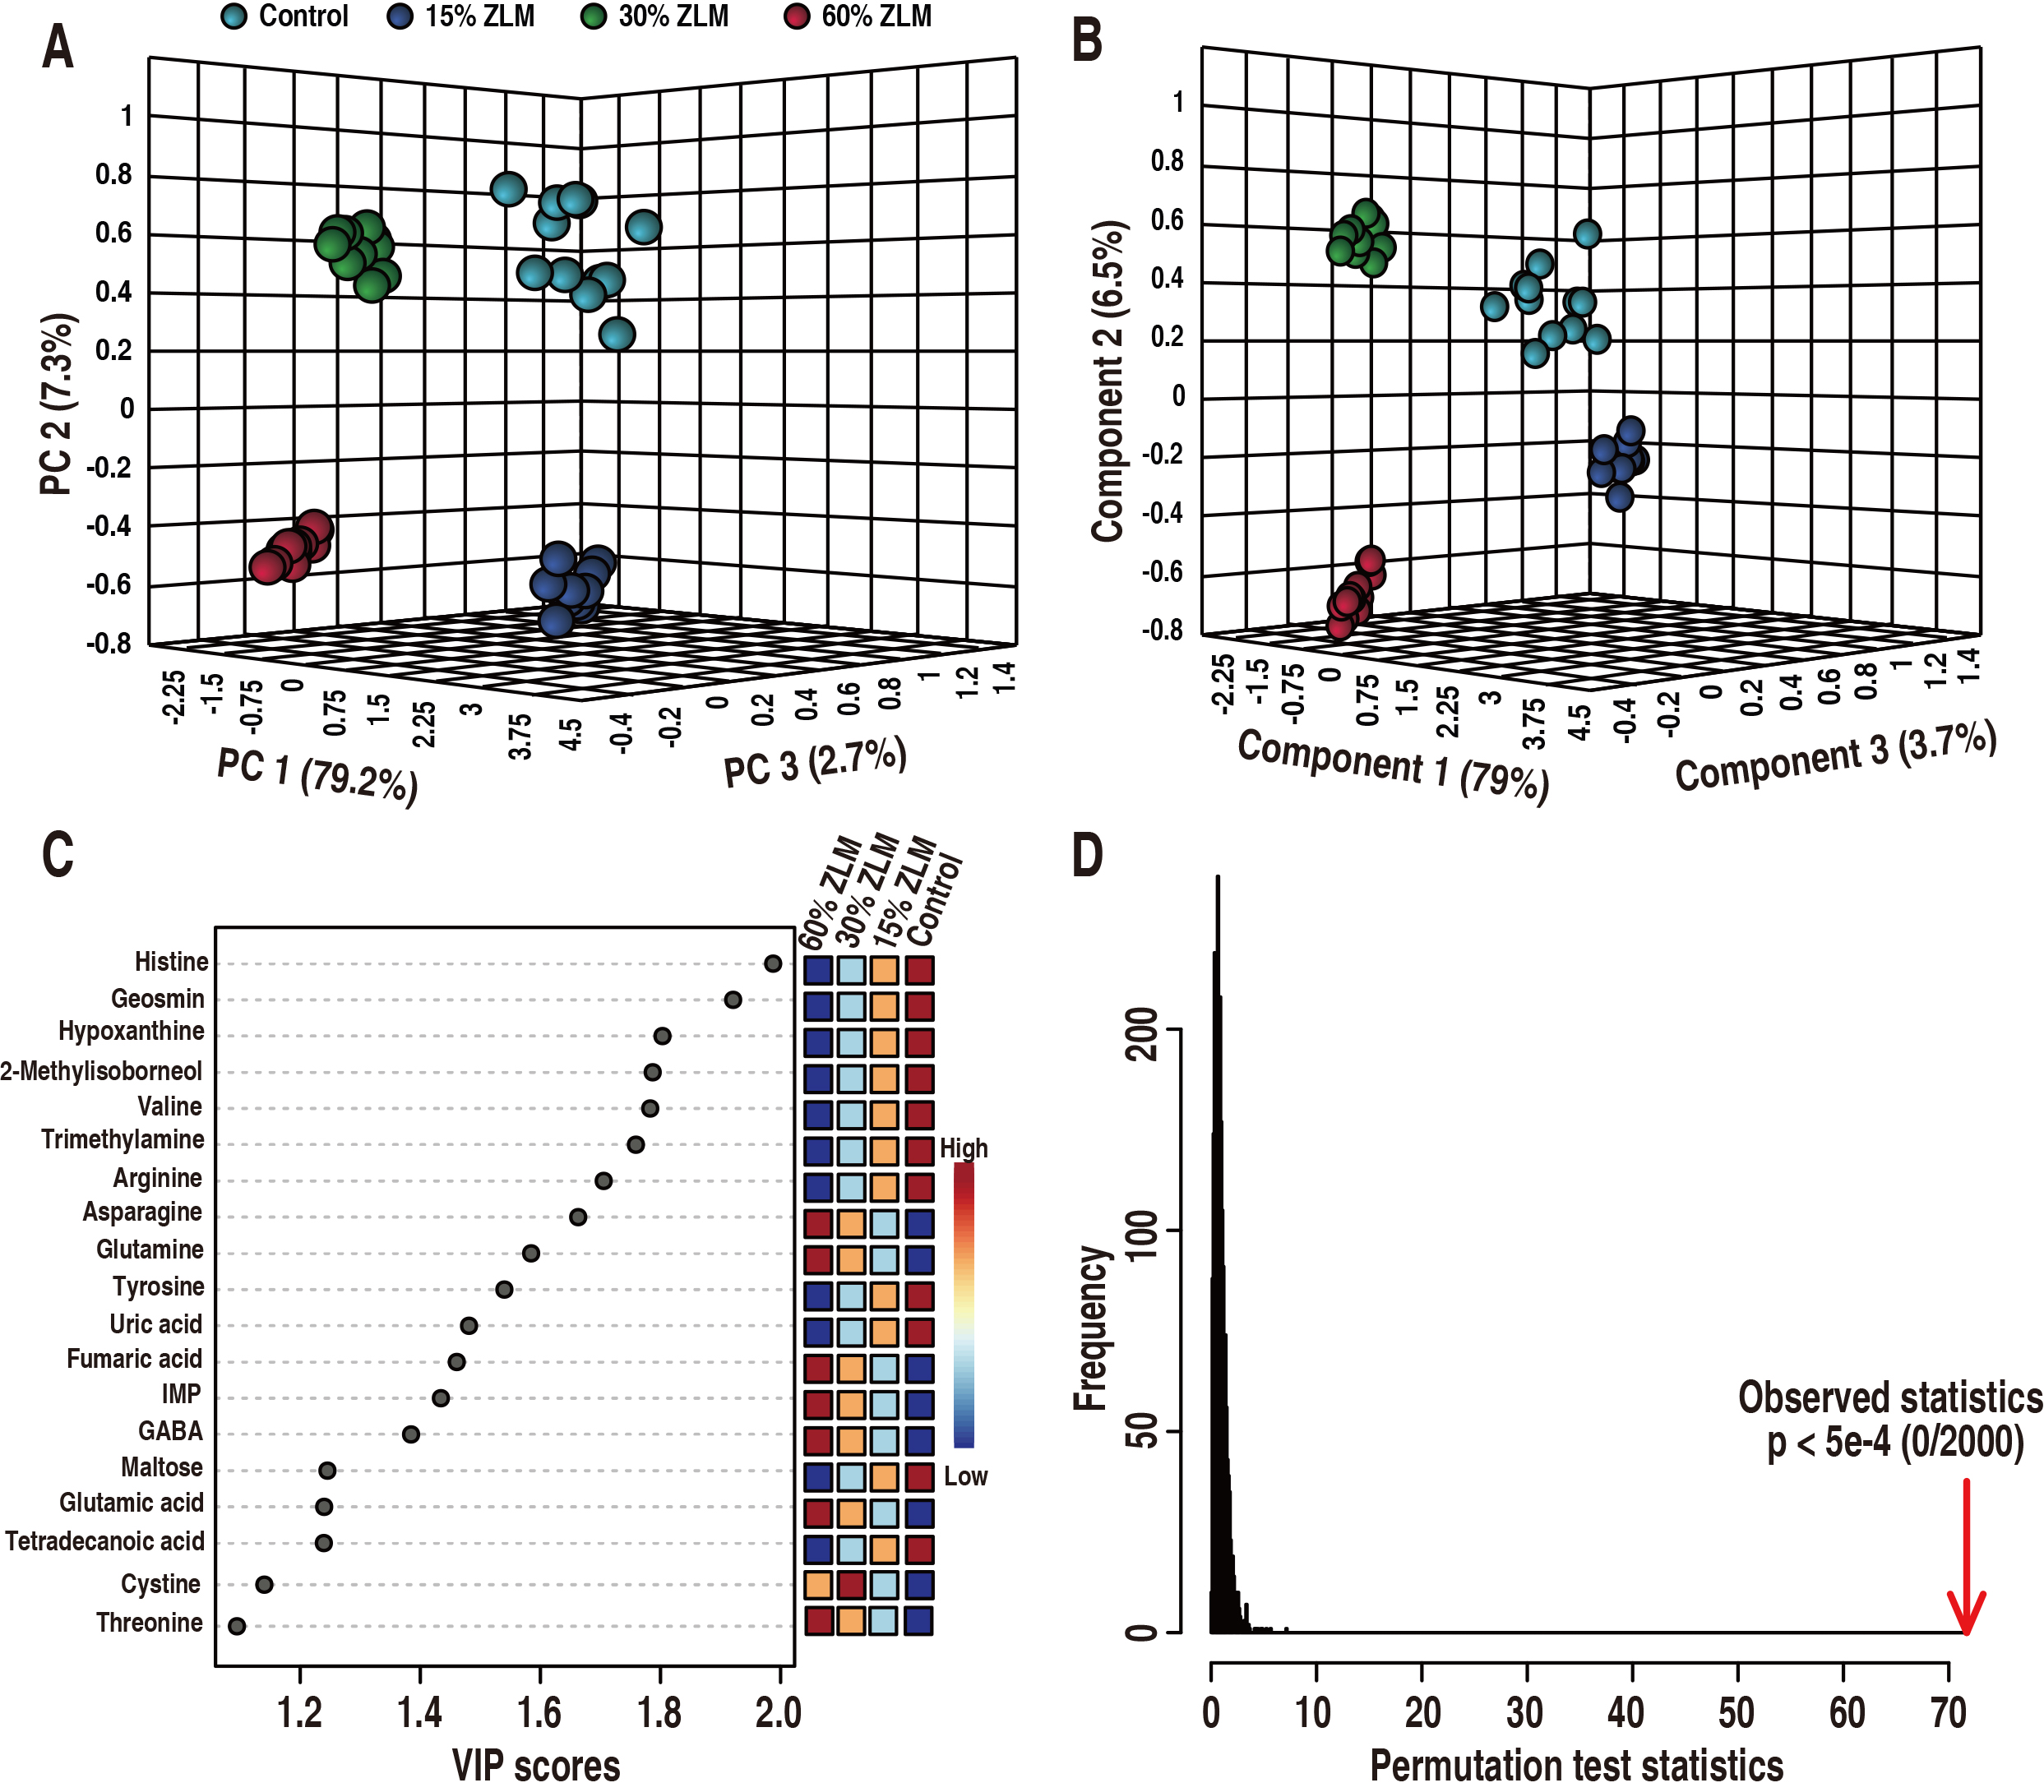
After comparing with the basal diet groups, an unsupervised PCA combined with a
supervised PLS-DA was conducted to discern the most crucial metabolites that
differentiate among 15%, 30%, and 60% ZLM groups, aiming to uncover
significant distinctions among these samples. As shown in Fig. 6, these 4
experimental groups were definitely distributed in a 3-D model (R2 = 0.99553, Q2
= 0.99328, Accuracy = 1.0). Then, the 5%, 30% and 60% ZLM supplemental groups
were distinguished from the control groups fed with basal diets by principle
component 1 to 3 (Fig. 6A) and component 1 to 3 (Fig. 6B) respectively. Using a
VIP values (variable importance for the projection) plot in PLS-DA, the cut-off
values of discriminating variables were set as more than one, and then these
metabolomic biomarkers were screened as showed in Fig. 6C. There were 19
biomarkers of histine, geosmin, hypoxanthine, 2-Methylisoborneol, valine,
trimetlylamine, arginine, asparagine, glutamine, tyrosine, uric acid, fumaric
acid, gamma-aminobutyric acid, inosine-5′-monophosphate (IMP), maltose,
tetradecanoic acid, glutamic acid, cystine, threonine, which VIP values of
component 1 to 3 were more than one. After conducting a 2000 permutation analysis
to assess the reliability of PLS-DA, the cross-validated and
observed coefficients of R2 and Q2 were depicted in Fig. 6D, demonstrating no
evidence of overfitting in PLS-DA due to a p-value less than 5
 Fig. 6.
Biomarkers. Identification of crucial metabolites was
performed using unsupervised and supervised pattern recognition analyses, namely
principal component analysis (PCA) and partial least squares-discriminant
analysis (PLS-DA), to distinguish the groups consisting of 15%, 30%, and 60%
ZLM as well as the basal diet groups. Each dot in the plot represented a
technological replicate analysis of samples. (A) PCA score plot with PC1, PC2,
and PC3 explained 89.2% of the total variance, enabling confident interpretation
of variation. (B) PLS-DA score plot with Component 1, Component 2, and Component
3 explained 89.2% of the total variance, allowing confident interpretation of
variation. (C) Variable importance in the projection (VIP) plot generated from PLS-DA (Accuracy = 1.0, R2 = 0.99553, Q2 =
0.99328), where each dot represented a candidate biomarker highlighted by its
average abundance shown in color key. There were 19 biomarker with VIP values
greater than one for components 1 to 3. Here inosine-5′-monophosphate (IMP)
referred to inosine-5′-monophosphate. (D) In PLS-DA,
cross-validated and observed coefficients of R2 and Q2 were
obtained through permutation analysis involving 2000 iterations (p
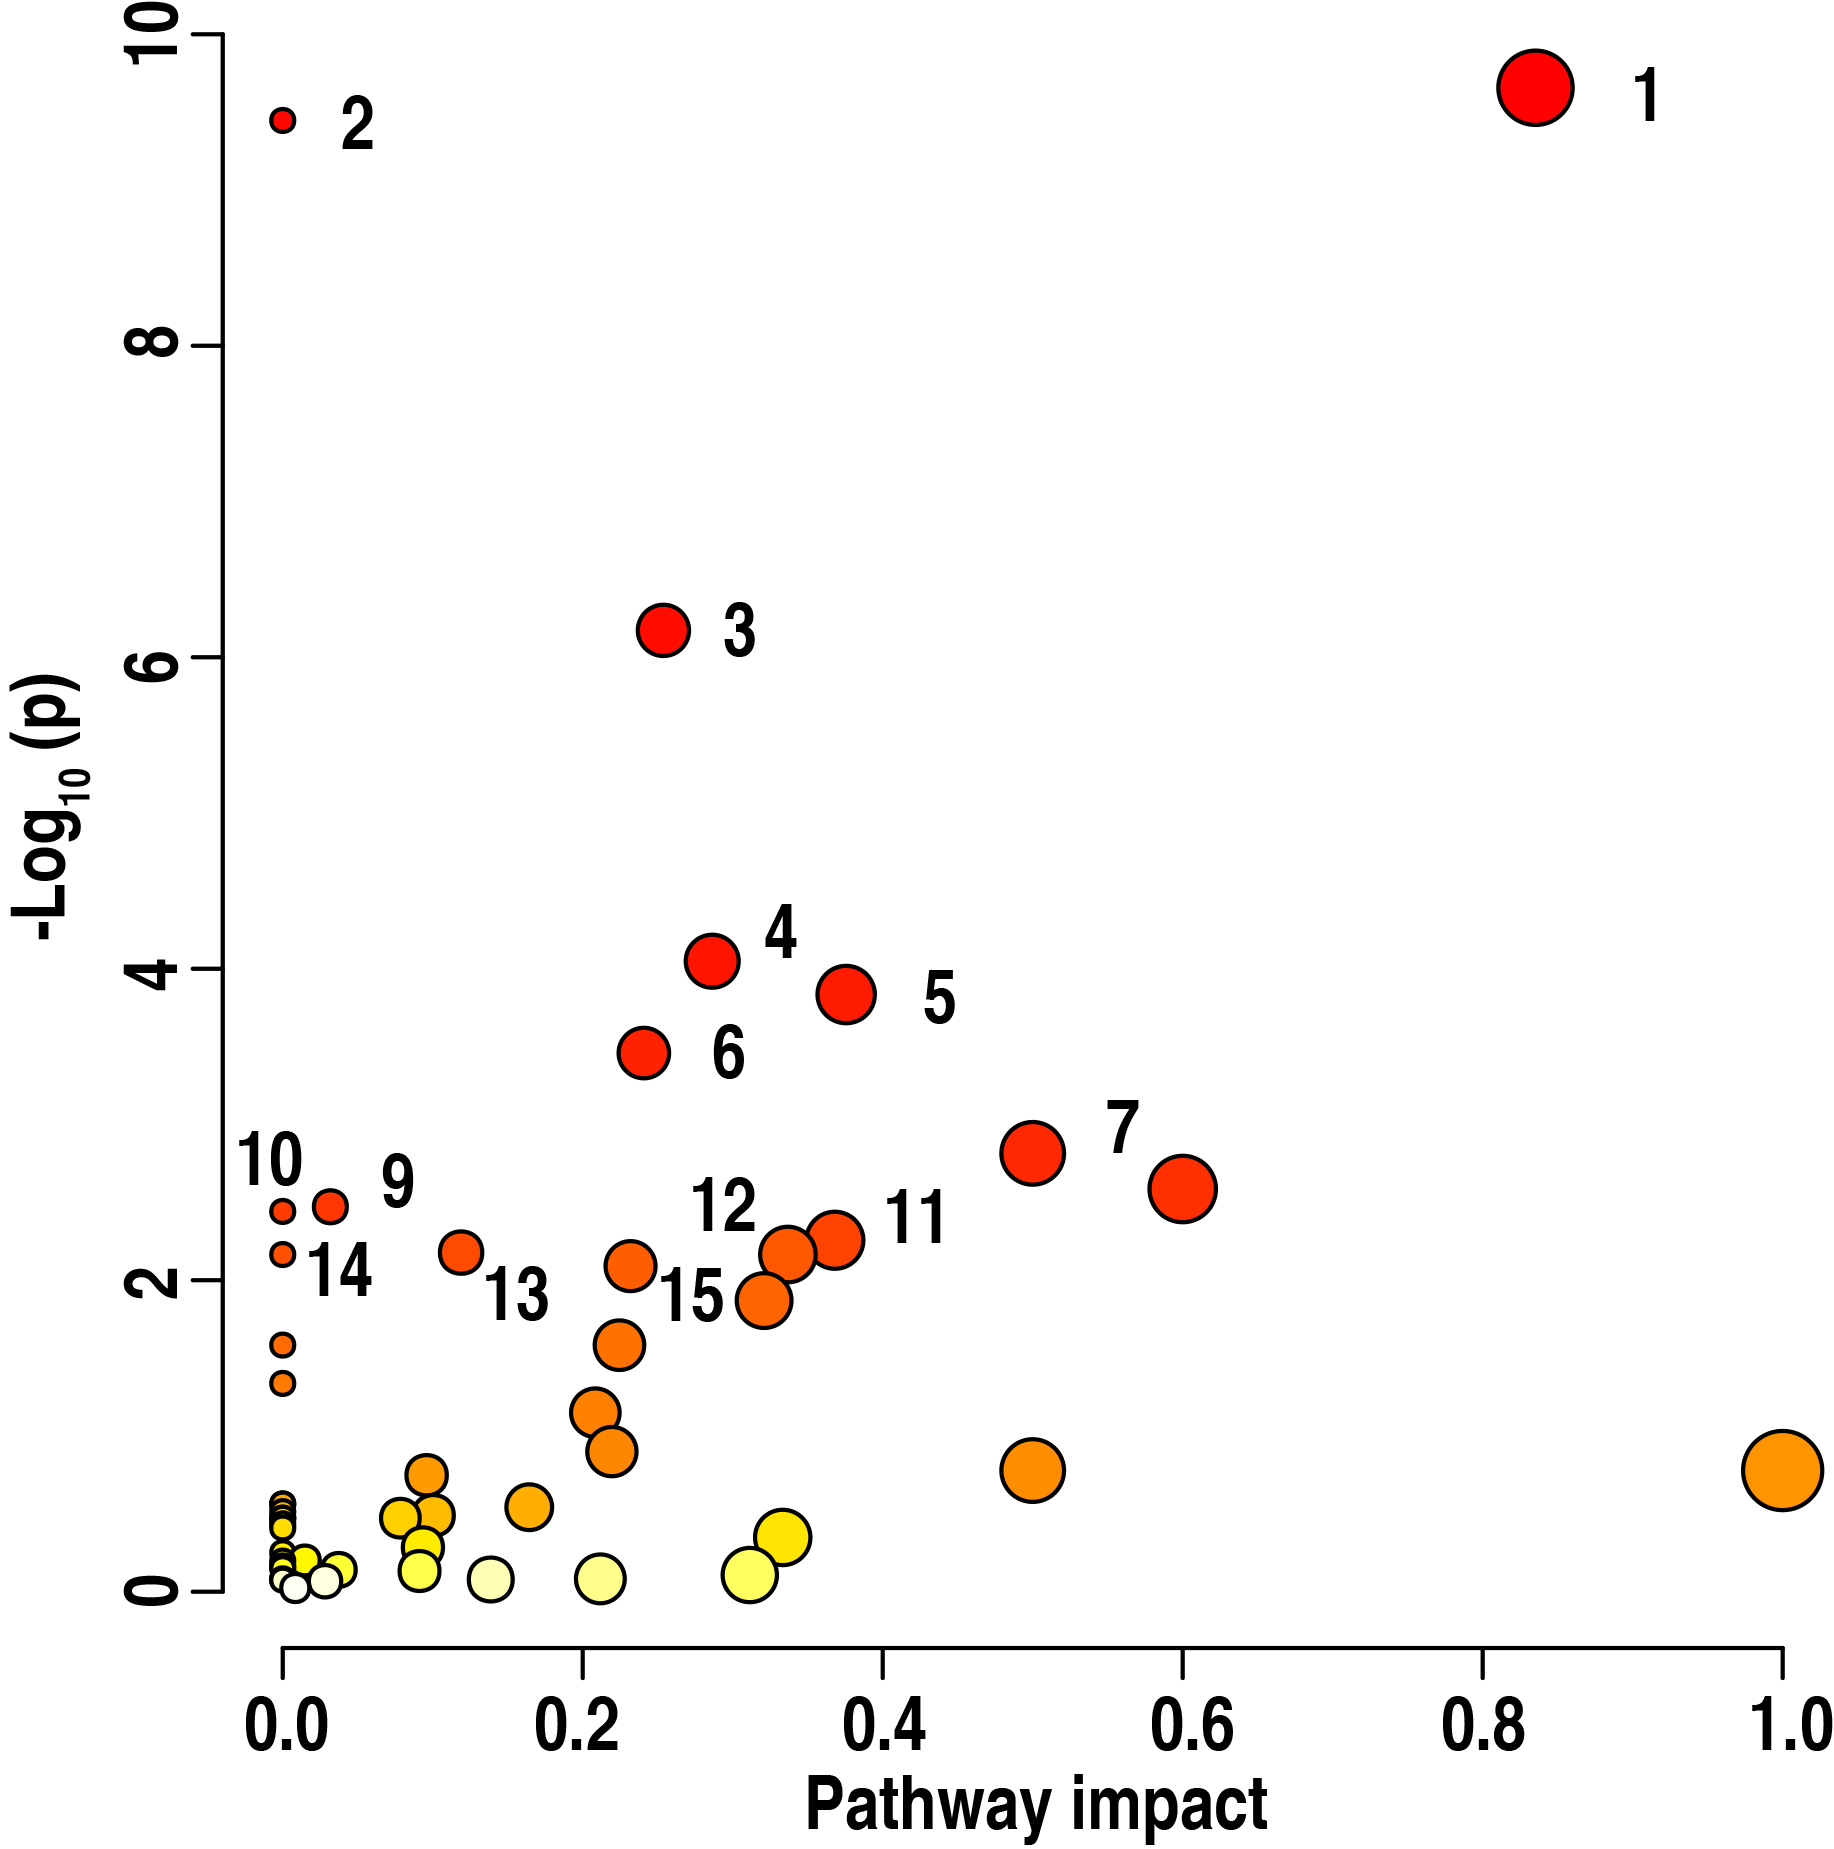
Furthermore, this research uncovered these enriched metabolic pathways which
were determined among the basal diet and 15%, 30% and 60% ZLM supplemental
groups. These enriched pathways were especially important to learn the
metabolomic effects response to these control basal diet and 15%, 30% and 60%
ZLM supplementary groups. The enrichment assays were performed using
MetaboAnalyst 6.0. A total of 15 metabolic pathways exhibited significant
enrichment in these groups (p
 Fig. 7.
Pathway enrichment analysis. Pathway enrichment analysis
revealed significant differences in the metabolite profiles among the 15%, 30%,
and 60% ZLM groups compared to the basal diet control groups (p
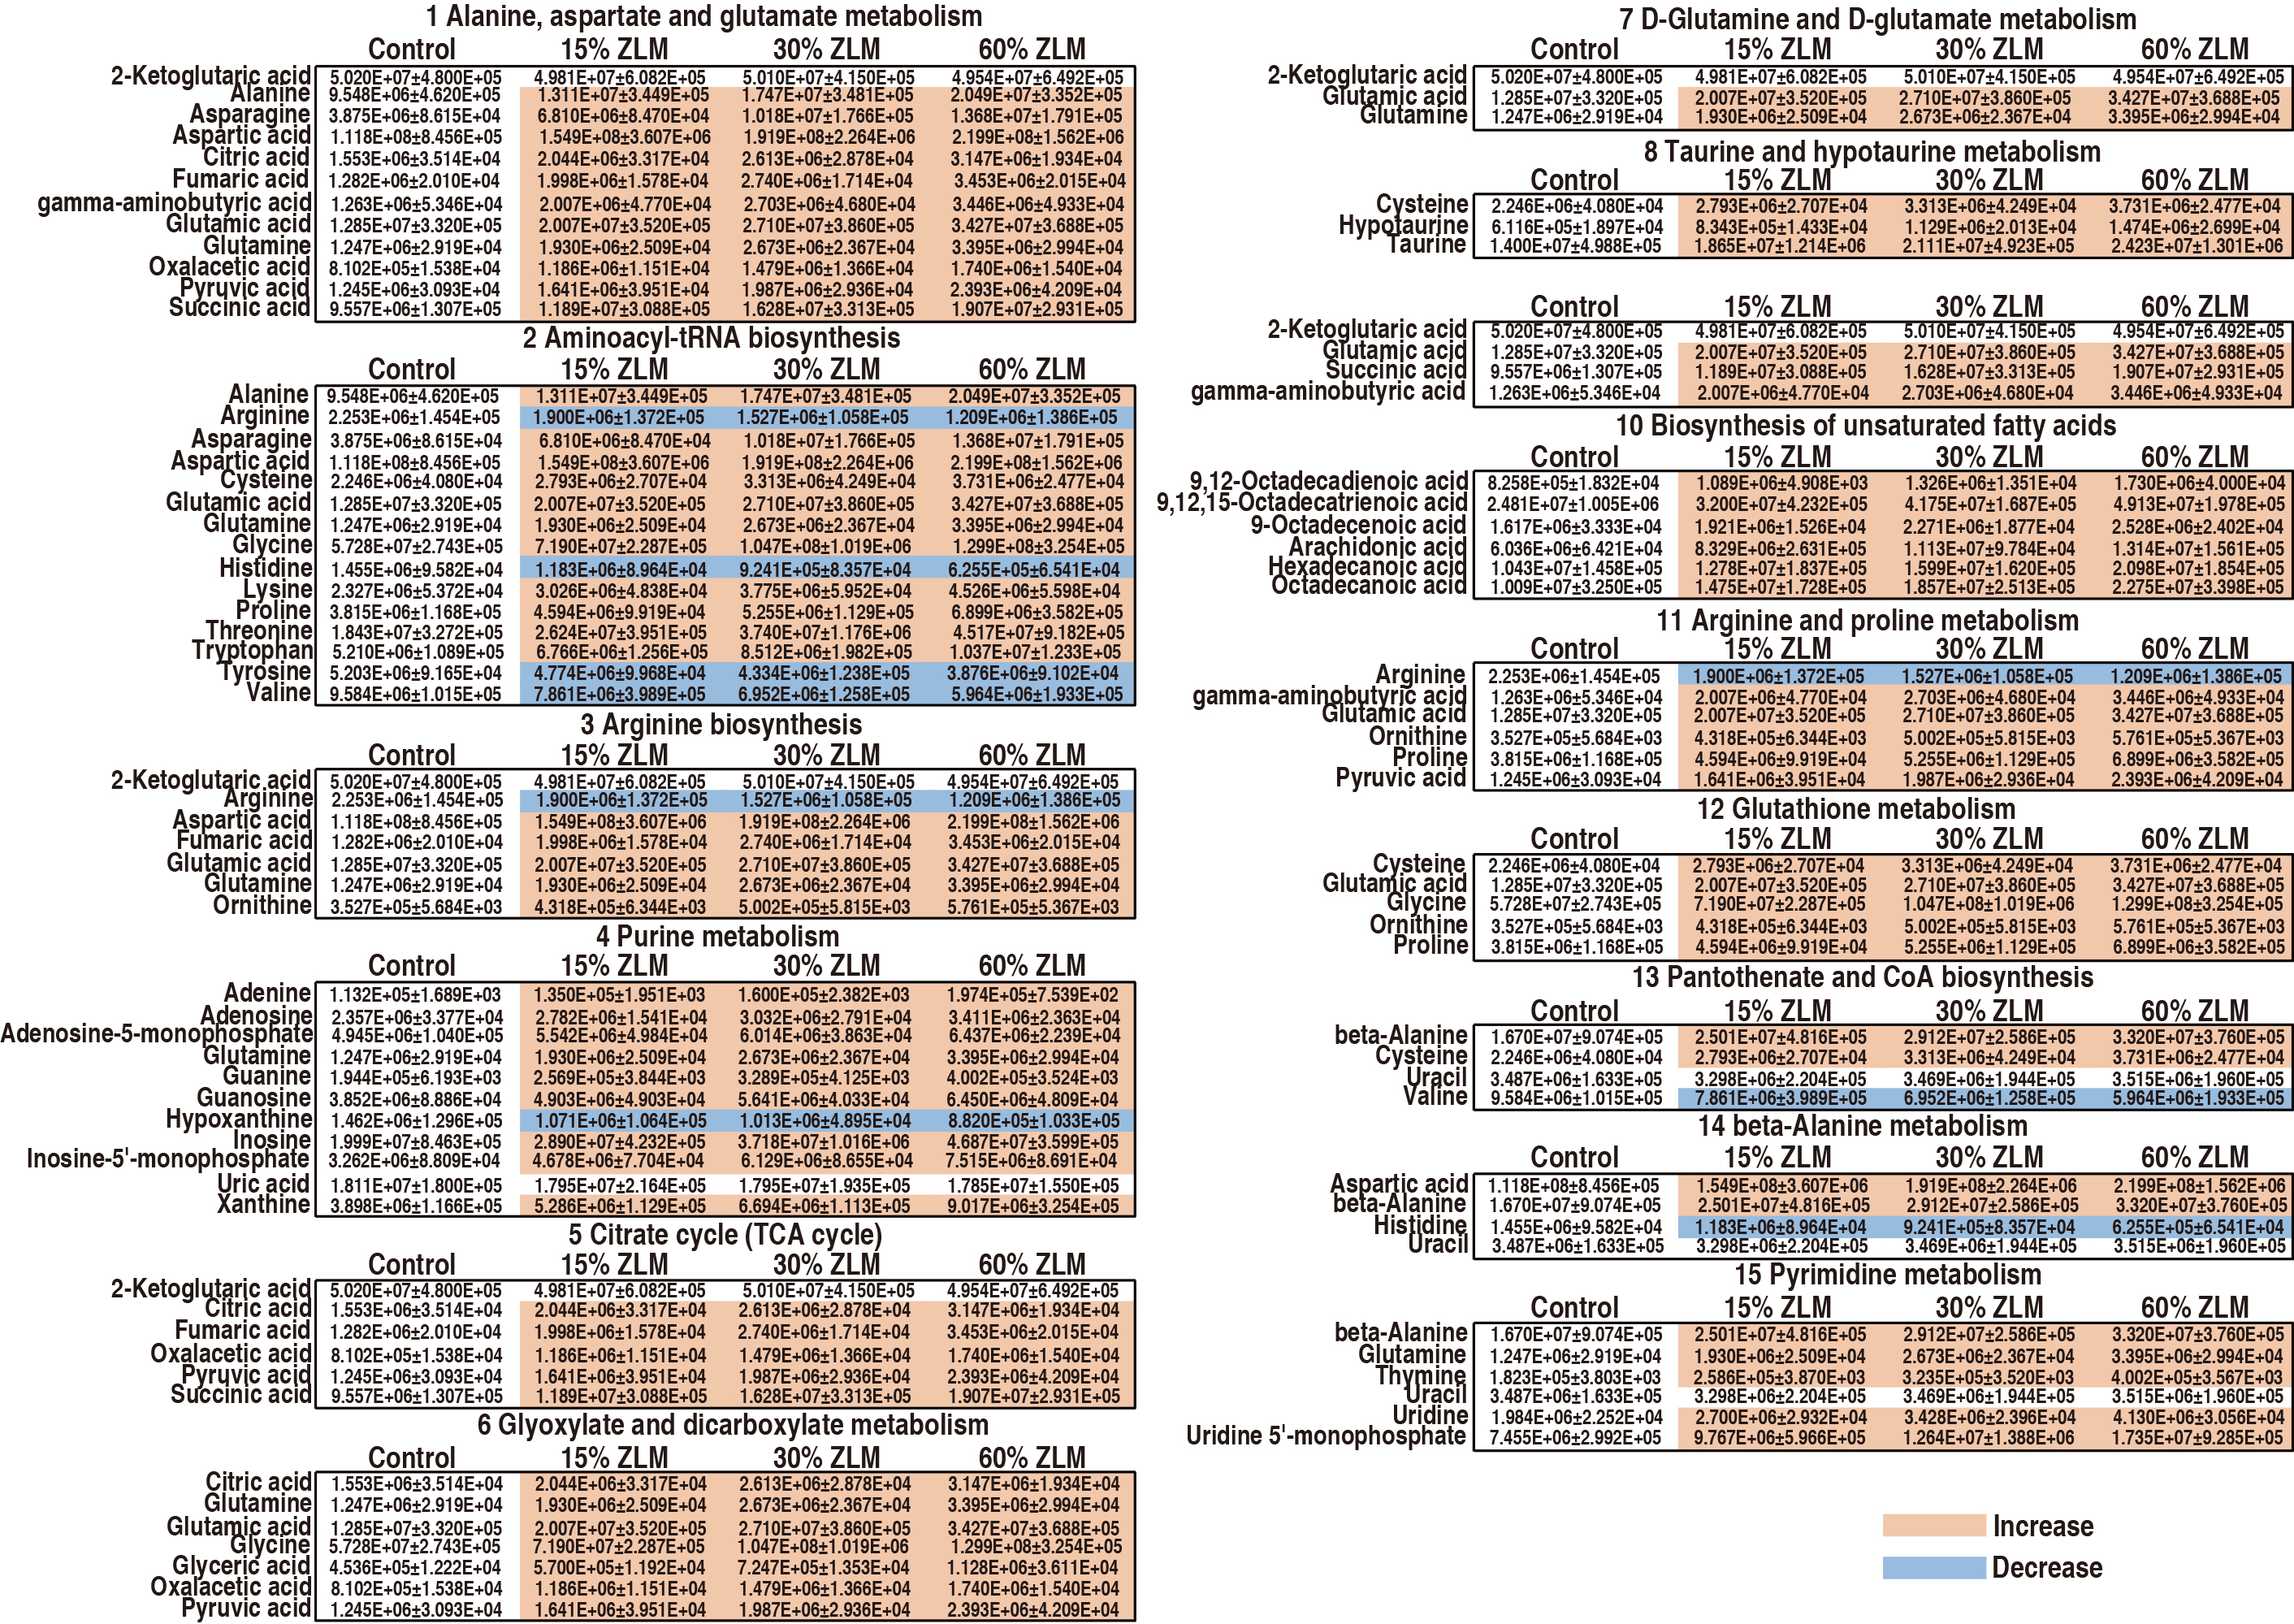
 Fig. 8.
Pathways’ metabolites. Integrative analysis of metabolites’ GC-MS abundance (XIC) in significantly enriched pathways was performed, and a chromatic diagram was utilized to differentiate the average abundance of these metabolites. The colors red and blue were assigned to represent the maximum and minimum abundances for each row (metabolite), respectively.
It was hypothesized that ZLM supplement could promote tilapia meat flavor. To verify this hypothesis, tilapias were fed with the basal diet and 15%, 30% and 60% ZLM supplements for 30 days. The findings of recent study suggested that ZLM supplements possessed metabolic effects in a dose-dependent manner.
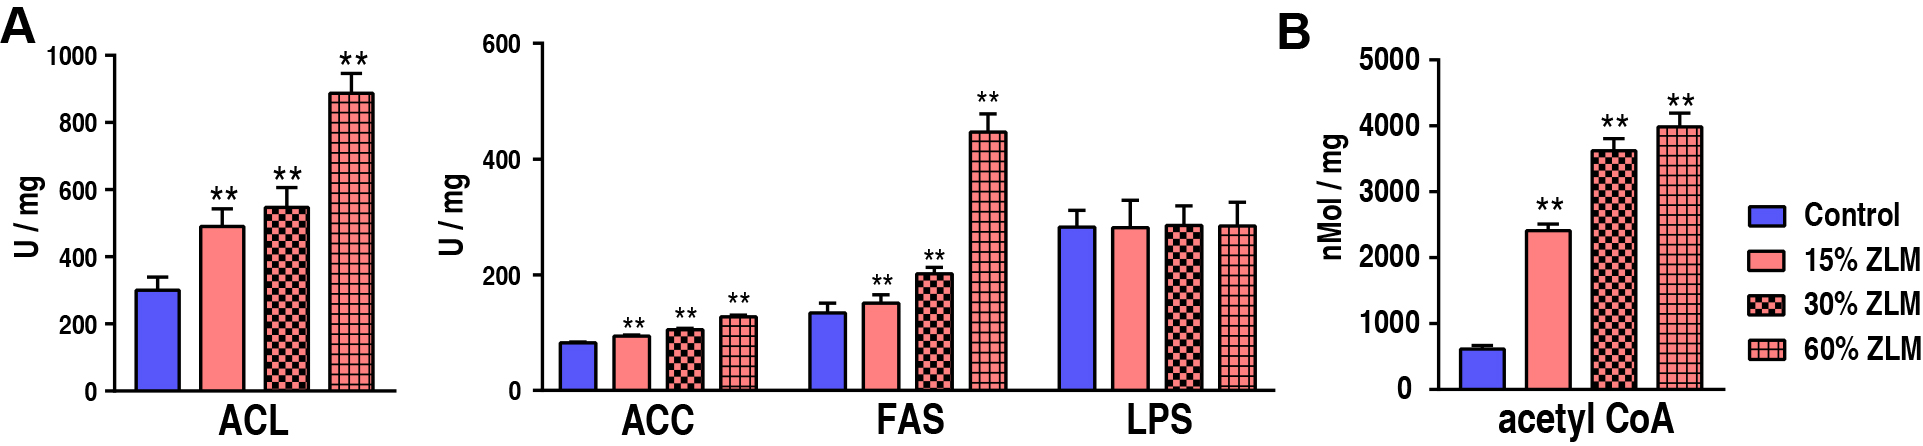
With an increasing ZLM supplement, these unsaturated fatty acids abundances in
tilapia liver also increased. To further estimate ZLM impacts on the biosynthesis
of fatty acids, the activity involved critical enzyme of ACL, ACC and FAS was
determined after feeding for 30 days. Compared with control groups fed by basal
diets, these enzymatic activities were all up-regulated in the experimental
groups fed by 15%, 30% and 60% ZLM supplements. With an increasing ZLM, the
activities also increased. And in detail as shown in Fig. 9A,
the ACL activity increased from 300.15
 Fig. 9.
The unsaturated fatty acids biosynthesis. (A) Activity of ACL,
ACC, FAS, LPS of livers fed with 15%, 30% and 60% ZLM and basal diet. (B)
Content of acetyl Co-A of livers in the presence of 15%, 30% and 60% ZLM
compared with basal diet. ** p
These increasing ZLM supplements could accumulate amino acids in tilapia livers.
To evaluate the ZLM impacts on amino acid and protein biosynthesis, GS and GOGAT
activities were detected after fed by ZLM and control diets for 30 days. Compared
with the control, GS and GOGAT were up-regulated in 15%, 30% and 60% ZLM
supplement groups. The activity of GS increased from 2.34
 Fig. 10.
The amino acids biosynthesis. Activity of GS and GOGAT of
livers fed with 15%, 30% and 60% ZLM and basal diet. ** p
To further uncover the ZLM impacts on tilapia energy metabolism, the ATP and
NADH contents were detected as profiled in Fig. 11A,B. The relative fluorescence
intensity (RFI) of ATP was measured in this study. Specifically, the ATP levels
increased from 59,355.00
 Fig. 11.
The energy metabolism. Compared to the basal diets, the
presence of 15%, 30%, and 60% ZLM feeds resulted in significant alterations in
liver ATP activity (A) and NADH content (B), as well as ICDHm, NAD-MDH, SDH, PDH,
and
Ultimately, using iPath 2.0 analysis as shown in Fig. 12, the activated energy metabolism (TCA cycle) promotes amino acid metabolism to increase the expression of flavor amino acids. TCA also promotes the biosynthesis of polyunsaturated fatty acids, thereby increasing the expression of flavor fatty acids of arachidonic acid, linoleic acid (9,12-Octadecadienoic acid), linolenic acid (9,12,15-Octadecatrienoic acid), and oleic acid (9-Octadecenoic acid). Additionally, TCA also activated nucleotide metabolism (Fig. 12).
 Fig. 12.
iPath analysis with iPath 2.0. Compared to the basal diets,
iPath analysis of the metabolic profiles resulting from tilapias fed with 15%,
30%, and 60% ZLM feed offered a more comprehensive understanding of the impact
of 71 differentially abundant metabolites (including acetyl-CoA and GSH) and 10
significant enzymes (p
The shortage and price increase of diet materials, such as soybean meal, fish meal, and fish oil, pose major challenges for the development of tilapia farming. Raw fish meal and fish oil are primarily sourced from marine fisheries which have been reduced due to global climate change [30]. Additionally, intensified human discharge and ocean acidification have also contributed to the decline in marine fisheries [31]. Overfishing has made it difficult for marine resources to regenerate [32]. Therefore, finding alternatives to fish meal and fish oil is crucial [33], which explains why fish meal is rarely used as a protein feed in tilapia farming in China. Although soybean meal is widely used as the main source of feed protein in China, its uneconomical price has affected tilapia farming. The increasing human population and intensifying anthropogenic activities have led to a significant rise in food waste generation, manure production, agricultural residues accumulation among others. Utilizing these wastes for breeding Z. atratus larvae can help alleviate environmental pollution while producing high-quality proteins [9, 34]. Compared with other feed materials, ZLM exhibits higher nutritional value both in terms of protein content and edible oil content [1, 7, 8, 9]. Previous studies have explored replacing fishmeal with Z. atratus larval meal with some promising results achieved [1, 7, 8, 9, 12, 13]. This approach can address the crisis caused by expensive protein diet materials while promoting sustainable production of ZLM. Our study demonstrated a significant increase in flavor metabolites abundance in the dorsal muscle when supplemented with ZLM. Furthermore, ZLM supplements significantly improved sensory attributes of tilapia meat quality. We identified critical biomarkers and important metabolic pathways associated with different ZLM supplementation metabolomes.
The production of tilapia meat has been significantly increased through factory farming. However, the demand for tilapia is no longer focused on quantity but quality, which has led to an increasing emphasis on the flavors of fish meat [35]. These metabolites derived from unsaturated fatty acids, nucleotides, and amino acids contribute to the development of a sweet taste, pleasant aroma, and overall meat flavor [36]. An increase in ZLM resulted in elevated levels of guanosine, adenosine, adenosine-5′-monophosphate (AMP), inosine-5′-monophosphate (IMP), xanthine, uridine, and uridine-5′-monophosphate (UMP), all beneficial for enhancing meat flavor [37], while levels of inosine and hypoxanthine decreased leading to off-flavors [38]. Among the flavor fatty acids and their derivatives present in tilapia meat are arachidonic acid, linoleic acid (9,12-Octadecadienoic acid), linolenic acid (9,12,-15-Octadecatrienoic acid), and oleic acid (9-Octadecenoic acid) which accumulate and improve sensory quality [39]. Aspartic acid and glutamic acid levels associated with umami taste perception were found to be elevated. Additionally, concentrations of alanine, glycine, proline, serine, threonine were increased contributing to sweetness sensation. Conversely, arginine, histidine, tyrosine and valine with bitterness decreased. Thus, the composition of these flavor amino acids could enhance the sensory quality of tilapia meat [40]. Furthermore, GC-MS strategies were employed to confirm the presence of 2-methyl-3-furanthiol [19, 41] and nonanal [20, 42], known for their savory essence. Moreover, their levels exhibited a proportional increase upon supplementation with ZLM. Additionally, it’s worth noting that the fishiness metabolite 2-methylisoborneoll, geosmin, and trimethylamine [43, 44] were detected, and their contents also decreased with an increased ZLM. Therefore, ZLM may improve the flavor of tilapia meat.
The metabolome serves as a robust tool for elucidating the formation of food
flavors [45]. Following a 30-day ZLM feeding regimen in tilapia, distinct
experimental treatments exhibited divergent metabolomes. Subsequently, employing
metabolomic approaches revealed significant alterations in 69 metabolites
(p
Fatty acid metabolism has a significant impact on flavor, and this study
identified notable alterations in the biosynthesis pathway of unsaturated fatty
acids, including arachidonic acid, linoleic acid (9,12-Octadecadienoic acid),
linolenic acid (9,12,15-Octadecatrienoic acid), and oleic acid (9-Octadecenoic
acid), which are crucial flavor compounds [39]. Fatty acids not only serve as
essential biofilm components but also play a role in meat flavor formation [46].
Previous studies have suggested that unsaturated fatty acids may be involved in
immune regulation [47] and neuro-physiological effects [48]. Therefore, we
measured the activities of ACL, ACC, LPS and FAS during fatty acids biosynthesis.
Our results showed that increasing ZLM supplements led to increased ACL, ACC and
FAS activities. This suggests that ZLM promotes positive fatty acids metabolism
with an emphasis on unsaturated fatty acids biosynthesis. In contrast to these
findings, LPS activity remained unchanged even with an increase in ZLM
supplement. Most importantly, the acetyl CoA contents in tilapia livers were
found to increase significantly after feeding with ZLM diets. However, LPS
activity was not significantly enhanced, suggesting that acetyl CoA was not
derived from
Due to its high protein content, soybean meal is extensively utilized in the large-scale feed industry. Although the soybean meal used in this study was depleted of anti-nutritional factors, it still contained certain limitations [49]. Despite fish meal being a valuable feed protein, soybean meal is commonly employed as tilapia feed in China. Hence, this study aimed to substitute soybean meal with ZLM supplement in basal diets. Previous study has demonstrated that ZLM possesses equivalent protein and amino acid contents to fish meal [50]. Moreover, several experiments replacing fishmeal with ZLM have reported improved production performance in fish [50, 51], which aligns with the findings of our study. Amino acids play a crucial role in flavor development, and their composition determines the sensory quality of food [40]. Through metabolic pathway enrichment analysis, we discovered that ZLM enhances amino acid metabolism and protein biosynthesis. Therefore, to investigate the response of protein biosynthesis to ZLM supplementation, we measured GS and GOGAT activities which were found to increase with higher levels of ZLM. The inclusion of ZLM in tilapia diet resulted in enhanced amino acid biosynthesis metabolism and subsequently strengthened protein biosynthesis.
Given that energy metabolism serves as the foundation for overall metabolism,
these flavor metabolites are derived from energy metabolism, specifically the TCA
cycle. Analysis results from iPath 2.0 indicate that the TCA cycle has a
significant impact on global metabolism. Following a 30-day ZLM supplementation
in tilapia, there were notable changes in energy metabolism. Within this context,
the TCA cycle plays a crucial role as a biosynthetic pathway by providing
essential biomaterials for key metabolic processes such as nucleotide and fatty
acid metabolism, protein synthesis, and amino acid metabolism. Consequently, to
assess the effects of increasing ZLM supplementation on energy metabolism’s TCA
cycle, we measured the activities of SDH,
In summary, this study revealed that the flavor of tilapia dorsal muscle can be
enhanced through the metabolic effects of ZLM. Following a 30-day feeding period
with increasing ZLM diets, the flavor metabolites in tilapia were augmented via
upregulated metabolic pathways. Notably, ZLM improved enzymatic activities of
During the preparation of this work, the authors used ChatGpt in order to check spell and grammar. After using this tool, the authors reviewed and edited the content as needed and take full responsibility for the content of the publication.
The raw data supporting the conclusions of this article will be made available by the authors, without undue reservation.
YFL designed experiments and wrote the manuscript. HZL, GZ, JLL and DWD carried out experiments, analyzed experimental results. BY made the figures and searched references. MJY obtained funding acquisition, and carried out project administration, designed experiments, wrote the manuscript, revised the manuscript. All authors approved the final manuscript. All authors contributed to editorial changes in the manuscript. All authors have participated sufficiently in the work and agreed to be accountable for all aspects of the work.
The study received approval from the Academic Committee of Xizang Vocational Technical College (20210820-1). Informed consent was obtained from all subjects involved in this research. The animal study was reviewed and approved by the Institutional Animal Care and Use Committee of Zhongkai University of Agriculture and Engineering (ZK20200803). Moreover, the study was conducted in accordance with national regulations and protocols, including GB/T 42011-2022 (Laboratory animals—General code of animal welfare), RB/T 061-2021 (Technical specifications on euthanasia of laboratory animals), and GB/T 39649-2020 (Laboratory animal—Quality control of laboratory fish) as documented in CNKI (https://www.cnki.net/).
Sincerely thanks Miss. Yan Xie and Miss. Liuqing Shi (The School of Life Sciences, Sun Yat-sen University, Guanghzou, China) for their help of biochemistry detection.
This work was sponsored by grants from Guangdong Provincial Special Fund for Modern Agriculture Industry Technology Innovation Teams (2019KJ141) and Program for Scientific and Technological Innovation Team Construction in Universities of Xizang Autonomous Region (Xizang Vocational Technical College 2014-2017).
The authors declare no conflict of interest.
Supplementary material associated with this article can be found, in the online version, at https://doi.org/10.31083/j.fbl2911382.
References
Publisher’s Note: IMR Press stays neutral with regard to jurisdictional claims in published maps and institutional affiliations.