


 , Xingxing Zhang 1,3,*
1 Fengxian District Center Hospital Graduate Student Training Base, Jinzhou Medical University, 201499 Shanghai, China
2 Endoscopy Center, Minhang Hospital, Fudan University, 201199 Shanghai, China
3 Department of Gastroenterology, Shanghai Jiaotong University Affiliated Sixth People Hospital South Campus, 201499 Shanghai, China
†These authors contributed equally.
Abstract
Gastric cancer (GC) is a significant global health burden with limited treatment options. The purpose of this study was to investigate the role of SLC30A2, a zinc transporter, in GC development and its capacity as a target for therapy.
A comprehensive analysis of GC datasets (GSE54129 and stomach adenocarcinoma (STAD) from The Cancer Genome Atlas (TCGA)) was conducted using bioinformatics tools to examine differential gene expression, focusing on SLC30A2. Functional assays, including Cell counting kit-8 (CCK-8) and transwell assays, were carried out on GC cell lines to determine the impact of SLC30A2 knockdown on cell behavior. Flow cytometry was utilized to quantitatively observe cell apoptosis and cell cycle progression. The impact of zinc sulfate (ZnSO4) on GC cells was evaluated by detecting apoptosis markers, Wnt/β-catenin signaling pathway activity, and oxidative stress biomarkers, focusing on the regulatory effect of SLC30A2 overexpression.
Our analysis revealed significant upregulation of SLC30A2 in GC samples compared to normal samples, and high SLC30A2 expression was linked to poor prognosis. SLC30A2 knockdown repressed proliferation, invasion, and migration of GC cells, induced apoptosis, as well as arrested the cell cycle. Additionally, ZnSO4 treatment induced cytotoxicity and oxidative stress in GC cells, while SLC30A2 overexpression rescued ZnSO4-induced, migration, invasion, and proliferation. Moreover, ZnSO4 had been shown to bolster apoptosis and trigger the Wnt/β-catenin signaling pathway, effects which were mitigated by the overexpression of SLC30A2.
Our results implied that SLC30A2 was essential for GC progression by modulating zinc homeostasis and cellular processes. Targeting SLC30A2 or zinc signaling may represent a potential therapeutic approach for GC treatment.
Keywords
- SLC30A2
- gastric cancer
- zinc metabolism
- Wnt/β-catenin signaling pathway
- oxidative stress
- apoptosis
Gastric cancer (GC), primarily presenting as stomach adenocarcinoma, accounts for over 95% of cases and is one of the most common malignant tumors globally [1]. As one of the leading contributors to cancer-related fatalities worldwide, GC exhibits high incidence and mortality rates, with an estimated 1.2 million new cases diagnosed globally annually [2]. Helicobacter pylori infection, dietary practices, alcohol intake, smoking, and genetic susceptibility are some of the variables that contribute to its etiology [3, 4]. Surgery, chemotherapy, radiation therapy, and targeted therapy are the current therapeutic options for GC [5, 6]. While early-stage GC can be curable with aggressive treatment, the 5-year survival rate for advanced-stage GC, even after surgical intervention, remains around 25% [7]. Recent evidence suggested that elevated serum zinc levels may have a protective role against GC. Further comprehensive research is needed to confirm these findings [8]. The urgent need for innovative diagnostic biomarkers to improve treatment outcomes and survival rates for GC patients is emphasized.
Dysregulation of the Wnt/
The SLC30 family, also recognized as the Zinc Transporter (ZnT) family, comprises a set of transport proteins that are instrumental in mediating the translocation of zinc ions across cellular membranes [13]. This family includes ten members, identified as SLC30A1 through SLC30A10, playing a pivotal role in zinc homeostasis and the modulation of various cellular functions [14]. Zinc is an essential trace element in human physiology, playing a crucial role in various biological processes. Current research has concentrated on the expression patterns of SLC30 family genes in the prognosis and therapeutic targeting within GC [15]. Analysis involving gene expression and survival data from GC patients has highlighted SLC30A5 and SLC30A7 as potential prognostic markers. Concurrently, SLC30A2 and SLC30A3 have been implicated in cancerous transformation, presenting novel avenues for therapeutic intervention [16]. SLC30A2, or ZnT2, is chiefly responsible for the regulation of intracellular and interstitial zinc ion concentrations, underscoring its importance in zinc absorption, secretion, and transport processes. The significance of SLC30A2 extends to maintaining homeostasis within the human intestinal mucosa, with genetic variations potentially impacting the susceptibility to mucosal inflammation and related intestinal pathologies [17]. The ongoing investigation into SLC30A2 aimed to elucidate the underlying mechanisms of zinc metabolism and identify new therapeutic targets for the management of GC. This research underscored the importance of the SLC30A2 transporter family in both basic and clinical research domains.
Given the critical role of SLC30A2 in zinc ion homeostasis and its
emerging significance in the pathogenesis and progression of GC, this research
aimed to analyze the diverse impacts of SLC30A2 expression in regulating
GC progression. We aimed to elucidate the prognostic significance of
SLC30A2 and its potential as a therapeutic target by integrating
differential expression analysis, correlation with clinicopathological features,
and functional in vitro assays. To understand the impacts of
SLC30A2 on GC cell migration, apoptosis, invasion, and proliferation, as
well as its interaction with the Wnt/
We opted for the GSE54129 dataset in the Gene Expression Omnibus (GEO)
(https://www.ncbi.nlm.nih.gov/gds/) database, which comprised 111 human GC tissue
samples and 21 non-cancerous gastric tissue samples. Furthermore, from the
stomach adenocarcinoma (STAD) dataset in The Cancer Genome Atlas (TCGA) database
(https://tcga-data.nci.nih.gov/tcga/), we extracted 32 adjacent non-tumor tissue
samples and 375 STAD samples. The “Limma” program (version 3.6.0) in R software (version 3.6.0, R Foundation for Statistical Computing, Vienna, Austria)
was used to carry out the differential expression analysis. The selection of
genes was done using fold change (FC), with FC
To evaluate the expression levels of SLC30A2 in the GSE54129 dataset
and the TCGA-STAD dataset, the Wilcoxon test was employed. Visualization of the
expression data was facilitated utilizing the “ggplot2” library (version 3.2.1)
within the R software. The subsequent assessment involved the application of the
“survival” package (version 3.6.3) in R for conducting Kaplan-Meier (KM)
survival curve analysis. This analysis aimed to assess the effects of
SLC30A2 expression levels at high and low on the Progression-free
Survival (PFS) probability among STAD patients, including the calculation of the
log-rank p-value. Additionally, the University of Alabama at Birmingham
Cancer data analysis portal (UALCAN) database
(http://ualcan.path.uab.edu/index.html) was used to study the correlation between
the level of SLC30A2 and various clinical factors in TCGA-STAD samples.
The clinical factors analyzed encompassed individual cancer stages, patient’s
gender, patient’s race, tumor grade, patient’s age, and lymph node metastasis
status. Statistical significance threshold was specified as a p
The Type Culture Collection of the Chinese Academy of Sciences (Shanghai, China) supplied the normal gastric mucosal cells (GES1) and the GC cell lines (AGS, HGC27, MGC803, and SNU-1). RPMI 1640 medium (Bioss, Beijing, China) was used to culture the cells. 10% fetal bovine serum (Gibco, Carlsbad, CA, USA), 100 mg/mL streptomycin (Solarbio, Beijing, China), and 100 units/mL penicillin (Gibco, Carlsbad, CA, USA) were added as supplements. All cell lines were validated by short tandem repeat (STR) profiling and tested negative for mycoplasma. Cells were all cultured in a humidified incubator at 37 °C and 5% CO2.
AGS and HGC27, two GC cell lines, were plated on a 24-well plate at the
concentration of 2
Total RNA extraction from GC cells was performed utilizing the RNeasy kit (Qiagen, Beijing, China). complementary DNA (cDNA) synthesis was completed utilizing the QuantiTect SYBR Green PCR kit (Qiagen). Subsequently, the StepOnePlus real-time PCR machine (Applied Biosystems, Foster City, CA, USA) was employed to carry out qRT-PCR using the SYBR Green PCR Master Mix. For data normalization, glyceraldehyde-3-phosphate dehydrogenase (GAPDH) was utilized as an internal reference. The following primer sequences were used for amplification in Supplementary Table 1. Gene expression analysis was conducted using the 2-ΔΔCT method.
Protease and phosphatase inhibitors were included in RIPA lysis buffer (pH 8.0)
(Thermo Fisher Scientific, Waltham, MA, USA) that was employed to make cell protein extracts.
The bicinchoninic acid (BCA) Protein Assay Kit (Beyotime, Jiangsu, China) was employed to calculate
the concentration of protein. SDS-PAGE was employed to divide equal quantities of
protein, which were then deposited onto polyvinylidene fluoride (PVDF) membranes
(BSA-coated, Beyotime, Jiangsu, China). Wuhan Sanying Biotechnology (Wuhan,
China) provided all of the antibodies used. Primary antibodies against SLC30A2
(1:2000), Cyclin D1 (1:5000), P21 (1:1000), P27 (1:1000), Cleaved-caspase-3
(1:1000), Cleaved-caspase-9 (1:1000), Wnt-3a (1:1000), and anti-
Cell proliferation and viability were evaluated utilizing CCK-8 assay (CK04,
Dojindo, China). In a 96-well plate, AGS and HGC27 cells were added at a cell
count of 5
Following transfection for 24 hours, cells were harvested and re-suspended at a
concentration of 5
To evaluate cell apoptosis and cell cycle distribution in AGS and HGC27 cells,
flow cytometry analysis was performed. Initially, AGS and HGC27 cells were
cultivated for 24 hours after being planted at a density of 1
In 96-well plates, AGS and HGC27 cells were planted at a density of 1
In this study, the secretion of Caspase-3, Cytochrome C (CYC), Tumor necrosis factor (TNF)-
The dataset underwent statistical analysis using the R programming language. The
student’s t-test was utilized to analyze variations between groups and
mean values along with their standard deviations (SD) were reported. An analysis
of variance (ANOVA) was employed in conjunction with Tukey’s post-hoc test to
assess variations between several groups. p
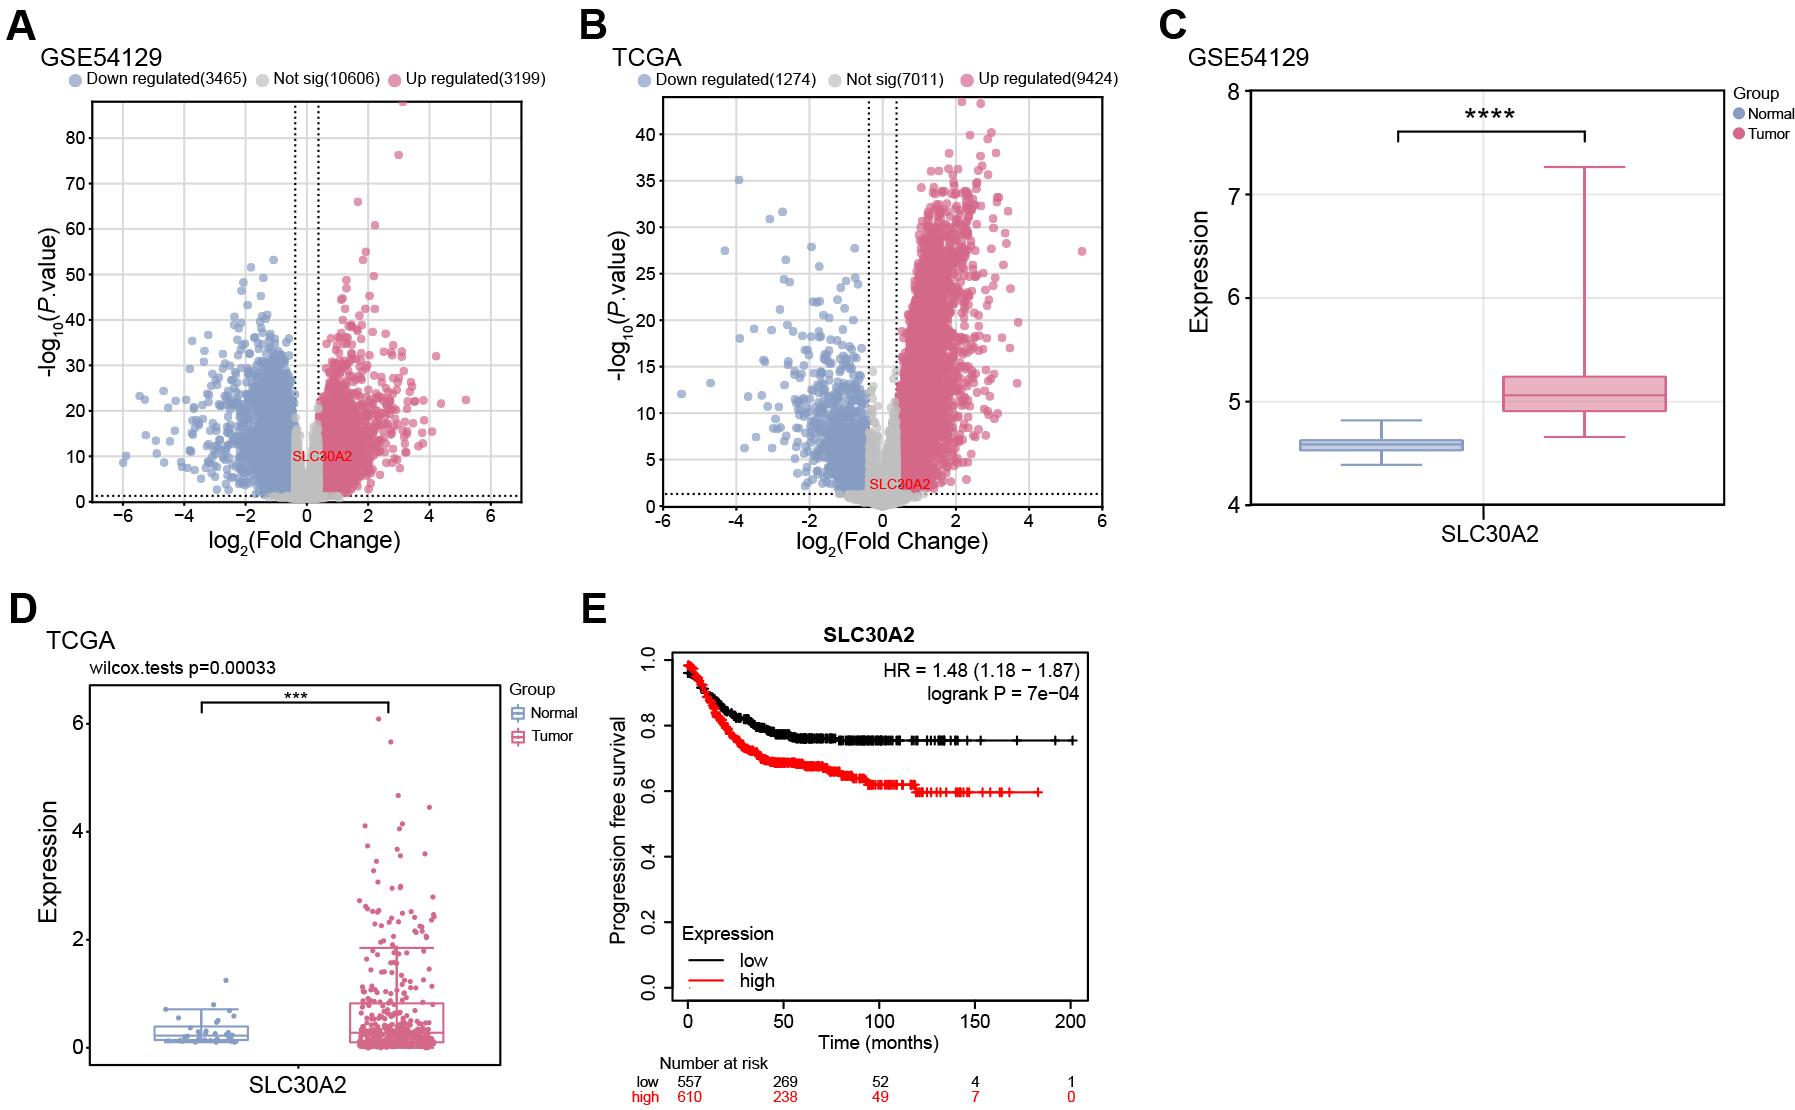
The “limma” package was employed in this work to conduct differential
expression analysis on the GSE54129 dataset and TCGA-STAD samples. Specifically,
3199 upregulated DEGs and 3465 downregulated DEGs were identified from the
GSE54129 dataset, while 9424 upregulated DEGs and 1274 downregulated DEGs were
selected from the TCGA-STAD samples (Fig. 1A,B). Notably, SLC30A2 was
identified as an upregulated gene in both the GSE54129 dataset and TCGA-STAD
samples, exhibiting significant overexpression in tumor samples (Fig. 1C,D).
Moreover, KM survival analysis indicated that higher expression levels of
SLC30A2 were associated with a markedly reduced PFS in patients, in
contrast to those exhibiting lower levels of SLC30A2 expression
(p
 Fig. 1.
Differential expression of SLC30A2 in gastric cancer (GC) and its
prognostic analysis. (A,B) Volcano plot depicting the distribution of differentially expressed genes (DEGs) in
the GSE54129 dataset and TCGA-STAD samples. The x-axis (Log2 Fold Change)
represents the log2 fold change in gene expression between tumor and normal
samples. The y-axis (–log10 p-value) indicates the statistical
significance of differential expression. Up-regulated DEGs are depicted in red,
and down-regulated DEGs are depicted in blue. (C,D) Box plot showing the
differential expression of SLC30A2 between tumor and normal samples in
the GSE54129 dataset and TCGA-STAD samples. (E) Kaplan-Meier (KM) curve demonstrating the
association between SLC30A2 expression levels and Progression-free Survival (PFS) in GC patients.
The abscissa represents time in months, and the ordinate is PFS probability.
TCGA, The Cancer Genome Atlas; STAD, stomach adenocarcinoma. ***p
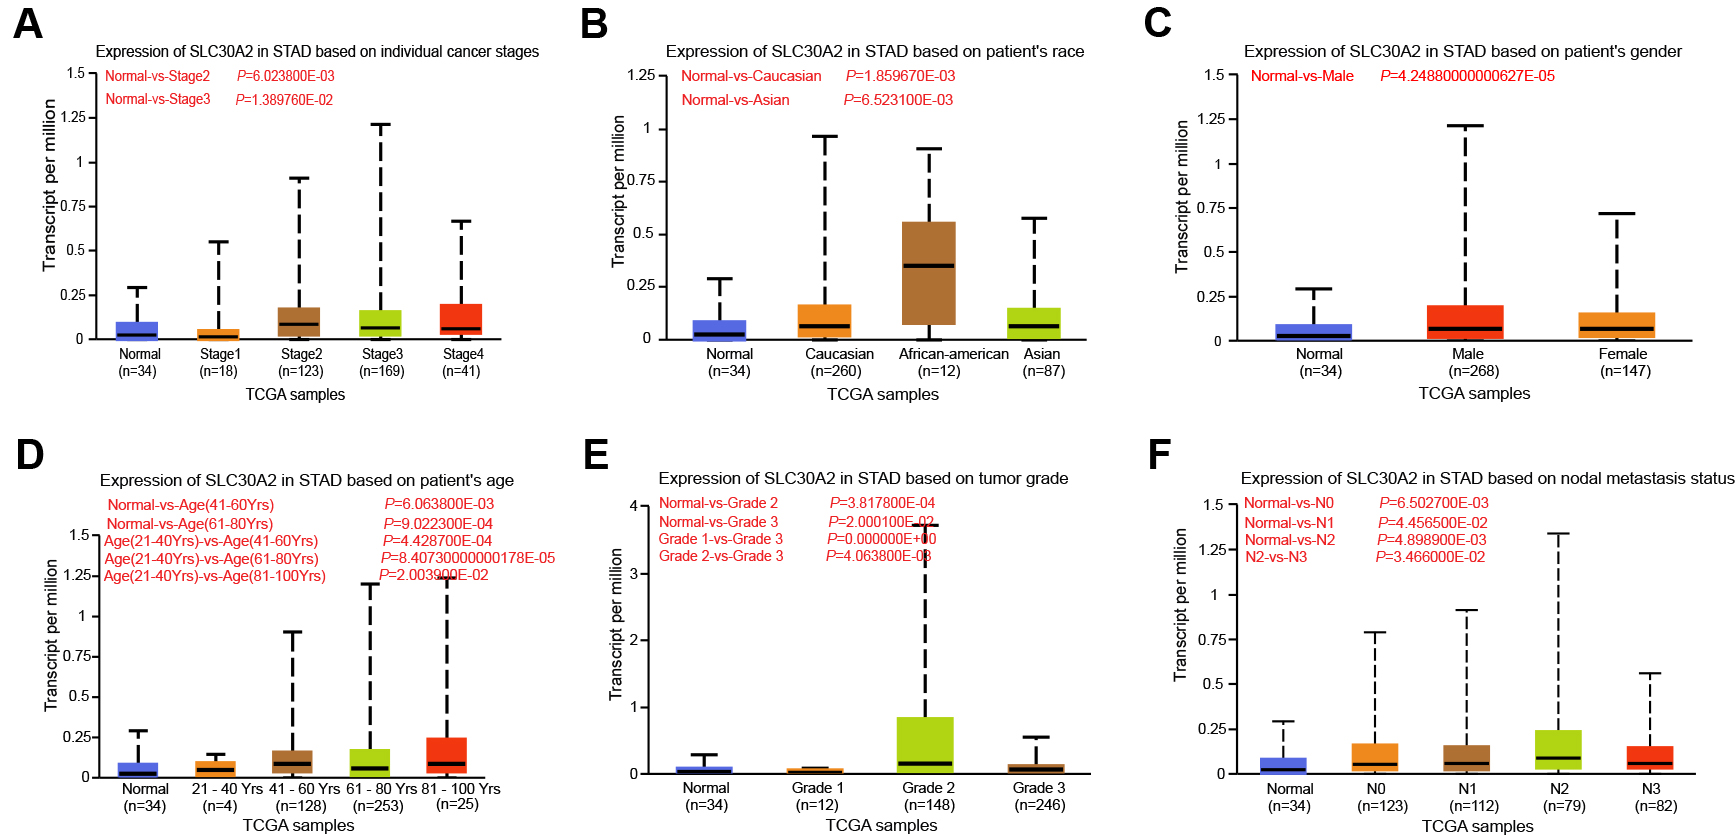
In the TCGA-STAD dataset, we examined the relationship between SLC30A2 expression levels and different clinical-pathological factors using the UALCAN database. Our analysis indicated that SLC30A2 expression levels were not associated with the stage of cancer (Fig. 2A), patient race (Fig. 2B), or gender (Fig. 2C). However, a significant variation in SLC30A2 expression was observed across age groups, with the most pronounced differences being between the groups of 21–40 years and those of 41–60 years, 81–100 years, and 61–80 years (Fig. 2D). Furthermore, a clear differential expression of SLC30A2 was noted when comparing tumor grades, with substantial variations between Grade 2 and Grade 3 tumors as well as between Grade 1 and Grade 3 tumors found (Fig. 2E). Regarding nodal metastasis status, there was a noteworthy difference in SLC30A2 expression between cases classified as N2 and N3 (Fig. 2F).
 Fig. 2.
Expression analysis of SLC30A2 in UALCAN database. (A–F) Box plot illustrating the association between SLC30A2 expression levels and individual cancer stages (A), patient’s race (B), patient’s gender (C), patient’s age (D), tumor grades (E), and nodal metastasis statuses (F) in TCGA-STAD samples. TCGA, The Cancer Genome Atlas; STAD, stomach adenocarcinoma; UALCAN, the University of Alabama at Birmingham Cancer data analysis portal.
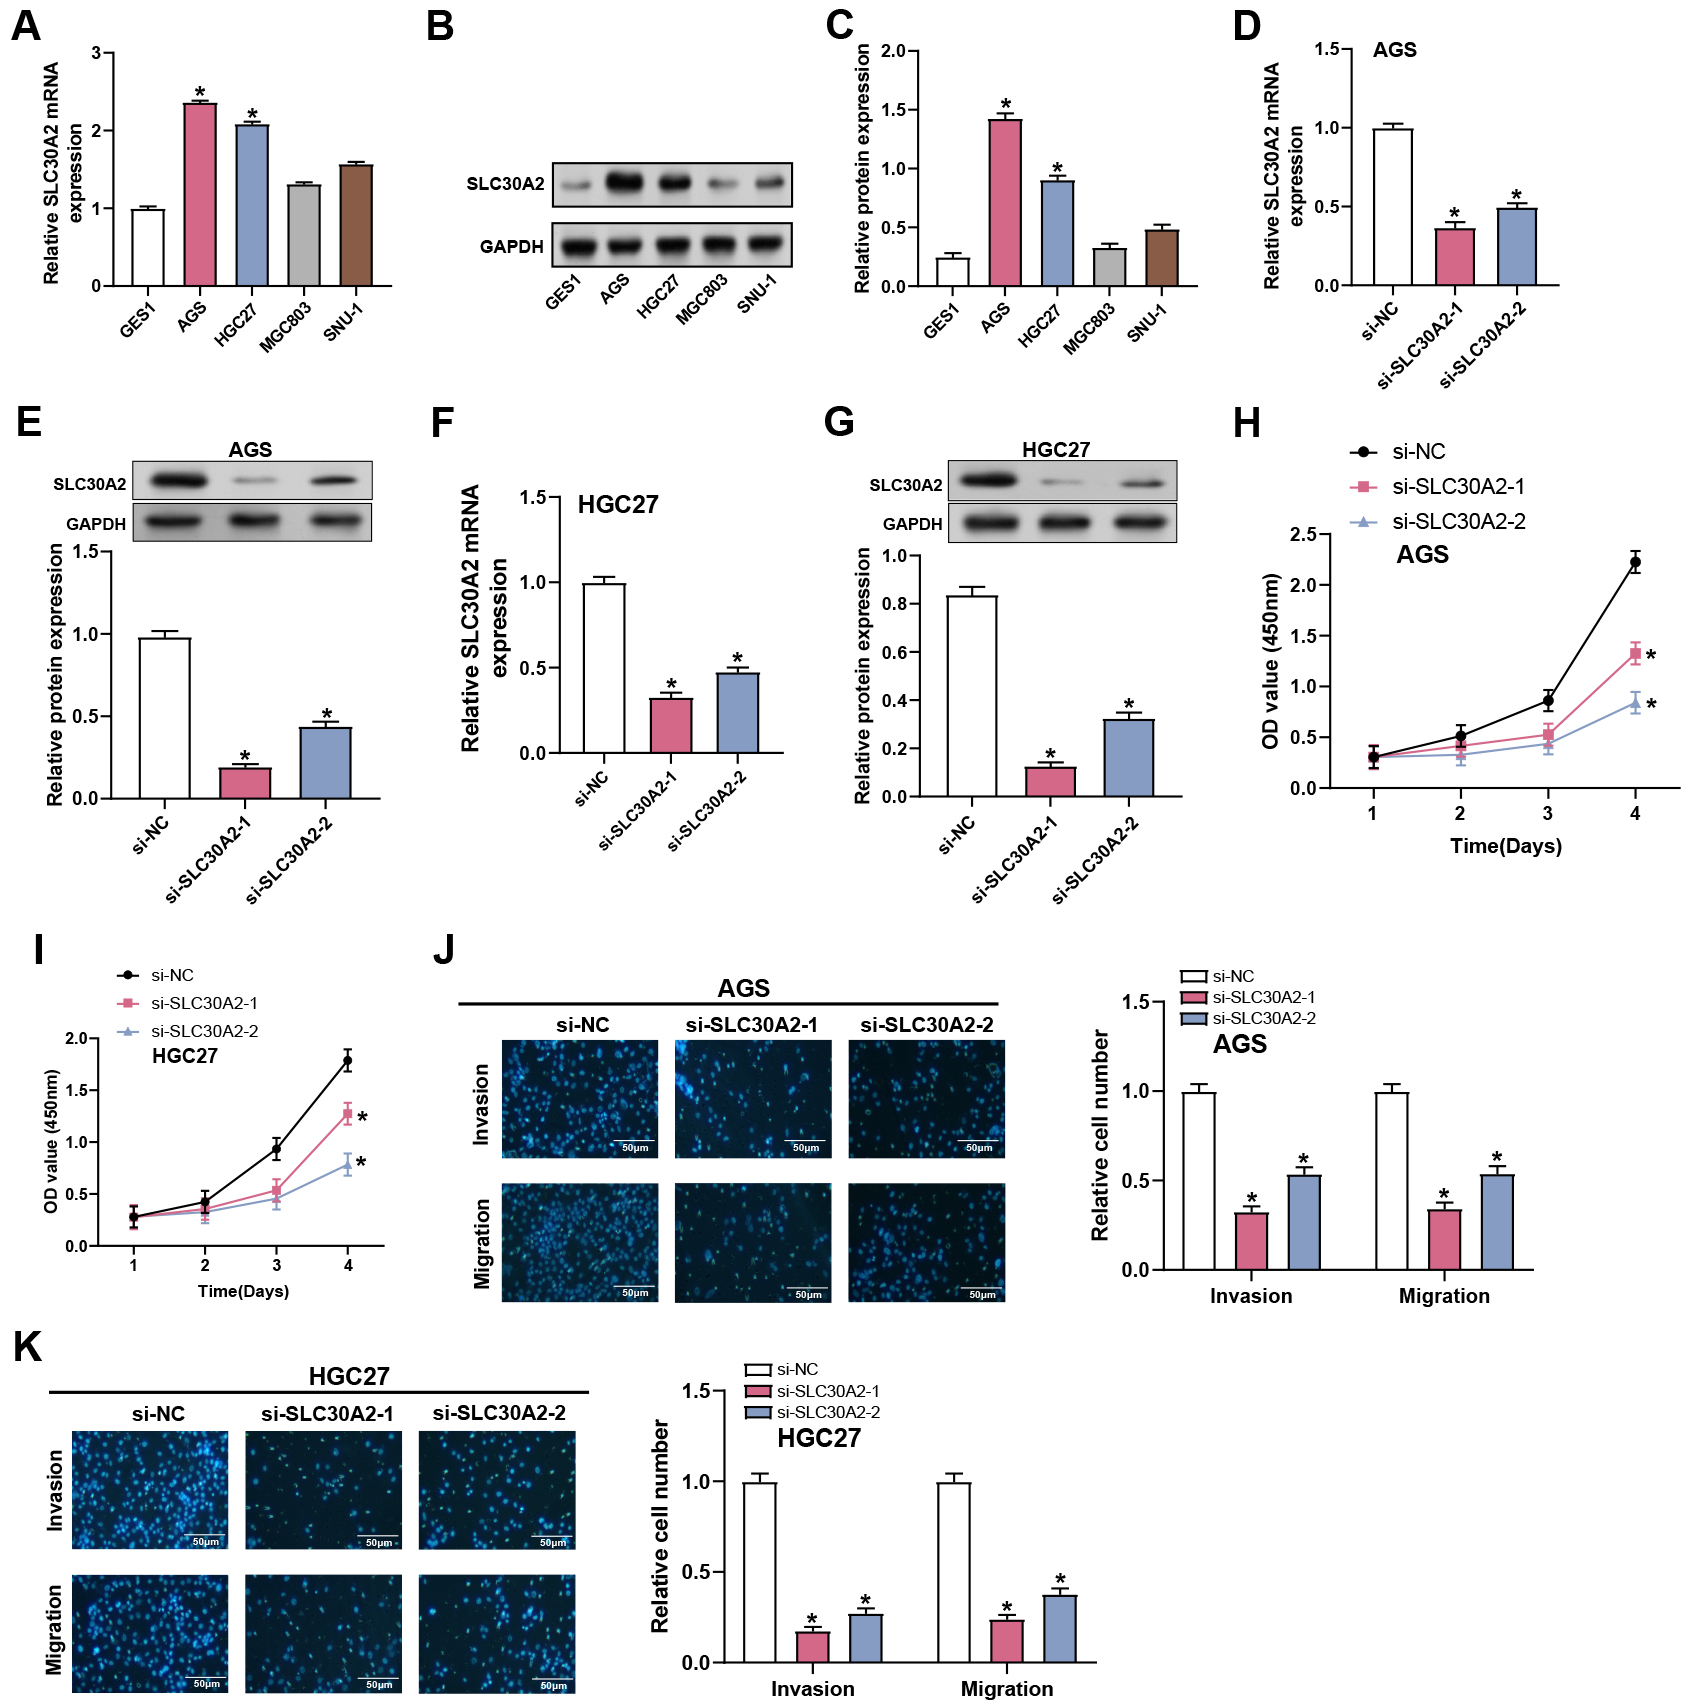
We examined the level of SLC30A2 in GC cell lines (AGS, HGC27, MGC803, and SNU-1) and normal gastric mucosal cells (GES1). The findings demonstrated that SLC30A2 was substantially expressed in all GC cell lines compared to normal tissues, with significant upregulation observed particularly in the AGS and HGC27 cell lines (Fig. 3A–C). Therefore, these two cell lines were selected for further exploration of the functional significance of SLC30A2 in GC. Subsequently, we evaluated the transfection efficiency of SLC30A2 knockdown plasmids in AGS and HGC27 cells employing WB and qRT-PCR (Fig. 3D–G). The invasion, migration, and proliferation abilities of AGS and HGC27 cells following SLC30A2 knockdown were assessed using CCK-8 and Transwell assays (Fig. 3H–K). In comparison to the control group, the outcomes demonstrated that SLC30A2 knockdown suppressed the growth, invasion, and migration of AGS and HGC27 cells.
 Fig. 3.
Effects of SLC30A2 knockdown on GC proliferation,
invasion and migration. (A–C) qRT-PCR and WB analysis depicting the mRNA and
protein expression levels of SLC30A2 in normal gastric mucosal cells
(GES1) and GC cell lines (AGS, HGC27, MGC803, and SNU-1). (D–G) Assessment of
the transfection efficiency of SLC30A2 knockdown plasmids in AGS and
HGC27 cells using qRT-PCR and WB analysis. (H,I) CCK-8 results show the
proliferation abilities of AGS and HGC27 cells following SLC30A2
knockdown. (J,K) Evaluation of the invasion and migration abilities of AGS and
HGC27 cells following SLC30A2 knockdown using Transwell assays.
Representative images of the underside of the membrane stained with DAPI
illustrate the invasion and migration of cells (left). Quantification of cell
invasion and migration represented as a percentage of cell count (right).
Magnification: 200
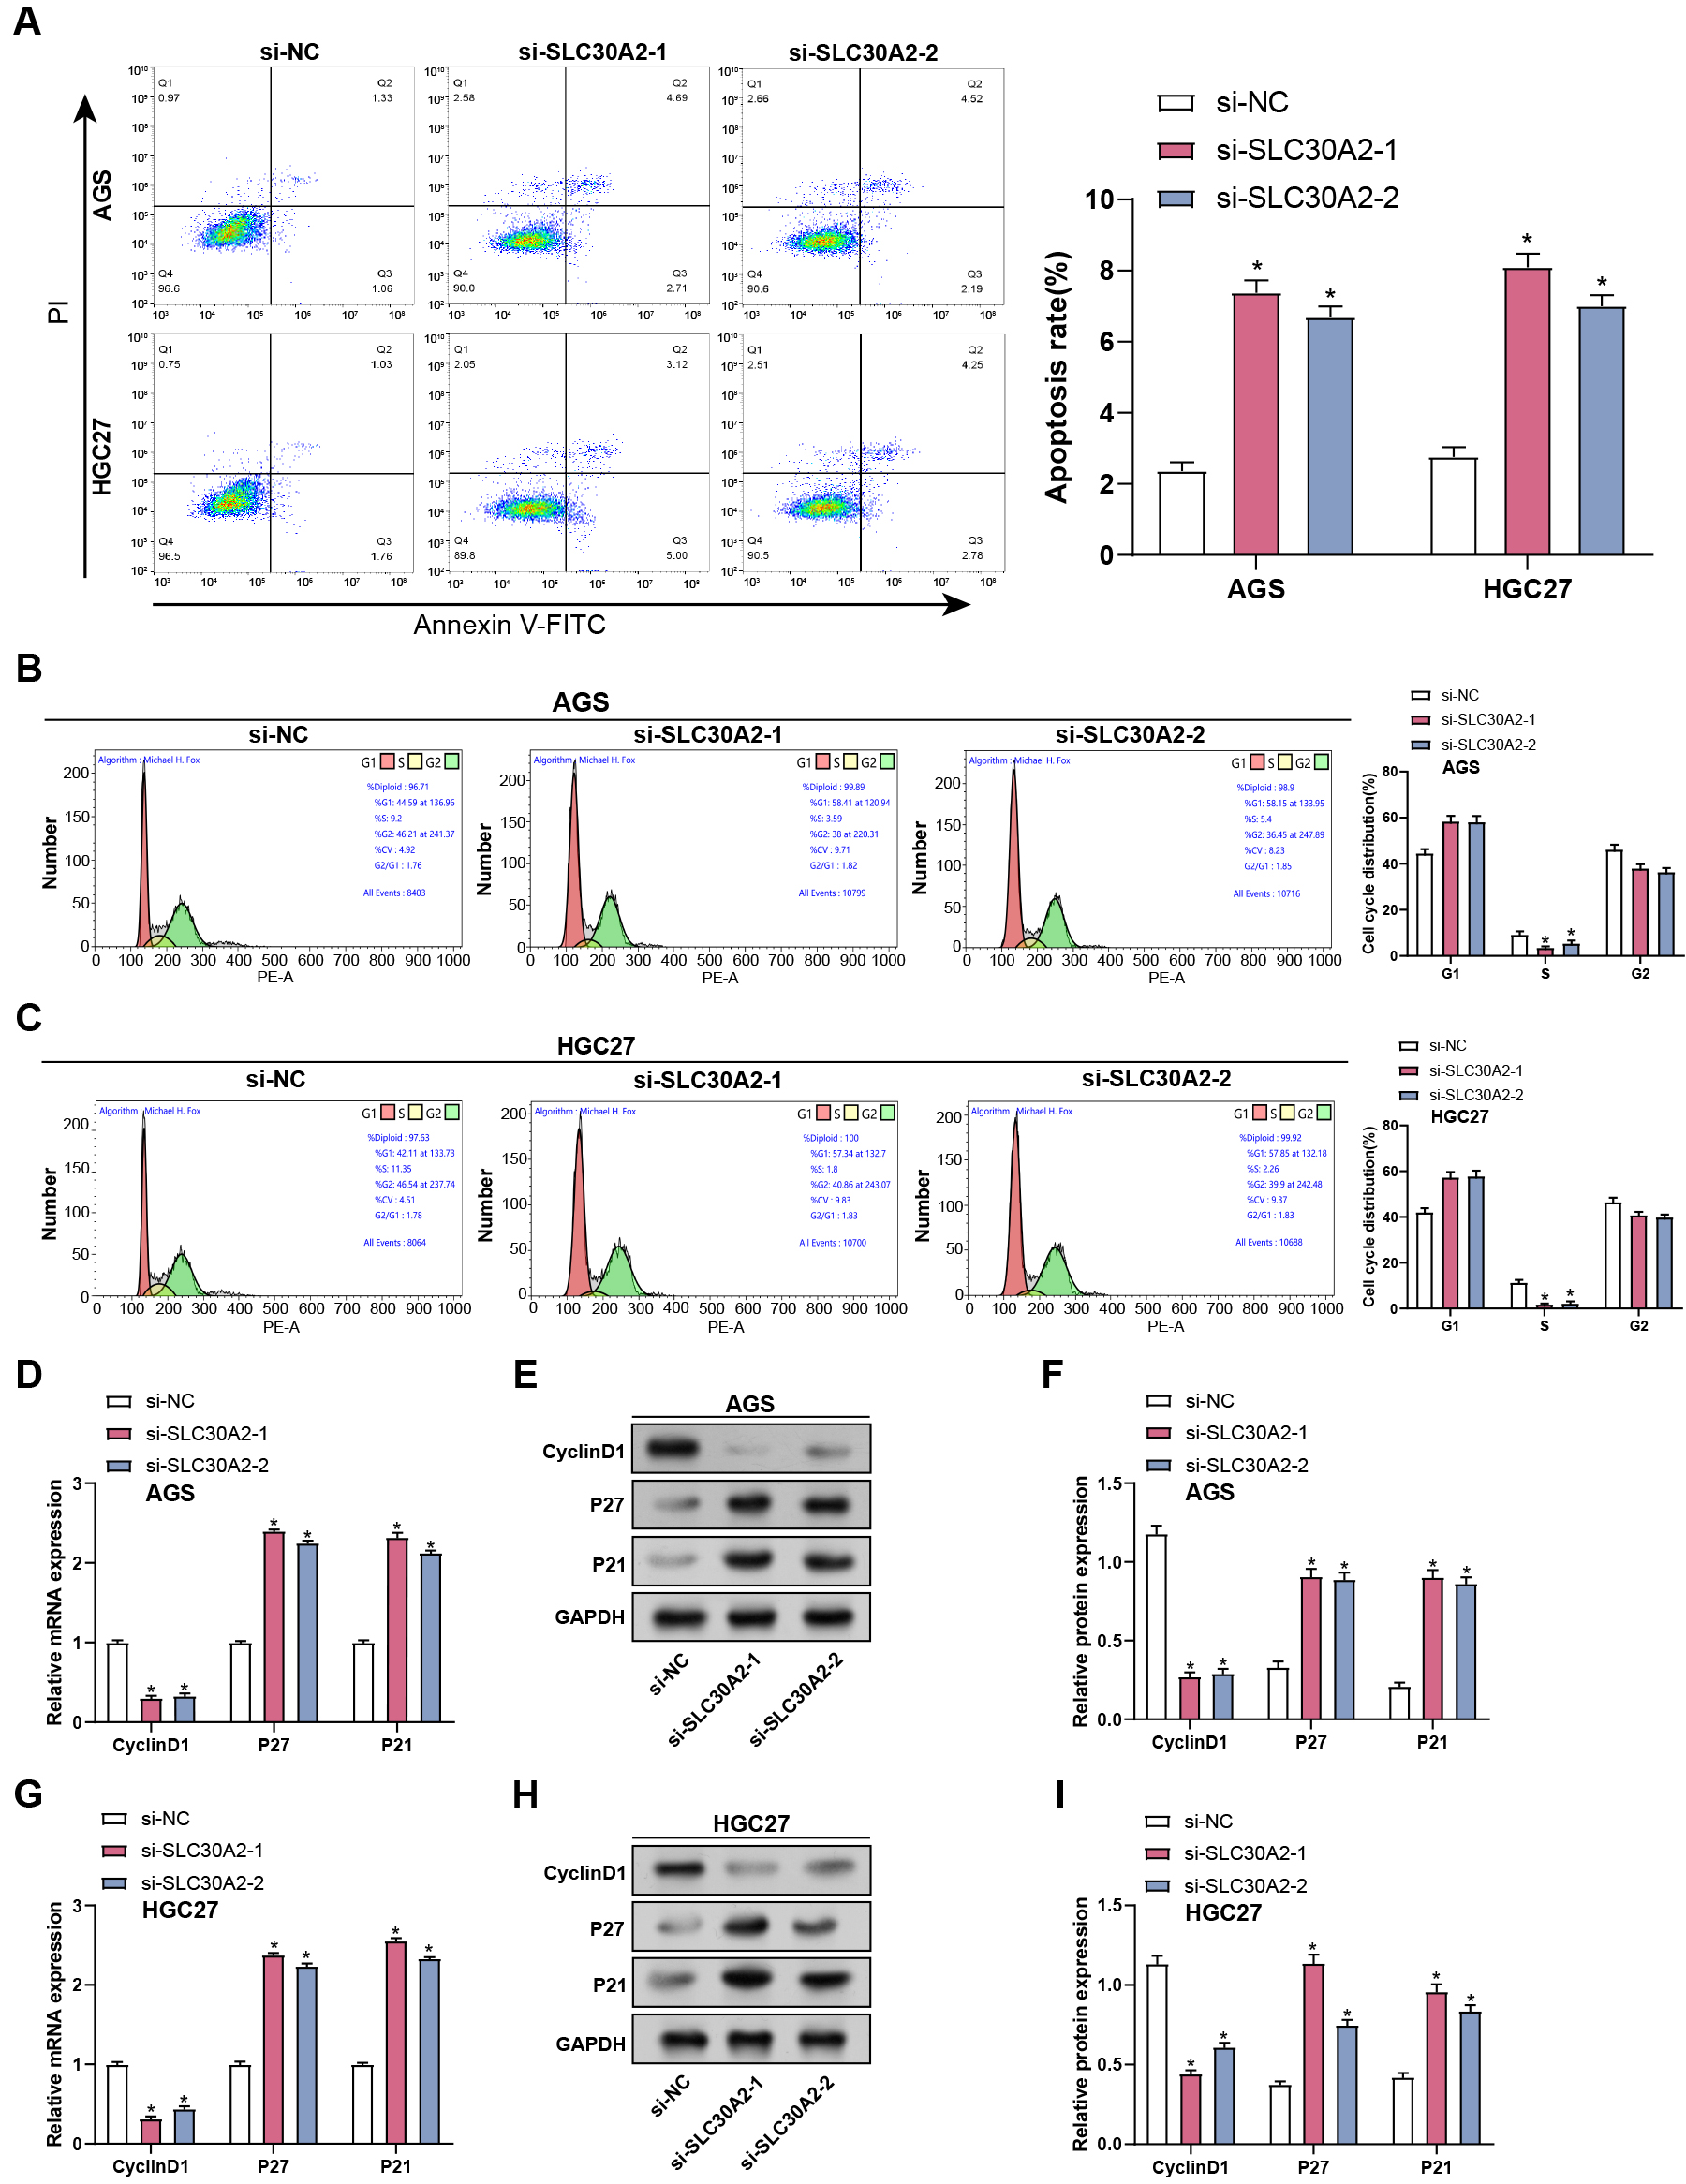
After SLC30A2 knockdown, flow cytometry analysis evaluated apoptosis and cell cycle distribution in AGS and HGC27 cells. Our findings showed that SLC30A2 knockdown enhanced apoptosis in AGS and HGC27 cells relative to the control group, along with a reduce in the proportion of cells in the S phase, indicating cell cycle arrest during the G1 to S transition (Fig. 4A–C). Subsequently, qRT-PCR and WB assays were conducted to evaluate the gene and levels of cell cycle proteins (Cyclin D1, P21, and P27) in AGS and HGC27 cells after SLC30A2 knockdown. Our findings revealed that SLC30A2 knockdown resulted in a decline in Cyclin D1 expression and increased P27 and P21 expression in contrast to the control group (Fig. 4D–I). Those findings indicated that in vitro cell cycle arrest and apoptosis are enhanced by SLC30A2 knockdown.
 Fig. 4.
Impact of SLC30A2 knockdown on apoptosis and cell cycle
progression in GC cells. (A–C) Flow cytometry analysis illustrating the effects
of SLC30A2 knockdown on apoptosis and cell cycle distribution in AGS and
HGC27 cells. (D–I) qRT-PCR and WB analysis of the mRNA and protein expression
levels of cell cycle proteins (Cyclin D1, P27, and P21) in AGS and HGC27 cells
following SLC30A2 knockdown. qRT-PCR, Quantitative real-time polymerase
chain reaction; WB, Western blotting; mRNA, messenger RNA. *p
The CCK-8 test was showed that at a concentration of 150 µM, ZnSO4 considerably decreased the viability of AGS and HGC27 cells (Fig. 5A,B). To further investigate the impact of zinc on oxidative stress in GC cells, the level of MDA, GSH, and TOS were evaluated utilizing respective assay kits in AGS and HGC27 cells subjected to 50 and 150 µM concentrations of ZnSO4. The findings indicated that in contrast to the group under control, MDA and TOS levels exhibited concentration-dependent increases, while GSH levels showed concentration-dependent decreases in response to ZnSO4 treatment (Fig. 5C–H). These results suggested that ZnSO4 exerts cytotoxic effects and induces oxidative stress in GC cells, underscoring its potential impact on the cellular redox state and viability.
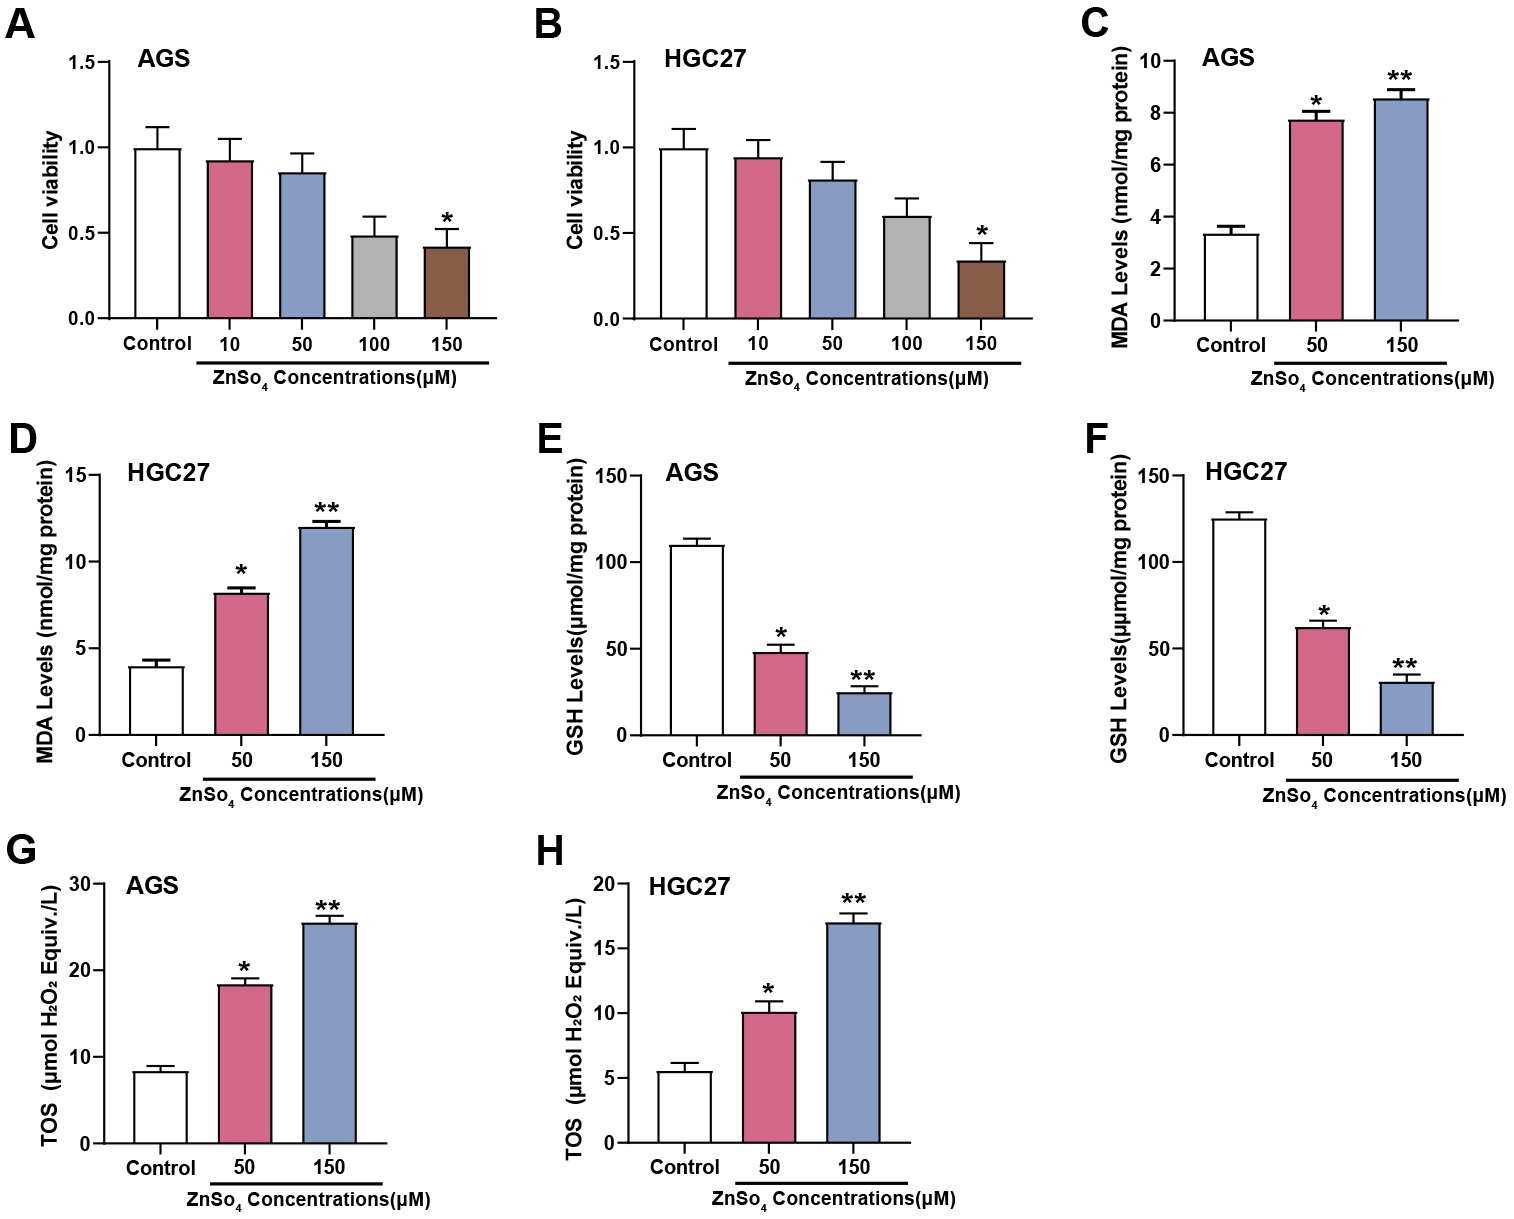 Fig. 5.
Effects of ZnSO4 on cytotoxicity and oxidative stress in GC
cells. (A,B) The viability of AGS and HGC27 cells treated with different
concentrations of ZnSO4 (0, 10, 50, 100, 150 µM) was assessed using
the CCK-8 assay. The Y-axis represents cell viability, and the X-axis represents
different concentrations of ZnSO4 treatment conditions. (C–H) Measurement
of MDA, GSH, and TOS levels in AGS and HGC27 cells treated with 50 and 150
µM concentrations of ZnSO4 using respective assay kits; CCK-8, cell
counting kit-8; MDA, malondialdehyde; GSH, glutathione; TOS, total oxidant
status; ZnSO4, zinc sulfate. *p
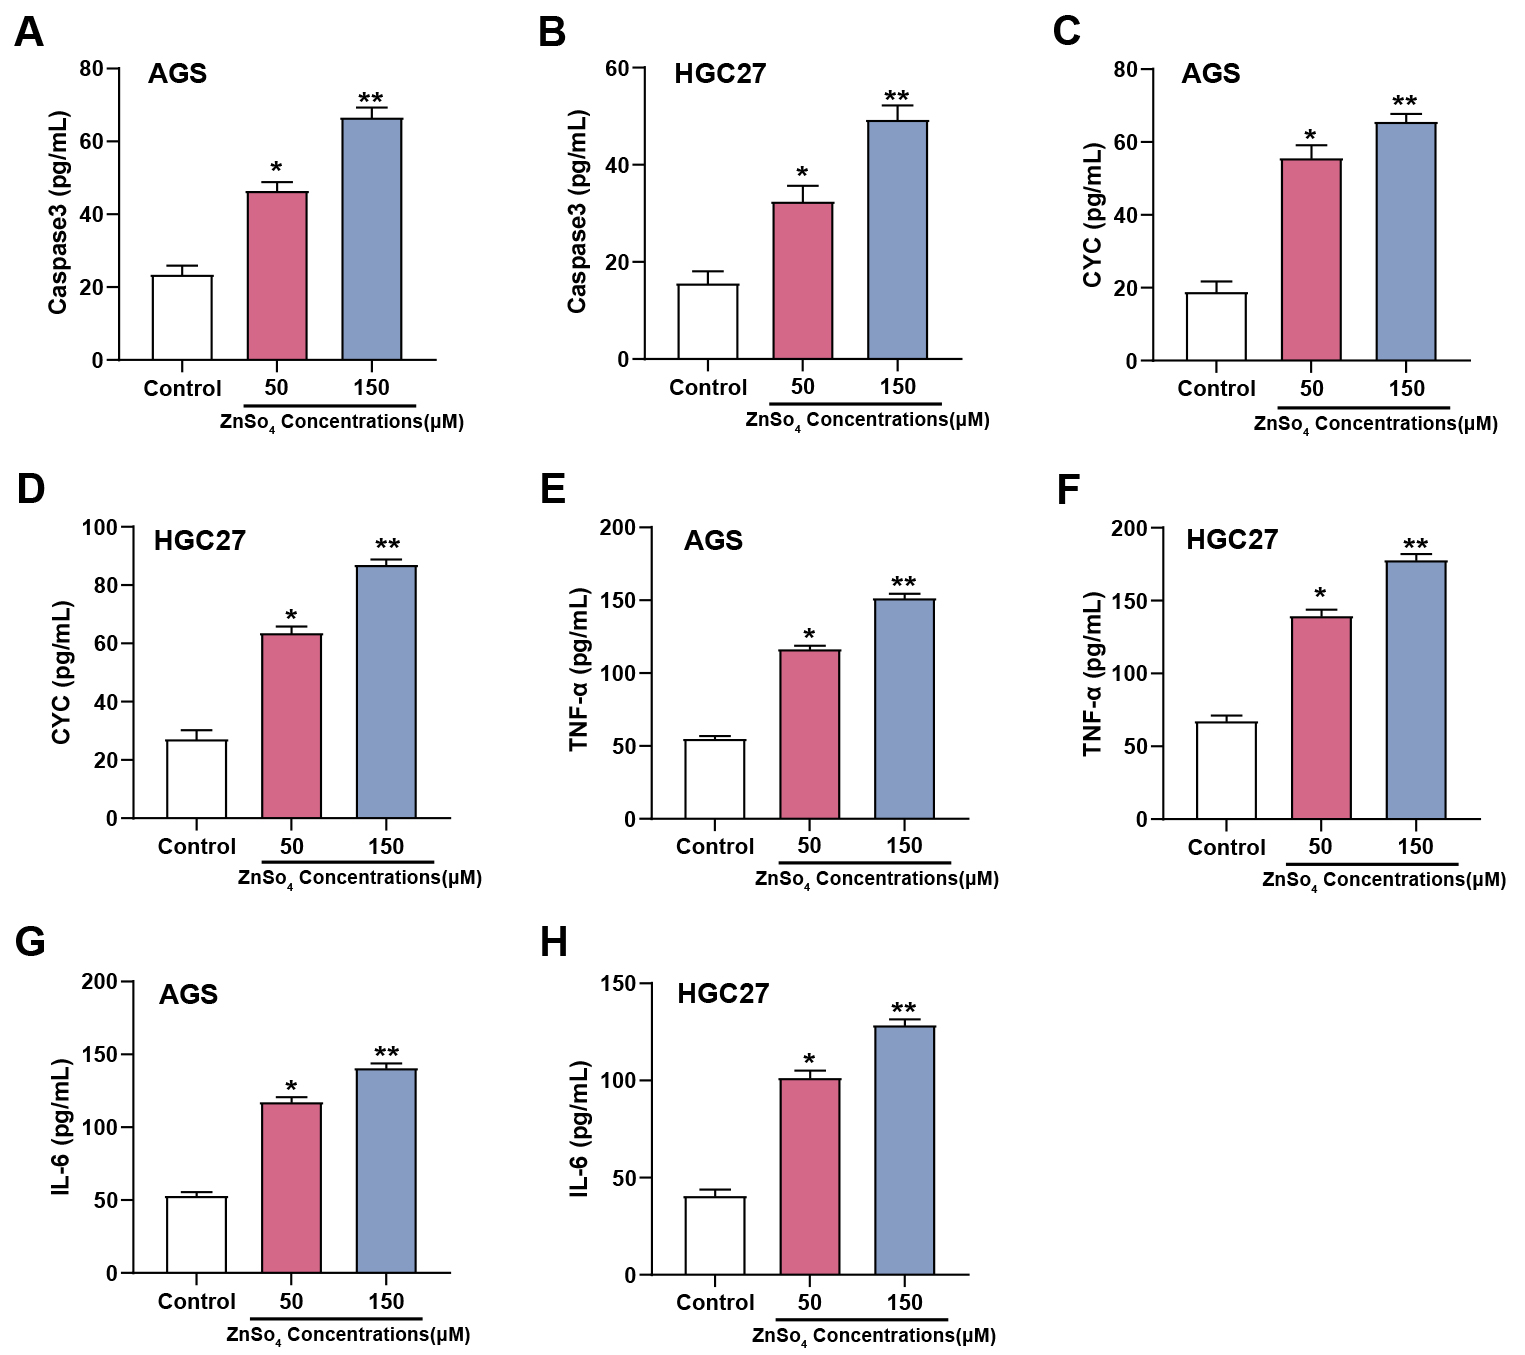
ELISA analysis results showed that exposure to ZnSO4 significantly affected
apoptosis and inflammatory biomarkers in AGS and HGC27 cell lines. After
treatment with different concentrations of ZnSO4 (50, 150 µM), a
dose-dependent rise in the levels of Caspase-3 was observed in AGS (Fig. 6A) and
HGC27 cells (Fig. 6B), indicating enhanced apoptotic activity. Similarly, CYC
levels in AGS (Fig. 6C) and HGC27 cells (Fig. 6D) also increased with increasing
ZnSO4 concentration, further confirming the induction of apoptosis. In
addition to these apoptotic markers, proinflammatory cytokines were also
assessed. In GC cells, compared to the control group, TNF-
 Fig. 6.
ZnSO4 modulates apoptotic and inflammatory markers in GC
cells. (A–H) Expression levels of apoptotic markers Caspase3 (A,B) and CYC
(C,D), as well as inflammatory cytokines Tumor necrosis factor (TNF)-
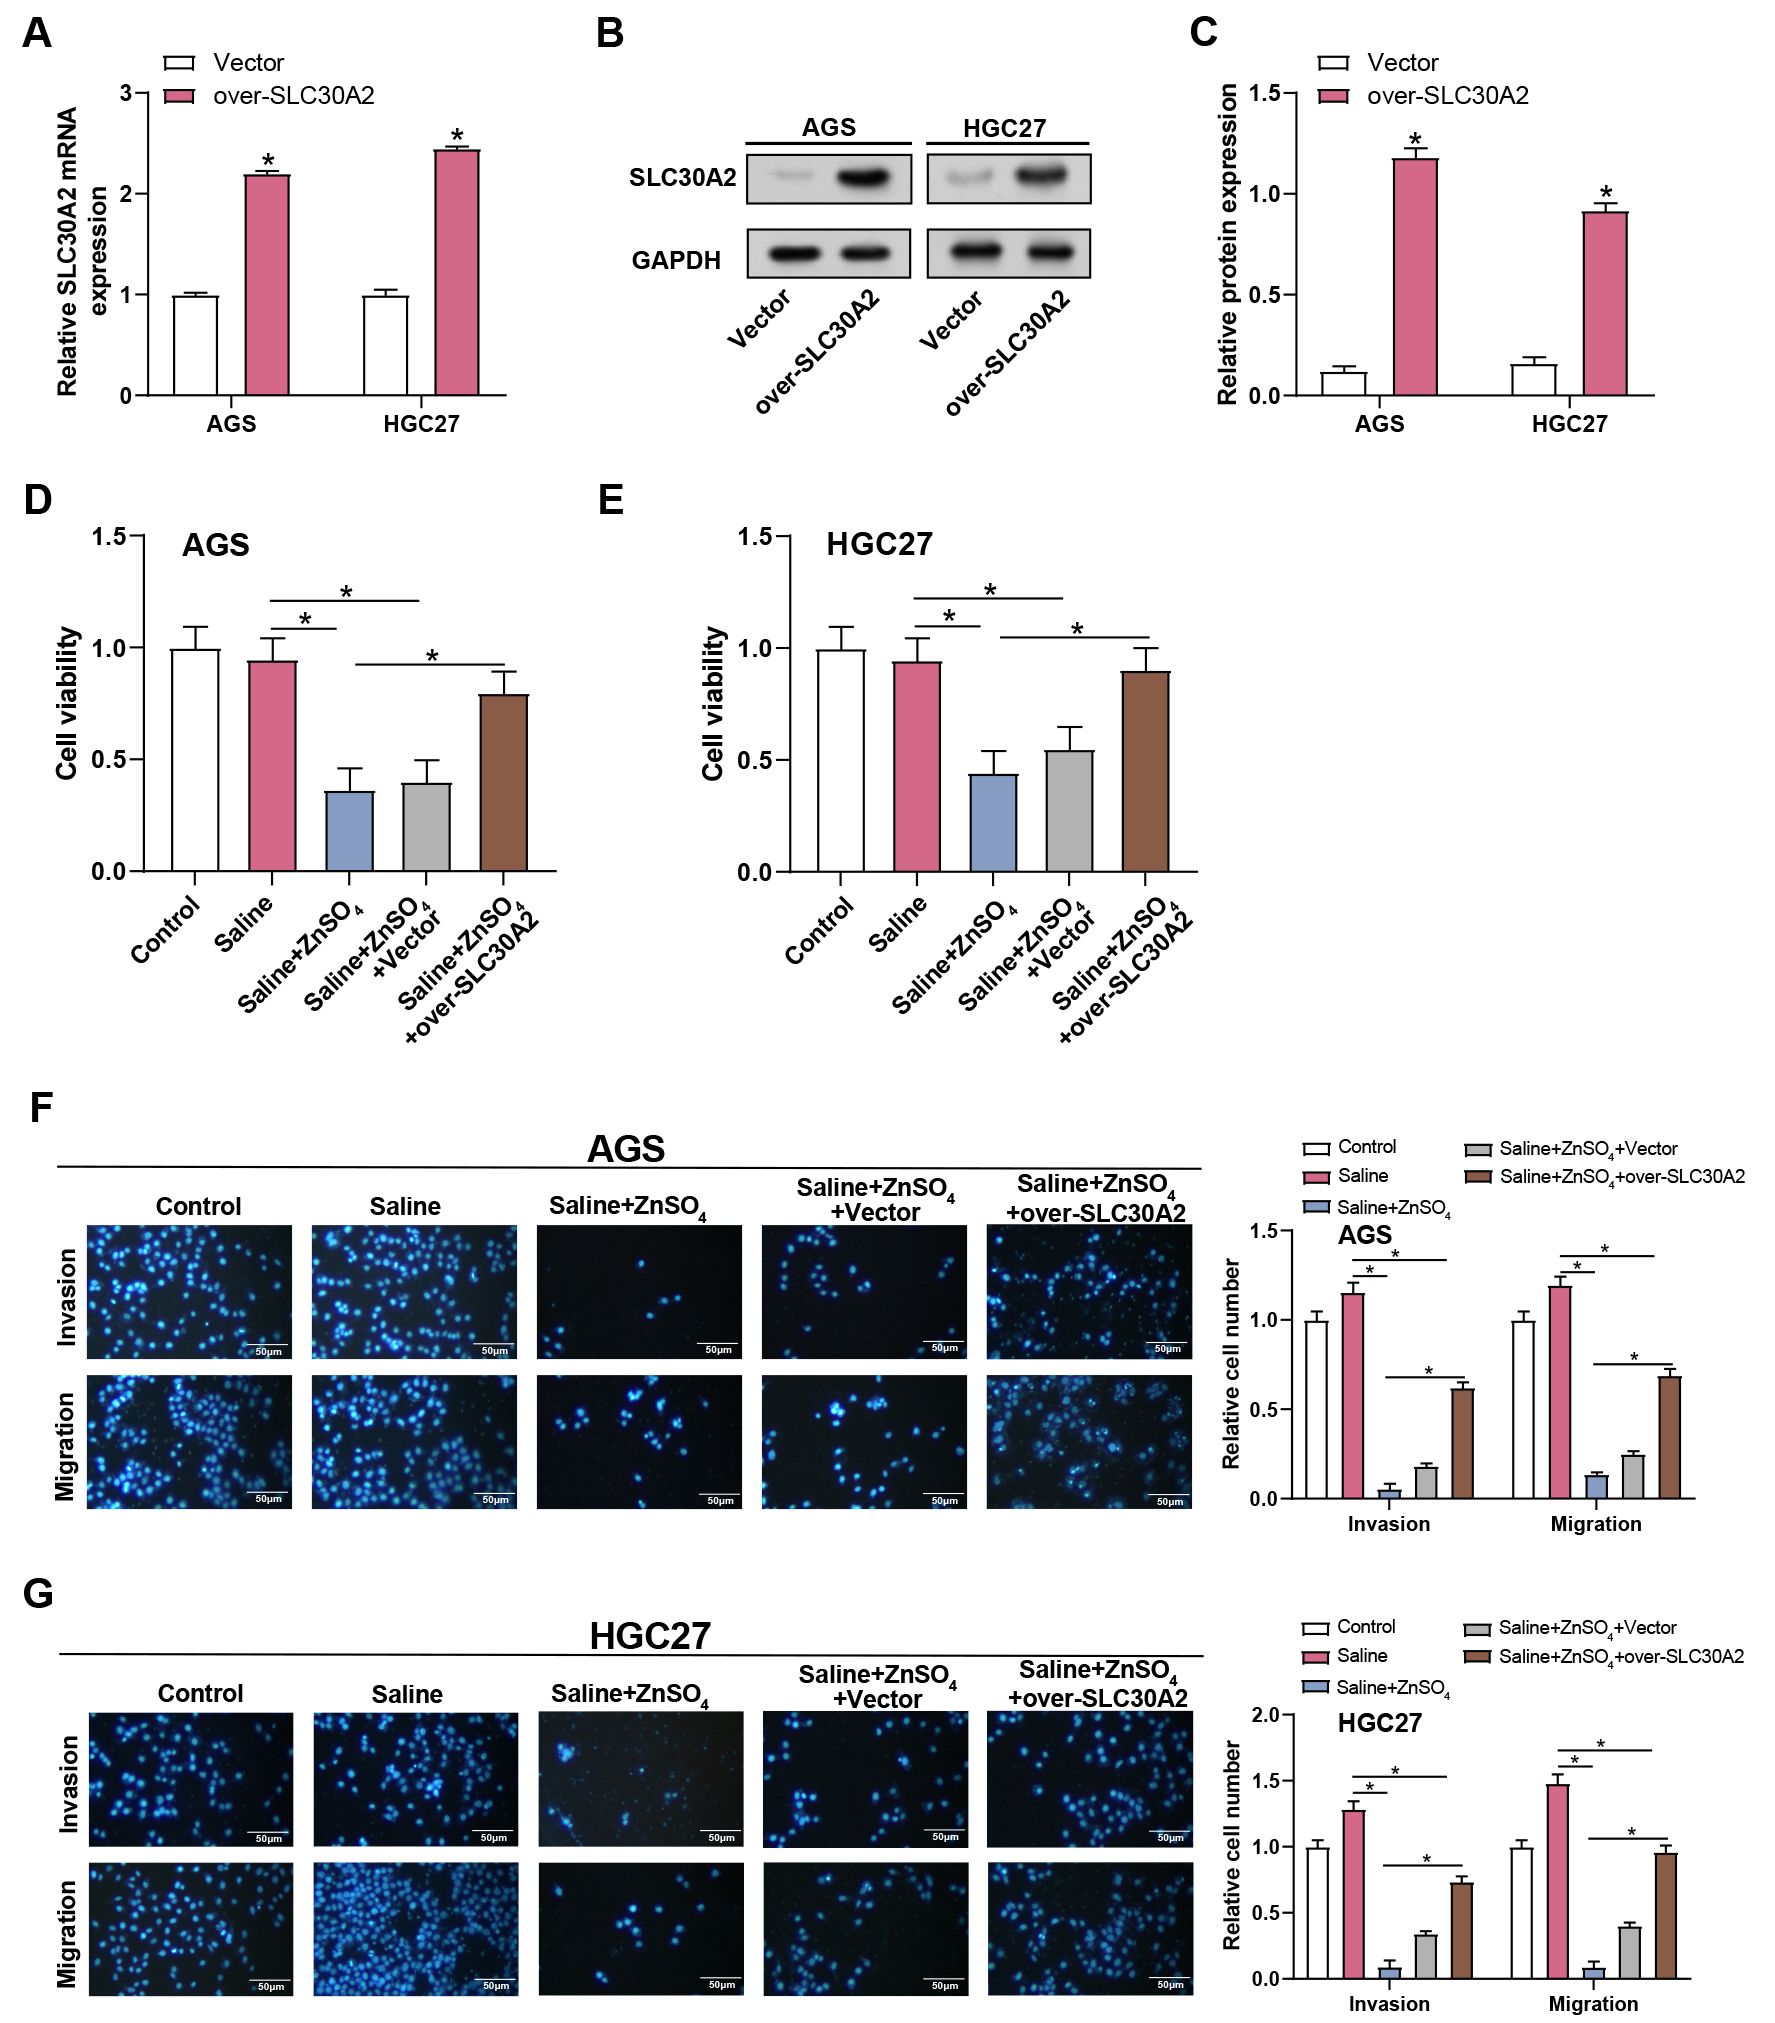
The assays of qRT-PCR and WB were employed to evaluate the effectiveness of SLC30A2 overexpression in AGS and HGC27 cells (Fig. 7A–C). Proliferation, invasion, and migration of AGS and HGC27 cells under five different treatment conditions (control, saline, saline + ZnSO4, saline + ZnSO4 + Vector, and saline + ZnSO4 + over-SLC30A2) were assessed using CCK-8 and Transwell assays (Fig. 7D–G). The control and saline groups did not significantly vary from one another, according to the results. Following the addition of ZnSO4 to the saline group, a reduction in cell proliferation, invasion, and migration was observed. However, this inhibitory effect was partially reversed when ZnSO4 and overexpression of SLC30A2 were combined in the saline medium. These results indicated that SLC30A2 is vital not only in mediating the cytotoxic response of ZnSO4 but also in encouraging the invasion and migration properties of GC cells.
 Fig. 7.
Overexpression of SLC30A2 rescues
ZnSO4-induced inhibition of proliferation, invasion, and migration
in GC cells. (A–C) The efficiency of SLC30A2 overexpression in AGS and
HGC27 cells was assessed by qRT-PCR and WB assays. (D–G) Proliferation,
invasion, and migration of AGS and HGC27 cells under different treatment
conditions (control, saline, saline + ZnSO4, saline + ZnSO4 + Vector,
and saline + ZnSO4 + over-SLC30A2) evaluated by CCK-8 (D,E) along
with Transwell assays (F,G). Representative images of the underside of the
membrane stained with DAPI illustrate the invasion and migration of cells (left).
Quantification of cell invasion and migration represented as a percentage of cell
count (right). Magnification: 200
To further elucidate the impacts of ZnSO4 treatment and SLC30A2
overexpression on GC cell apoptosis and the Wnt/
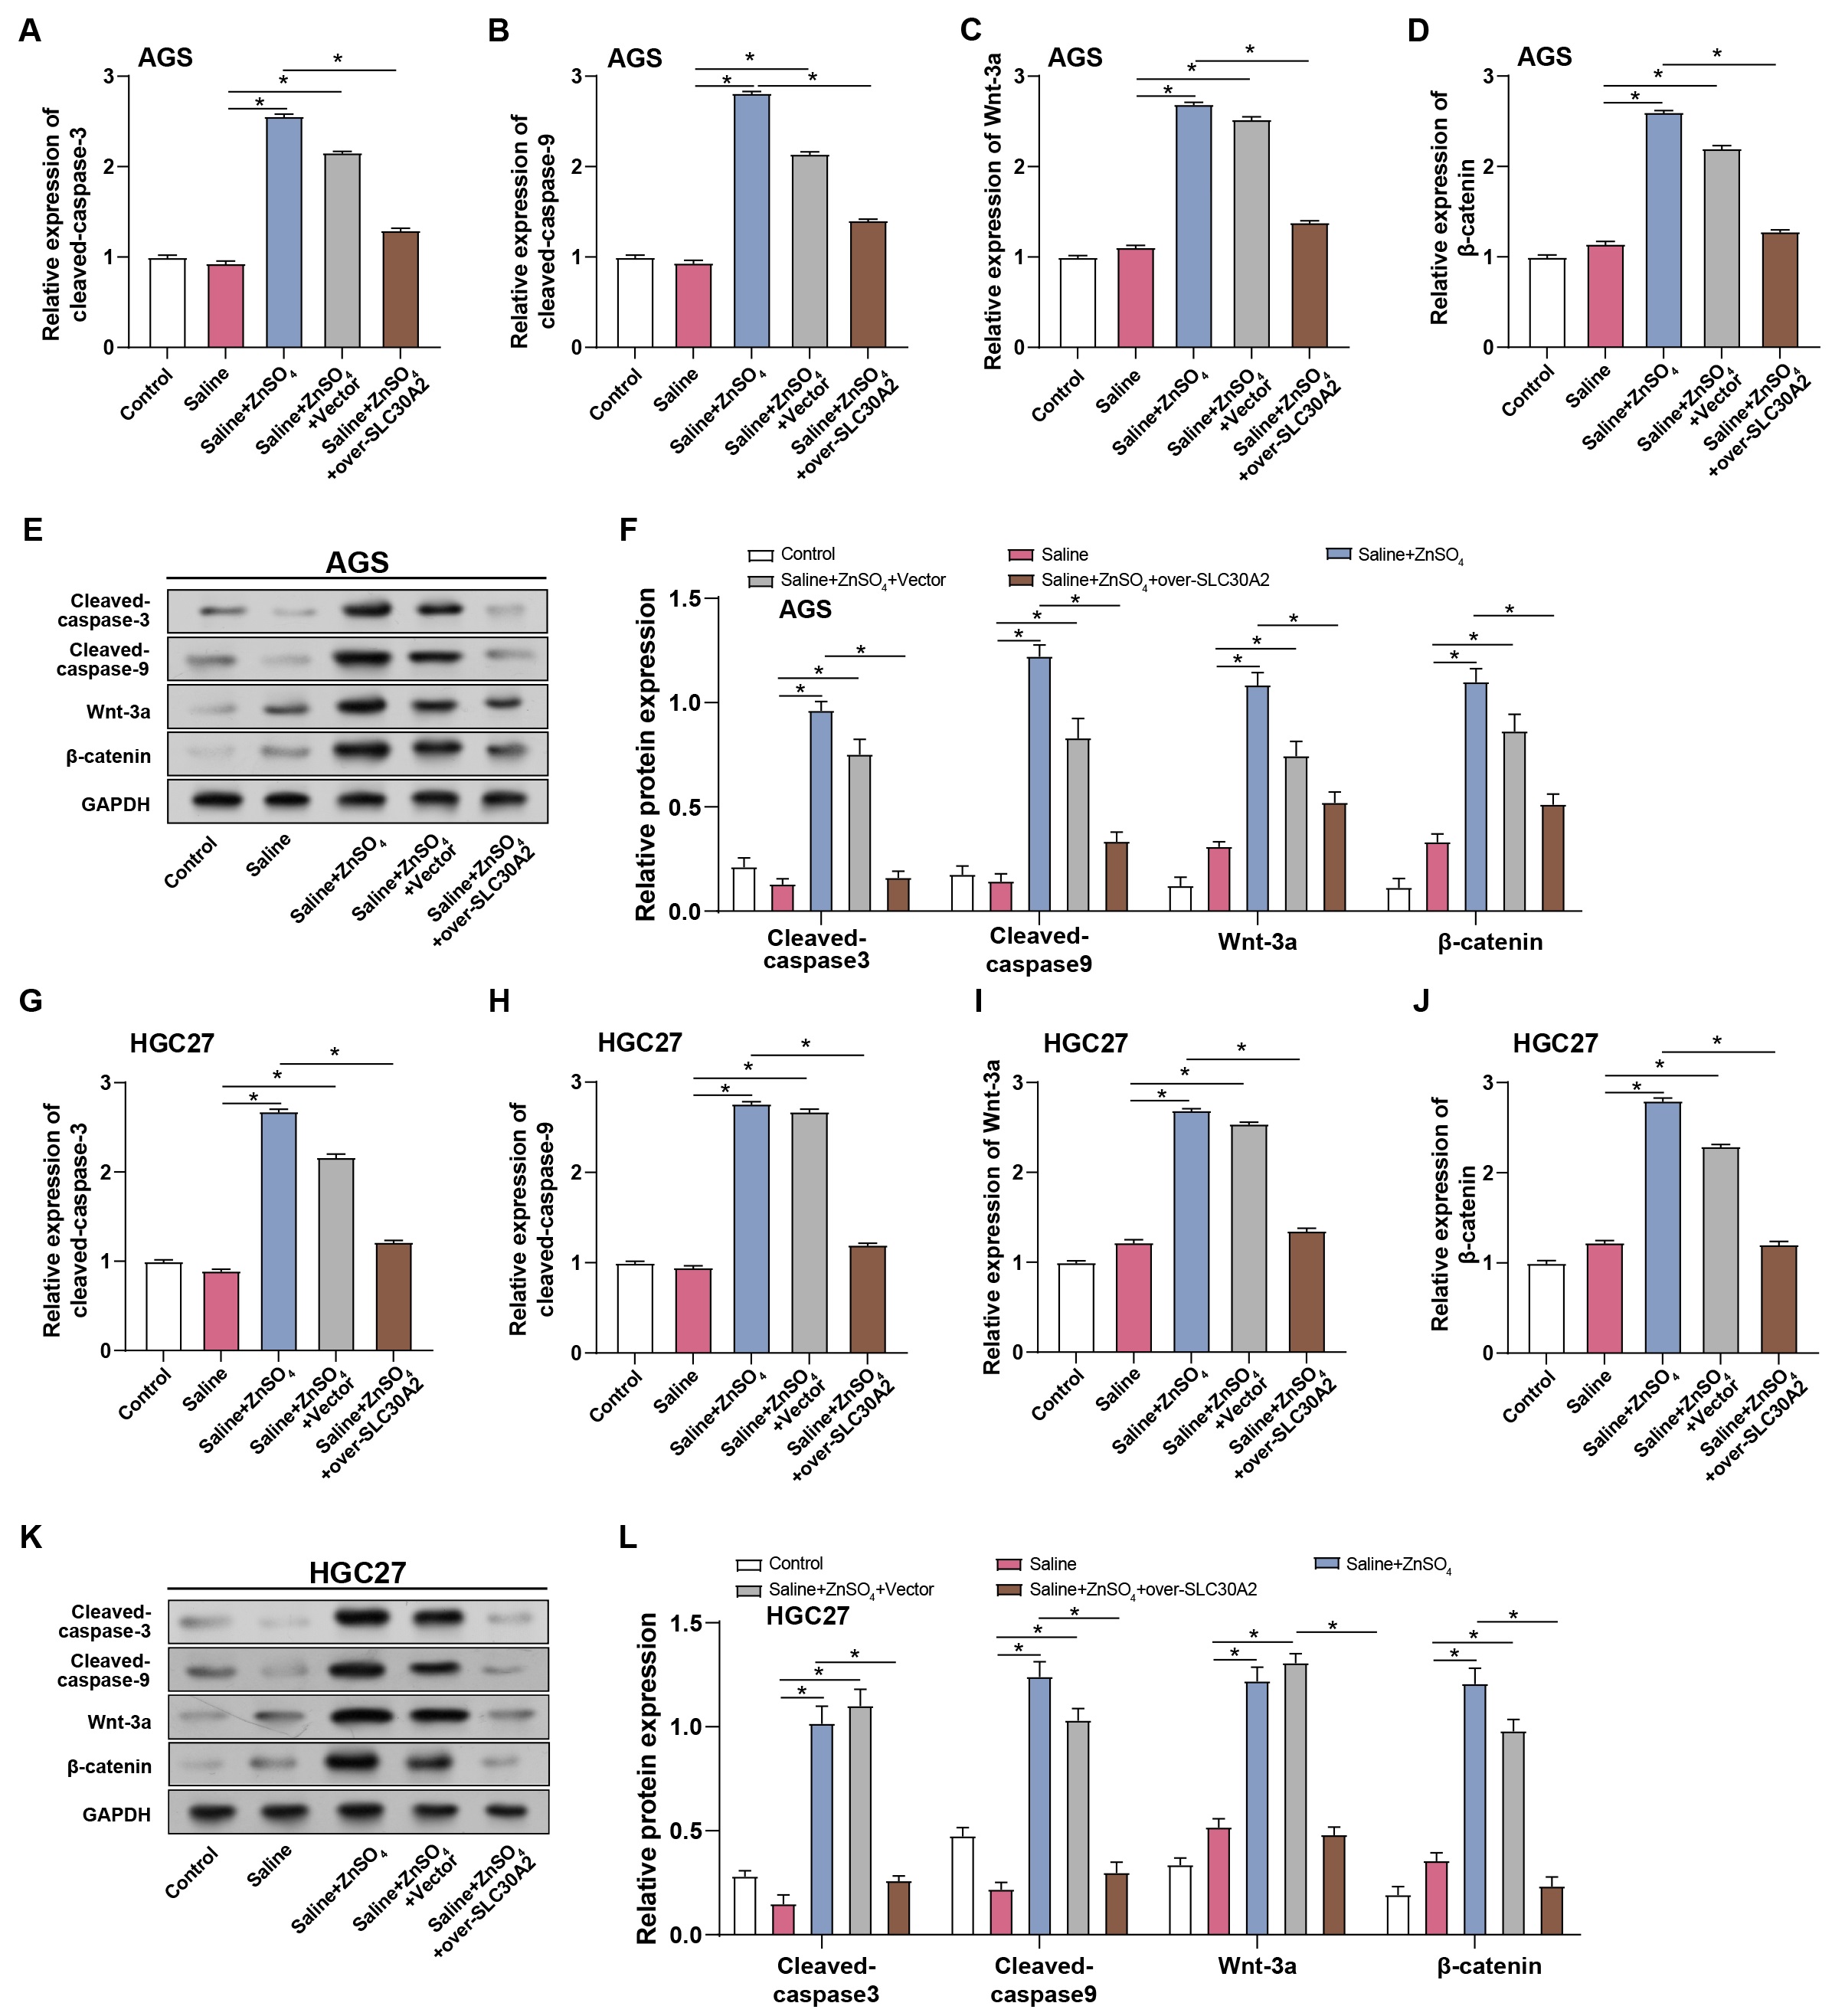 Fig. 8.
Regulation of GC cell apoptosis and Wnt/
GC remains a significant clinical problem, necessitating extensive molecular study and the development of novel treatment routes [18]. Zinc metabolism and homeostasis have emerged as important variables in the pathophysiology of GC [19]. Studies investigating the complicated link between dysregulated zinc homeostasis and carcinogenesis have underlined the importance of oxidative stress [20, 21]. Qi J et al. [22] proposed that MCOLN1/TRPML1 regulates autophagy in various cancers by mediating lysosomal zinc release into the cytoplasm. Zinc influx triggered by MCOLN1 activation can block the autophagy pathway, impacting cell survival and death. Consequently, zinc plays a crucial role in the regulation of autophagy mediated by MCOLN1. Additionally, Zhu M et al. [23] observed that the overexpression of zinc finger protein 64 (ZFP64) in GC is associated with invasive phenotypes and resistance to nanoparticle albumin-bound paclitaxel (nab-paclitaxel), serving as an independent prognostic factor for GC. These results affirmed the essential function of zinc homeostasis in the complex progression of GC.
The SLC30A2 gene encodes zinc transporter 2 (ZnT-2), which maintains the balance and homeostasis of intracellular zinc ions [24]. Disruption of intracellular zinc ion balance may affect immune function and diseases related to the nervous system [25, 26]. Additionally, it was observed that SLC30A2 levels were down-regulated in patients with GC who had bone metastasis, indicating that SLC30A2 plays a significant role in the bone metastasis of it [27]. Furthermore, Ren X et al. [28] demonstrated that overexpression of SLC39A10 enhances the malignant characteristics of GC cells by increasing the availability of zinc ions, further promoting the activity of casein kinase 2 (CK2), activating the MAPK/ERK and PI3K/AKT pathways, and driving the malignant progression of GC. Through bioinformatic analysis of GC samples, we observed a significant increase in SLC30A2 expression in GC, correlating with disease recurrence, progression, patient age, lymph node metastasis, and tumor grade. Knockdown experiments demonstrated that reducing SLC30A2 levels hindered GC cell growth, migration, and invasion, arrested the cell cycle, and promoted apoptosis. These findings highlighted SLC30A2 as a potential therapeutic target.
Zinc is an essential trace element for human health, necessary for cellular
growth and tissue repair [29, 30]. Recent evidence has shown a correlation
between serum zinc levels and GC localization, with a significant deficiency
observed in postoperative GC patients [31]. This deficiency is closely associated
with reduced serum albumin levels, indicating that elevated serum zinc may act as
a protective factor against GC risk. The importance of zinc in oncology is
further underscored by the therapeutic use of ZnSO4 to create a high-zinc
ion environment in various cancer cells, including those of prostate cancer and
osteosarcoma [32, 33]. The interplay between oxidative stress and cancer
progression is underscored by findings from Jelić MD et al. [34],
revealing lower antioxidant enzyme levels and higher
8-hydroxy-2′-deoxyguanosine (8-OHdG) and MDA concentrations across different
cancers. This correlation signifies oxidative stress as a pivotal factor in
oncogenesis. Specifically, Wang S et al. [35] demonstrated that
PRDX2 knockdown amplifies oxidative stress in response to Helicobacter
pylori infection and increases GC cell sensitivity to cisplatin, illustrating the
impact of oxidative mechanisms in GC pathophysiology. Lin JX et al. [36]
further investigated systemic inflammatory responses (SIR) in GC patients,
finding that postoperative lymphocyte-monocyte ratio (LMR) can predict long-term
survival, thereby linking inflammation with GC outcomes. Inflammation, a driving
force behind the tumor microenvironment (TME) and GC occurrence, suggests
targeting TME components as a viable strategy for GC management. The contribution
of inflammation to the TME and its role in GC onset was highlighted by Rihawi K
et al. [37], pointing to the tumor-promoting effects of inflammatory
processes. Our experiments investigated the effects of ZnSO4 treatment on
oxidative stress markers (MDA, TOS, and GSH) in GC cells, revealing an increase
in MDA and TOS levels and a decrease in GSH levels, indicating induction of
oxidative stress. Additionally, ZnSO4 treatment led to a significant
reduction in GC cell viability, accompanied by elevated levels of
apoptosis-related proteins (Caspase-3 and CYC) and inflammatory markers
(TNF-
Additionally, the Wnt/
In summary, our study demonstrated that SLC30A2 was significantly
upregulated in GC, correlating with poor prognosis. Knockdown of SLC30A2
inhibited GC cell invasion, migration, and proliferation, while promoting
apoptosis and cell cycle arrest. Additionally, zinc treatment induces
cytotoxicity, oxidative stress, apoptosis, and inflammatory responses in GC
cells, with the Wnt/
The datasets used and/or analyzed during the current study are available from the corresponding author upon reasonable request. The gene expression data utilized in this study originates from two publicly accessible databases: the Gene Expression Omnibus (GEO) dataset GSE54129, available at https://www.ncbi.nlm.nih.gov/gds/, and The Cancer Genome Atlas (TCGA) database’s stomach adenocarcinoma (STAD) dataset, accessible at https://tcga-data.nci.nih.gov/tcga/.
Conception and design of the research: FL, XHZ, and XXZ. Acquisition of data: FL, LF and XXZ. Analysis and interpretation of data: FL and XHZ. Statistical analysis: XHZ and FL. Drafting the manuscript: XXZ and LF. Revision of manuscript for important intellectual content: FL and LF. All authors contributed to editorial changes in the manuscript. All authors read and approved the final manuscript. All authors have participated sufficiently in the work and agreed to be accountable for all aspects of the work.
Not applicable.
Not applicable.
This research received no external funding.
The authors declare no conflict of interest.
Supplementary material associated with this article can be found, in the online version, at https://doi.org/10.31083/j.fbl2910351.
References
Publisher’s Note: IMR Press stays neutral with regard to jurisdictional claims in published maps and institutional affiliations.