


 , Donkupar Syiem 1, Surya Bhan 1,*, Arif Hussain 5, Najwane Said Sadier 6, Sarvesh Rustagi 3, Shafiul Haque 7,8,9, Nitesh Singh 10, Abdulmajeed G Almutary 6,11,*
1 Department of Biochemistry, North Eastern Hill University, 793022 Shillong, Meghalaya, India
2 Amity Institute of Biotechnology, Amity University Jharkhand, 834002 Ranchi, India
3 School of Applied and Life Sciences, Uttaranchal University, Dehradun, 248007 Uttarakhand, India
4 Guru Nanak College of Pharmaceutical Sciences, Dehradun, 248007 Uttarakhand, India
5 School of Life Sciences, Manipal Academy of Higher Education, 345050 Dubai, United Arab Emirates
6 Department of Biomedical Sciences, College of Health Sciences, Abu Dhabi University, 51072 Khalifa City, Abu Dhabi, United Arab Emirates
7 Research and Scientific Studies Unit, College of Nursing and Allied Health Sciences, Jazan University, 45142 Jazan, Saudi Arabia
8 Gilbert and Rose-Marie Chagoury School of Medicine, Lebanese American University, 11022801 Beirut, Lebanon
9 Centre of Medical and Bio-Allied Health Sciences Research, Ajman University, 13306 Ajman, United Arab Emirates
10 Faculty of Agriculture Sciences, Shree Guru Gobind Singh Tricentenary University, 122 505 Gurugram, Haryana, India
11 Department of Medical Biotechnology, College of Applied Medical Sciences, Qassim University, 51452 Buraydah, Saudi Arabia
†These authors contributed equally.
Abstract
Background: Hyperglycemia-induced oxidative stress accelerates the process of apoptosis in tissues. Dilleniaindica (DI) is a medicinal plant, and its fruit contains many therapeutic properties. The therapeutic activity of the Methanolic Fruit Extract (MFE) of DI in attenuating oxidative stress and apoptosis in the liver and kidney tissues of alloxan-induced diabetic mice was analyzed in the present study. Methods: High-Performance Thin Layer Chromatography (HPTLC) profiling of MFE was conducted. GLUT4 protein expression analysis and lipid peroxidation assays were conducted to check for MFE effect by administering in diabetic mice. An ultrastructural study was conducted for both the tissues. In apoptotic studies, the TUNEL assay and apoptotic protein expression analysis was conducted. Results: High-Performance Thin Layer Chromatography (HPTLC) profiling of MFE showed the presence of two crucial antioxidants, ascorbic acid, and naringenin. In GLUT-4 protein expression analysis, MFE suppresses hyperglycemia by upregulating GLUT4 protein expression. Lipid peroxidation assay showed a decrease in malondialdehyde (MDA) upon MFE administration in diabetic mice. An ultrastructural study was conducted, and MFE was found to restore cellular alterations in diabetic tissues. In apoptotic studies, the TUNEL assay shows that MFE treatment showed fewer apoptotic cells than the diabetic group. The study also observed decreased caspase 3 protein expression and increased Bcl-2 protein expression. Conclusions: Therefore, it is inferred from the study that MFE can exert a protective effect by suppressing hyperglycemia and modulating oxidative stress and apoptosis in alloxan-administered diabetic mice.
Keywords
- Dillenia indica extract
- HPTLC
- alloxan
- hyperglycemia
- oxidative stress
- apoptosis
Diabetes mellitus (DM) is a group of metabolic alterations characterized by hyperglycemia resulting from defects in insulin secretion, action, or both [1]. Glucose transporter 4 (GLUT4) is a prime carrier for glucose transport which transports blood glucose into muscle cells and fat tissues. Disruption in the GLUT4 expression induces insulin resistance [2]. Therefore, it has been considered a therapeutic target for pharmacological intervention strategies to control diabetic hyperglycemia [3]. However, in diabetic conditions, the intracellular Reactive Oxygen Species (ROS) level is subsequently increased by the mitochondrial respiratory chain reaction and other activities. The processes promoting ROS production include glucose autoxidation, glycosylation, glucosamine, and polyol pathways [4, 5]. A combination of ROS overproduction and concomitant downregulation of the activity of antioxidant enzymes leads to the alteration in the redox homeostasis, causing oxidative stress in diabetes [6, 7]. ROS attack causes membrane disintegration and releases cytochrome C into the cytosol, triggering apoptosis [8].
Apoptosis, commonly called programmed cell death, is a natural process of cell death [9]. The protease enzymes known as caspases can be categorized as initiator caspases (caspase-9) and effector caspases (Caspase-3, caspase-6, and Caspase-7), and they are essential apoptosis-related enzymes [10]. Cytochrome-c binds to the cytosolic Apaf-1 (apoptosis protease activating factor-1) and triggers the formation of an apoptosome complex. This complex recruits initiator pro-caspase-9 to its Caspase recruitment domain, allowing auto-activation and then proteolysis [11]. The process, in turn, activates downstream executor caspases-3, 6, and 7 for cleavage of cellular substrates leading to apoptotic cell death [12, 13]. Another protein family known as B-cell lymphoma-2 (Bcl-2) is seen to control apoptosis through a mechanism that controls the permeability of the mitochondrial membrane. Bcl-2 proteins are classified as either pro- or anti-apoptotic, depending on whether they inhibit or accelerate the apoptotic process [14, 15].
Although several therapies are available for treating diabetes, like expensive medications, there are various limitations linked to it [16]. Medicinal plants with potent pharmaceutical properties could be potent sources of treatments for the existing remedies [17, 18]. DI is one such medicinal plant chosen for the study since it has many therapeutic properties. DI, commonly recognized as Elephant apple or Indian catmon (English), is widely spread in India, Bangladesh, Nepal, and Sri Lanka [19]. It was also found traditionally that in various parts of northeast India, the juices of bark and leaves were mixed and given orally to treat cancer and diarrhea [20, 21]. Also, different literature review on the plant shows that the leaves, bark, and fruits of DI have extensive medicinal values, including antioxidant potential [22]. Oral synthetic hypoglycemic drugs, the primary source for controlling diabetes, fail to reverse the course of its complications, and turn, worsen as they demonstrate side effects. Natural products could be promising lead candidates for significant drug development with benefits such as availability ease, low cost, and most minor side effects, making them the key players of available therapies, especially in rural areas. Moreover, many bioactive chemicals found in plants are free from undesirable side effects and possess decisive pharmacological actions [23]. The present experimental study was intended to contribute to particular research significance so that natural products could be more opted in combating diabetes and its related complications, preventing significant side effects in the body bought about by synthetic drugs. Hence, a recent study was conducted; to examine the potential impact of DI fruits on hyperglycemia and oxidative stress-related apoptosis in the kidney and liver tissues of diabetic mice.
Metformin and alloxan were obtained from Sigma-Aldrich co. USA. Sodium dodecyl
sulfate (SDS), bovine serum albumin (BSA), and H
The DI fruits were collected from Guwahati, Assam. Plant identification was made by Dr.P. B. Gurung, Curator herbarium, Botany Department, North-Eastern Hill University, Shillong, Meghalaya (Voucher No: 12056).
Healthy Swiss albino male mice (Balb/C strain) weighing 25–30 gm of body weight (b.w) were selected for the experiment. All the experiments were conducted following the Institutional Ethics Committee (IEC) guidelines, Animal model, North Eastern Hill University, Shillong, India, dated 04/12/2014. Animal models (mice) were kept in appropriate cages of polypropylene, fed standard laboratory feed, and the environment was held at a constant 25 + 2 °C temperature with a 12 hr day/night cycle.
Harborne [24] described the method for preparing the extract. DI fruit pieces were air-dried until totally dry at room temperature. Dried fruit was grounded in powder form in a blender. It was further extracted overnight through incubation while continuously stirring with ten volumes of methanol: aqueous solution (4:1) to create Methanolic fruit extract (MFE). After the mixture was filtered, the filtrate was maintained in a rotary evaporator at 38 °C until it evaporated and dried. After that, the dried extract was kept at –20 °C until future investigations.
The HPTLC fingerprinting procedure was performed using Syed et al.
[25]. With an automatic TLC applicator Linomat-5b with N2 flow (CAMAG, Muttenz,
Switzerland), aliquots of the sample (MFE)/Standards were applied on Merck, TLC
silica gel 60 F 254 plates as an 8 mm broadband. After applying the sample, the
plates were developed for 20 minutes in a glass tank pre-saturated with the
mobile phase. White light and the Valid Diagnostics visualizer (S/N: 150503) were
used to observe the developed plates. Furthermore, these plates were allowed to
air dry at room temperature (R.T.) for five minutes before the chromatogram was
derivatized for ten minutes using an anisaldehyde-sulfuric acid reagent
previously heated to 100 °C. The derivatized plates were also observed
under white light and at
Alloxan prepared in ice-cold citrate buffer at 150 mg/kg was given intraperitoneally to cause diabetes (0.1 M, pH 4.5) in mice. Mice had unrestricted access to food and liquids following injection. After receiving an alloxan injection for 72 hours, the mice’s fasting blood glucose levels (FBGL) were measured using a glucostix (S.D. Check Gold, Korea), and mice with an FBGL of 200 mg/dL or more were diagnosed as diabetic.
The study was performed in four different groups of overnight fasted mice consisting of six mice in each group:
Group 1: Normal control (NC) mice administered with only distilled water
Group 2: Diabetic control (DC) mice administered with only distilled water
Group 3: Diabetic mice administered with 50 mg/kg b.w of metformin (D+MET)
Group 4: Diabetic mice administered with 350 mg/kg b.w of MFE (D+MFE)
Doses were injected every alternate day for 21 days intraperitoneally [26]. After 21 days of treatment, the mice were killed and carefully dissected to remove the skeletal muscles of the limbs for subsequent study.
The limb muscle was excised and extracted in 10% (w/v) extraction buffer containing sodium chloride (150 mM), 0.1% Triton X100, 0.5% Sodium deoxycholate, 0.1% Sodium dodecyl sulfate (SDS) and Tris buffer (50 mM, pH 8.0). Homogenates were centrifuged at 13000g for 15 minutes at 4 °C [27]. The supernatant was immediately collected and stored at –80 °C for GLUT4 protein expression analysis.
Western blot is an analytical technique to detect a specific protein in a sample
of tissue homogenate. Sample and the 5 Laemmli buffer containing (5% SDS, 50%
glycerol, 0.1% bromophenol blue, 250 mMTris-HCL, pH 6.8, and 5% of
2-mercaptoethanol) were prepared quickly. The membrane was placed in a blocking
solution made of Tris-buffered saline (TBS) with 5% skim milk for 3 hours at
room temperature. The membrane was treated with anti-GLUT4 antibody (0.5 g/mL) or
anti-actin (1:1000) antibodies overnight at 4 °C after being washed with
TBS and Tween Tris-buffered saline (TTBS). As a loading control, an actin
antibody was utilized (housekeeping gene). The membrane was rewashed in TBS and
TTBS and incubated with hydrogen peroxidase (HRP) conjugated secondary antibodies
(1:5000) for two h at room temperature, followed by the addition of substrate
(TMB/H
The study was performed in four groups of overnight fasted mice, with three in each group.
Group 1: Normal control (NC) mice administered with only distilled water
Group 2: Diabetic control (DC) mice administered with only distilled water
Group 3: Diabetic mice administered with 50 mg/kg b.w of Ascorbic acid (D+AA)
Group 4: Diabetic mice administered with 350 mg/kg b.w of MFE (D+MFE)
Doses were administered to mice intraperitoneally by injecting every alternate day for up to 21 days [26]. At the end of the experimental period, mice were sacrificed and dissected to excise each group’s liver and kidney tissues for subsequent analyses.
2.8.2.1 Preparation of Cytosolic and Mitochondrial Fractions of Tissues
According to the Graham, 2002 method, cytosolic and mitochondrial fractions of tissues were prepared by differential centrifugation. Tissues were homogenized in 10% (w/v) HEPES buffer, pH 7.4. Tissue homogenates were centrifuged at 1000 g for 10 minutes at four °C, and the supernatant was collected and again centrifuged at 7500 g for 10 minutes at 4 °C. The resulting supernatant from the second centrifugation was collected and centrifuged at 15000 g for 10 mins at 4 °C. The resulting supernatant obtained was the cytosolic fraction. The resulting pellet was further washed in buffer and centrifuged at 7500 g for 10 minutes at 4 °C to obtain the mitochondrial fraction [28, 29].
2.8.2.2 Quantification of Protein
The specific enzymatic activities were determined through total protein concentration present in the fractions of the cytosolic and mitochondria through bovine serum albumin (BSA) as the standard per the given protocol [30]. The thiobarbituric acid reactive substances (TBARS) were measured through the Lipid peroxidation assay [31]. Further, MDA (malondialdehyde) levels were obtained by extrapolating the curve, and the result was expressed as nm MDA/mg protein.
Tissues were prepared using a modified version of Hayat’s [32] approach for the ultrastructural examination. Cut into small pieces, the liver and kidney tissues were fixed in Karnovsky’s fixative. The fixed tissue pieces were washed with cacodylate buffer (0.1 M) and centrifuged at 10,000 g for 1 minute. The tissue fragments were dehydrated in increasing acetone concentrations (70–95%) after being postfixed in 1% osmium tetraoxide. After being implanted in a solution of embedding medium and propylene oxide, tissue fragments were sectioned using an ultramicrotome. After being stained with uranyl acetate, the sections were examined using a transmission electron microscope (JEM-2100, JEOL).
The fluorescein-based TUNEL assay method was used for in-situ DNA fragmentation detection. Sequential five m-sized pieces of paraffin-embedded tissue were attached on slides coated with albumin: glycerol (1:1) and left to dry at room temperature. Deparaffinized, rehydrated, and phosphate-buffered saline was used to wash the sections (PBS). Sections were rinsed once more with PBS after being incubated with Proteinase K (20 g/mL in 10 mM Tris-HCl buffer, pH 7.5) for 15 min at room temperature. Sections were then counterstained with DAPI after being treated with a TUNEL reaction solution containing TdT enzyme and Fluorescein-labeled dUTP nucleotides for 60 min at 37 °C. Sections were then viewed under the confocal microscope after being coated with a coverslip (TCS SP5, Leica, Germany).
2.8.5.1 Tissue Homogenization
10% (w/v) extraction buffer comprising ten mM HEPES (pH 7.4), 0.2 M mannitol, 50 mM sucrose, and one mM EDTA was used to extract the liver and kidney tissues. According to the procedure described by Kaushal et al. [27], the tissue homogenate was centrifuged at 13000 g for 15 minutes at 4 °C. The supernatant was immediately removed and kept at –80 °C to investigate the expression of proteins (Caspase 3 and Bcl2).
2.8.5.2 Western Blot Analysis
Western blotting of electrophoresis and transferring was performed as the
protocol described. Anti - Caspase 3 IgG (1:1000) antibody, Anti- Bcl-2 IgG
(1:500) antibody, or anti-
Using the statistical program “IBM SPSS Statistics 19.0 for Windows”, one-way
analysis of variance (ANOVA) and Tukey’s post hoc test were used to analyze
differences between the experimental groups. The data were presented as
mean
HPTLC fingerprinting of MFE was done as shown in Fig. 1A, along with various
known reference standards like gallic acid, tannic acid, ascorbic acid,
naringenin, and quercetin to assess and check their presence in the MFE sample.
The plate was developed in the solvent system combination of n-butanol: glacial
acetic acid: water in the ratio of (4:1:1 v/v/v). Visualizing of the plate was
then followed in absorbance mode
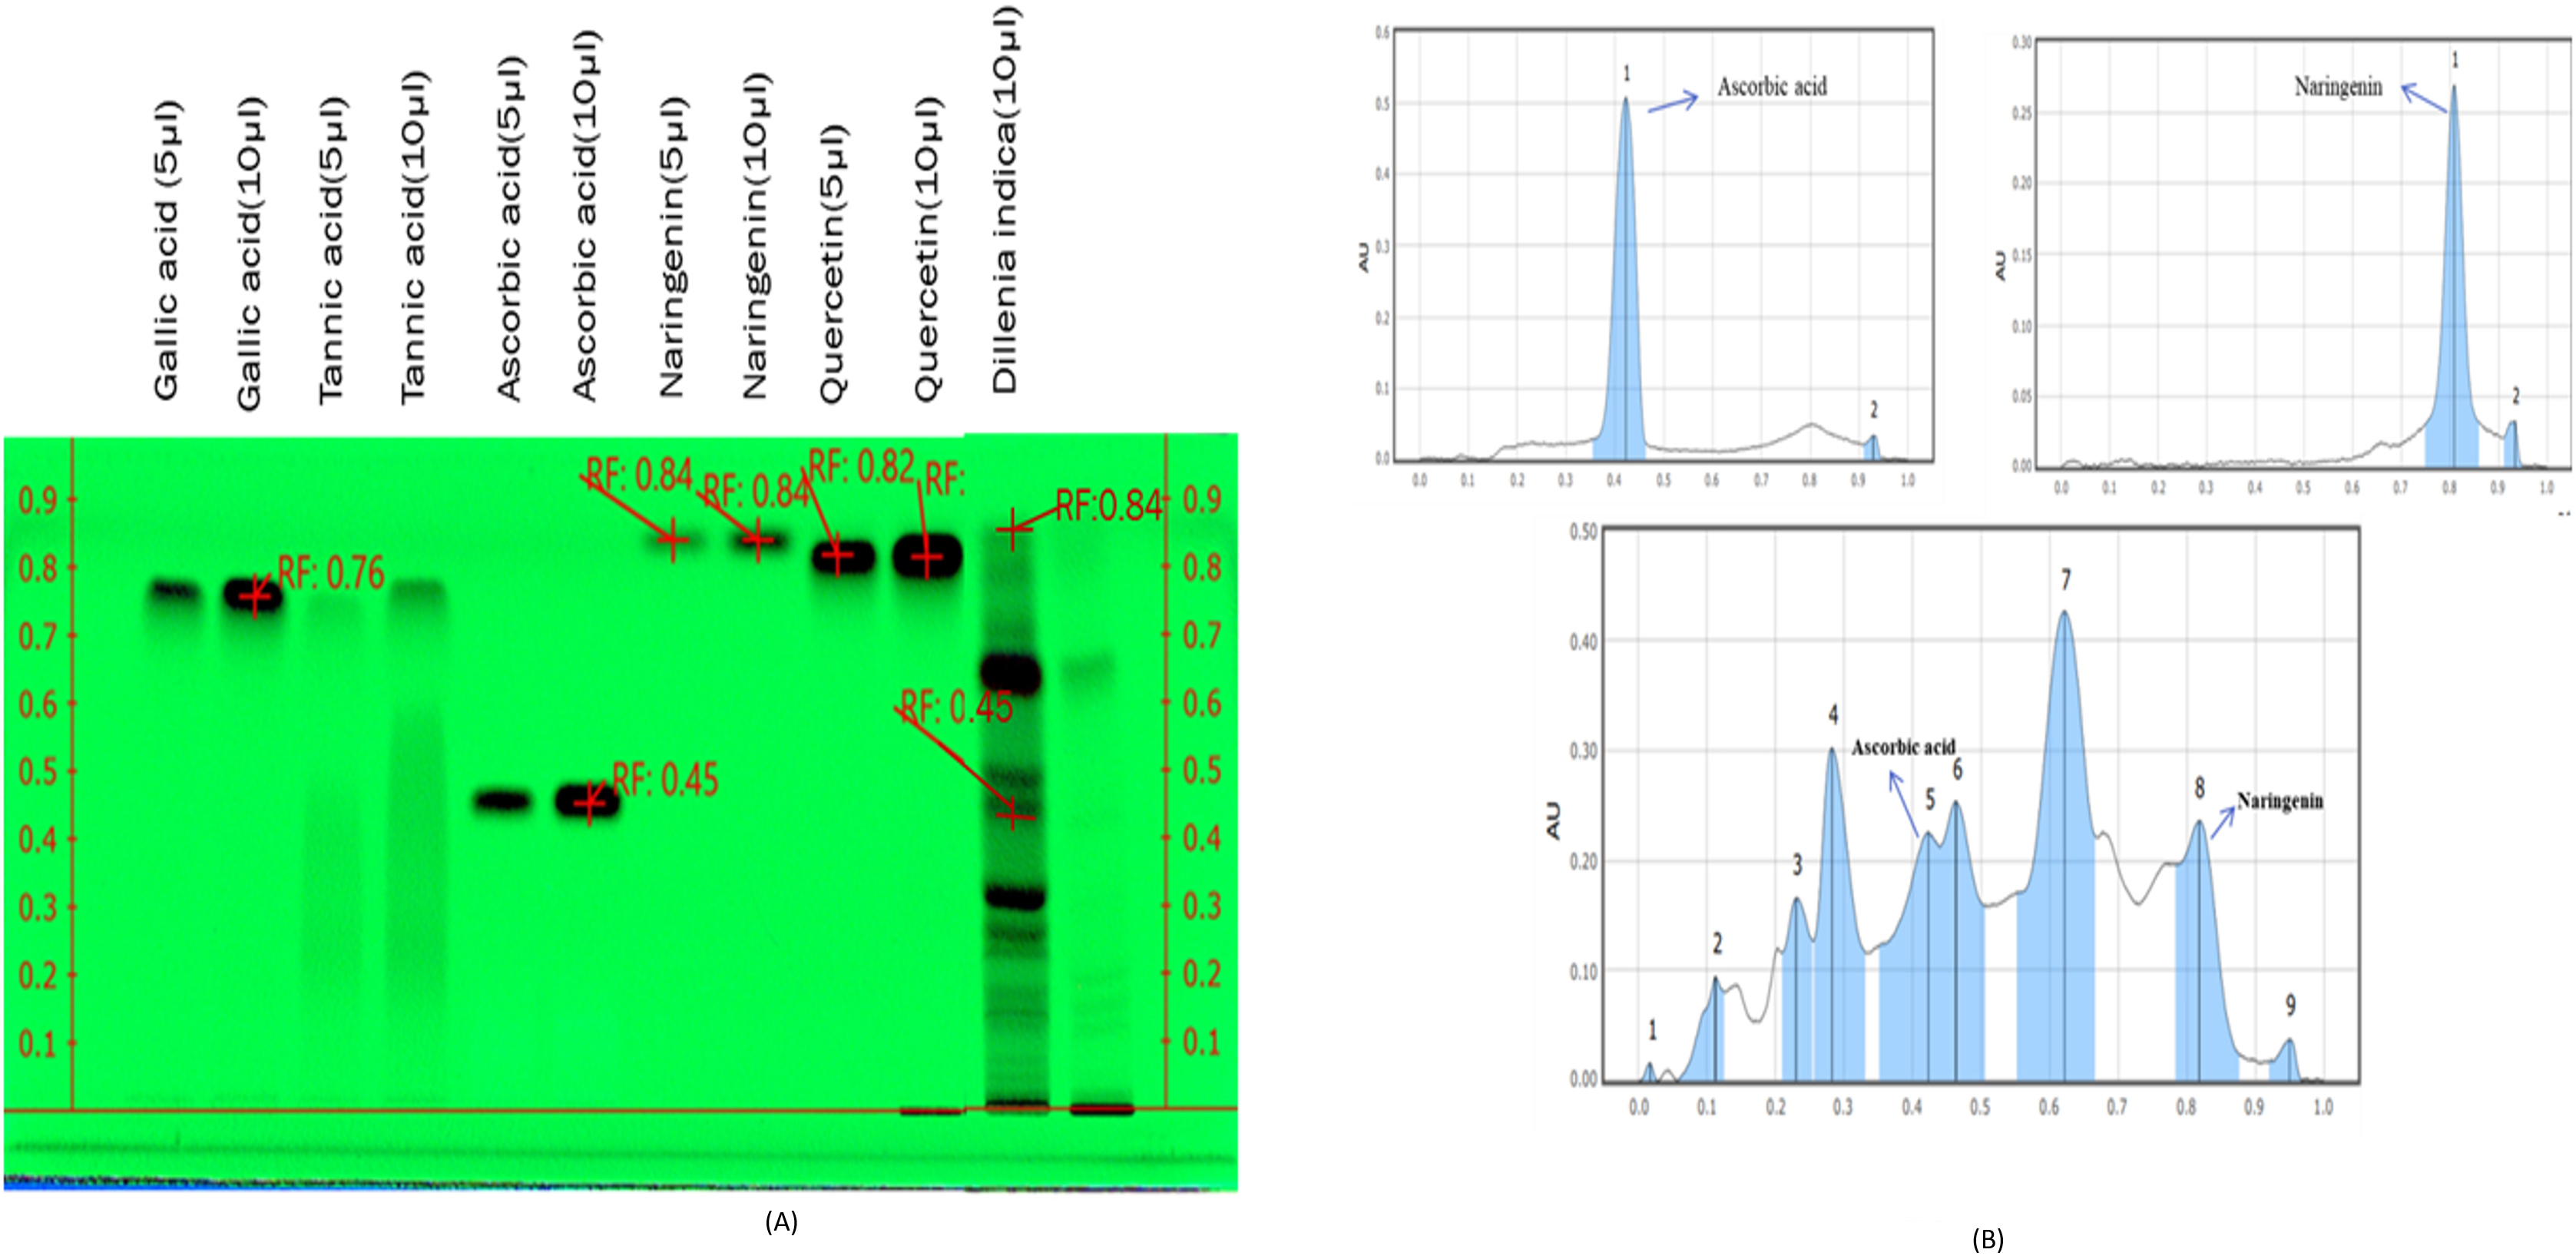 Fig. 1.
HPTLC fingerprinting of Gallic acid, Tannic acid,
Ascorbic acid, Naringenin, Quercetin, and MFE observed at
The study aimed to analyze how MFE affected the expression of the protein GLUT4
in the skeletal muscle of alloxan-induced diabetic mice. Fig. 2a,b shows that
GLUT4 expression was downregulated in diabetic control (0.08
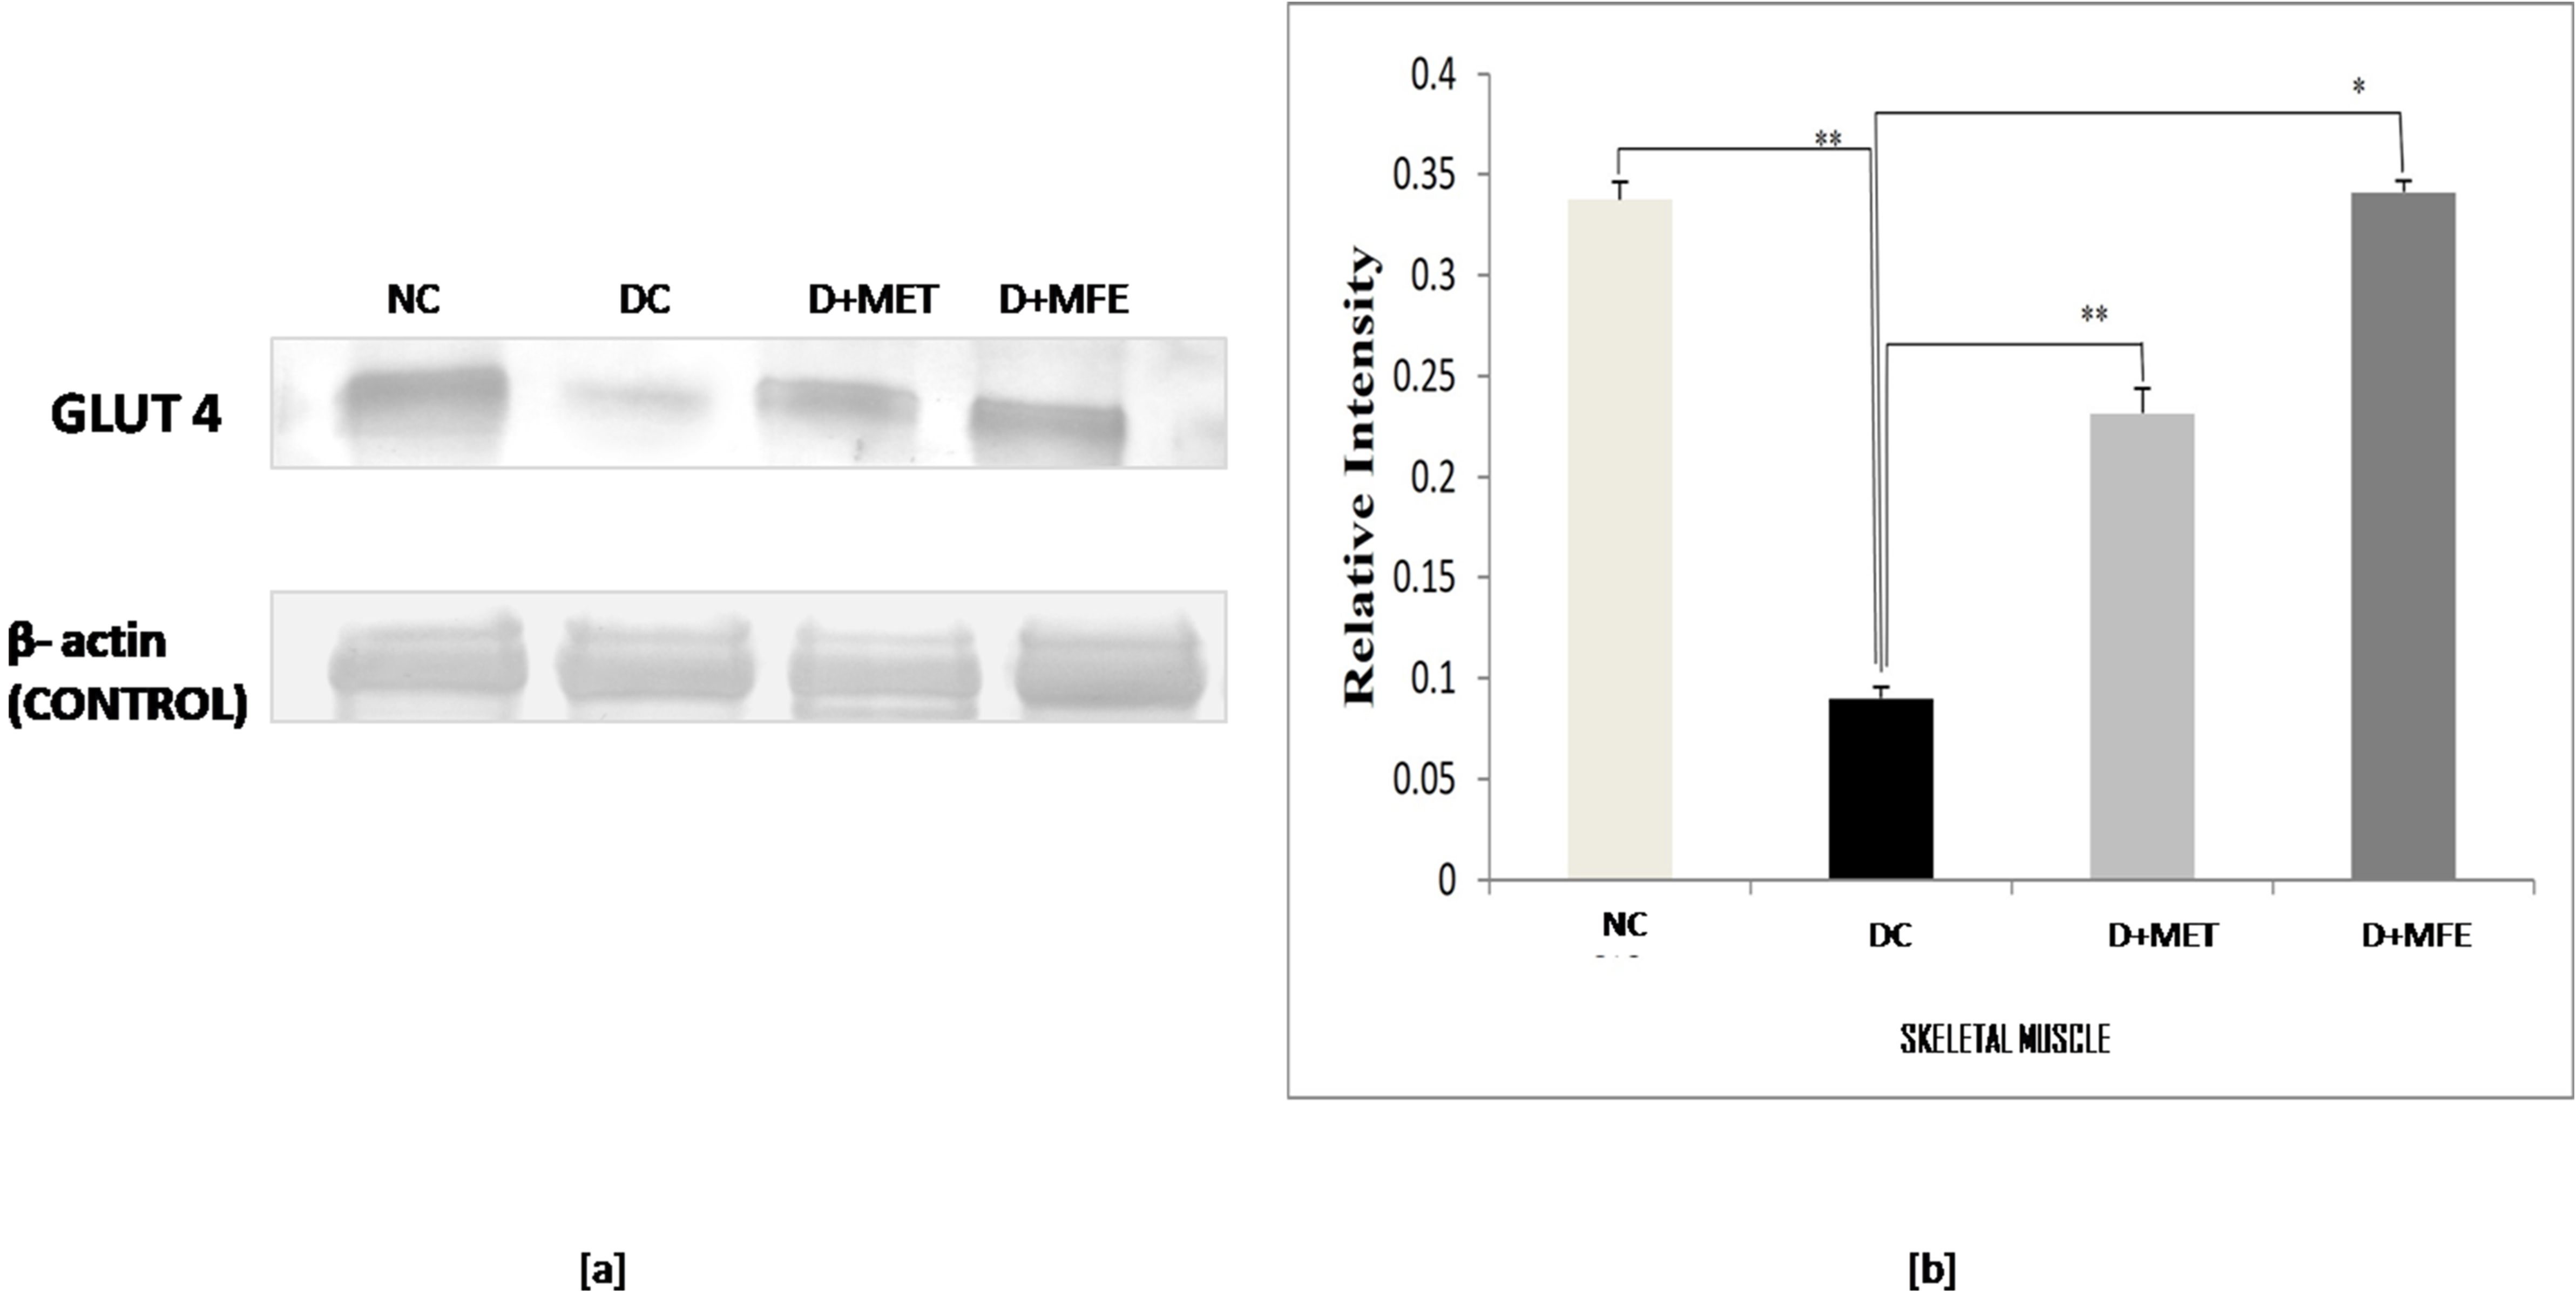 Fig. 2.
Comparison of the Glut - 4 protein expression in
skeletal muscle between normal control (NC), diabetic control (DC), diabetic
mice treated with metformin (D+MET), and diabetic mice treated with MFE (D+MFE).
Western blot analysis and corresponding relative intensity after normalization
with
Lipid peroxidation was assessed by measuring the MDA level in selected tissues
of experimental groups. As shown in Fig. 3a, lipid peroxidation was confirmed in
diabetic control as a level of MDA increased by 80% (1.30
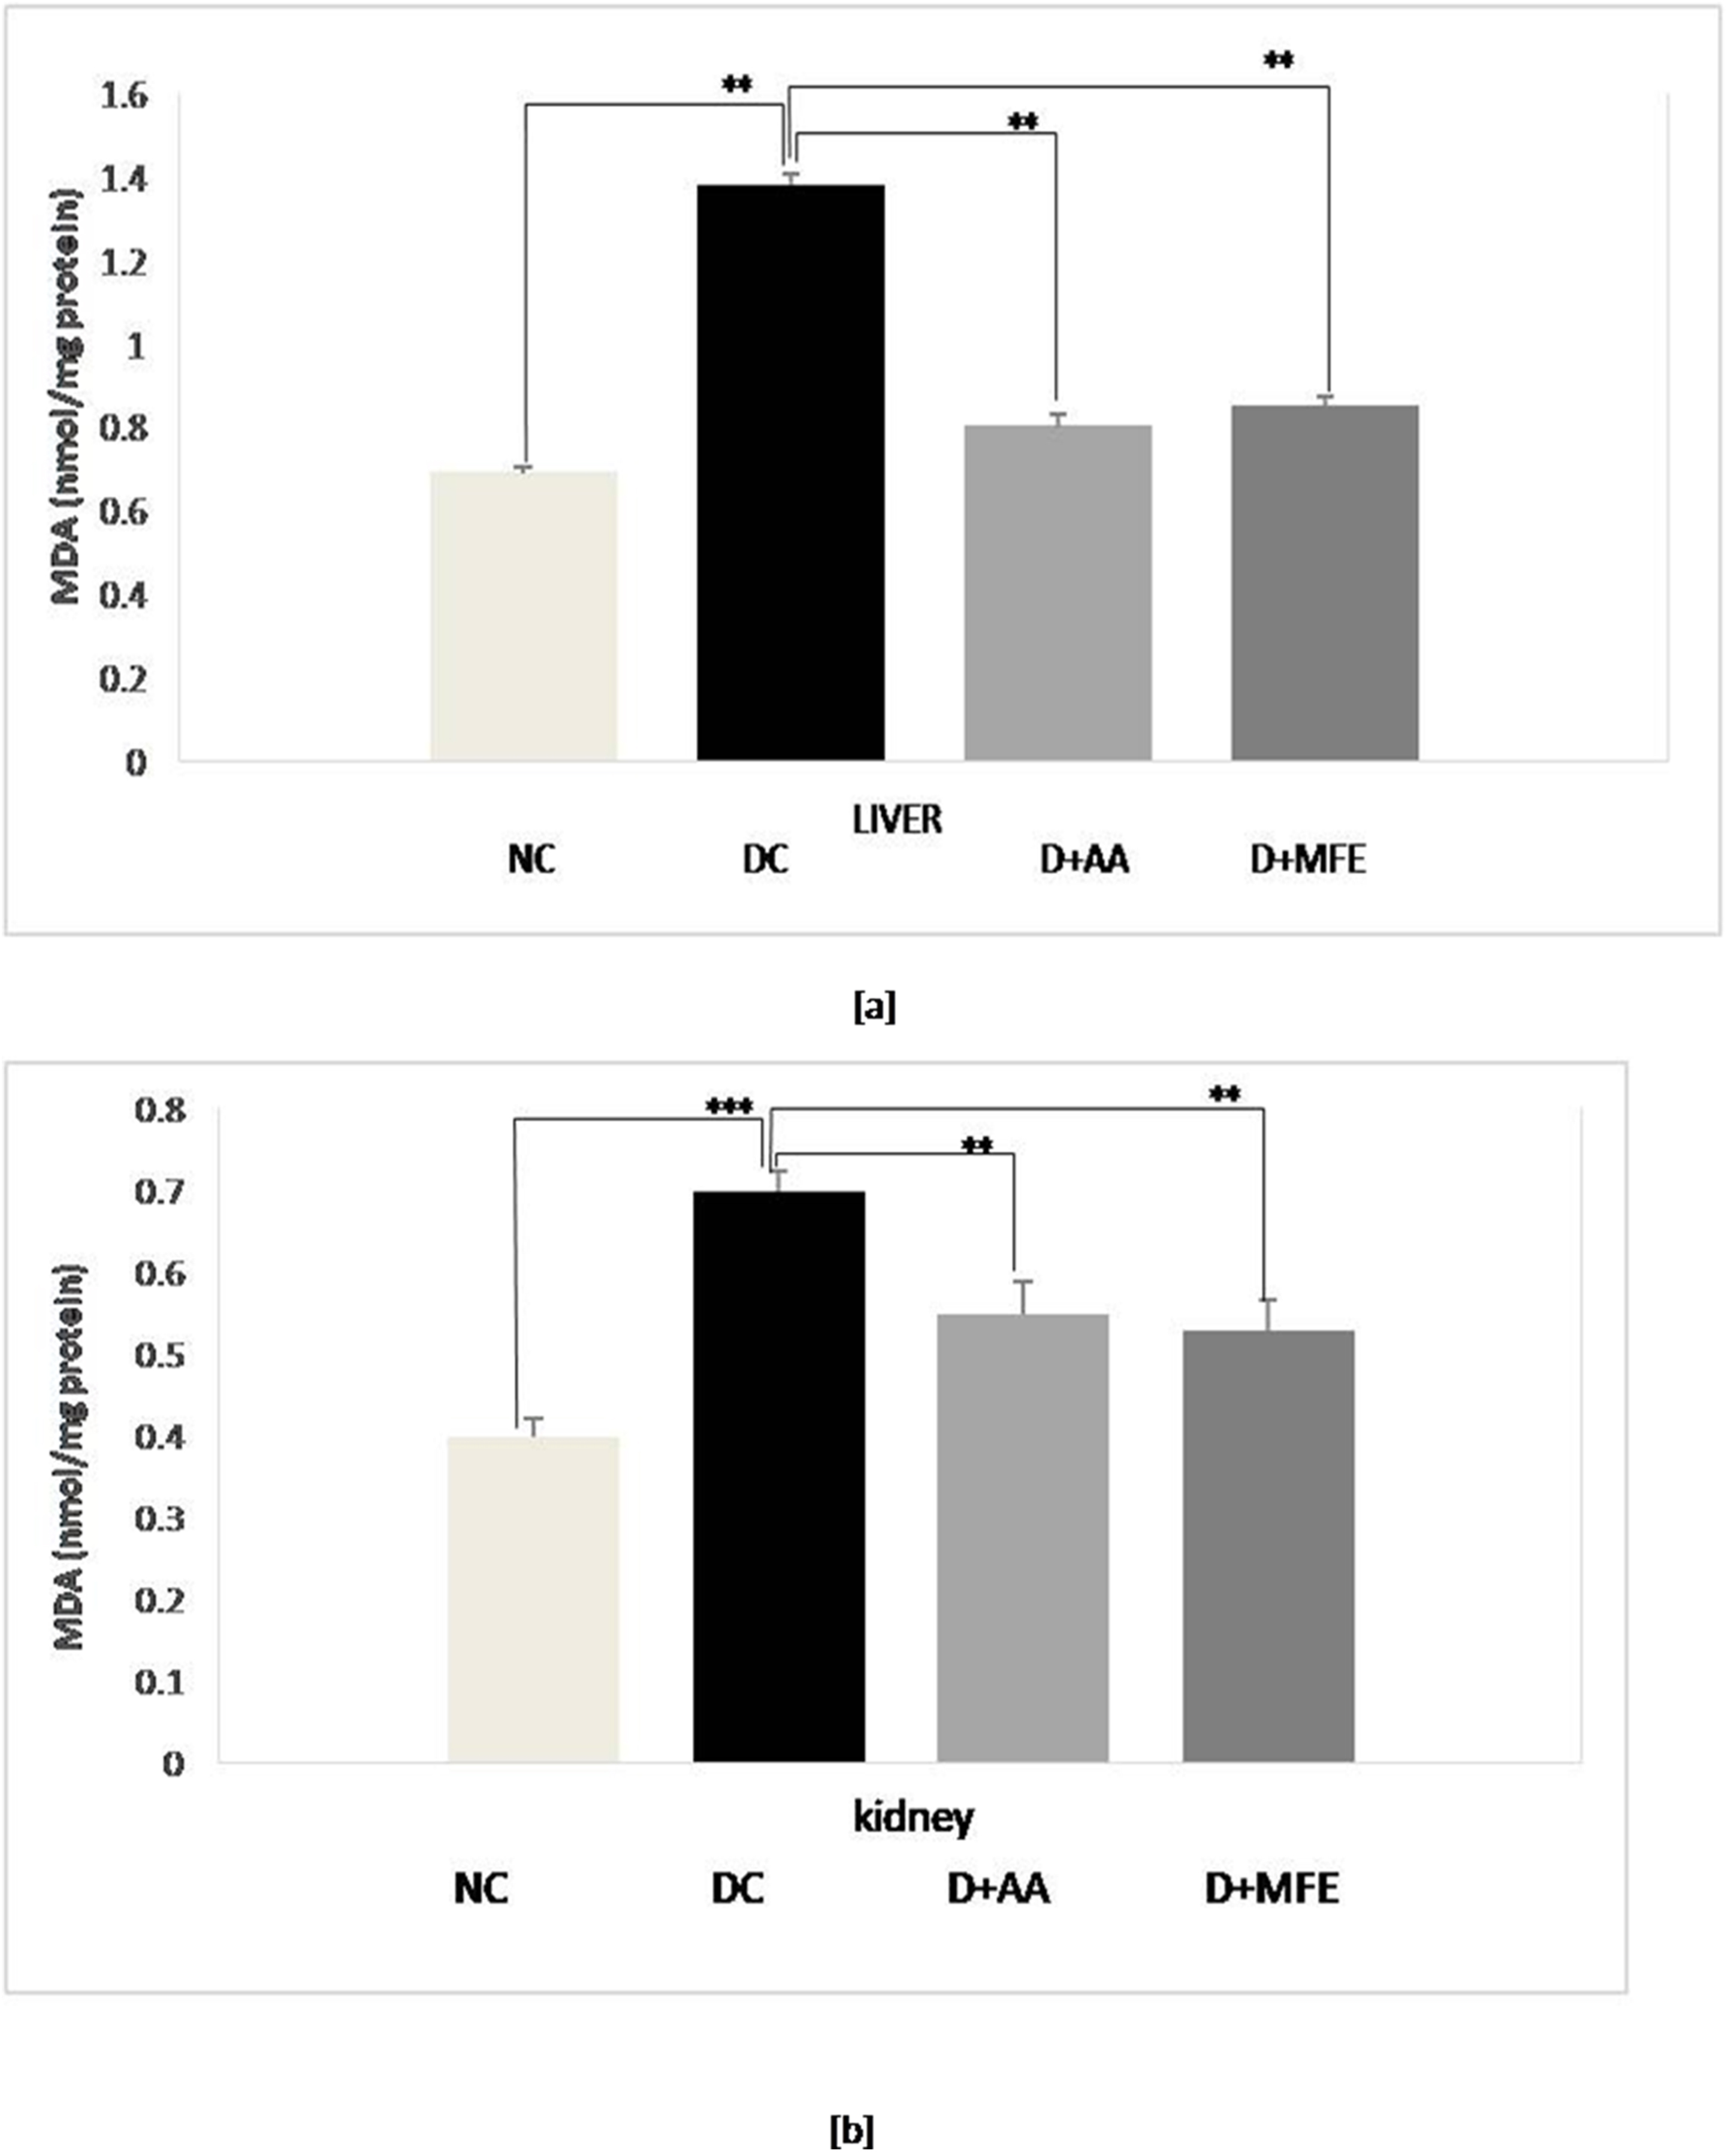 Fig. 3.
Mean levels of malondialdehyde (MDA) in the liver tissue (a) and mean levels of MDA in kidney tissue (b) of normal control (NC), diabetic control (DC), diabetic mice treated with ascorbic acid (D+AA), diabetic mice treated with MFE (D+MFE). Values represent the mean
The effect of MFE on oxidative stress-mediated cellular changes in different experimental groups’ liver and kidney tissues was investigated using ultrastructural techniques. The following are the evaluation’s findings.
The livers of all four groups of Swiss albino mice are depicted in electron micrographs in Fig. 4. A round or oval-shaped nucleus with prominent nucleoli and a symmetrical nuclear membrane was detected in the standard control (A). The diabetic control, on the other hand, had an unevenly shaped nucleus (N) with nearly dissolved nucleoli and an uneven nuclear membrane (B). MFE and ascorbic acid treatment, on the other hand, had an almost identical impact in correcting hepatic abnormalities in both treated groups near normal (oval to round) nucleus (N), with approximately symmetrical nuclear membrane, though some places had uneven nuclear membrane (C,D).
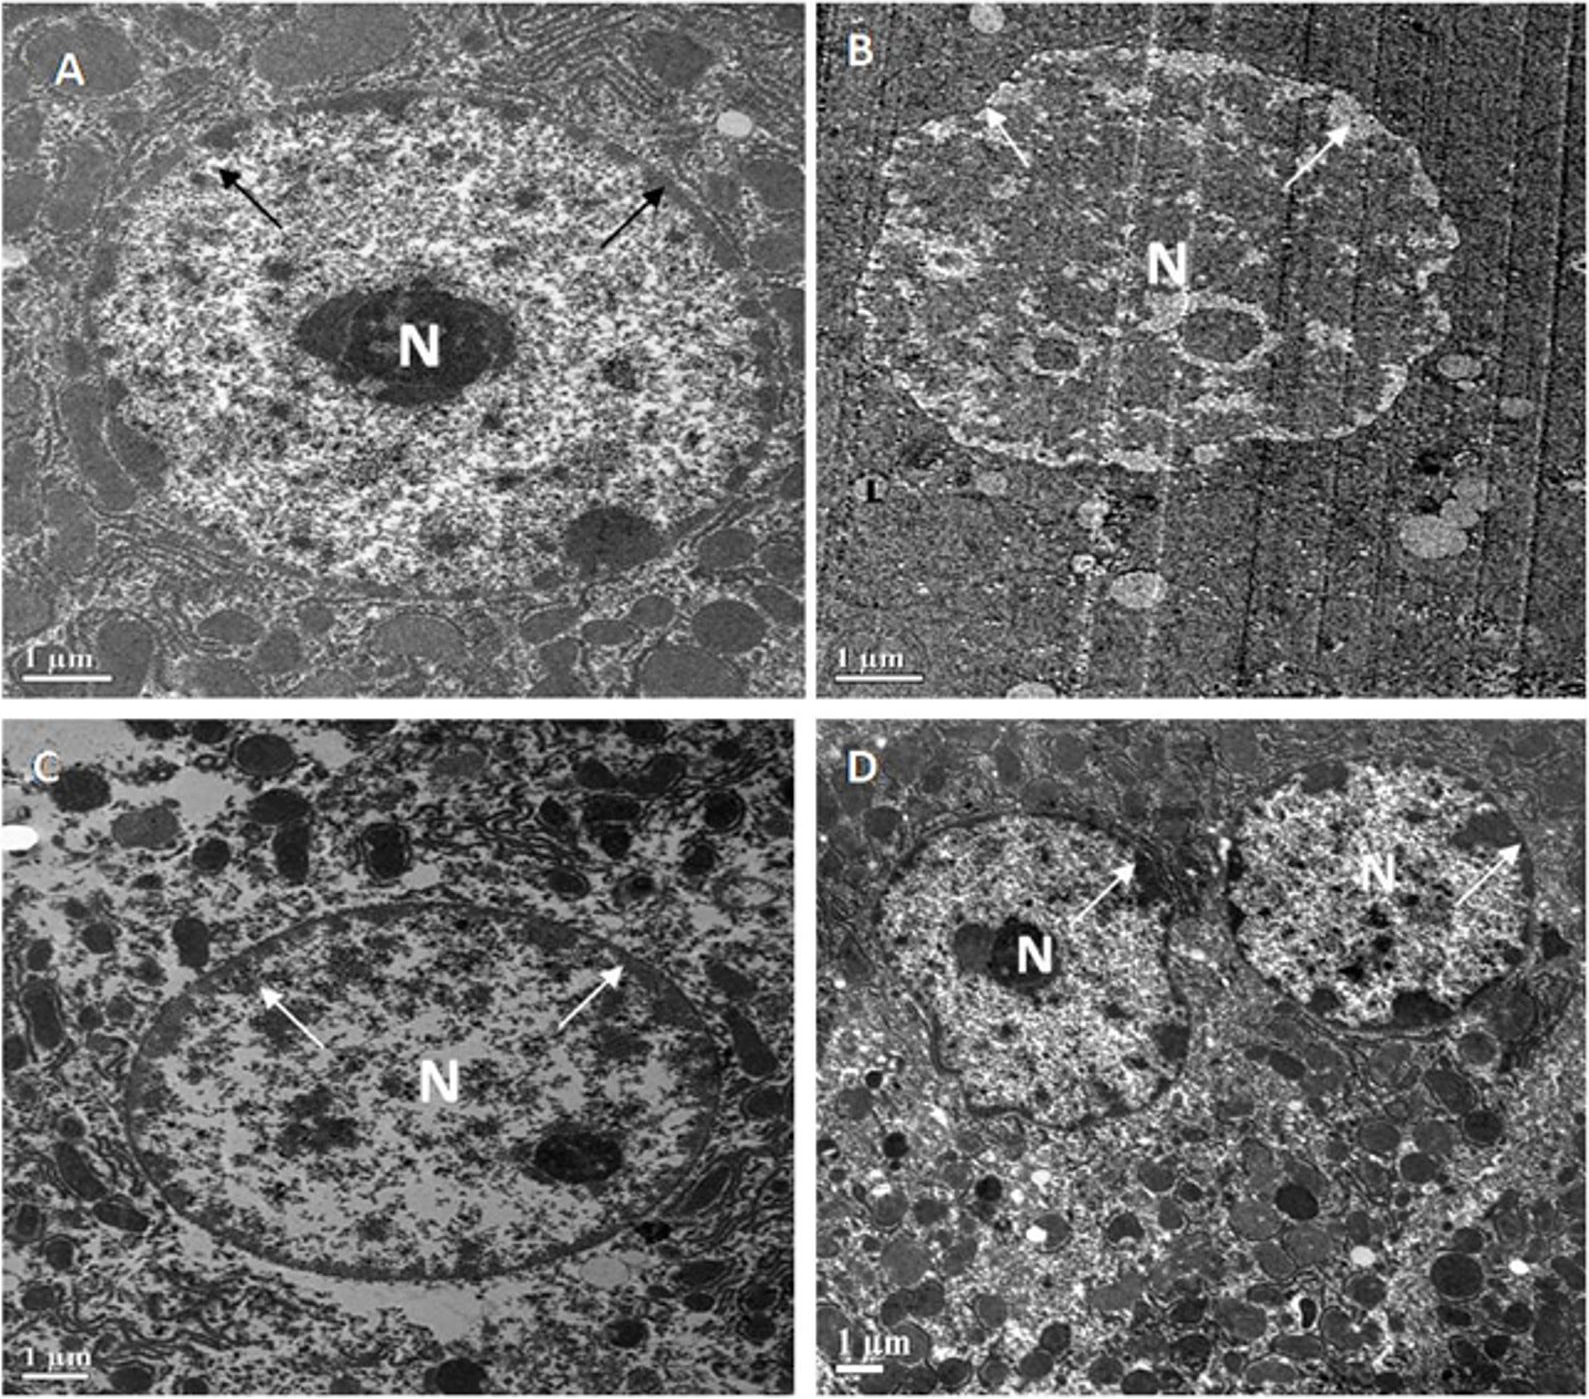 Fig. 4.
Representative electron micrographs depict
ultrastructural characteristics of hepatocytes in experimental groups containing
(A) standard control, (B) diabetic control, (C) diabetic mice treated with
ascorbic acid, and (D) diabetic mice treated with the MFE. N, nucleus.
Magnification: 2000
Fig. 5 shows an electron micrograph of the kidneys of all four groups of Swiss albino mice. Renal corpuscles with normal extended foot processes (F.P.) lying on the symmetrical glomerular basement membrane (B.M.) were seen in the standard control (A). In diabetic control, however, the ultrastructure of the renal corpuscle was altered, as evidenced by long and aberrant foot processes and abnormal thickening of the glomerular basement membrane (B). Surprisingly, diabetic mice treated with MFE and ascorbic acid had decreased thickening of the glomerular basement membrane (B.M.) and foot processes (F.P.) that were practically normal (C, D).
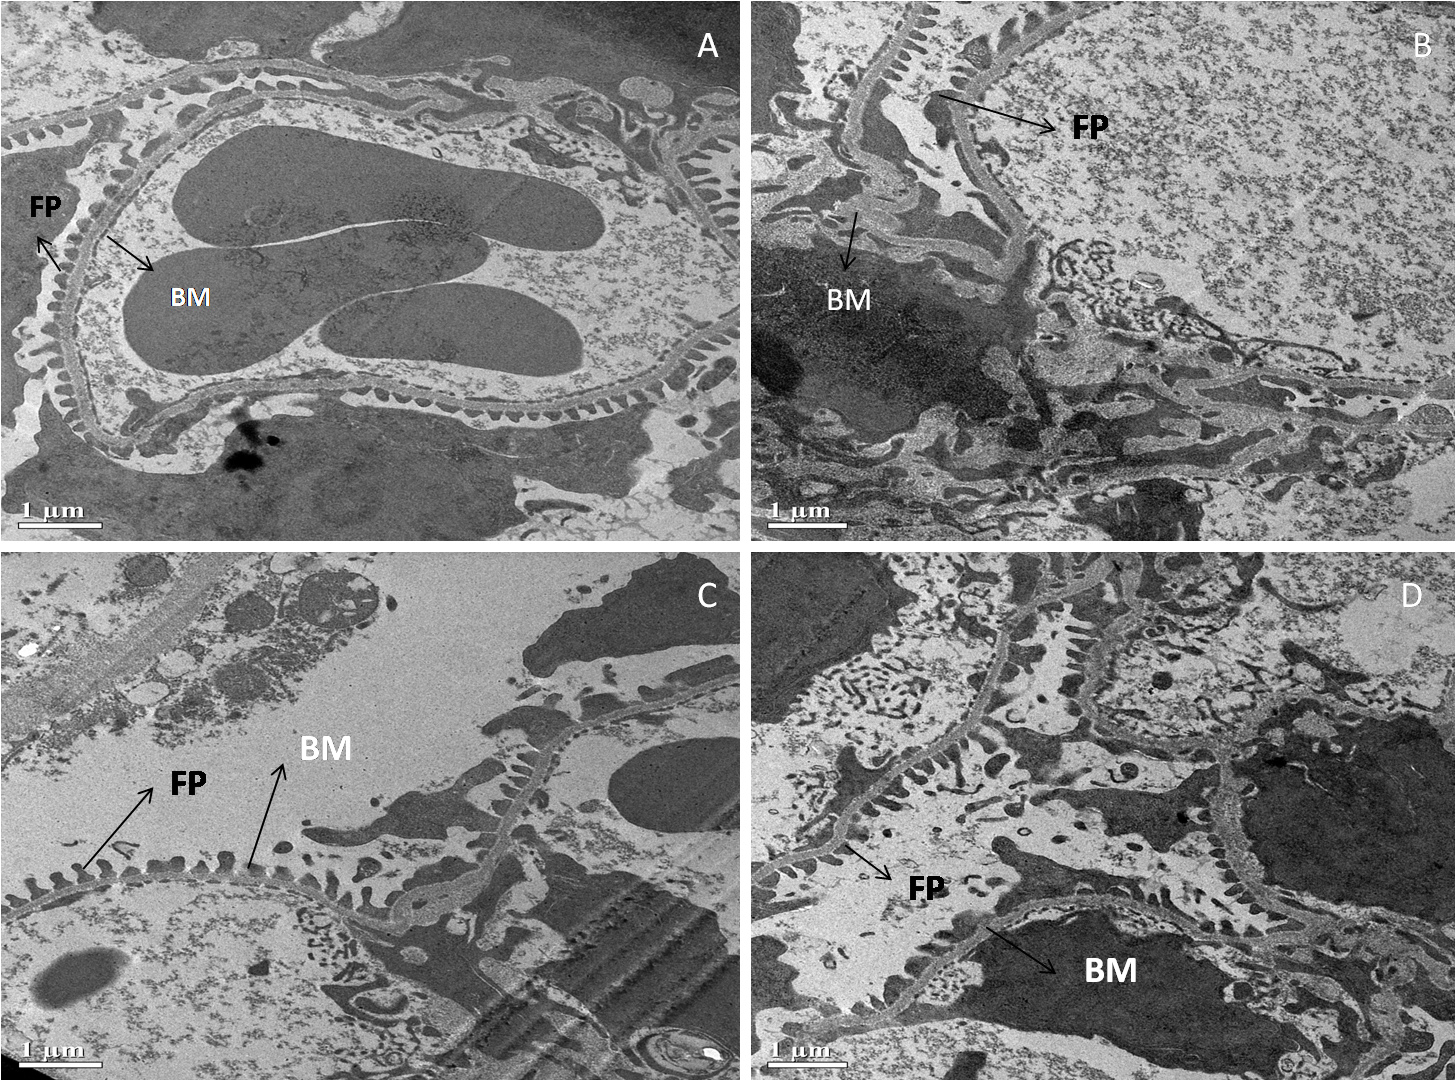 Fig. 5.
Representative electron micrographs depict
ultrastructural characteristics of renal corpuscle in experimental groups
containing (A) standard control, (B) diabetic control, (C) diabetic mice treated
with ascorbic acid, and (D) diabetic mice treated with the MFE. B.M., glomerular
basement membrane; F.P., foot processes. Magnification: 2000
The TUNEL assay was used to investigate the influence of MFE on apoptosis morphologically using the TUNEL staining method. The percentage of apoptotic cells in the tissues was calculated as follows:
3.5.1.1 Liver
According to the findings in Fig. 6a,b, the diabetic control underwent significant apoptosis, with 37% of cells in the liver tissue being TUNEL-positive, compared to 7.3% in the standard control. Compared to diabetes control, ascorbic acid, and MFE therapy, it has reduced apoptosis by 15% and 17%, respectively, suggesting its usefulness in avoiding in vivo oxidative harm.
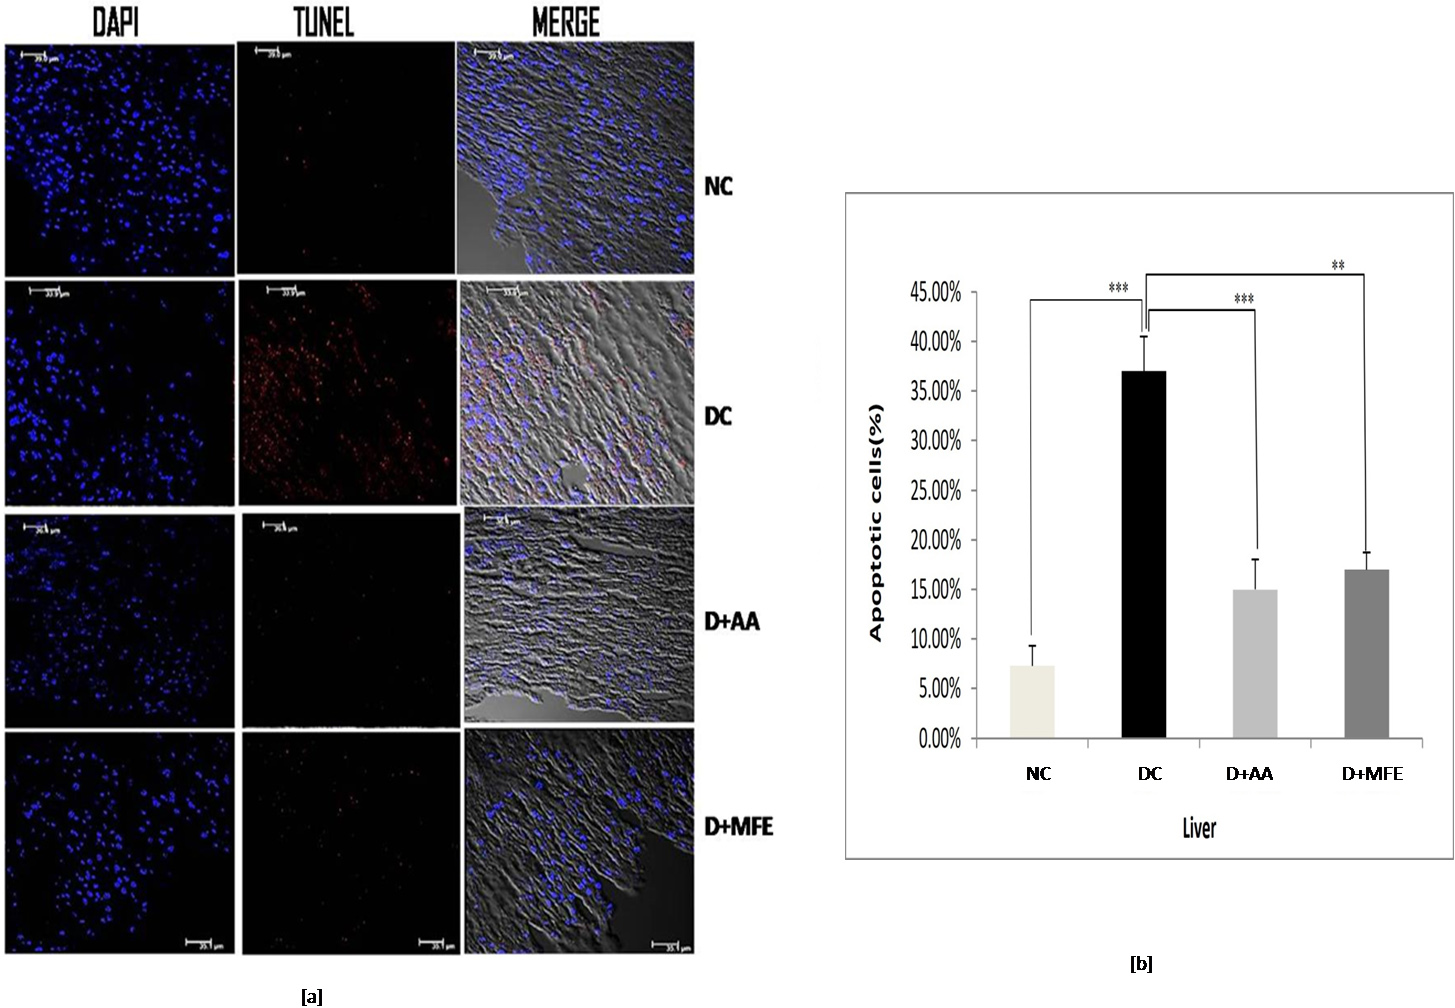 Fig. 6.
Confocal microscopic images showing liver tissue
sections of normal control (NC), diabetic control (DC), diabetic mice treated
with ascorbic acid (D+AA), and diabetic mice treated with MFE (D+MFE).
DAPI-stained nuclei are shown in fluorescent blue, whereas TUNEL-positive
apoptotic cells are in fluorescent red (a). The corresponding graph shows the
percentage of apoptotic cells (b). Values are expressed as the mean
3.5.1.2 Kidney
The percentage of TUNEL-positive cells in diabetic control kidney tissue, as depicted in Fig. 7a,b, was 35%, compared to 6.5% in normal control kidney tissue. When compared to diabetic control in the study, ascorbic acid, and MFE treatment were effective in reducing apoptotic cell death, as TUNEL-positive cells were determined to be 13% and 16%, respectively.
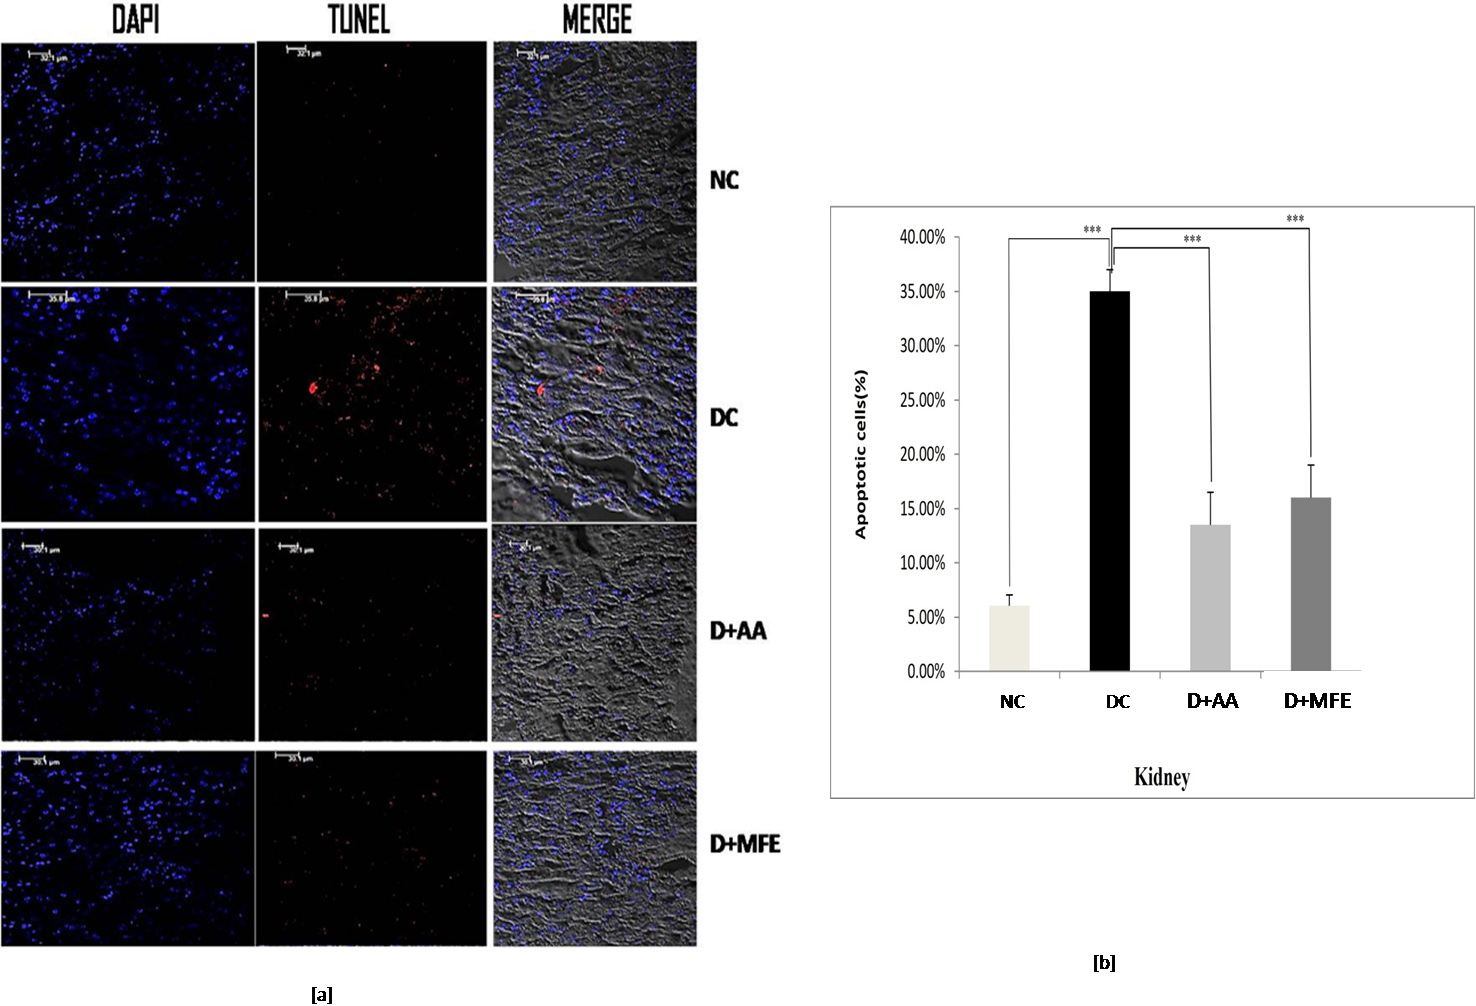 Fig. 7.
Confocal microscopic images showing kidney tissue
sections of normal control (NC), diabetic control (DC), diabetic mice treated
with ascorbic acid (D+AA), and diabetic mice treated with MFE (D+MFE).
DAPI-stained nuclei are shown in fluorescent blue, whereas TUNEL-positive
apoptotic cells are in fluorescent red (a). The corresponding graph shows the
percentage of apoptotic cells (b). Values are expressed as the mean
This study aimed to see how MFE affected the expression of Bcl-2 and Caspase 3 proteins in the liver and kidneys of diabetic mice and to compare the results to those of diabetic controls. The following are the outcomes:
3.5.2.1 Liver
Bcl-2 protein expression: The anti-apoptotic protein
Bcl-2 expression was significantly downregulated in the liver tissue of diabetic
control, as shown in Fig. 8a,b, with a significant decrease of 0.41-fold (0.18
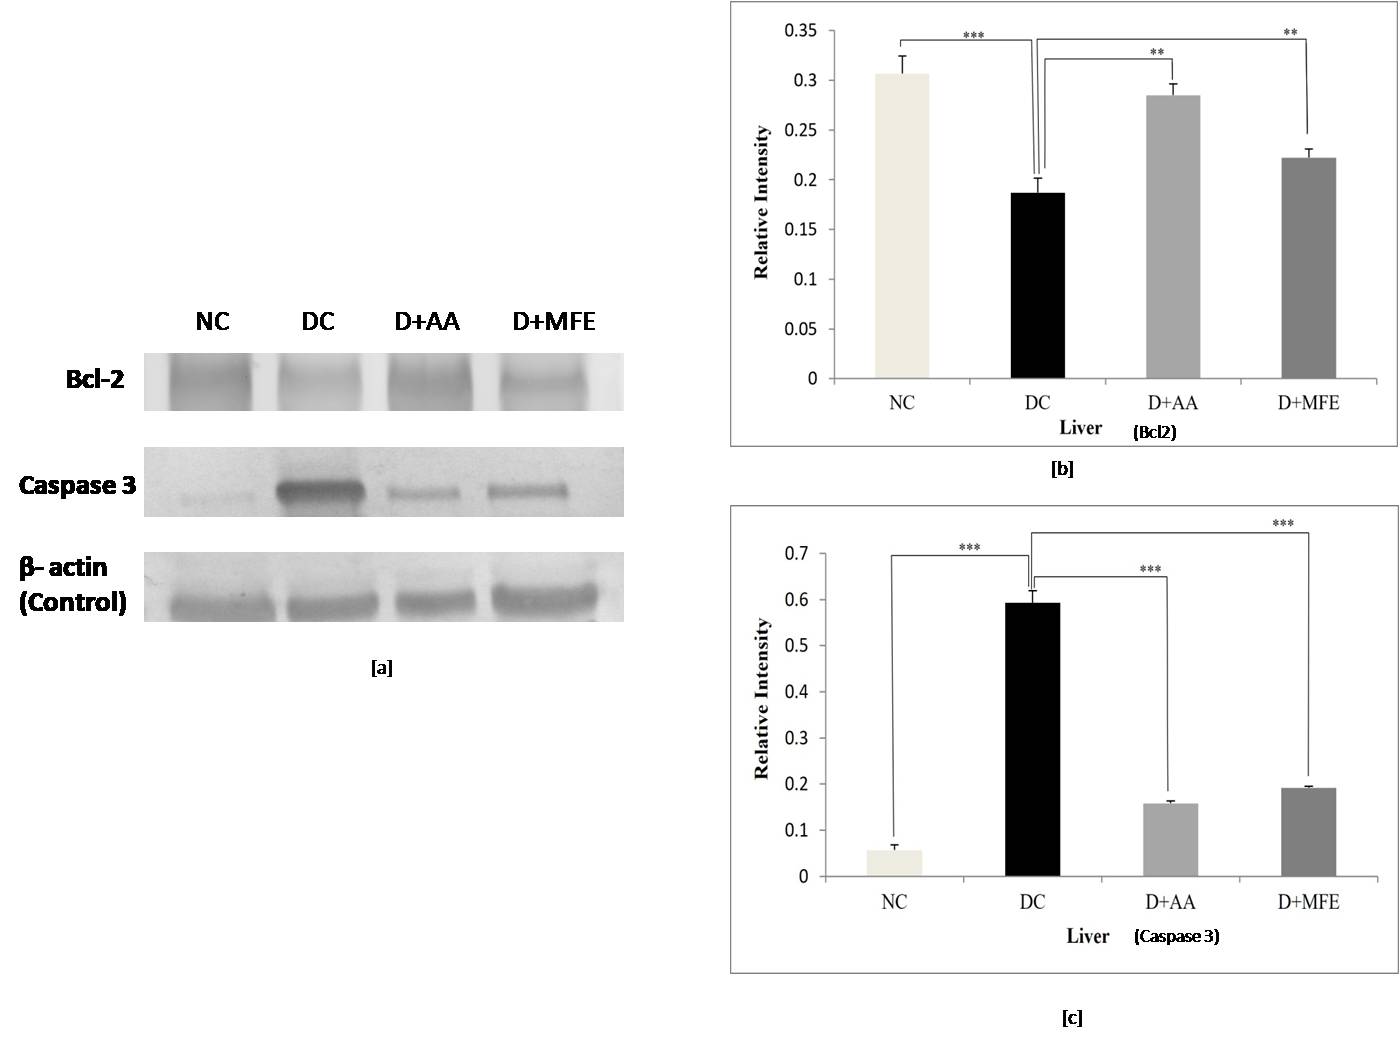 Fig. 8.
Comparison of Bcl-2 and Caspase 3 protein expressions
in the liver between normal control (NC), diabetic control (DC), diabetic
mice treated with ascorbic acid (D+AA), and diabetic mice treated with MFE
(D+MFE). Western blot analysis of Bcl-2 and Caspase 3 protein expression,
corresponding relative intensity after normalization with
Caspase 3 protein expression: Upregulation of caspase three
expressions in liver tissue was seen in diabetic control, as shown in Fig. 8 c,d,
with a significant increase of 10.8-fold (0.59
3.5.2.2 Kidney
Bcl-2 protein expression: Downregulation of Bcl2 protein
expression in kidney tissue was found in diabetic control, as shown in Fig. 9a,b,
with a significant drop of 0.32-fold (0.19
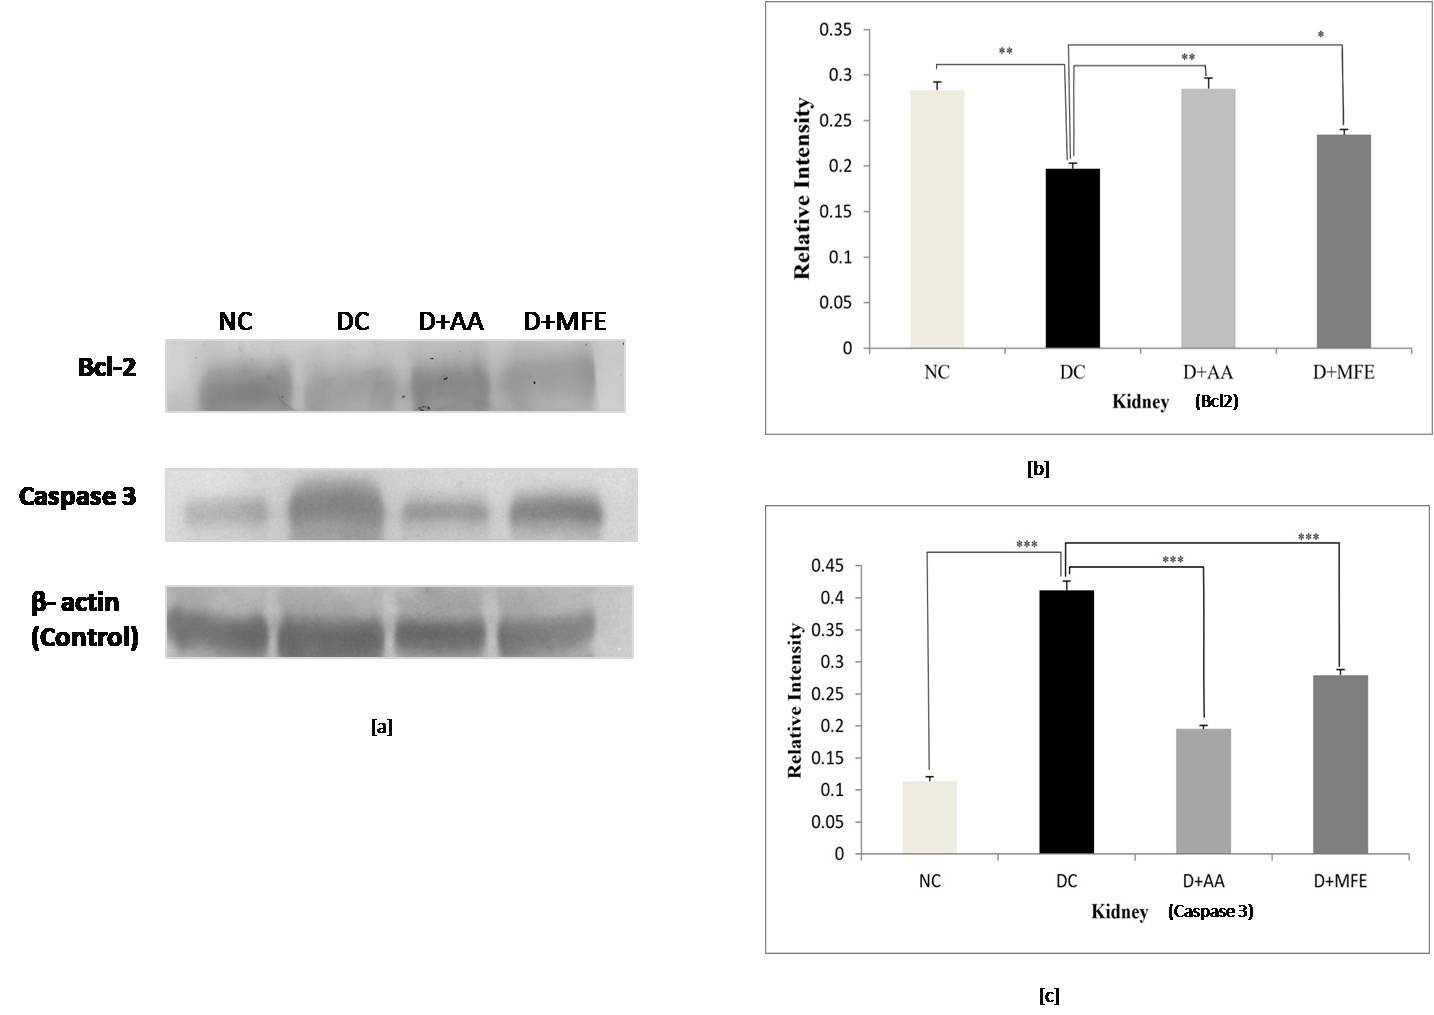 Fig. 9.
Comparison of Bcl-2 and Caspase 3 protein expressions
in kidneys between standard control (NC), diabetic control (DC), diabetic
mice treated with ascorbic acid (D+AA), and diabetic mice treated with MFE
(D+MFE). Western blot analysis of Bcl-2 and Caspase 3 protein expression,
corresponding relative intensity after normalization with
Caspase 3 protein expression: In comparison to the
standard normal control (0.11
The pathogenesis of DM and its possible management by existing therapeutic agents having negligible side effects have drawn interest in recent years [33]. Antioxidants generated from plants operate as radical scavengers; therefore, they have gotten much attention. Polyphenols are a class of secondary metabolites that have lately gained popularity due to their potent antioxidant efficacy and ability to protect against chronic illness. Plant phenolics are secondary metabolites generated from phenylalanine and tyrosine extensively dispersed throughout the plant kingdom [34]. HPTLC fingerprinting is an accurate and well-established method for the herbal identification of medicinal plants that may also be used to authenticate and characterize them [35]. HPTLC fingerprinting of MFE revealed the presence of two phytoconstituents in the MFE, ascorbic acid and naringenin, accountable for the pharmaceutical properties of MFE, which implies that ascorbic acid and naringenin perhaps are the active compound present in the extract.
Alloxan (2,4,5,6-tetraoxypyrimidine;2,4,5,6 pyrimidinetetrone) is an oxygenated pyrimidine derivative found as alloxan-hydrate in aqueous solution with diabetes-inducing effects when administered intravenously, intraperitoneally, or subcutaneously in rodents [36]. Alloxan induces insulin-dependent diabetes, which culminates in the selective necrosis of beta cells by selectively blocking the production of glucose-induced insulin through specific inhibition of the enzyme glucokinase and by its capacity to generate ROS generation [37].
Under diabetes mellitus conditions, the glucose transporter protein GLUT4 in the cell membrane is reduced due to the lack of insulin sensitivity. This leads to decreased cell glucose uptake or hyperglycemia [38]. Insulin regulates the presence or absence of GLUT4 on the plasma membrane’s cell surface. The effect of MFE on the expression of GLUT4 protein in the skeletal muscles of diabetic mice was studied. The study found that GLUT4 expression was downregulated in diabetic mice, indicating a relative insulin deficit. In contrast, after MFE therapy, GLUT4 expression was shown to be increased and equivalent to GLUT4 expression in metformin-treated diabetic mice, indicating an increase in insulin availability in the treated groups. Increased GLUT4 protein levels would increase glucose absorption in skeletal muscle, assisting in treating hyperglycemic conditions. MFE was discovered to have an anti-hyperglycemic effect against alloxan-induced hyperglycemia, according to the study’s findings.
High glucose concentrations cause the tricarboxylic acid cycle (TCA cycle) to overproduce electron donors, increasing the mitochondrial proton gradient and the production of mitochondrial superoxide [39, 40]. An increase in free radicals then causes oxidative stress-induced lipid peroxidation. This process causes a decrease in cell membrane fluidity and changes the activity of membrane-bound enzymes and receptors, resulting in membrane malfunction [41]. Lipid peroxidation attacks the lipids containing carbon-carbon double bond(s), such as polyunsaturated fatty acids (PUFAs). The present study also showed a significant elevation of MDA levels in all three liver and kidney organs of alloxan-induced diabetic mice, notably due to the formation of increased ROS in the tissues. Intraperitoneal administration of MFE to diabetic mice at a dose of 350 mg/kg b.w showed a significant reduction in MDA level. It implies the antioxidative nature of MFE to stop free radical chain reaction, parallel to the activity exhibited by intraperitoneal administration of ascorbic acid at a dose of 50 mg/kgb.w.
Ultrastructural examination of diabetic liver and kidney tissues revealed unhealthy tissues. MFE administration produced positive results in restoring hepatocyte and kidney tissues, with effects comparable to ascorbic acid. As a result of the antioxidant activity exerted by the MFE, it was deduced from the ultrastructural experiments that it demonstrated a good response in repairing tissue architecture.
It has been established that under hyperglycemia-induced oxidative stress, various cell types undergo a ubiquitous phenomenon known as apoptosis (cell death) [42]. A characteristic feature of apoptotic cell death is DNA strand breakage. This study used the TUNEL assay to detect apoptotic cells because the TUNEL reaction preferentially labels DNA strand breaks generated during apoptosis. The study found a substantial number of TUNEL-positive cells and a 37% and 35% increase in apoptotic cells in the liver and kidney, respectively, in the diabetic state caused by alloxan. However, administration of ascorbic acid and MFE lowered the number of TUNEL-positive cells in diabetic mice’s liver and kidney tissues, indicating reduced apoptosis. As a result, the findings of the TUNEL assay may be corroborated by the study’s western blot analysis of apoptosis-associated proteins.
To observe the effect of MFE apoptotic cell death, caspase three and Bcl-2 protein expression in mice’s hepatocytes and renal tissues were studied. In the current study, diabetic mice had lower Bcl-2 expression and higher caspasethree3 expressions. Diabetic mice treated with ascorbic acid and MFE showed reduced caspase three expressions and increased Bcl-2 expression. Thus, the study’s TUNEL assay and western blot analysis results indicate the anti-apoptotic nature of MFE against hyperglycemia-induced oxidative stress apoptosis. However, ascorbic acid was taken as a positive control for conducting all the experiments. A similar outcome was observed, implying that ascorbic acid could be the active compound, as its presence was confirmed in the HPTLC method.
Phytochemicals are essential components, specifically for their role as antioxidants [43]. ROS generated during hyperglycemic conditions are molecules that are unstable in nature and thus create oxidative stress. Antioxidants neutralize these unstable molecules by losing some of their own electrons. HPTLC of MFE revealed the presence of two phytochemicals, ascorbic acid, and Naringenin. Ascorbic acid, an antioxidant, works by donating a single reducing equivalent, forming monodehydroascorbate, which is radical in nature, and monodehydroascorbate reacts preferentially with radicals instead of non-radical compounds [44]. Ascorbic acid has also been proven to regenerate the antioxidant form of vitamin E to protect the membrane and hydrophobic compartments from damage. Further, a resident of hydrophobic compartments, reduced coenzyme Q, interacts with vitamin E to regenerate its antioxidant form [45]. Naringenin is a flavonoid that prevents injury caused by free radicals, where radicals oxidize flavonoids. In the process, the radical becomes a more stable and less-reactive form. The high reactivity of the hydroxyl group of flavonoids makes radicals inactive. This potential mechanism of the phytochemicals in MFE could be the combined effect in its therapeutic diabetes treatment. The confirmed mechanism needs to be studied in the future [46].
In conclusion, it can be inferred from the study that DI extract possesses free radical scavenging properties giving insights regarding its antioxidative and anti-apoptotic effects in alloxan-induced diabetic mice. The bioactivity of DI in the study presents opportunities as a potential source of therapeutic agents for treating diabetes and its associated complications.
DM, Diabetes mellitus; ROS, Reactive oxygen species; Apaf-1, Apoptosis protease activating factor-1; MFE, Methanolic fruit extract of Dillenia indica; FBGL, Fasting blood glucose levels; HPTLC, High-Performance Table Liquid Chromatography; GLUT 4, Glucose Transporter 4; IEC, Institutional Ethics Committee; SDS, Sodium dodecyl sulfate; TBS, Tris-buffered saline; TTBS, Tween Tris-buffered saline; HRP, hydrogen peroxidase; TEM, Transmission Electron Microscope; TUNEL, Terminal deoxynucleotidyl transferase (TdT)-mediated dUTP nick-end labeling.
All applicable data and materials are included in the manuscript.
PS and JB designed the study, made the first draft, and updated the manuscript, data curation, and experiment. SM designed the study, made the first draft, updated the manuscript, a reviewed the final draft. DS designed the study and updated the manuscript. SB designed the study, made the first draft, data curation, and reviewed the final draft, critically reviewed and approved the final draft, Funding acquisition. AH updated the manuscript and data curation. SR made the first draft and critically reviewed the final draft. NSS updated the manuscript and data curation. SH updated the manuscript, critically reviewed it, and approved the final draft. NS updated the manuscript and data curation. AGA reviewed and made the first draft, updated the manuscript, reviewed the final draft, data curation, reviewed the final draft funding acquisition. All authors contributed to editorial changes in the manuscript. All authors read and approved the final manuscript.
The study protocol was approved by the Institutional Ethics Committee (Animal model), North Eastern Hill University, Shillong, Meghalaya, India.
The authors would like to acknowledge the Department of Biochemistry, NEHU, Shillong, India, for providing infrastructural support. We also thank the Sophisticated Analytical Instrument Facility (SAIF), NEHU, Shillong, for the TEM analysis.
This research was funded by DST-INSPIRE FELLOWSHIP, fellowship number IF140147.
The authors declare no conflict of interest.
References
Publisher’s Note: IMR Press stays neutral with regard to jurisdictional claims in published maps and institutional affiliations.