


 , She Chen 1,*
1 Key Laboratory of Glycoconjugate Research Ministry of Public Health, Department of Biochemistry and Molecular Biology, School of Basic Medical Sciences, Fudan University, 200032 Shanghai, China
2 Department of Gastroenterology and Hepatology, Shanghai Institute of Liver Diseases, Zhongshan Hospital, Fudan University, 200032 Shanghai, China
Abstract
Background: Src family kinases (SFKs) belong to the non-receptor protein tyrosine kinase family and are generally dysregulated in a variety of tumors. This study aimed to thoroughly investigate the mutation status, expression level, prognostic value and relationship with immune infiltration of SFKs in hepatocellular carcinoma (HCC). Methods: TIMER2.0, UALCAN, cBioPortal, Gene Expression Profiling Interactive Analysis (GEPIA) and Kaplan-Meier Plotter were used to analyze the differential expression, genetic alteration, prognostic value and immune cell infiltration of SFKs in HCC patients. Furthermore, we used quantitative real-time PCR (qPCR) and western blot (WB) analysis to measure SFKs mRNA and protein expression in matching specimens of normal tissue and HCC. We analyzed the biological effects of FYN in Huh7 cells and subcutaneous xenograft tumor model. We also studied the biological effects of SRC on Huh7 cells. Results: The mRNA expression levels of LYN, SRC and SRM were elevated in HCC tissues, whereas FYN was reduced. Approximately 10% genetic alterations rate of SFKs was observed in HCC. The mRNA levels of BLK, BRK, FRK, FYN, LCK, LYN, SRC, SRM and YES were correlated with clinical cancer stage. Elevated FYN mRNA levels in HCC were positively correlated with overall survival (OS), whereas SRC was negatively correlated with OS. All SFKs members in HCC were significantly associated with at least half of the six immune-infiltrating cells, including B cells, macrophages, dendritic cells, neutrophils, CD4+ T cells and CD8+ T cells. Furthermore, we confirmed that the protein expression level of FYN was decreased in patients with HCC and in a human hepatoma cell line. Overexpression of FYN suppressed Huh7 cell proliferation, migration, invasion, and tumorigenesis in xenograft nude mice. Knockdown of SRC inhibited Huh7 cell proliferation, migration and invasion. Conclusions: Dysregulated FYN and SRC expression in HCC is associated with poor prognosis and may be used as novel prognostic biomarkers in patients with HCC.
Keywords
- hepatocellular carcinoma
- Src family kinases
- prognosis
- immune infiltration
- prediction biomarkers
Primary liver cancer is the sixth most commonly diagnosed cancer and the third leading cause of cancer death worldwide in 2020 [1]. Hepatocellular carcinoma (HCC) comprises 75%–85% of primary liver cancer cases [1]. Although surgical resection with curative potential is the most effective treatment, the high recurrence and incidence of HCC metastasis have hindered improved survival [2]. The identification of novel prognostic and therapeutic predictors is of great clinical interest.
Src family kinases (SFKs) belong to the non-receptor protein tyrosine kinase family and eleven family members have been reported [3]. SFKs mostly share a similar structure: a Src homology (SH) 4 domain, a unique region, a SH3 domain, a SH2 domain, a catalytic (SH1) domain, and a C-terminal regulatory tail [4, 5]. The four closely related group I enzymes consist of FGR, FYN, SRC and YES, and group II enzymes are made up of BLK, HCK, LCK, and LYN. Group III enzymes, which are distantly correlated with these two groups, include BRK, FRK and SRM [6]. SFKs are involved in signal transduction pathways triggered by a diverse set of cell surface receptors, including receptor tyrosine kinases, cytokines, immune cell receptors, growth factors, integrins and G-protein-coupled receptors [7, 8, 9]. Evidence suggests that changes in SKFs protein expression and/or kinase activity are related to the development of multiple types of cancer [10, 11], such as colorectal cancer [12], breast cancer [13], gastric cancer [14], melanoma [15], ovarian cancer [16], lung cancer [17], hematological malignancies [18] and hepatocellular carcinoma [19]. However, the prognostic roles of SFKs and their functions in the immune microenvironment of HCC remain unknown.
The tumor microenvironment (TME) in HCC is a complex mixture of tumor cells within the extracellular matrix, combined with a complex mix of stromal cells (immune cells, angiogenic cells, cancer-associated fibroblastic cells) and the proteins they secrete [20]. Immune cells have been shown to play a vital role in HCC [21]. Immune cells in the HCC microenvironment are considered important determinants of clinical outcomes and response to immunotherapy [22]. Early tumor infiltration by immune cells such as CD8+ T and B cells is key to inhibit HCC development. However, the anticancer immune response generated by these cells is suppressed by the action of immunosuppressive cells, such as M2 macrophages, which are intrinsically linked to facilitate the HCC TME [23]. Modulation of TME signaling and molecules is a potential strategy for HCC prevention and treatment.
In this study, we systematically explored SFKs in HCC using bioinformatics analysis combined with verification experiments in HCC cell lines, tissues, and a mouse model. We found that dysregulated FYN and SRC expression in HCC is associated with poor prognosis. Overexpression of FYN suppressed Huh7 cell proliferation, migration, invasion, and tumorigenesis in xenograft nude mice. Knockdown of SRC inhibited Huh7 cell proliferation, migration and invasion. Certain SFKs members, such as FYN and SRC might sever as novel prognostic biomarkers for HCC.
Twenty pairs of HCC and matched peritumor liver tissues were collected from patients who underwent surgical resection and were pathologically diagnosed with HCC at Zhongshan Hospital, Fudan University (Shanghai, China), and used to detect the mRNA and protein expression levels of SFKs by quantitative real-time PCR (qPCR) and western blot (WB). The clinical characteristics of the 20 resected patients with HCC were shown in Supplementary Table 1. This study was approved by the Research Ethics Committee of Zhongshan Hospital, Fudan University, and informed consent was obtained from each patient before use.
TIMER2.0 (http://timer.comp-genomics.org/) is a comprehensive
tool that provides modules for systematic analysis of immune infiltrates and gene
expression across multiple cancer types [24]. The Cancer
Genome Atlas (TCGA) samples were used by this tool for data analysis.
We compared the expression levels of SFKs
between tumor and normal tissues in multiple cancers via the
‘Gene
UALCAN (http://ualcan.path.uab.edu/index.html) is a free
web resource for analyzing cancer OMICS data (TCGA, CPTAC and
CBTTC) [25]. UALCAN allows users to perform gene expression analysis and identify
biomarkers, as well as graphs representing expression profiles and patient
survival information. The transcriptional expression of SFKs
and their relationship with HCC stage and prognosis were analyzed through this
website using TCGA dataset. The significance of the difference in the
transcriptional levels was assessed by Student’s
t-test, and p-value
cBioPortal (https://www.cbioportal.org/) is an open access tool for research, visualization, and analysis of multidimensional cancer genomic data [26]. The tool integrates data from 126 tumor genome studies, including large tumor studies such as TCGA, covering data from 28,000 samples, some of which also include clinical prognostic and phenotypic information. In this study, the genetic alterations in SFKs and their relationship with mRNA expression were obtained from cBioPortal based on the HCC dataset including 973 patients (TCGA, 372 samples; three studies, 601 samples).
The Kaplan-Meier plotter
(https://kmplot.com/analysis/), an online tool that contains gene expression data
and survival information of 21 cancer types, was used to assess the effect
of SFKs mRNA levels on the overall survival (OS) of patients with HCC [27]. The
resources used by this tool for HCC survival analysis were sourced from TCGA
database. Information on the number-at-risk case, median mRNA expression level,
hazard ratio (HR), 95% confidence interval (CI), and
p-value were displayed on the Kaplan-Meier plotter
web page. Statistical significance was considered when the
p-value was
GEPIA (http://gepia.cancer-pku.cn/index.html) is an interactive web application
that provides fast and customizable functions based on TCGA and Genotype Tissue
Expression (GTEx) data [28]. OS analysis of
SFKs based on gene expression was achieved through GEPIA using these samples
(TCGA, 369 tumor samples, 50 normal samples; GTEx, 110 samples). The log-rank
test was used for hypothetical tests. The median expression level was used to
divide the high- and low-expression cohorts. The Cox proportional HR and 95% CI
information were included in the survival plot. p
The HCC cell line Huh7 was obtained from Shanghai Cell Bank, Type Culture
Collection Committee, Chinese Academy of Sciences. Huh7 was cultured in DMEM
medium (#D6429, Sigma-Aldrich, Taufkirchen, Germany) supplemented with 10% fetal bovine
serum (Gibco, Carlsbad, CA) at 37 °C in a humidified incubator with 5% CO
Full-length cDNA of FYN or SRC were cloned into the empty lentiviral vector pCDH-CMV-MCS-EF1-Puro. Recombinant plasmids (psPAX2 and pMD2.G) were co-transfected into 293T cells using Lipofectamine 3000 (Invitrogen, Carlsbad, CA). The lentivirus was collected from the complete medium two days after transfection.
To establish stably overexpressing cell lines, an appropriate amount of virus was added to Huh7 cells, followed by puromycin selection 48 h later. To establish knockdown cells, small interfering RNA (siRNA) targeting FYN (siFYN: GGUGGAUACUACAUUACCA) and SRC (siSRC: GAAUCUGAUCAACAGUUUAUU) was used in huh7 cells. The overexpression and knockdown efficiencies of FYN and SRC were verified by WB.
Total RNA was extracted from 20 pairs of HCC and matched peritumor liver tissues
using the RNA-easy Isolation Reagent (#R701-01, Vazyme, Nanjing, China). RNA was
reverse-transcribed into cDNA using the HiScript® II Q RT
SuperMix for qPCR (+gDNA wiper) kit (#R223-01, Vazyme, Nanjing, China). For
qPCR, the ChamQ Universal SYBR qPCR Master Mix kit (#Q711-02, Vazyme, Nanjing,
China) was used according to the manufacturer’s instructions. DNA amplification
and detection were performed using a 7900 Sequence Detection System (Applied
Biosystems, Foster City, CA). The primer sequences used are listed in SupplementaryTable 2. Relative gene expression levels were calculated using the
2
Total proteins were extracted in RIPA lysis buffer, separated by 10% sodium
dodecyl sulfate-polyacrylamide gel electrophoresis (SDS-PAGE), and
electrotransferred onto polyvinylidene fluoride (PVDF) membranes. The membrane
was blocked with 5% nonfat milk for one hour at room
temperature and then incubated with primary antibody (
Huh7 cells were seeded in 96-well plates at 10
For the colony formation assay, Huh7 cells were seeded in 6-well plate at
10
Transwell assays were performed in chambers with a pore size of 8
BALB/c-nude mice (4–6 weeks, male) were purchased from the Shanghai SLAC
Laboratory Animal Co., Ltd (Shanghai, China) and maintained under pathogen-free
conditions. To establish the subcutaneous xenograft tumor model, the mice were
randomly divided into the control group (n = 6) and the FYN overexpression group
(n = 6). Cell suspensions (5
Transcriptional expression levels of SFKs in HCC and matched normal tissues from
the TIMER2.0 database were analyzed using the
Wilcoxon test, and those from the UALCAN database and qPCR experiments were
assessed using the Student’s t-test. The Student’s
t-test was also used to analyze the relationship between the
expression levels of SFKs and HCC stages. The effect of SFKs
mRNA expression on the survival of patients with HCC was evaluated using the
log-rank test. A partial Spearman’s correlation was used to perform an
association analysis between SFKs expression levels and immune cells. GraphPad
Prism (version 8.3.0, Dotmatics, Boston, MA, USA) was used for statistical analysis and figure creation. Cell
proliferation, migration, invasion, tumor volume, and tumor weight were analyzed
using the Student’s t-test. p
The working flow chart depicted in Fig. 1 and the clinical characteristics of HCC patients in each dataset shown in Supplementary Table 3. We first used TIMER2.0 tool to explore the expression of SFKs in multiple cancers, including HCC (Fig. 2A). The data revealed that the transcriptional levels of SFKs were frequently abnormal in many types of cancer. In HCC, LYN, SRC and SRM were significantly elevated in HCC tissues compared to normal tissues, while BLK, FGR, FYN and HCK were reduced. Other members, including BRK, FRK, LCK and YES, showed no significant differences in HCC. We next utilized the UALCAN website to verify seven SFK genes with altered mRNA expression levels (Fig. 2B). The results indicated that the expression levels of LYN, SRC and SRM were significantly higher in HCC tissues than in normal tissues, and the expression levels of FYN were markedly lower. However, the changes in the expression levels of BLK, FGR and HCK were not statistically significant. These results were partly consistent with those obtained using TIMER2.0.
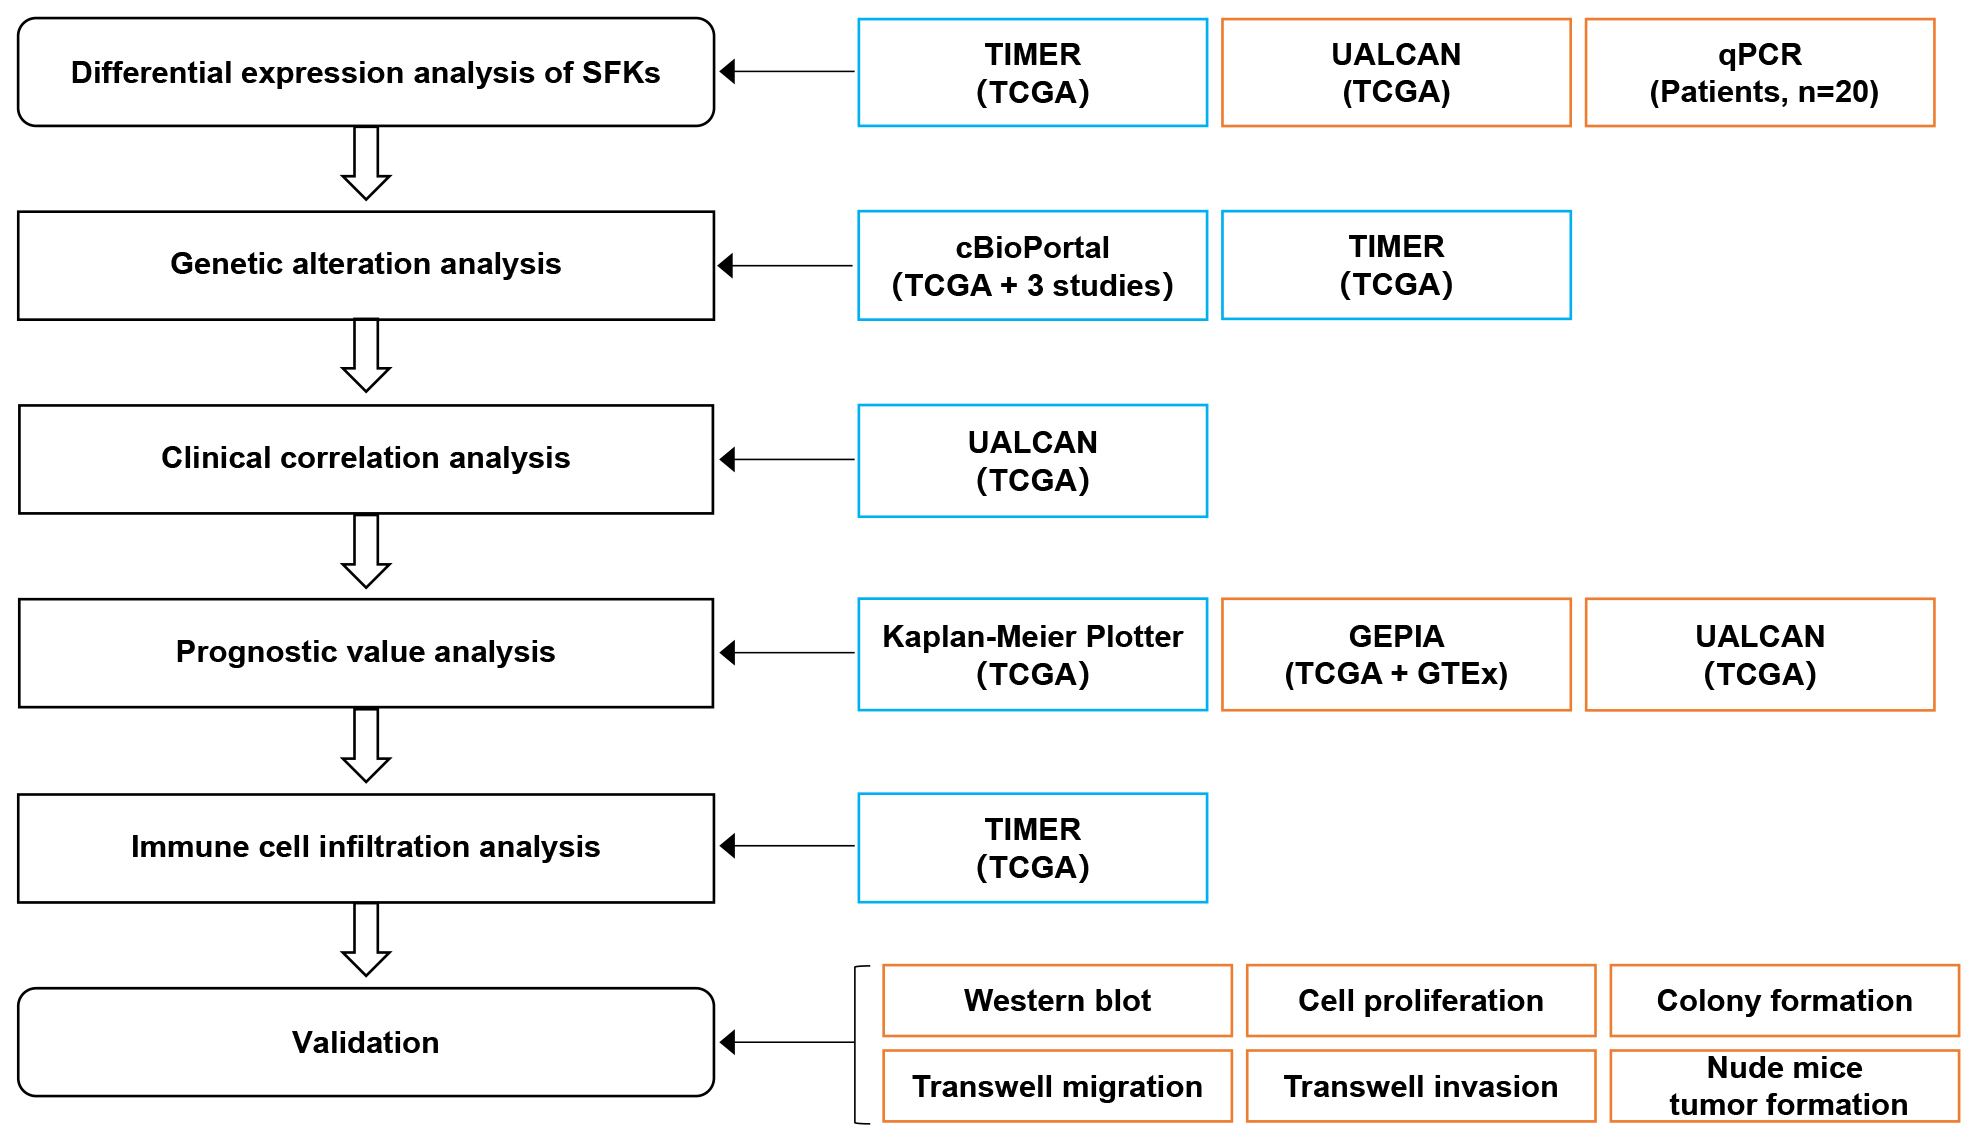 Fig. 1.
Flow chart of the study. Blue, discovery cohort; Orange, validation cohort and experiments. The sample sources used by each analysis tool are shown under the tool.
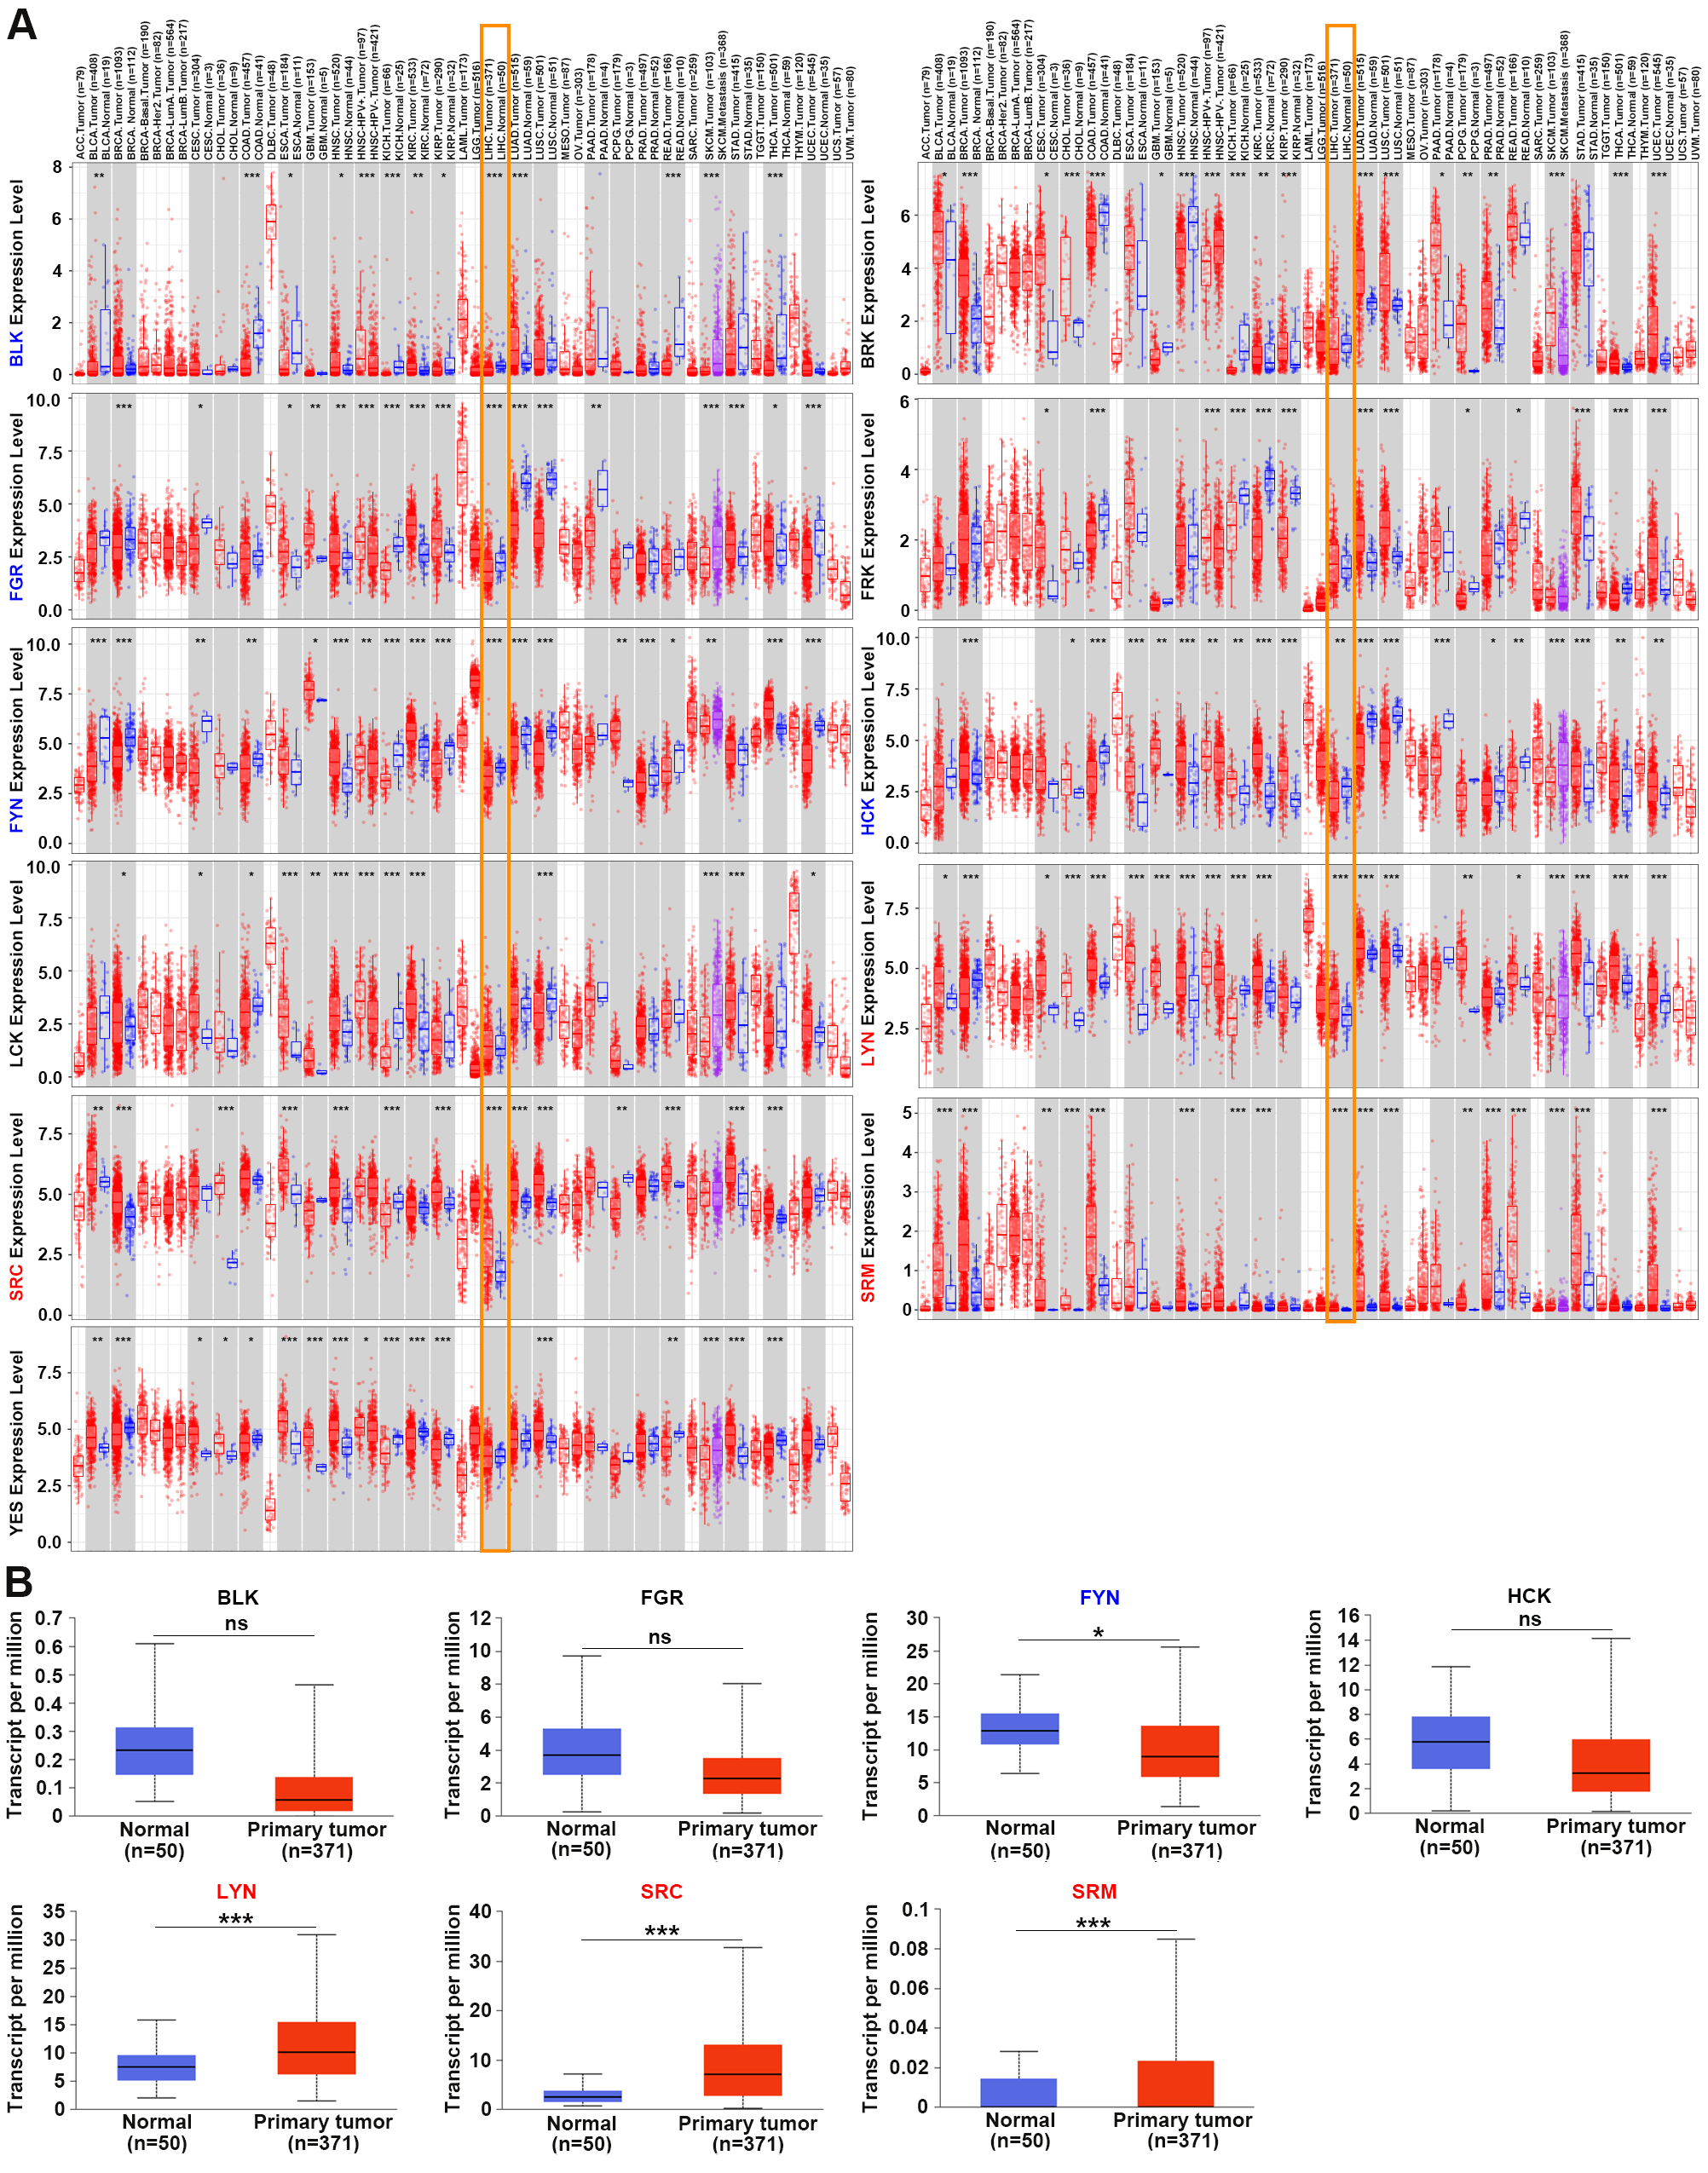 Fig. 2.
The mRNA levels of Src family
kinases (SFKs) in various types of cancer including Hepatocellular Carcinoma
(HCC). (A) The mRNA expression data analysis from TIMER2.0
indicated that the mRNA levels of BLK, FGR, FYN and
HCK were significantly down-regulated in HCC tissues, while
LYN, SRC and SRM were up-regulated. *p
To further verify the above results, we detected the mRNA expression levels of SFKs in 20 pairs of HCC and matched peritumor liver tissues using qPCR (Fig. 3). The results revealed that the expression levels of LYN, SRC and SRM were upregulated, and FYN was downregulated, whereas other SFK members did not show notable differences in HCC. The qPCR results were largely in agreement with the common parts of the TIMER2.0 and UALCAN.
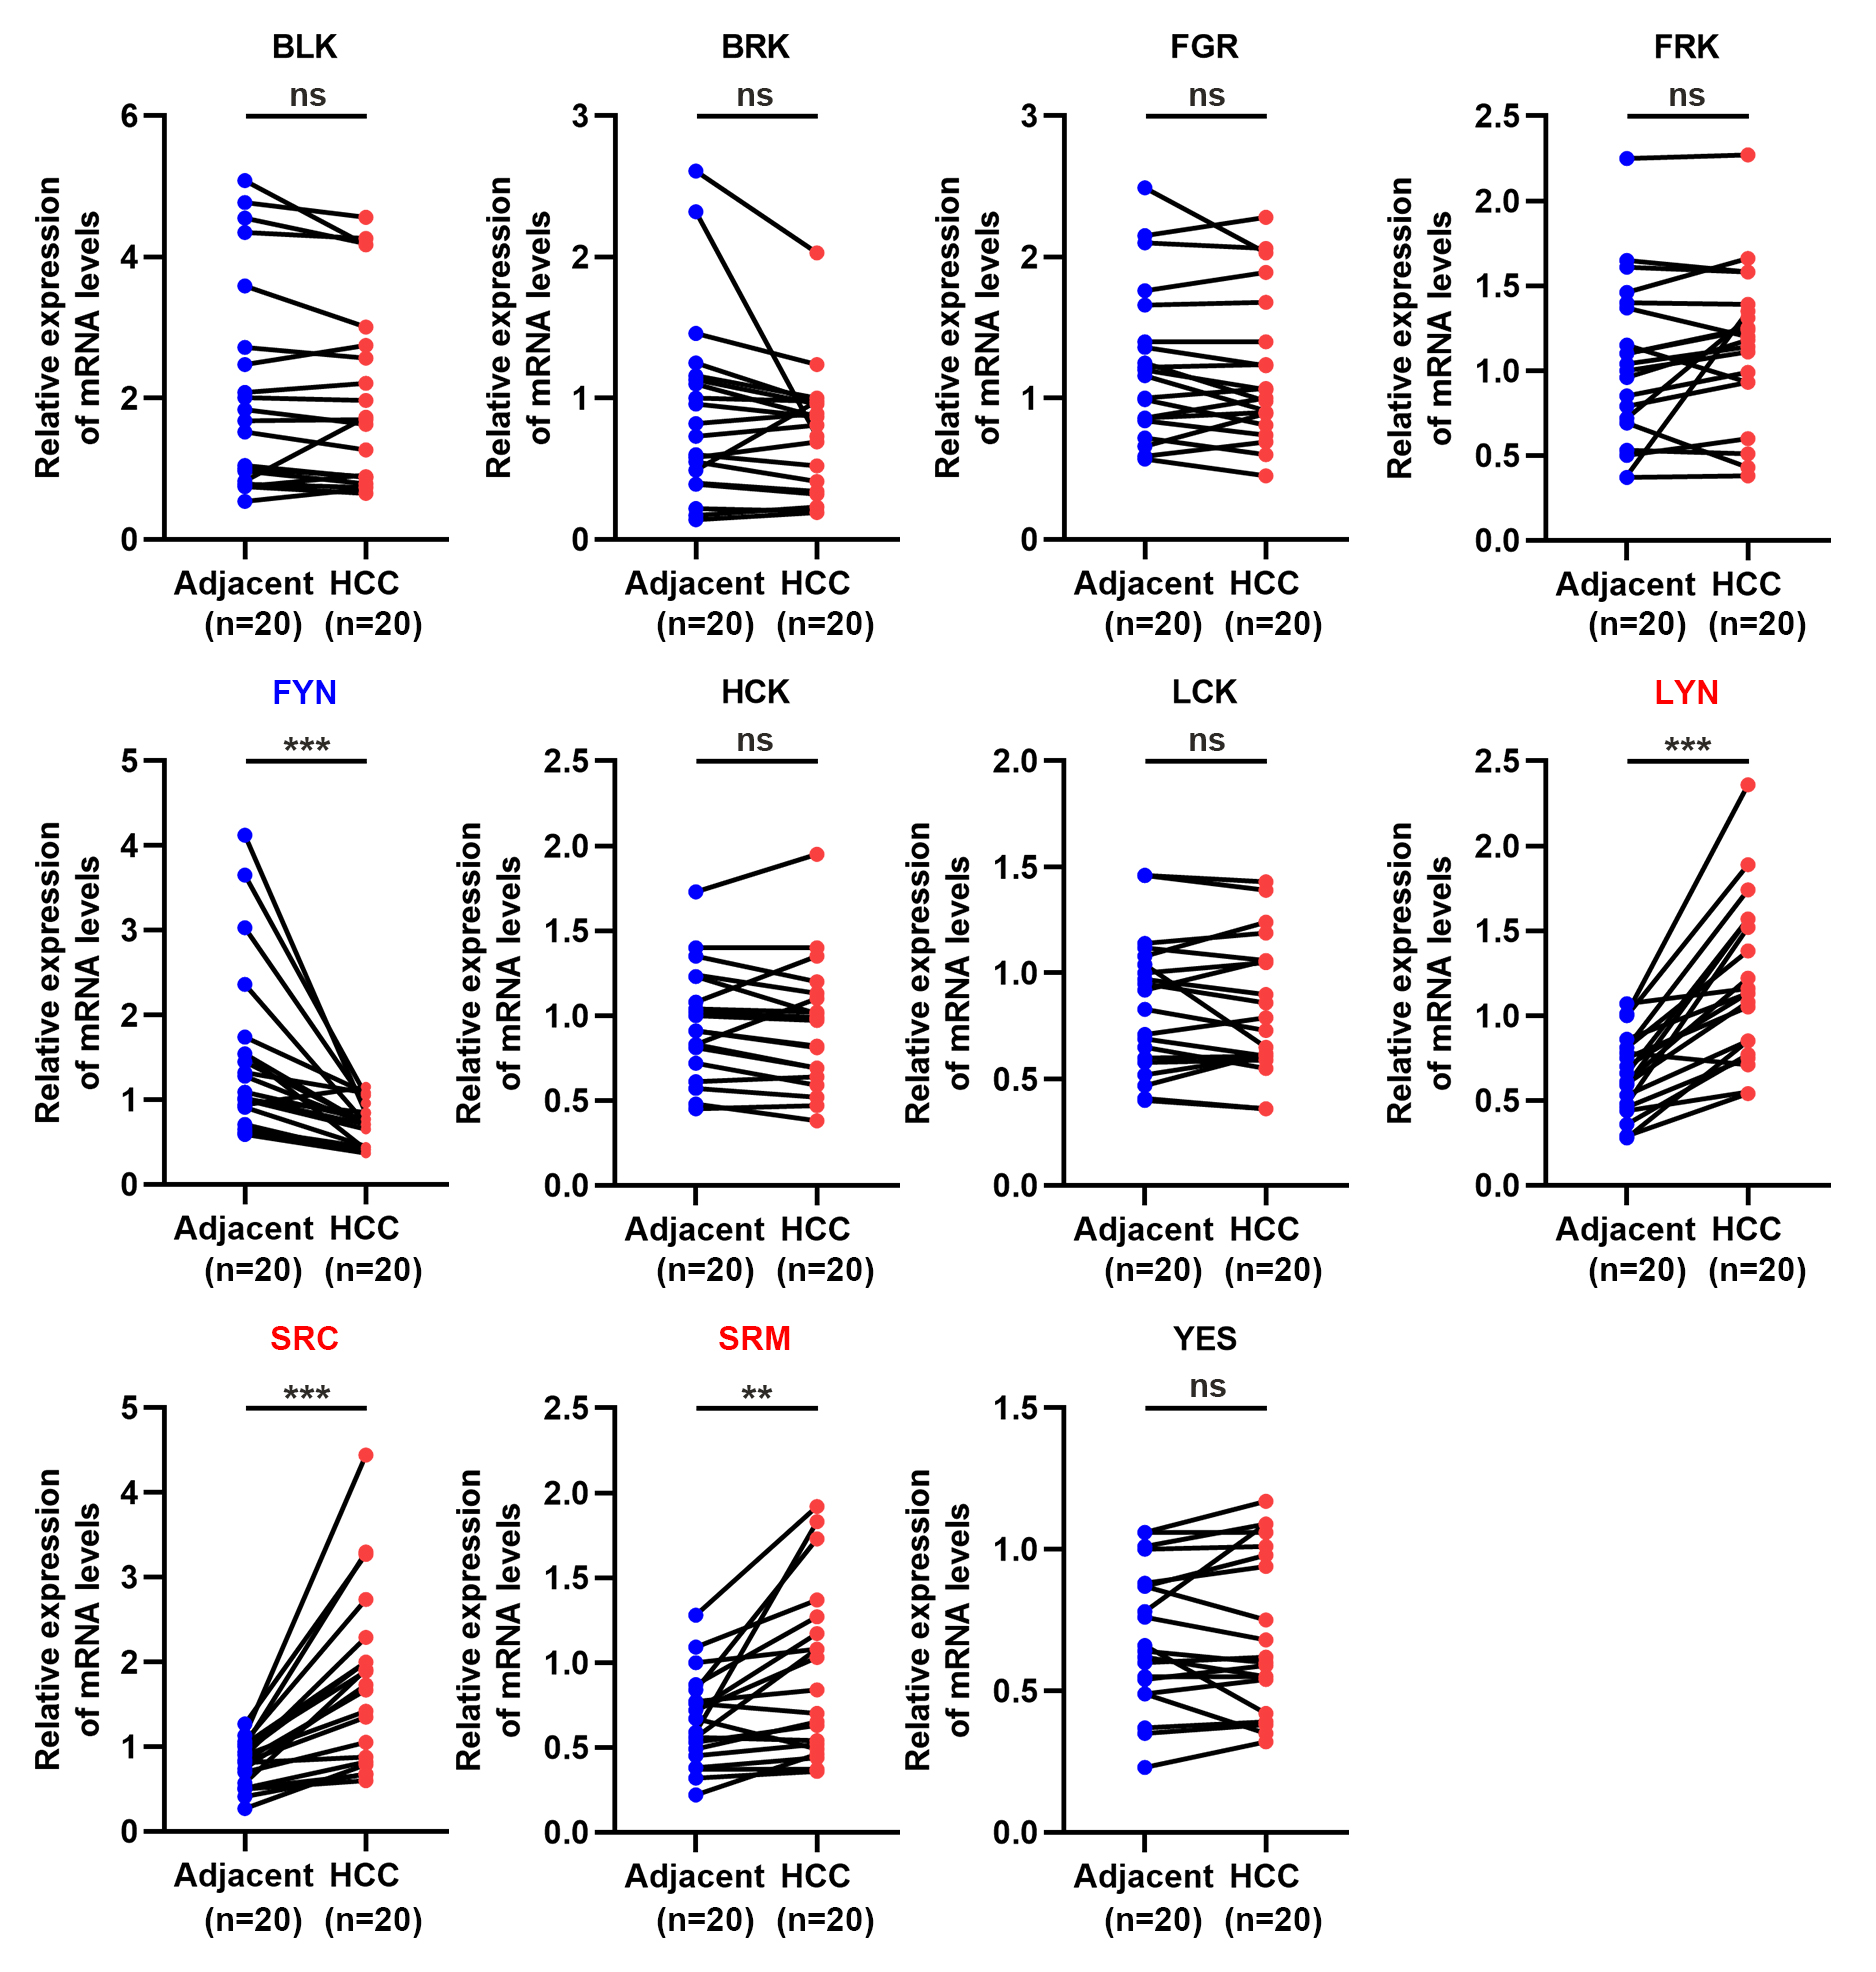 Fig. 3.
The relative SFKs mRNA level in 20 paired HCC and adjacent
nontumor tissues. Quantitative real-time PCR (qPCR) assay were employed to
measure the mRNA levels in tissues. Relative expression of SFKs
was normalized with GAPDH. Compared to adjacent normal tissues, the
expression levels of FYN were reduced, but LYN, SRC
and SRM were elevated in HCC. n = 20. ns, not significant, **p
We then investigated the genetic alterations of SFKs in patients with HCC using the cBioPortal and TIMER2.0 databases. As shown in Fig. 4A, alterations in the frequencies and types of SFKs were determined in 973 samples from four HCC studies. The SFKs mutations, amplifications, deep deletions, and multiple alterations in 973 HCC samples occurred at 10.08%, with frequencies of 3.08% (30 cases), 3.60% (35 cases), 3.19% (31 cases) and 0.21% (2 cases), respectively. The percentages of gene changes in individual SFKs in HCC were displayed in Fig. 4B, and the mutation frequency ranged from 0.4% to 4% (BLK, 3%; BRK, 0.7%; FGR, 0.6%; FRK, 0.8%; FYN, 1.3%; HCK, 0.4%; LCK, 0.6%; LYN, 4%; SRC, 0.7%; SRM, 1.1%; YES, 0.8%).
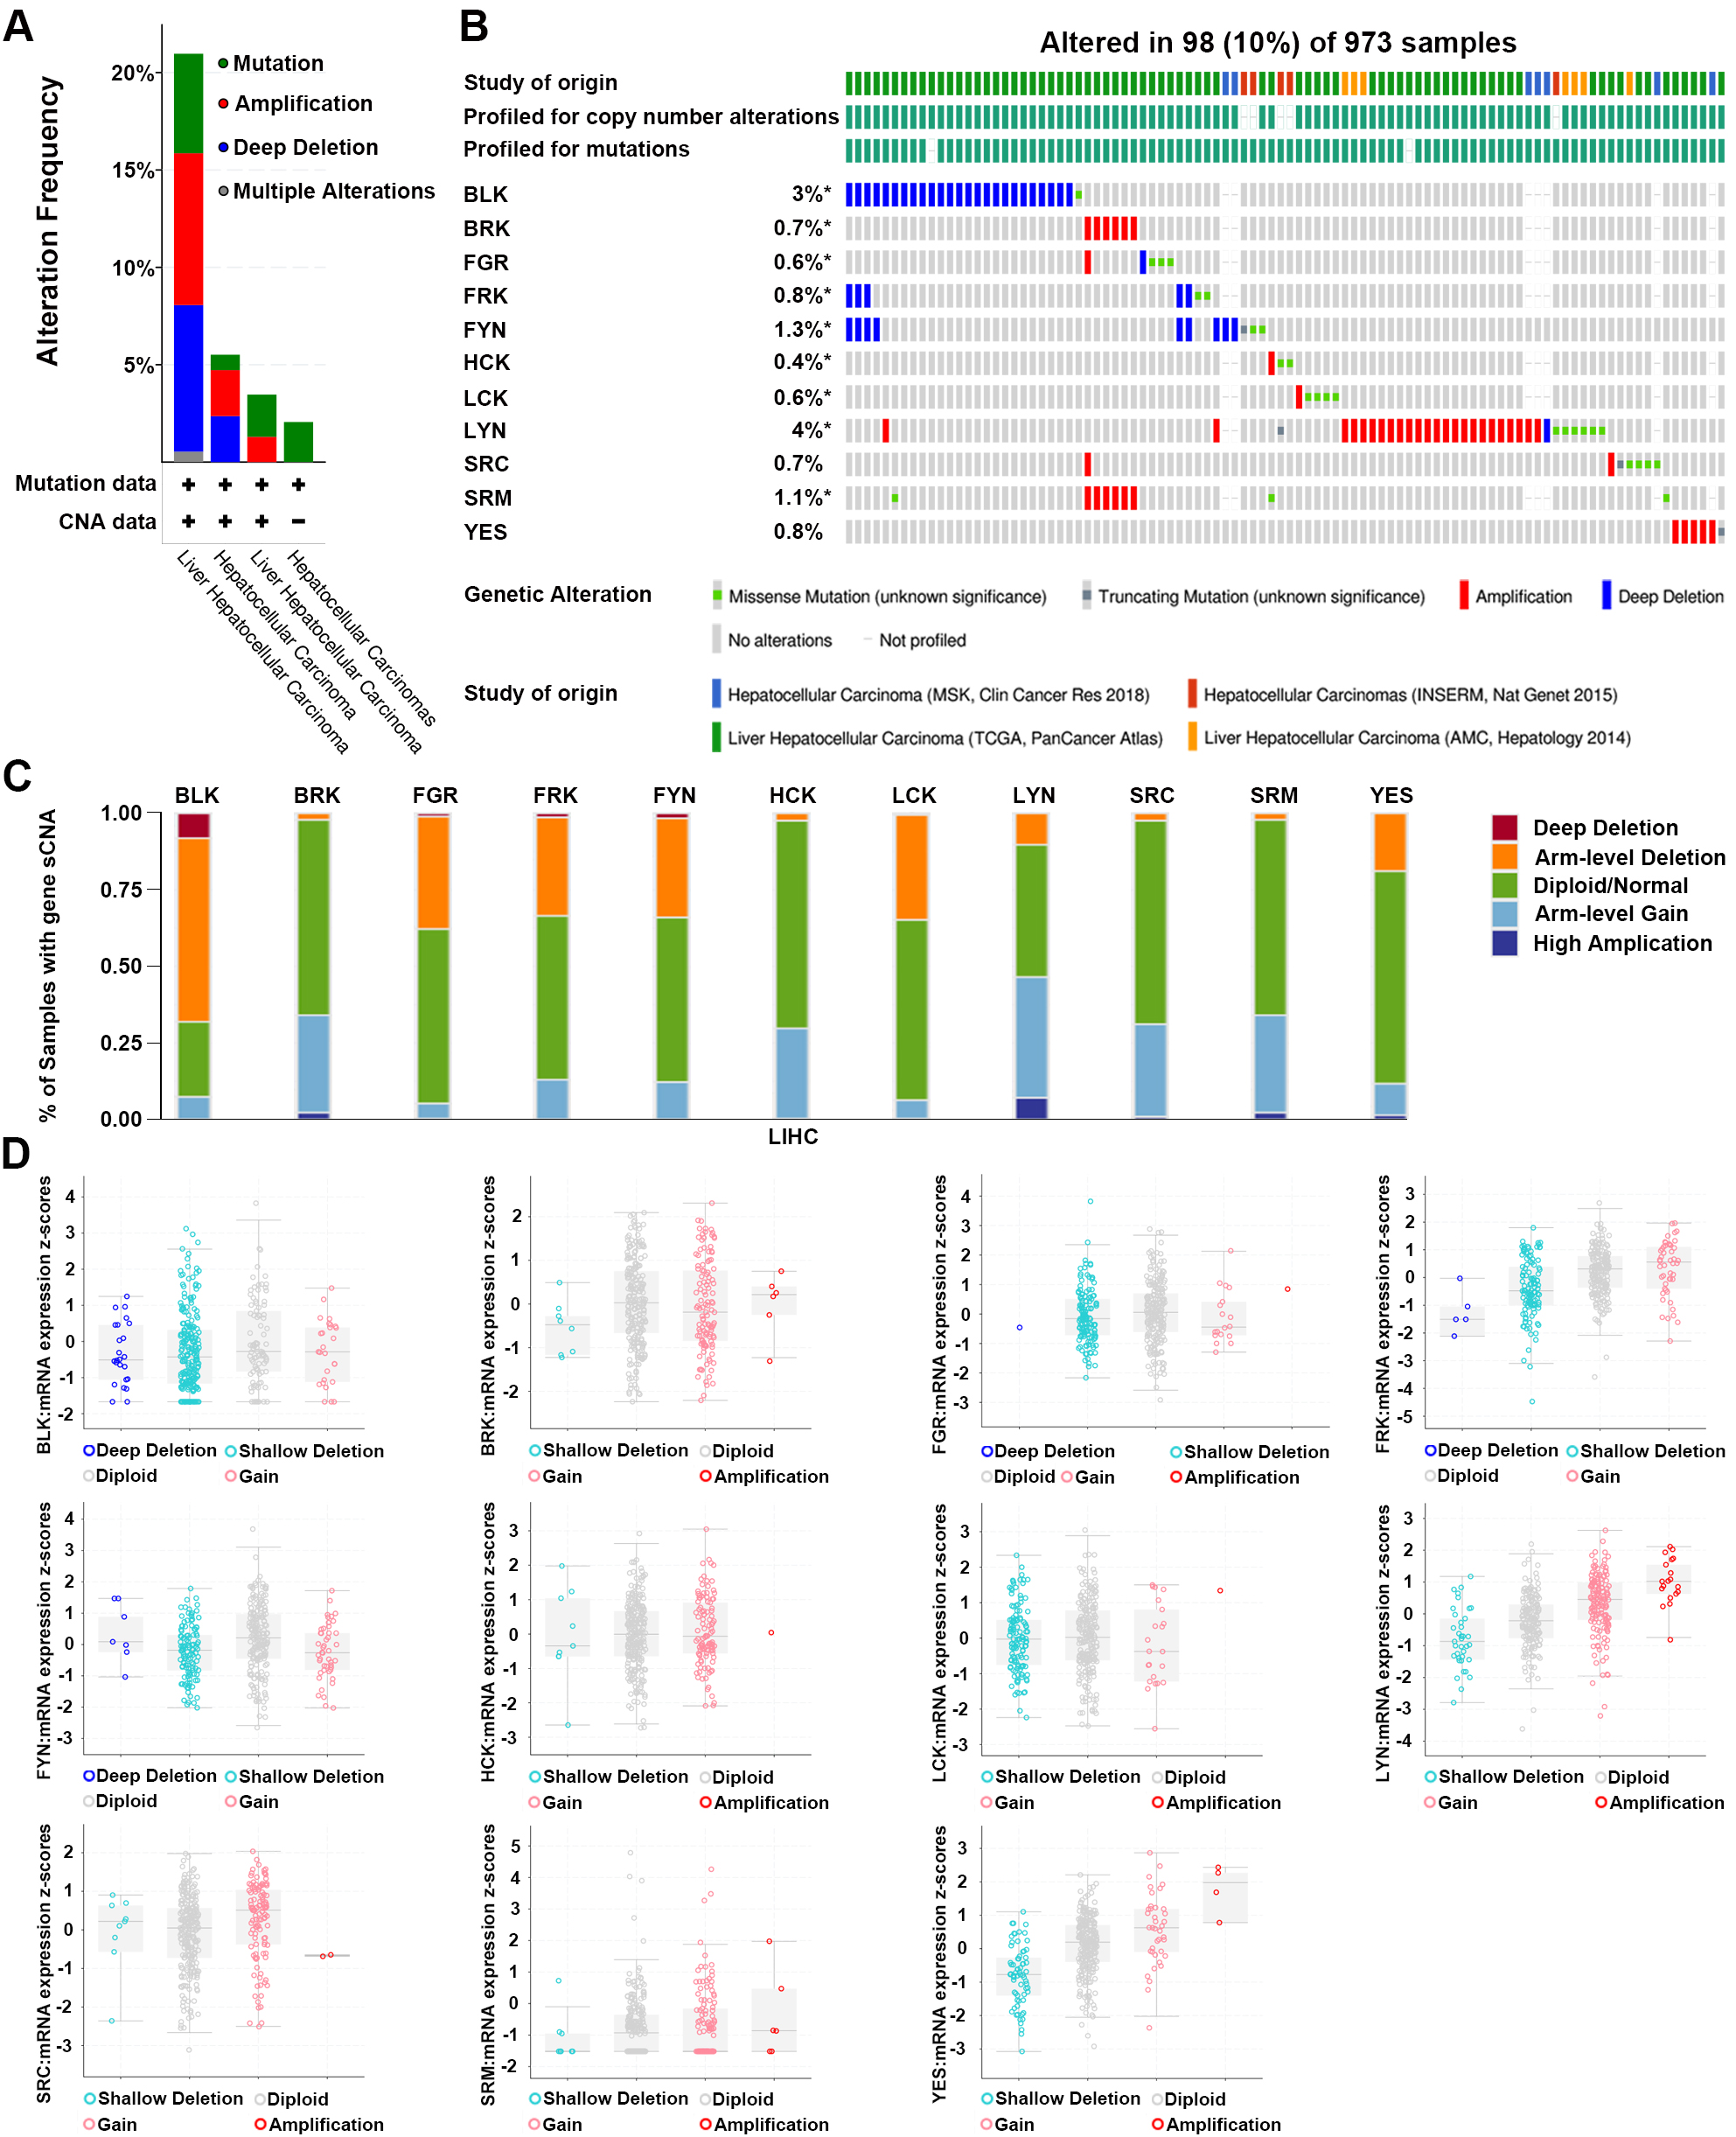 Fig. 4.
Genetic alteration of SFKs genes in
HCC. (A,B) The genetic alteration type and frequency of
different expressed SFKs in different HCC datasets
(cBioPortal). SFKs were altered in 98 samples of 973 patients with HCC,
accounting for 10%, *p
Next, the stacked bar plot from TIMER2.0 showed the relative proportion of different sCNA states of SFKs in HCC patients (Fig. 4C). Arm-level deletion and arm-level gain were the primary sCNA states, and arm-level deletions were observed mainly in BLK, FGR, FRK, FYN, LCK and YES, whereas arm-level gain was detected in BRK, HCK, LYN, SRC and SRM.
Furthermore, we explored the relationship between gene alterations and mRNA expression in the 973 HCC samples (Fig. 4D). The decrease in the mRNA expression level of FYN might be partly caused by the deep or shallow deletion of genes. The gain or amplification of genes could explain the increased mRNA expression levels of LYN, SRC and SRM. Combined with the above data, we speculated that genetic alterations in SFKs might lead to changes in mRNA expression.
We then assessed the correlation between SFKs mRNA expression and pathological stage in HCC using the UALCAN website. As shown in Fig. 5, SRC was highly expressed in HCC stage 1–3 compared to that in normal tissues, and BRK, FRK, FYN, LYN and SRM were differentially expressed in several tumor stages. In comparison to normal tissues, the expression levels of BLK, LCK and YES were diverse in certain tumor stages, but there was no difference in the expression levels of FGR and HCK in different tumor stages.
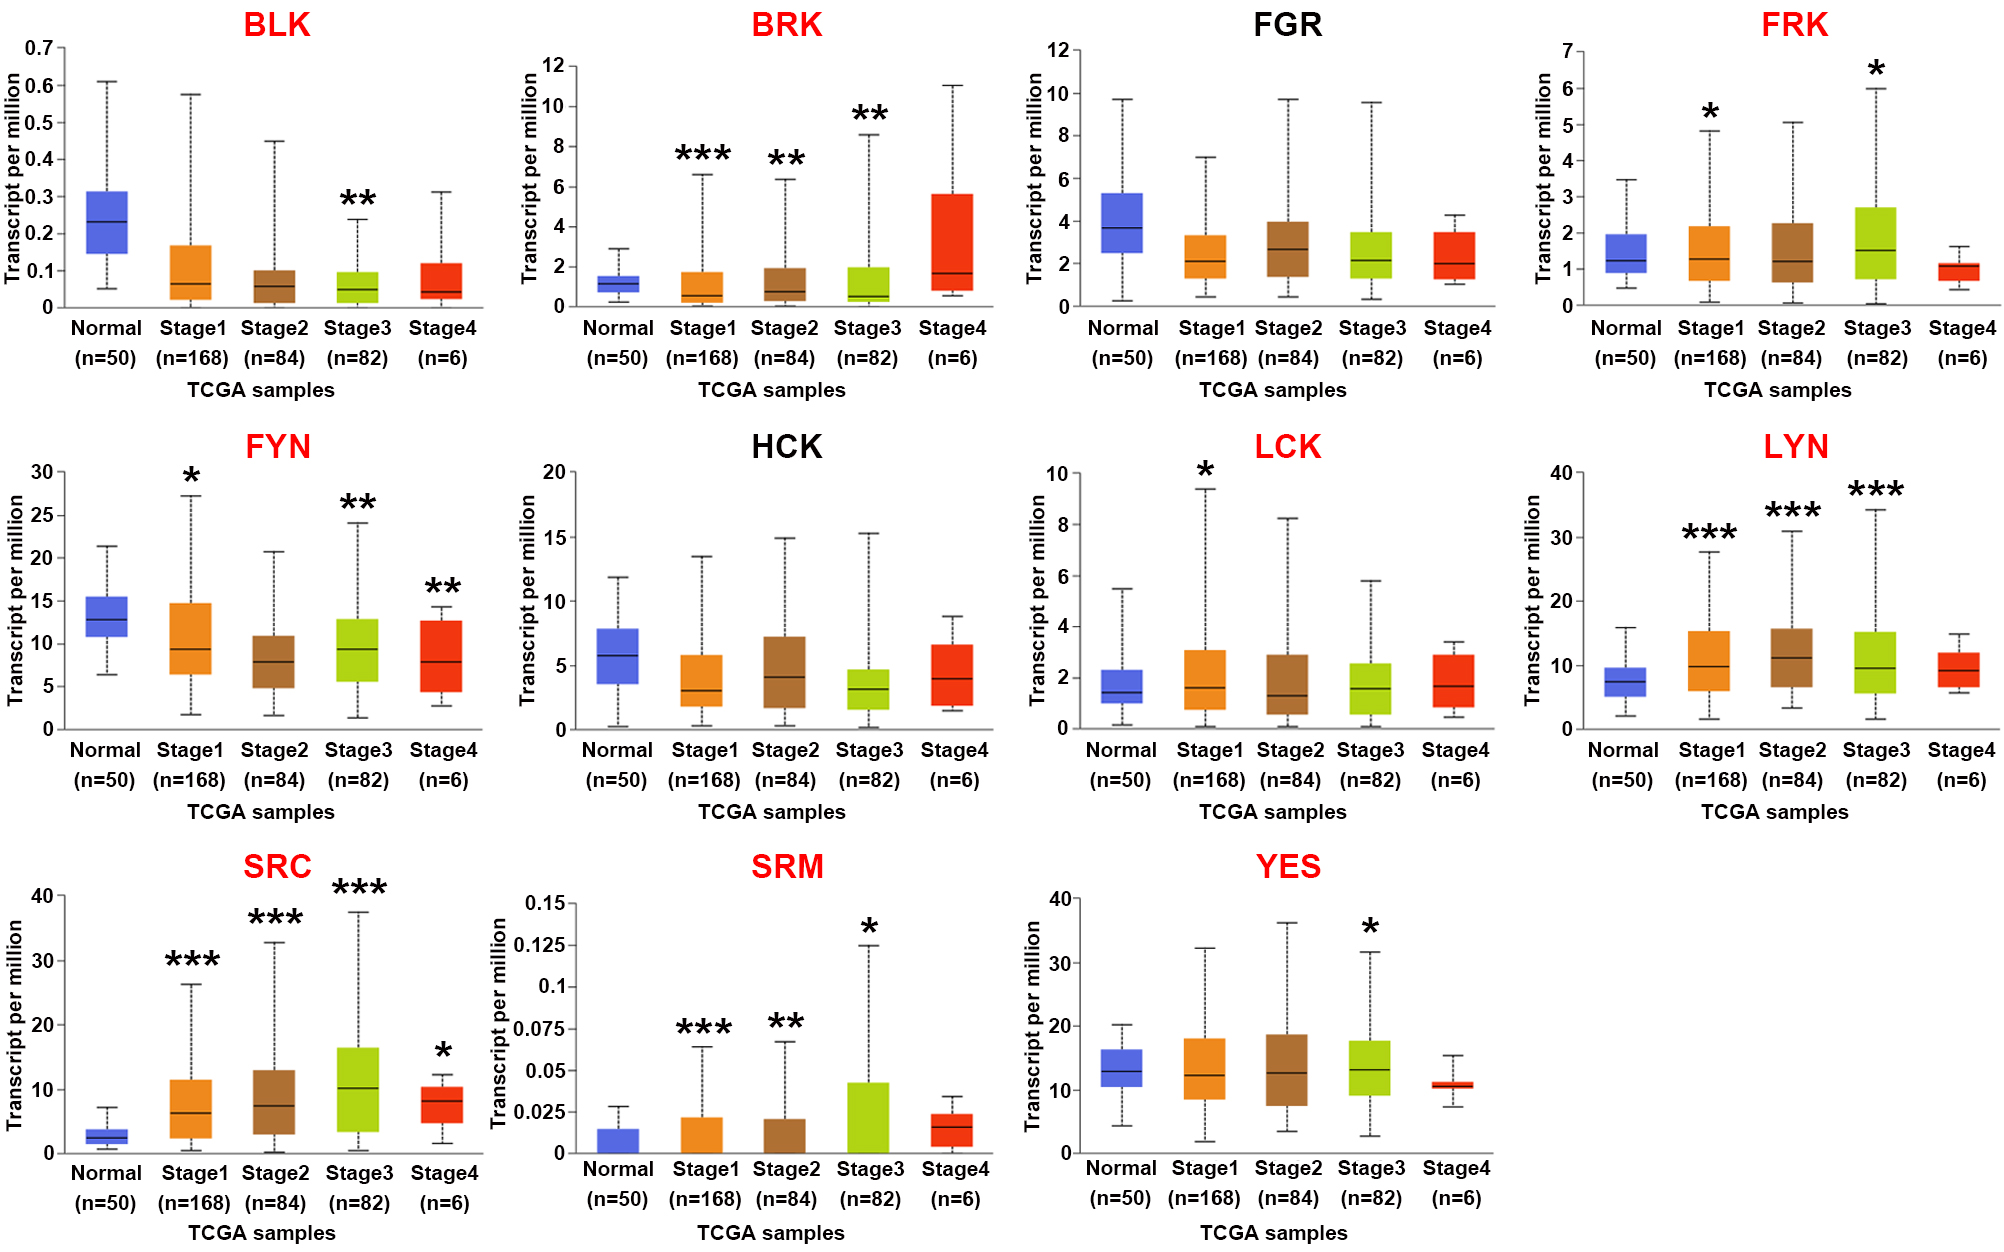 Fig. 5.
Correlations between SFKs expression and tumor stage in HCC
patients. Histogram (UALCAN) showed that BLK,
BRK, FRK, FYN, LCK, LYN,
SRC, SRM and YES were correlated with HCC clinical
cancer stage. The gene names are shown in red. *p
Furthermore, we analyzed the prognostic significance of SFKs expression in HCC using the Kaplan-Meier Plotter, GEPIA, and UALCAN websites. The OS curves were presented in Fig. 6A. Increased BLK (HR = 0.61, p = 0.01), BRK (HR = 0.68, p = 0.033), FYN (HR = 0.43, p = 2.7E-06), LCK (HR = 0.59, p = 0.0034), SRM (HR = 0.52, p = 0.00021), YES (HR = 0.68, p = 0.028) mRNA levels and decreased SRC (HR = 1.75, p = 0.0023) mRNA levels in HCC patients were strongly associated with better OS. However, the expression levels of FGR (HR = 1.18, p = 0.4), FRK (HR = 0.75, p = 0.099), HCK (HR = 1.23, p = 0.24) and LYN (HR = 0.77, p = 0.15) did not affect the OS of HCC patients.
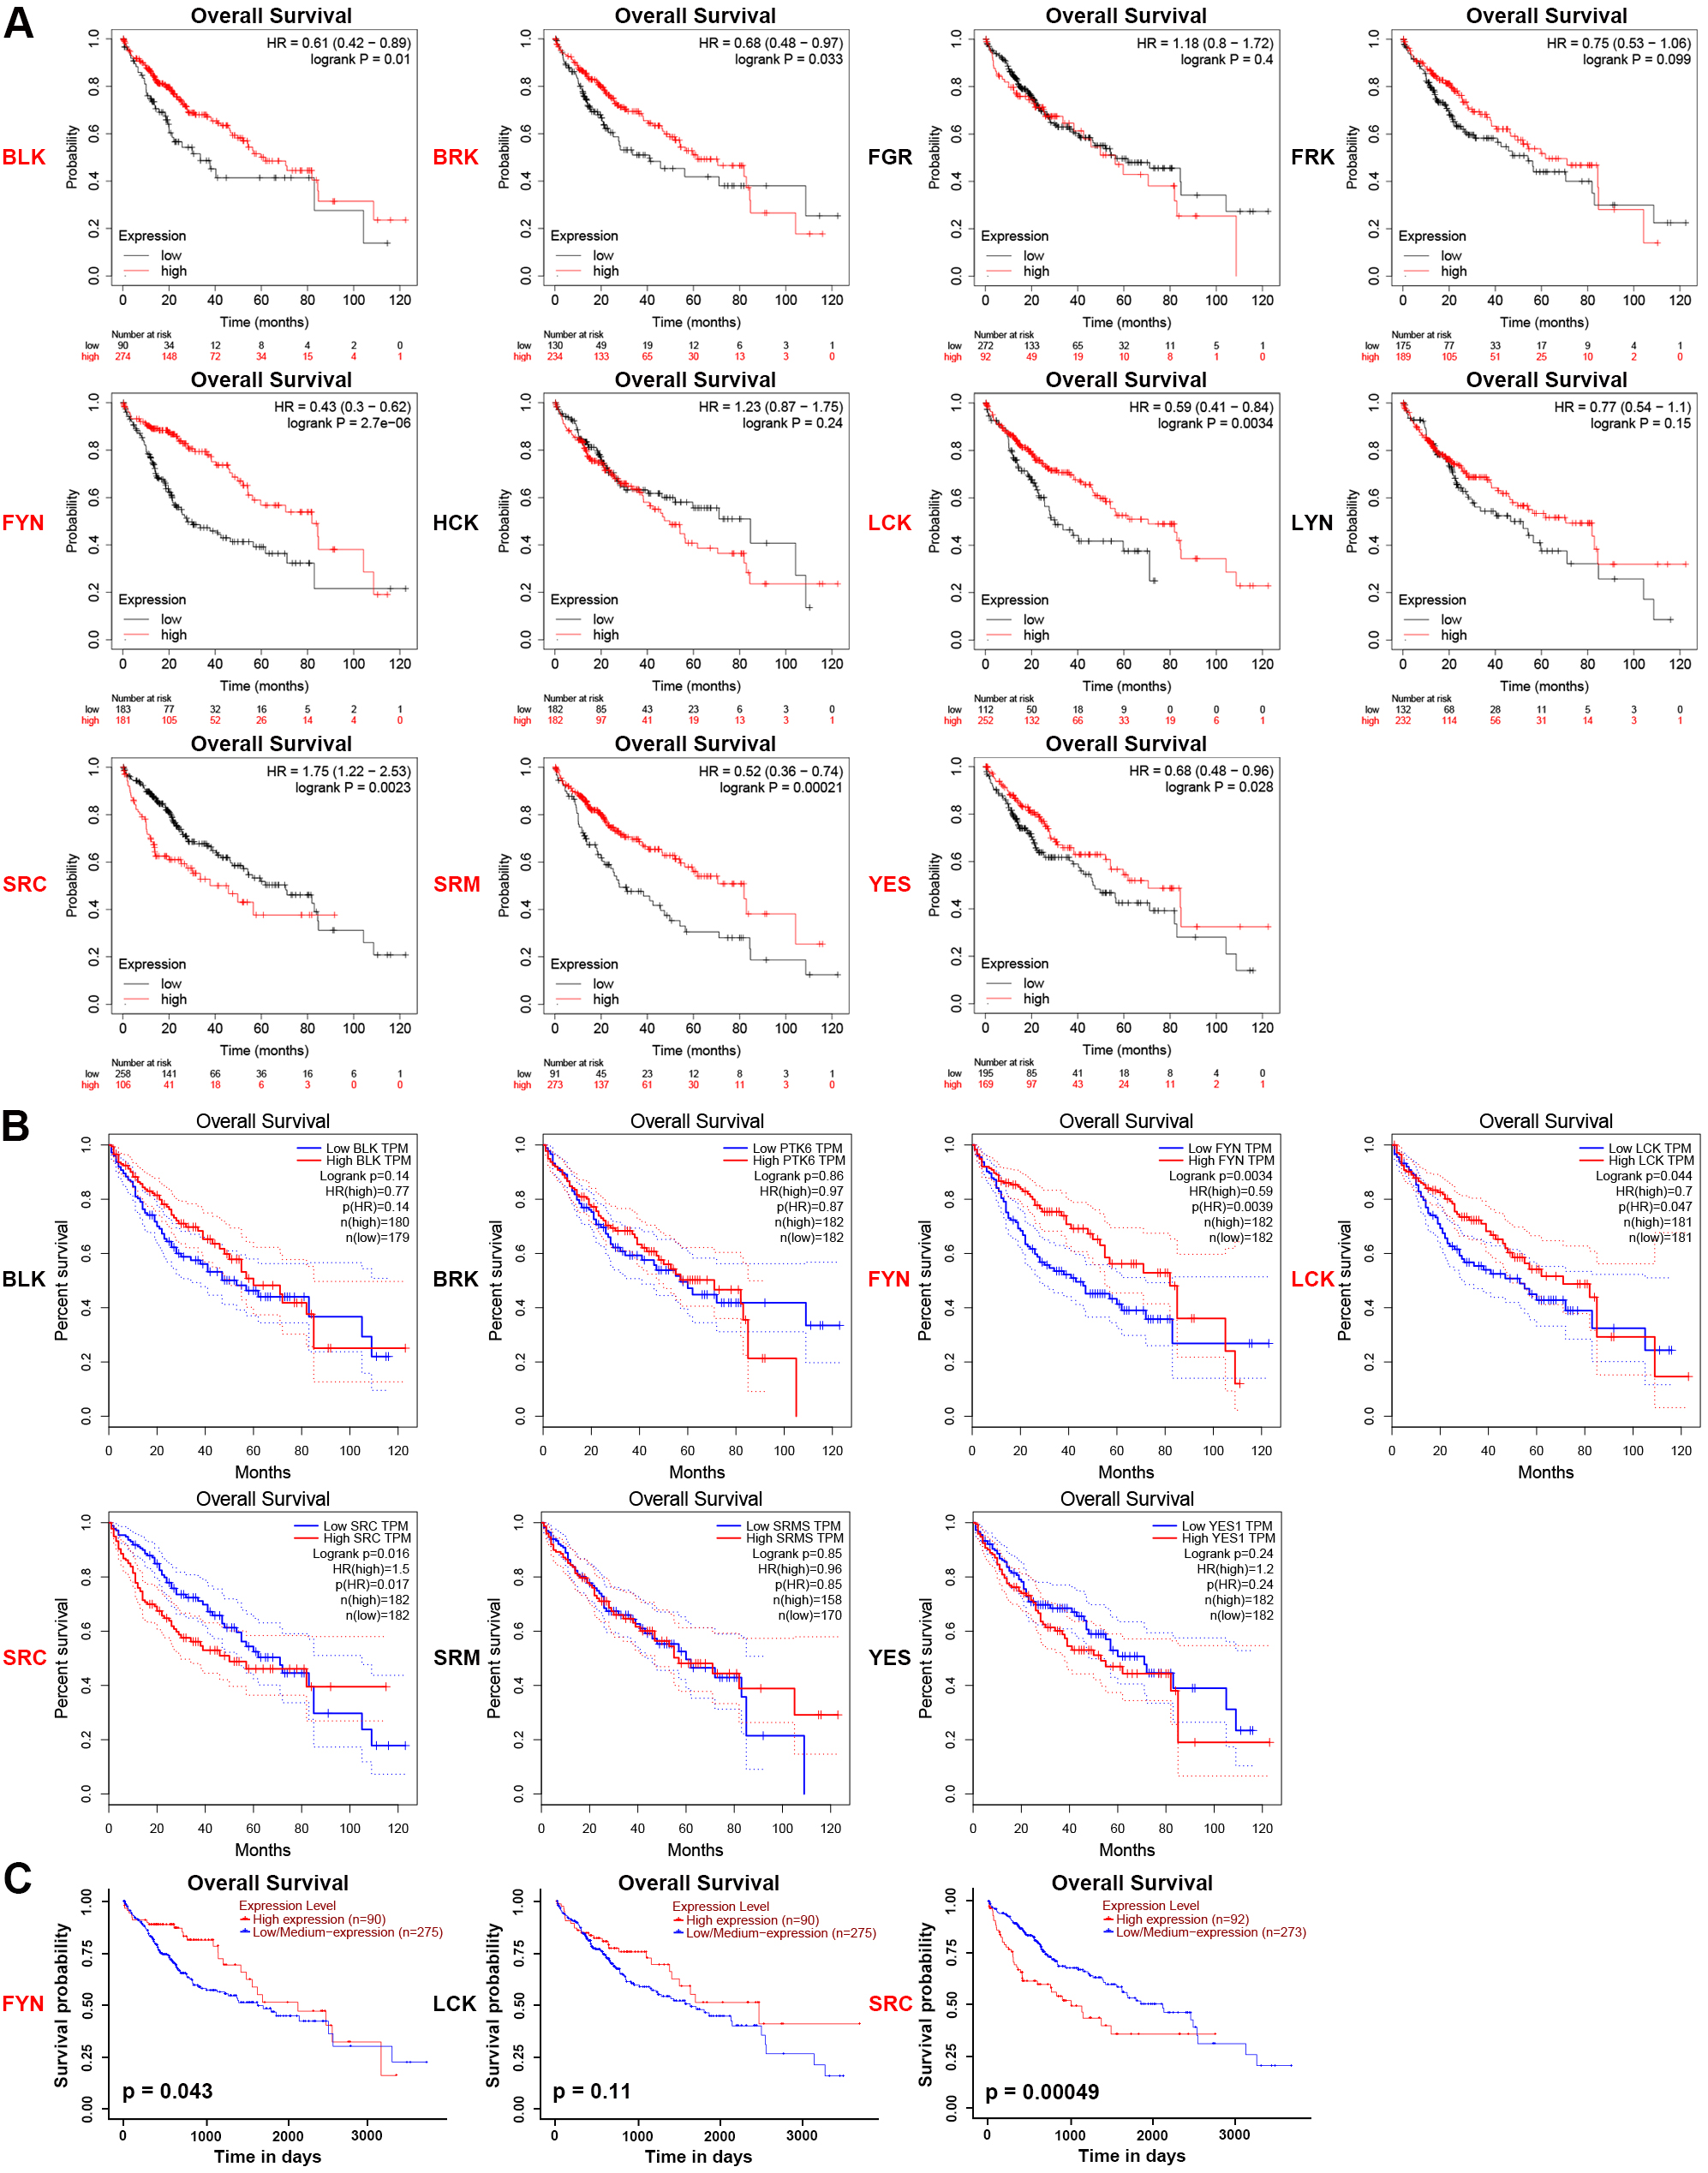 Fig. 6.
Prognostic values of SFKs in HCC. (A) HCC patients with reduced
mRNA expression levels of BLK, BRK, FYN, LCK,
SRM and YES were significantly related to short overall
survival (OS), while higher SRC mRNA expression was correlated with
short OS. Cutoff: median (Kaplan-Meier plotter). (B) Low mRNA expression levels
of FYN and LCK were significantly associated with short OS,
conversely, high SRC mRNA expression was correlated
with short OS in HCC patients. Cutoff: median
(GEPIA). (C) Elevated FYN mRNA level in HCC was
positively correlated with OS, while SRC was negatively correlated with
OS (UALCAN). p
GEPIA was used to verify the seven SFK genes that had an impact on prognosis (Fig. 6B). HCC patients with higher transcriptional levels of SRC were significantly associated with shorter OS (p = 0.016), whereas those with increased transcriptional levels of FYN (p = 0.0034) or LCK (p = 0.044) were markedly associated with better long-term OS. There was no significant correlation between the expression levels of the rest four genes and OS in patients with HCC. The results of FYN, LCK, SRC from the Kaplan-Meier Plotter and GEPIA were consistent.
UALCAN was used to further verify the influence of the mRNA expression levels of FYN, LCK and SRC on OS (Fig. 6C). Among these three genes, only FYN (p = 0.043) and SRC (p = 0.00049) mRNA expression levels were significantly associated with OS. The above results from the three websites indicated that the mRNA expression levels of FYN and SRC were remarkably correlated with prognosis in patients with HCC.
Interaction network and functional enrichment analysis revealed that SFKs might be closely associated with tumorigenesis, progression, and the immune microenvironment (Supplementary Fig. 1; Supplementary Table 4; Supplementary Table 5). We further explored the relationship between SFKs and immune infiltration levels in HCC using the TIMER2.0. As shown in Fig. 7, the expression levels of FGR, HCK, LCK, LYN and YES were positively in connection with the infiltration of B cells, macrophages, dendritic cells, neutrophils, CD4+ T cells and CD8+ T cells. Additionally, BLK expression was positively associated with the infiltration of B cells, dendritic cells, CD4+ T cells and CD8+ T cells. BRK expression was positively correlated with the infiltration of macrophages, neutrophils and CD4+ T cells. FRK expression was significantly positively correlated with the infiltration of macrophages, dendritic cells, neutrophils, CD4+ T cells and CD8+ T cells. FYN expression was positively connected with the infiltration of macrophages, dendritic cells, neutrophils and CD8+ T cells. SRC expression was positively related to the infiltration of B cells, macrophages, dendritic cells, neutrophils and CD4+ T cells. SRM expression was positively relevant to the infiltration of B cells, macrophages, neutrophils and CD4+ T cells. Taken together, the above results demonstrated that SFKs might play a dominant role in the immune infiltration of HCC.
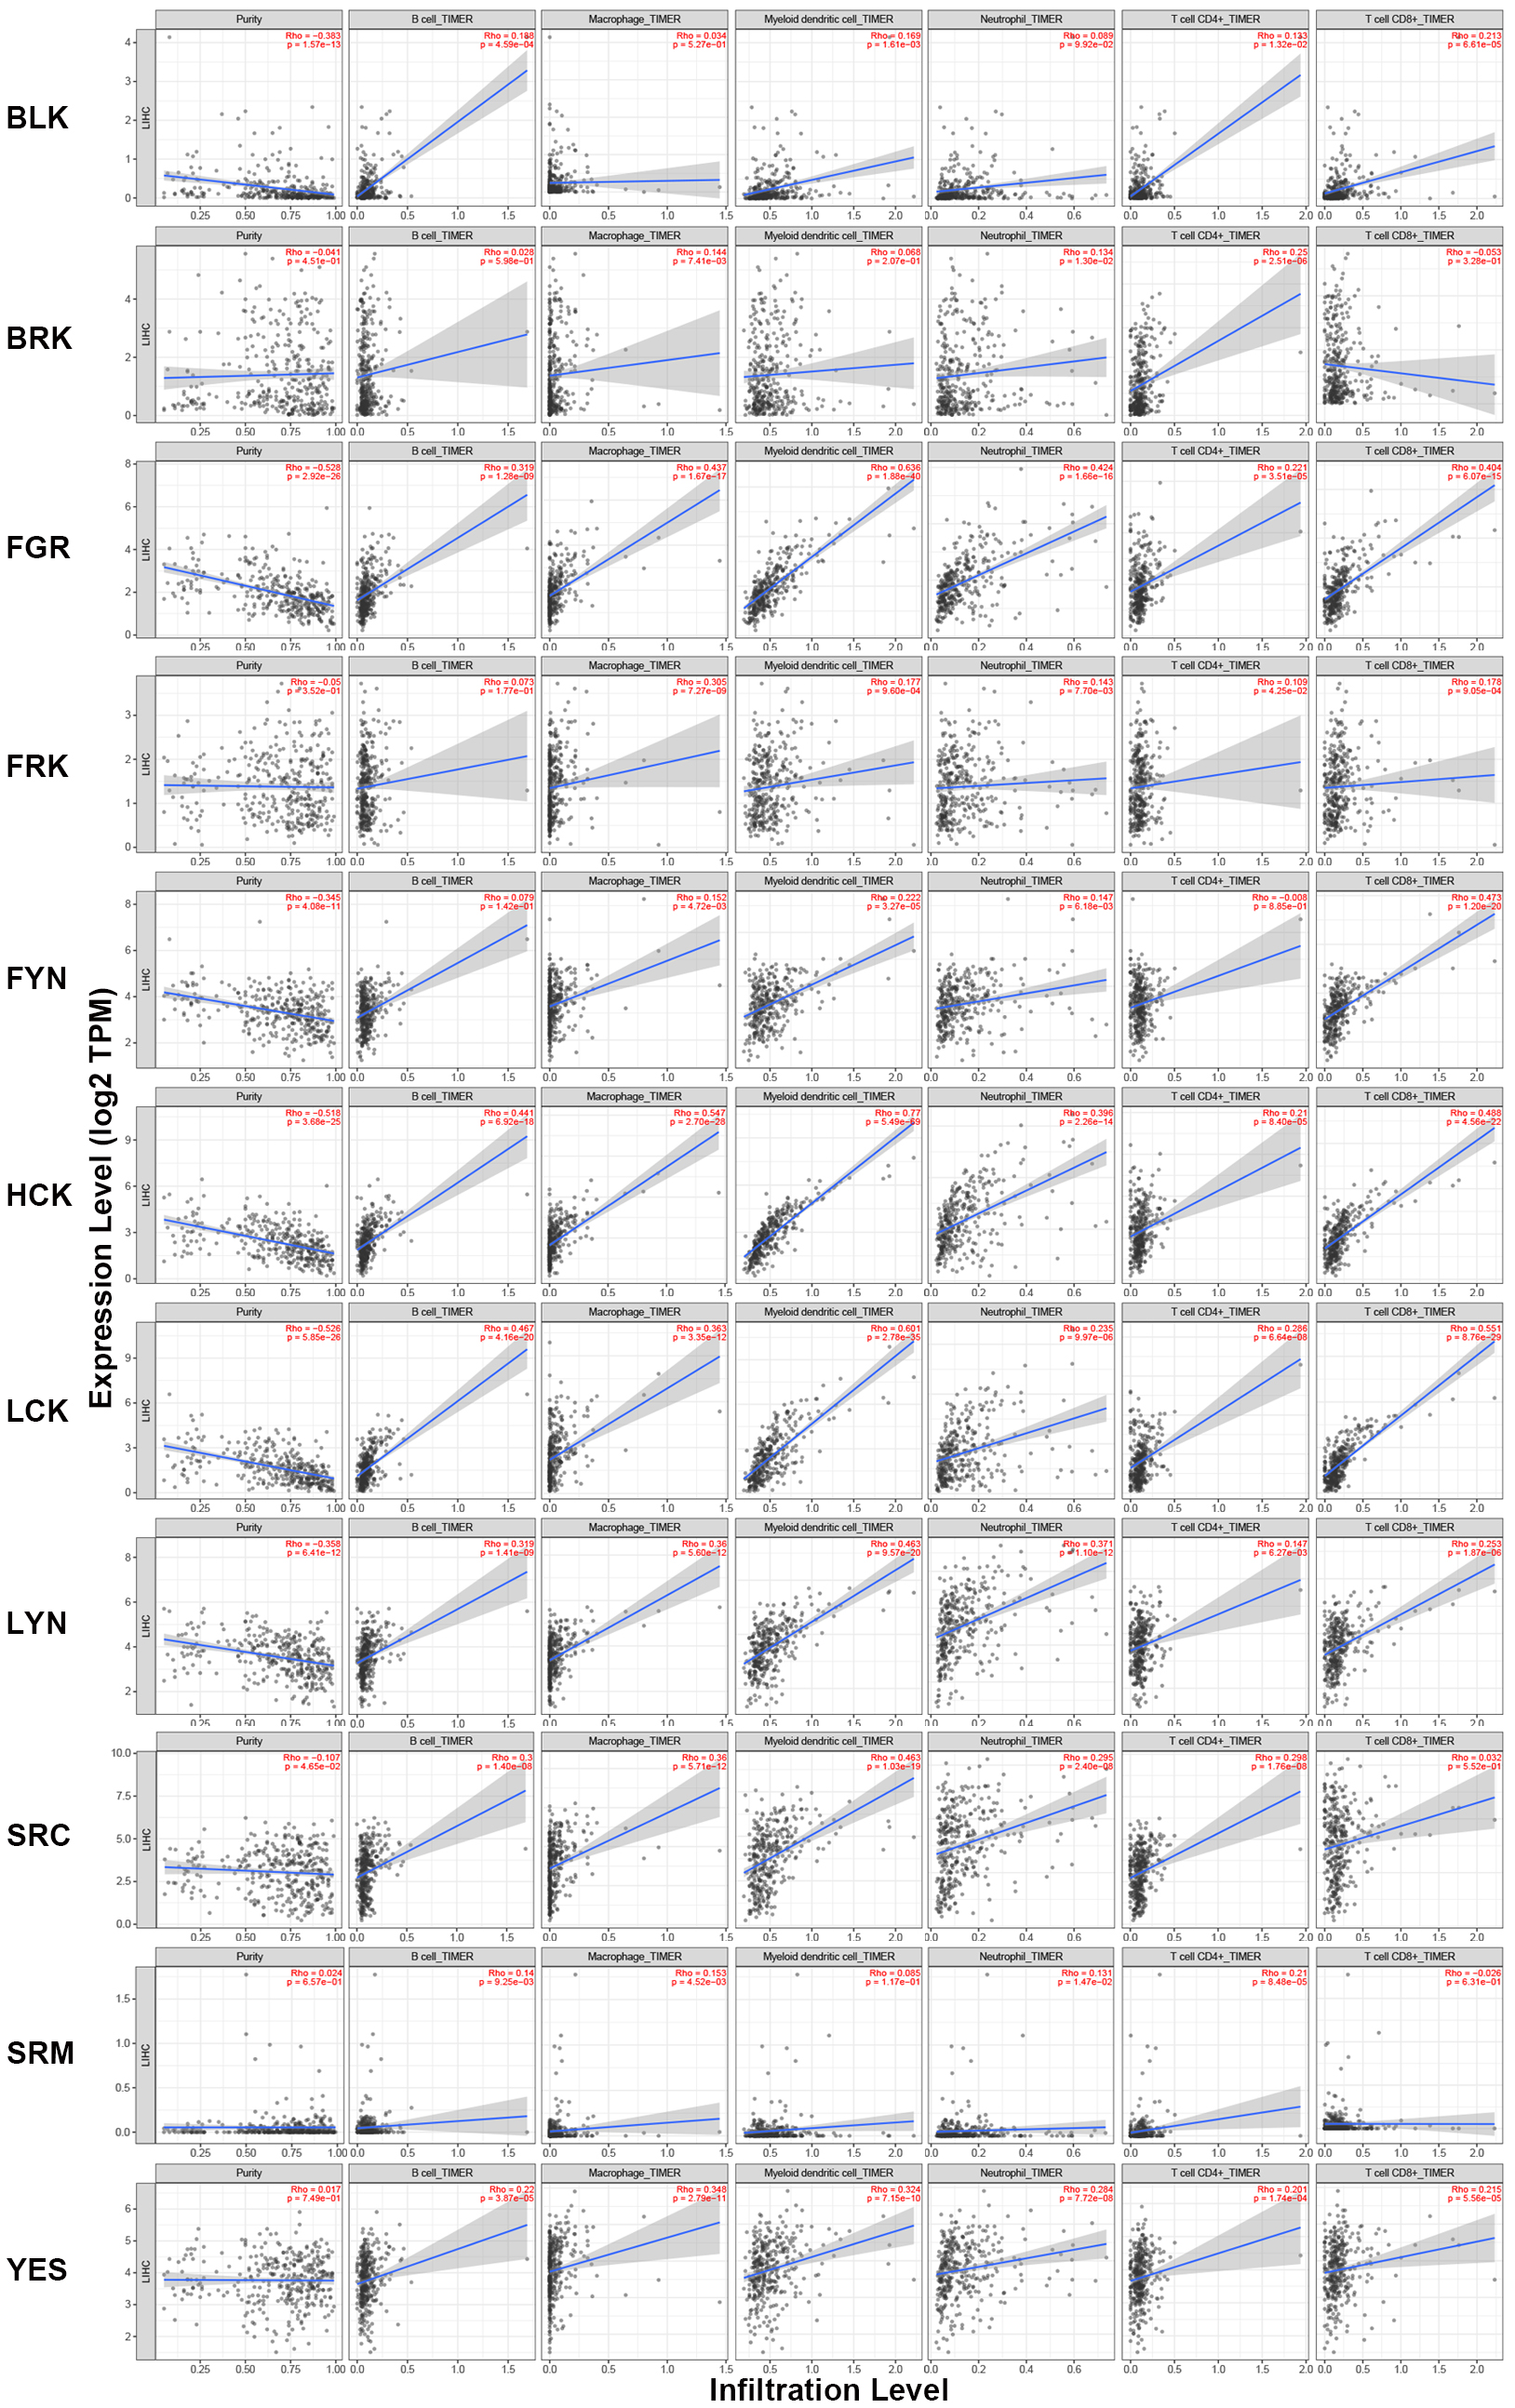 Fig. 7.
Correlations between differentially expressed SFKs and immune
cell infiltration (TIMER2.0). Spearman tests were used for analyzing the correlation coefficients (Rho). Positive correlation (p
Multiple analysis tools combined with qPCR experiments suggested that among all SFK members, only FYN and SRC were dysregulated in expression and associated with OS, therefore, we mainly considered these two genes as candidate genes for predicting prognostic markers in HCC patients. The impact of FYN on HCC has rarely been reported, therefore, we first focused on identifying the effect of FYN on HCC in vitro and in vivo.
Western blot analysis revealed decreased protein expression levels in both HCC
tissues (Supplementary Fig. 2A) and the
human hepatoma cell line Huh7 (Supplementary Fig. 2B) by western blot
analysis. We then generated FYN-overexpression or -knockdown
Huh7 cell lines (Fig. 8A,B). Cell proliferation ability, detected by CCK-8
proliferation assay and colony formation assay, decreased in
FYN-overexpression Huh7 cells and increased in FYN-knockdown
Huh7 cells (Fig. 8C–F). Moreover, transwell migration and
invasion experiments showed that overexpression of FYN inhibited cell migration
and invasion, which was the opposite of FYN knockdown (Fig. 8G–J).
Next, we examined the effects of FYN on HCC cell proliferation
in vivo. In the subcutaneous xenograft tumor model, the tumor growth
rate in mice injected with FYN-overexpression cells was significantly slower than
that in mice injected with control Huh7 cells (Fig. 8K). FYN-overexpression Huh7
cells formed smaller tumors (365.5
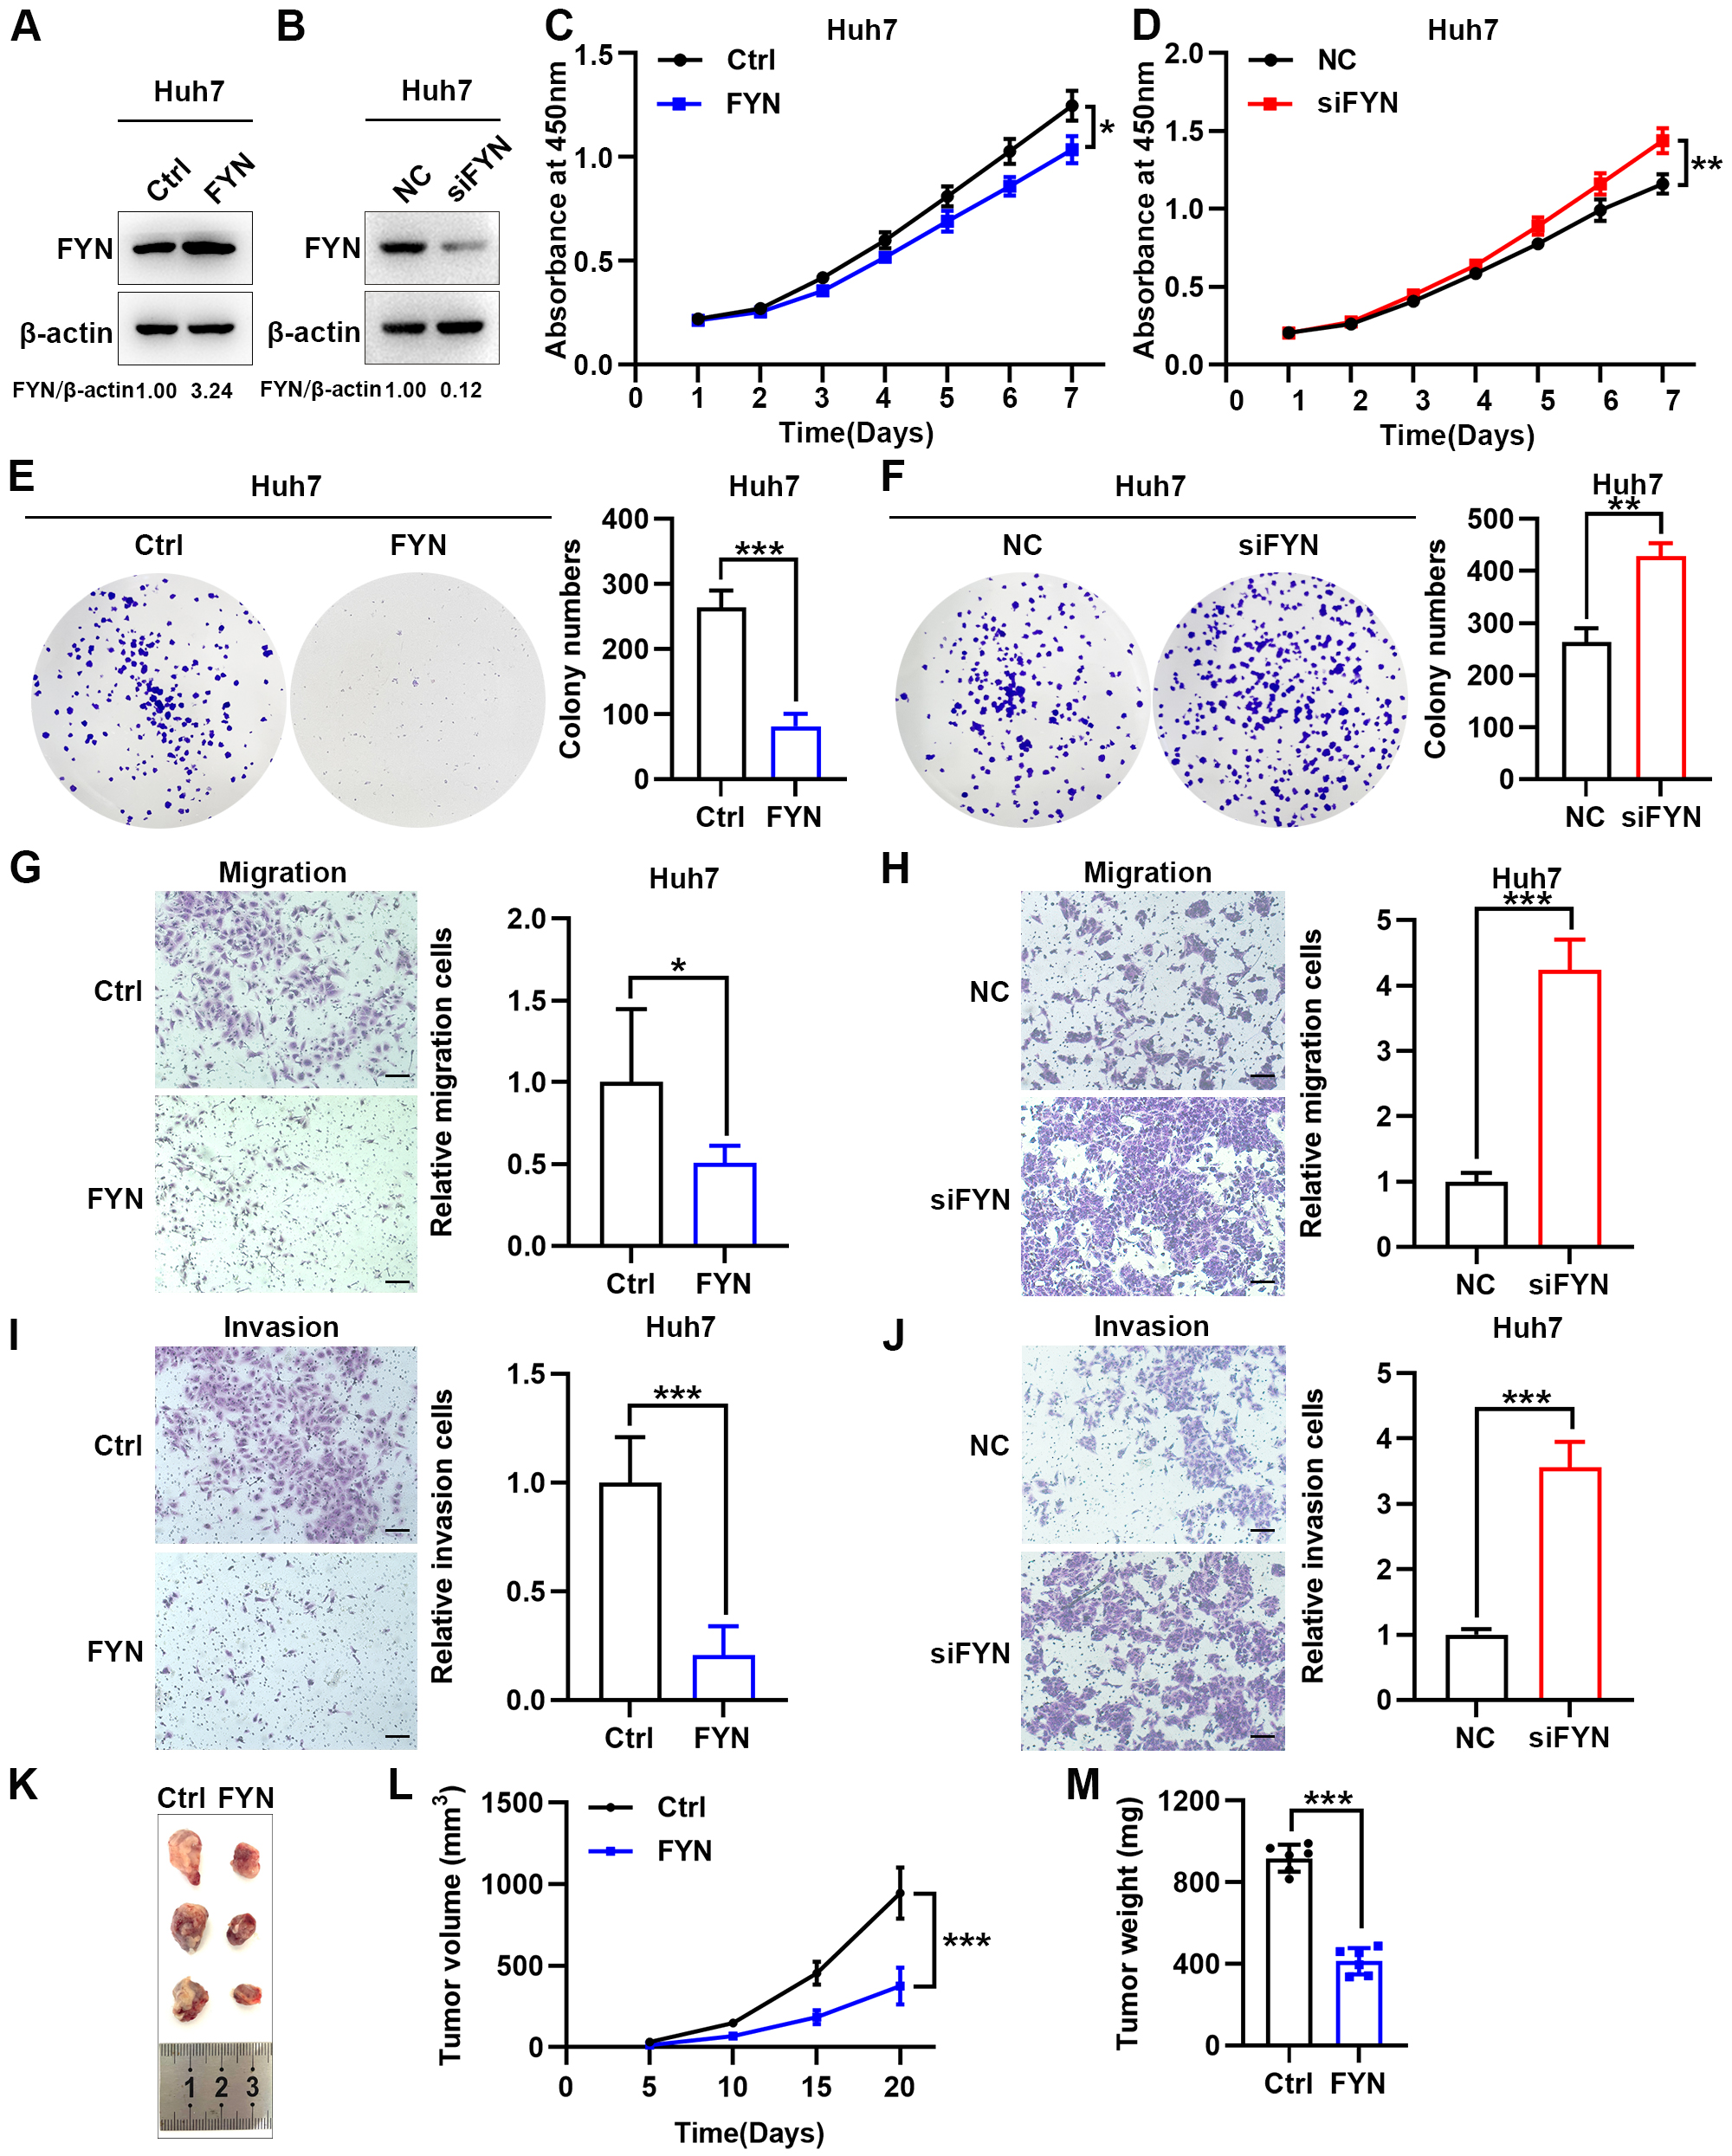 Fig. 8.
Overexpression of FYN suppresses tumor biological behavior
in vitro and in vivo. (A,B) FYN
overexpression (A) and knockdown (B) efficiency verification at
the protein level. FYN protein levels were detected by western blot and relative
levels were normalized to
Several studies have shown that SRC has a tumor-promoting effect on HCC. Here, we studied its function through tumor biological behavior experiments in vitro. We first generated SRC-overexpression or -knockdown Huh7 cell lines (Fig. 9A,B). CCK-8 proliferation and colony formation assays revealed that knockdown of SRC suppressed cell proliferation, while overexpression of SRC promoted cell proliferation (Fig. 9C–F). Transwell migration and invasion assays demonstrated that knockdown of SRC inhibited cell migration and invasion, conversely, overexpression of SRC promoted cell migration and invasion (Fig. 9G–J). These results suggest that knockdown of SRC, a potential tumor promoter of HCC, suppresses the biological behavior of tumors in vitro.
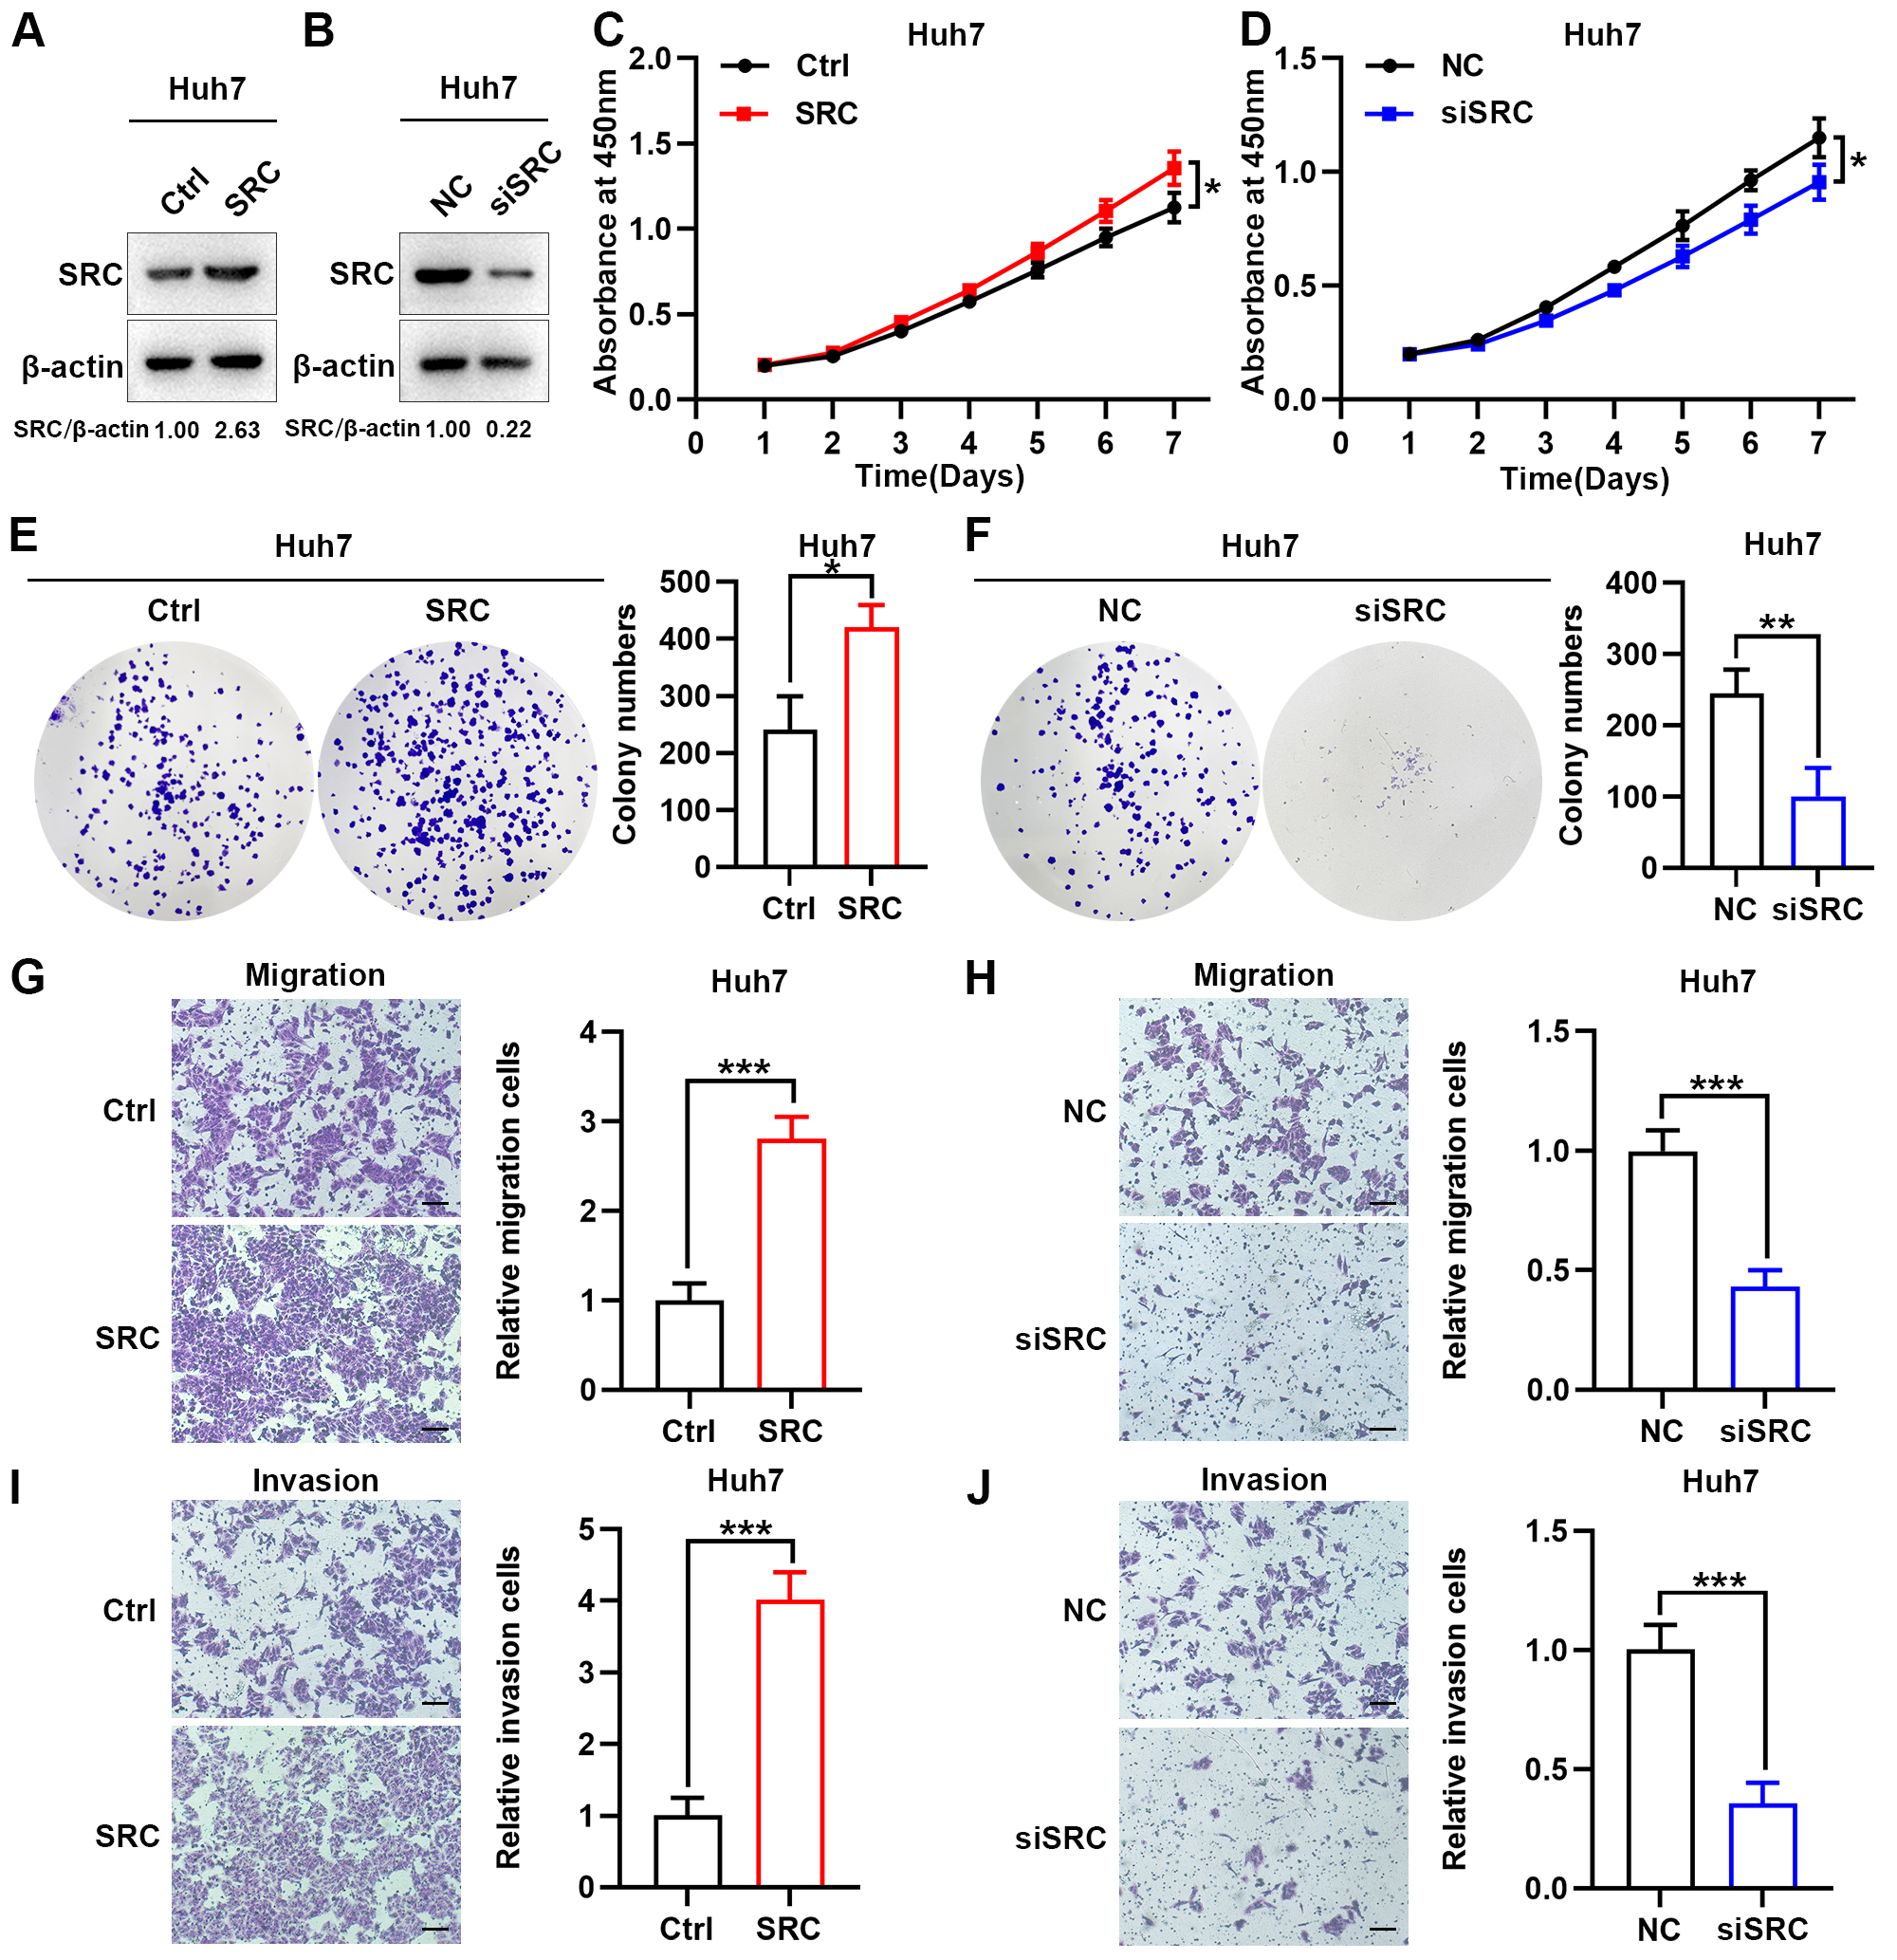 Fig. 9.
Knockdown of SRC suppresses
tumor biological behavior in vitro. (A,B) SRC overexpression (A) and
knockdown (B) efficiency verification at the protein level. SRC
protein levels were detected by western blot and relative levels were normalized
to
Comprehensive analyses of SFKs in HCC have not yet been reported. In this study, we systematically explored SFKs in HCC through bioinformatics analysis combined with biological behavior experiments. Multiple analysis results showed that the expression levels of FYN were decreased in HCC tissues compared to normal liver tissues, while LYN, SRC and SRM were increased. Moreover, most SFK members were correlated with the HCC clinical cancer stage. FYN and SRC significantly correlated with OS in patients with HCC. These results suggested that SFKs play a critical roles in HCC progression.
Mechanically, the interaction network and functional enrichment analysis
indicated that SFKs and the 20 related genes were closely related to multiple
signaling pathways, such as the
NF-
In the TME, chemokines can regulate immune cells, and perturbations in chemokine signaling often alter immune cell composition and localization [33]. Natural killer cells [34] and T cells [35] are important cells in the TME, and the regulation of these immune cells affects the progression of HCC. These findings indicate that SFKs play an important role in the regulation of immune cells and the progression of HCC. Consistently, we found that all SFKs were strongly associated with at least three types of immune cells in HCC. At least eight SFK members were significantly correlated with CD4+ T cells [36], CD8+ T cells [37], B cells [38] and dendritic cells [39], which were considered important players in impeding, inhibiting and killing HCC cells. In addition, ten SFK members were significantly connected with neutrophils [40] and macrophages [41], which have a dual role in cancer progression based on their polarization state. Immune-infiltrating cells in the TME have been shown to play a critical role in tumor development and impact clinical outcomes in patients with cancer [42]. We also found that SFKs and the 20 related genes were correlated with multiple immune-related signaling pathways, such as chemokine signaling pathway, natural killer cell mediated cytotoxicity, T cell receptor signaling pathway, and B cell receptor signaling pathway. Therefore, SFKs presumably affect the progression of HCC by regulating immune-infiltrating cells and may be potential targets for HCC immunotherapy.
FYN was ubiquitous in almost all cell types [4]. However, the role of FYN in cancer development appears tissue-specific. In a variety of cancers, including breast cancer [43], gastric cancer [44], colon cancer [45], lung cancer [46], and pancreatic cancer [47], FYN was upregulated and acted as a tumor promoter by promoting proliferation and migration or by affecting EMT [43, 44, 45, 47]. In this study, we found that FYN is frequently lost in patients with HCC and is associated with poor prognosis. In agreement with this, FYN was downregulated in prostate cancer, and served as a new candidate prostate tumor suppressor gene [48]. Reduced FYN expression was caused by both chromosomal deletion and promoter hypermethylation, whereas decreased mRNA expression of FYN may be due to deep or shallow deletion of the gene. Besides FYN, other genes among SFKs also showed potential as novel prognostic biomarkers for HCC, which requires further investigation.
LYN has attracted widespread attention on multiple
types of malignancies, such as chronic lymphocytic leukemia (CLL) [49], lung
adenocarcinoma [50], colorectal cancer [51], cervical cancer [52], renal cancer
[53] and gastric cancer [54]. The impact of LYN on tumors may be
involved in ERK1/2 activation, NF-
SRC, the most investigated member of SFKs, expressed in almost all cell types [4], has been confirmed to have an effect on the initiation and progression of many cancers. As for HCC, prior studies have revealed that SRC promoted HCC tumorigenesis by activating the downstream MAPK signaling pathway [19]. In addition, it was reported that SRC had an impact on HCC growth and metastasis by mediating aerobic glycolysis via the PI3K/AKT/mTOR signaling pathway [57]. Moreover, targeting SRC related signaling pathway has been found to inhibit HCC metastasis [58]. A similar tumorigenic effect of SRC on HCC was observed in this study. SRC was highly expressed in the first three stages of HCC compared with normal tissues. However, similar to LYN, the increased expression of SRC was not found significantly in stage 4, which could be due to: (1) the sample sizes (n = 6) were too small to truly reflect its expression level, or (2) the development of tumors was not linear [59]. Moreover, the increased mRNA expression of SRC in HCC patients was significantly associated with poor OS. It seems that SRC does participate in HCC tumorigenesis and progression, and could serve as a prognostic biomarker and therapeutic target for HCC.
Among all SFKs, FYN and SRC showed potential as prognostic markers. As mentioned above, FYN and SRC were expressed in almost all cell types, including blood cells, implying that their expression could theoretically be detected in plasma. Besides, it is feasible to stain tissues with FYN and SRC. However, whether there is a correlation between plasma level expression and tissue level expression, whether there is a correlation between plasma level expression and HCC prognosis, and the quantification between gene expression in tissues and prognosis need to be further investigation.
In summary, we systematically explored the expression, mutation, prognostic value and relationship with immune infiltration of individual SFKs in HCC through bioinformatics analysis combined with biological behavioral experiments. The expression levels of FYN and SRC were altered in HCC, and they were associated with clinical cancer stage, OS, immune cell infiltration, and tumor progression. FYN and SRC may be potential prognostic biomarkers for patients with HCC. Additionally, our research contributes to a novel perspective on the distinct roles of SFKs in HCC and provides new clues for the early detection, prognostic evaluation, and individualized treatment of HCC patients. However, owing to the limitations of online databases and the small sample size, further studies are required to confirm these findings.
All data generated or analyzed during this study are included in this published article.
SC, DY and SZ conceived the study, wrote the manuscript and designed the figures and tables. DY, and YD performed experiments. LL, YD and LZ performed bioinformatic, statistical analyses and maintained the animals. SW provided the tissue samples, clinical data and related analysis. SC and DY revised the manuscript. All authors contributed to editorial changes in the manuscript. All authors read and approved the final manuscript. All authors have participated sufficiently in the work and agreed to be accountable for all aspects of the work.
Tissue samples for research were collected in accordance with the Declaration of Helsinki and approved by the Research Ethics Committee of Zhongshan Hospital, Fudan University (ethics number: Y2017290). The mouse experiments were conducted in accordance with the ARRIVE guidelines and approved by the Animal Ethics Committee of School of Basic Medical Sciences, Fudan University (ethics number: 20210302004). All methods were performed in accordance with relevant guidelines and regulations.
We thank Dr. Wenqing Tang for tissue sample collection. We sincerely thank the publicly available analysis tools and databases, including TIMER2.0, UALCAN, cBioportal, TCGA, Kaplan-Meier plotter, GEPIA, STRING, GeneMANIA, and XIANTAO platforms for providing open access. An earlier version of this manuscript has been presented as a preprint in Research Square following the link (https://www.researchsquare.com/article/rs-1568487/v1).
This work was supported by the National Natural Science Foundation (82173308) and the Natural Science Foundation of Shanghai (#22ZR1411800).
The authors declare no conflict of interest.
Supplementary material associated with this article can be found, in the online version, at https://doi.org/10.31083/j.fbl2805090.
References
Publisher’s Note: IMR Press stays neutral with regard to jurisdictional claims in published maps and institutional affiliations.