


1 Department of Pathology, Binzhou Medical University Hospital, 256600 Binzhou, Shandong, China
Abstract
Background: The purpose of the present study was to investigate the role of the 5-Fluorouracil (5-FU) resistance-related factor dihydropyrimidine dehydrogenase (DPD) in tumor immunity and prognosis and to study the relationship between drug resistance and the immune microenvironment of colon cancer. Methods: Bioinformatics methods were used to analyze the expression of DPD associated with prognosis, immunity, microsatellite instability, and tumor mutational burden in colon cancer. Immunohistochemistry (IHC) was used to detect DPD, MLH1, MSH2, MSH6, and PMS2 in 219 colon cancer tissue samples. Additional IHC analyses were conducted to detect CD4, CD8, CD20, and CD163 in 30 colon cancer tissue samples with the most extensive immune infiltration. The significance of the correlations and clinical significance of DPD with immune infiltration, immune-related markers, microsatellite instability-related indicators, and prognosis were evaluated. Results: The major findings of the present study are as follows: (1) DPD was expressed in tumor and immune cells and associated with certain immune cell-related markers, particularly M2 macrophages that expressed CD163. (2) DPD expression significantly and positively correlated with immune cell markers and immune checkpoints PD-1 and PD-L1. High expression of DPD in immune cells, but not tumor cells, led to increased immune infiltration. (3) High expression of DPD in immune and tumor cells induced 5-FU resistance and was associated with unfavorable prognosis. (4) DPD expression closely correlated with microsatellite instability and tumor mutational burden and led to resistance to 5-FU in patients with microsatellite instability. (5) Bioinformatics analyses revealed that DPD was enriched in immune-related functions and pathways such as activation of T cells and macrophages. Conclusions: DPD plays an important role in the immune microenvironment and drug resistance of colon cancers and their functional association.
Keywords
- colon cancer
- DPD
- 5-FU resistance
- microsatellite instability
- tumor mutational burden
- tumor immune microenvironment
Colorectal cancer is the third most common cancer worldwide and the second leading cause of cancer-related death [1]. Fluorouracil (FU)-based chemotherapy serves as first-line treatment for colorectal cancer [2]; however, associated drug resistance and adverse reactions represent the major factors leading to insufficiently effective treatment, which contribute to poor prognosis.
The mechanism of 5-FU resistance is very complex, and abnormal metabolism of 5-FU is an important mechanism causing 5-FU resistance [3, 4]. Dihydropyrimidine dehydrogenase (DPD) serves as the initial enzyme in the pathway and rate-limiting step of 5-FU degradation [5]. Malier et al. [3] found that DPD levels are abnormally high in some colorectal cancers and closely related to drug resistance and prognosis of patients with cancer. Yin et al. [6] found that the immune microenvironment contributes to resistance of colorectal cancer to chemotherapy through macrophage-derived Inter Leukin 6, indicating that alterations of the tumor immune microenvironment are associated with 5-FU resistance.
DPD is closely related to a variety of immune cells in colon cancer [3, 7]. However, few reports address the function of DPD in the immune microenvironment of colorectal cancer, its influence on prognosis, and the induction of 5-FU resistance. Therefore, in-depth analysis of the mechanism of DPD expression in the tumor microenvironment will contribute to the development of novel therapeutic approaches to reverse 5-FU resistance, which will significantly improve the antitumor effect of 5-FU to prolong survival.
Here we conducted comprehensive bioinformatics analyses of DPD expression and its associations with prognosis of patients with colorectal cancer, immune checkpoints, immune cells and their markers, microsatellite instability (MSI), and tumor mutational burden (TMB). Furthermore, Gene Ontology (GO) and Kyoto Encyclopedia of Genes and Genomes (KEGG) enrichment relationships were performed to gain insights into the function of DPD in these processes and the underlying signal transduction pathways. We employed immunohistochemistry (IHC) to detect the expression of immune cell markers and MSI as markers of the tumor immune microenvironment to analyze and verify the relationship between DPD expression and immune infiltration in colon cancer tissues. Our ultimate goal is to evaluate the clinical significance of these functional interactions to achieve a new direction that will reverse 5-FU resistance.
We used The Human Protein Atlas (HPA, https://www.proteinatlas.org/) database to evaluate DPD expression in colorectal cancer and its association with prognosis and the Tumor IMmune Estimation Resource (TIMER, https://cistrome.shinyapps.io/timer/) database to evaluate immune infiltrates in cancer tissues (abundances of immune infiltrates as follows: B cells, CD4+ T cells, CD8+ T cells, neutrophils, macrophages, and dendritic cells). Correlation analysis of immune markers and immune checkpoints was performed.
We used the Xena Functional Genomics Explorer (UCSC Xena, https://xenabrowser.net/heatmap/) database to evaluate pan-cancer data (expression, genetic variations, and microsatellite instability). R software (version 4.2.1, Auckland University, New Zealand, https://www.r-project.org/) was used to analyze the relationship between DPD and MSI/TMB in pan-cancer as well as to explore the relationship between DPD and tumor immunotherapy. The effect of MSI-related index (MLH1, MSH2, MSH6, and PMS2) mutations on DPD expression was predicted using the muTarget database.
Colorectal adenocarcinoma expression data were acquired from The Cancer Genome Atlas (TCGA, https://portal.gdc.cancer.gov/) database. Based on the Gene Set Enrichment Analysis (GSEA, version 3.0, UC San Diego and Broad Institute, USA, https://www.gsea-msigdb.org/gsea/index.jsp) databases “c2. cp. kegg. v7.1. symbols. gmt” and “c5. all. v7.1. symbols. gmt”, KEGG and GO enrichment analyses of DPD were performed using GSEA to predict possible functionally associated signaling pathways and functions of DPD in colon cancer. The KEGG serves as a resource for understanding advanced functions and biological systems through large-scale molecular data generated using high-throughput experimental techniques. GO is a major bioinformatics tool for annotating and analyzing biological processes (BPs), molecular functions (MFs), and cellular components (CCs).
Anti-DPD, -MLH1, -MSH2, -MSH6, and -PMS2 antibodies were obtained from Abcam (Cambridge, MA, USA). Anti-CD4, -CD8, -CD20, and -CD163 antibodies were obtained from Zhongshan Jinqiao Biotechnology Co., LTD (Beijing, China). The DAB chromogenic kit and enzyme-labeled goat antimouse and rabbit IgG polymer were purchased from Zhongshan Jinqiao Biotechnology. Paraffin-embedded samples (n = 219) of intermediate- and advanced-stage colorectal cancers, along with patients’ complete follow-up data, were collected from the Affiliated Hospital of Binzhou Medical College from January 2014 to December 2016. Inclusion criteria were as follows: according to the WHO classification criteria for gastrointestinal tumors in 2019, cases were diagnosed by two senior pathologists after a double-blind review. All patients were diagnosed with colon cancer for the first time, and FOLFOX (folinic acid, fluorouracil, and oxaliplatin) chemotherapy was administered after surgery. Patients were followed through telephone calls or annually in the clinic until December 2021 or until death; those lost to follow-up were not included in the study. Each tumor tissue sample was sequentially sliced into 4–6 sections.
Clinicopathological data for colorectal cancer cases (n = 219), which were
collated and grouped, included 100 female and 119 male patients, aged 26–88
years (average = 60.72 years). Tumor diameters of 96 and 123 patients were
Dewaxed and rehydrated tissue sections were subjected to
antigen retrieval under high pressure and high temperature. Endogenous peroxidase
activity was inhibited using 3%
IHC was used to analyze 219 samples for DPD expression to evaluate its associations with the extent of immune infiltration and MSI. The types of DPD-positive immune cells were analyzed according to their IHC and morphological characteristics. The 30 samples with the strongest immune infiltration were selected for IHC analysis of CD4, CD8, CD20, and CD163 expression to explore the relationship between DPD and immune markers.
IHC criteria for judging tissue positivity (staining colors described below)
were as follows: MLH1, MSH2, MSH6, and PMS2 are mainly expressed in the nucleus;
CD4, CD8, CD20, and CD163 are mainly expressed in the cell membrane of immune
cells. Ten independent fields were observed using a low-power
microscope (
DPD was mainly expressed in the cytoplasm of cancer tissues and immune cells to varying degrees. Brownish yellow served as a positive marker of DPD in cancer cells, immune cells, or both. The staining intensities and positive-cell ratios of DPD in these cells were determined, and regions harboring cancer and immune cells (immune infiltration) were judged according to the above scoring method.
Criteria for immune infiltration were as follows: ten independent
high-magnification fields (
Microsatellite instability (MSI) was defined by the absence of
R software (v.4.2.1) and SPSS 25.0 (IBM SPSS Statistics, Chicago, IL, USA) were
used for statistical analysis. Numerical data were analyzed using the
Analysis of the HPA database showed that DPD expression, which predicts poor
prognosis of patients with colorectal cancer (Fig. 1A), was mainly expressed in
the cytoplasm of cancer and immune cells (Fig. 1B). Analysis of the TIMER
database showed that DPD expression positively and
significantly correlated with the presence of CD4+ T cells, CD8+ T cells, B
cells, neutrophils, macrophages, and dendritic cells, among which there was a
significant positive correlation with macrophages and dendritic cells
(p
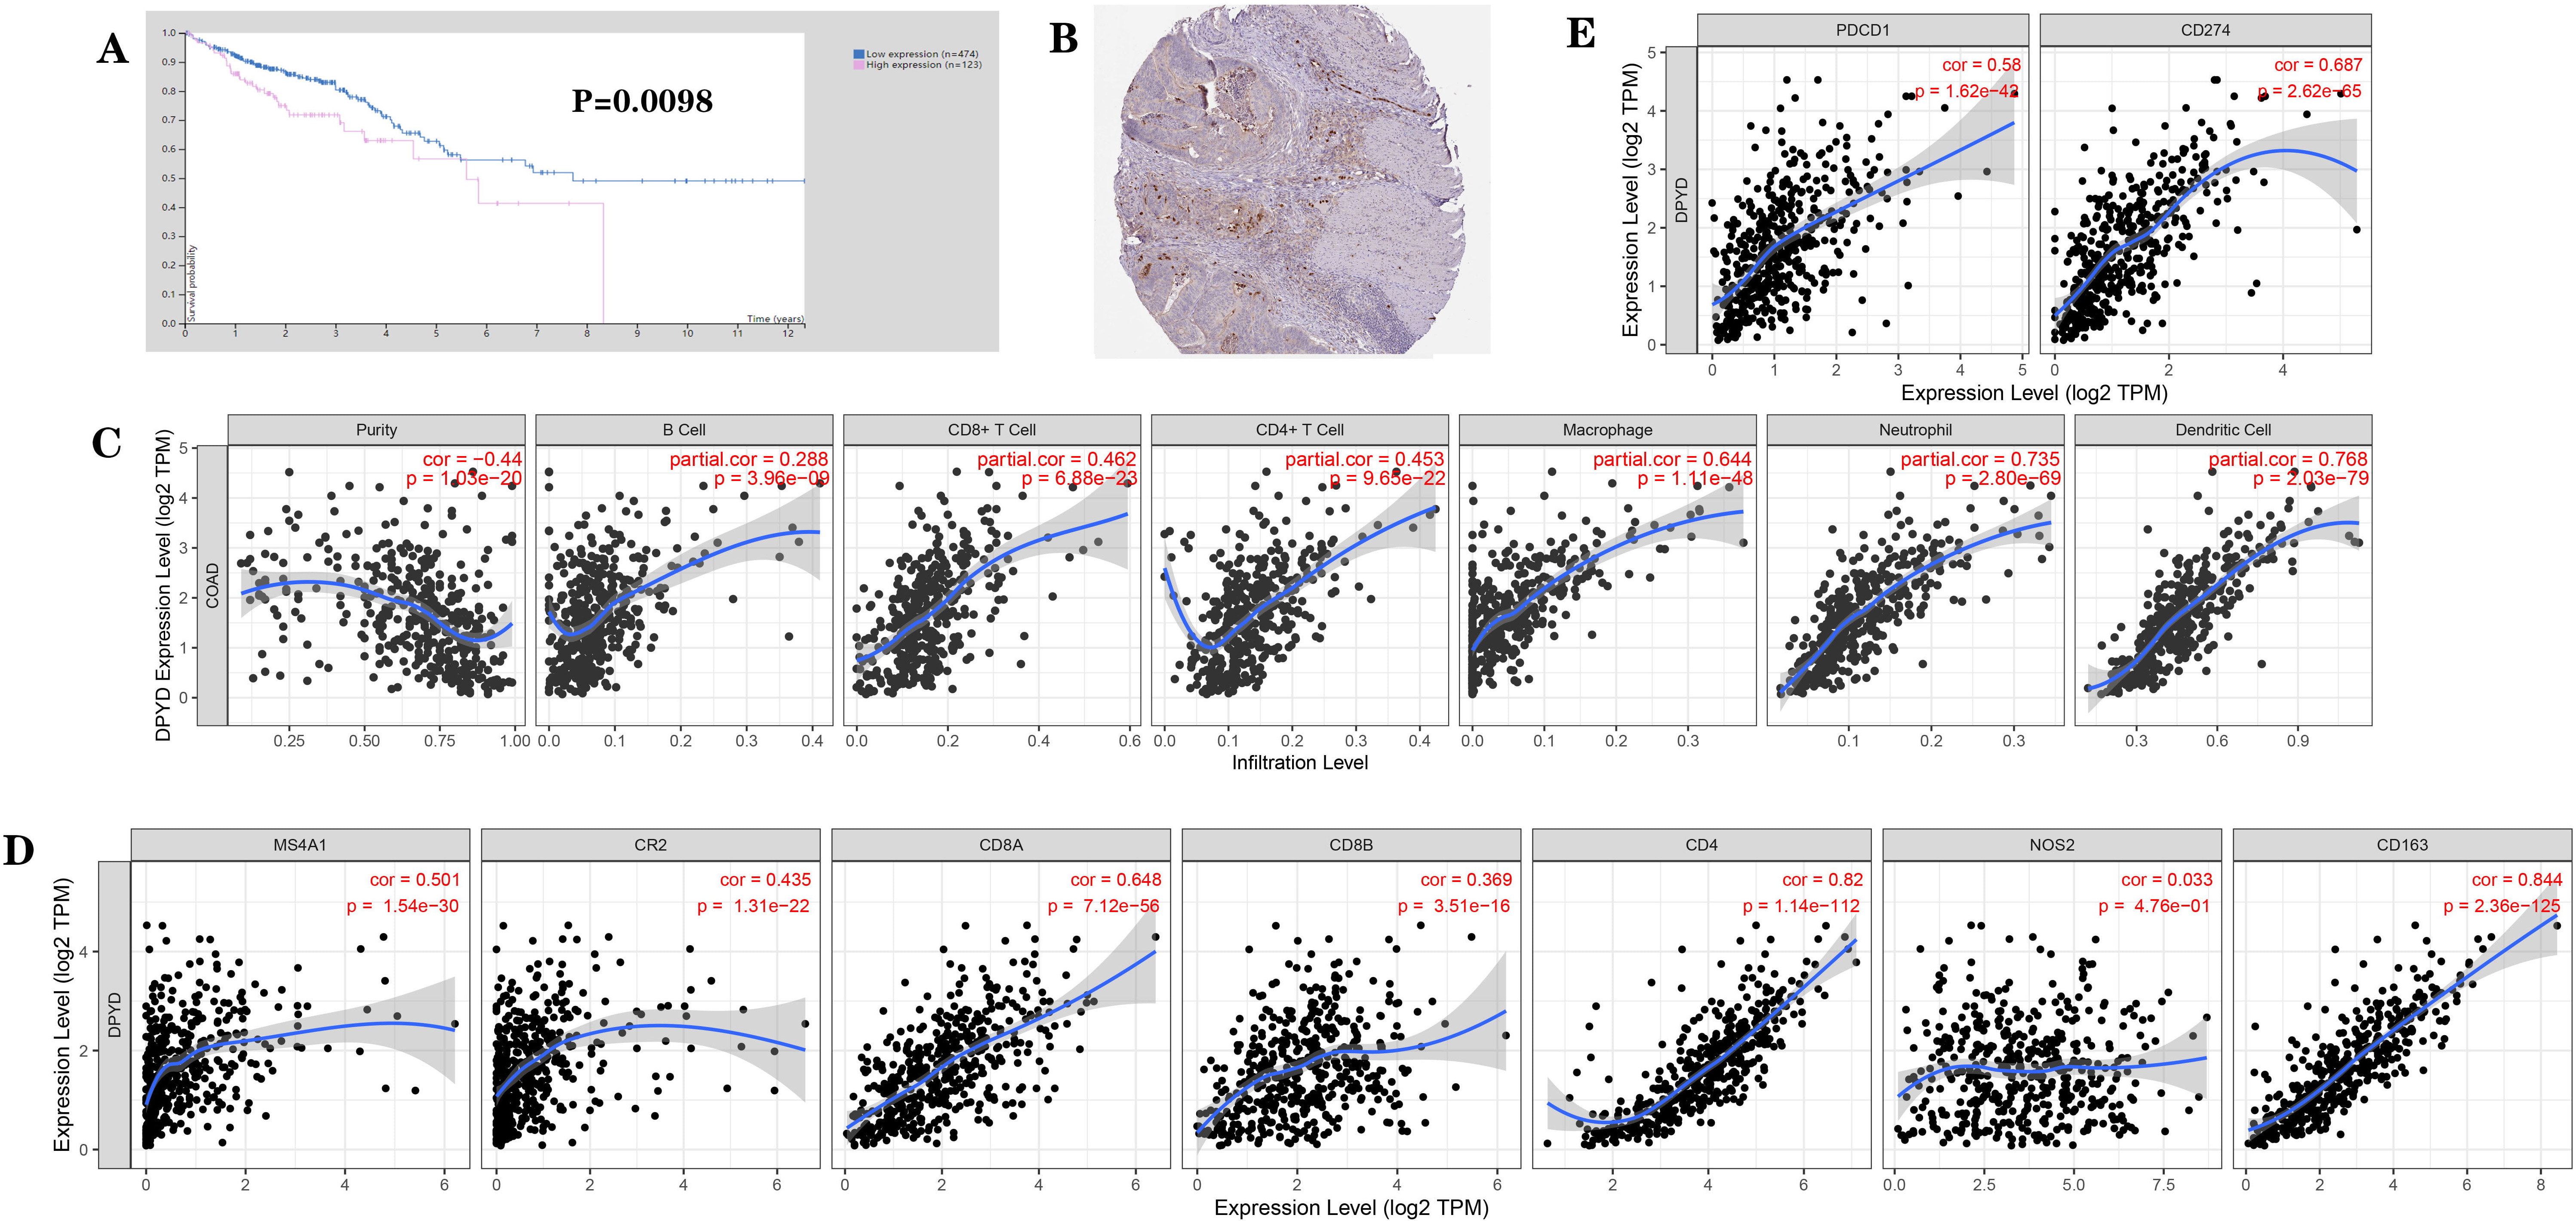 Fig. 1.
Expression of DPD and its association with the prognosis of
patients with cancer based on bioinformatics analysis (from the HPA and the TIMER
database). (A) Association of DPD expression with prognosis of patients with
colon cancer. (B) Localization of DPD expression in colon cancer tissues. (C)
Correlation between DPD expression and immune cell phenotypes: DPD expression
positively and significantly correlated with the presence of CD4+ T cells, CD8+ T
cells, B cells, neutrophils, macrophages, and dendritic cells. (D) Correlation
between DPD expression and immune markers: DPD expression positively and
significantly correlated with T cell markers (CD8A, CD8B, and CD4), B cell
markers (MS4A1, CR2), and M2 macrophage markers (CD163), but did not
significantly correlate with the M1 macrophage marker NOS2. (E) Correlation
between DPD expression and immune checkpoints: DPD expression significantly and
positively correlated with that of immune checkpoints PD-1 (PDCD1) and PD-L1
(CD274). p
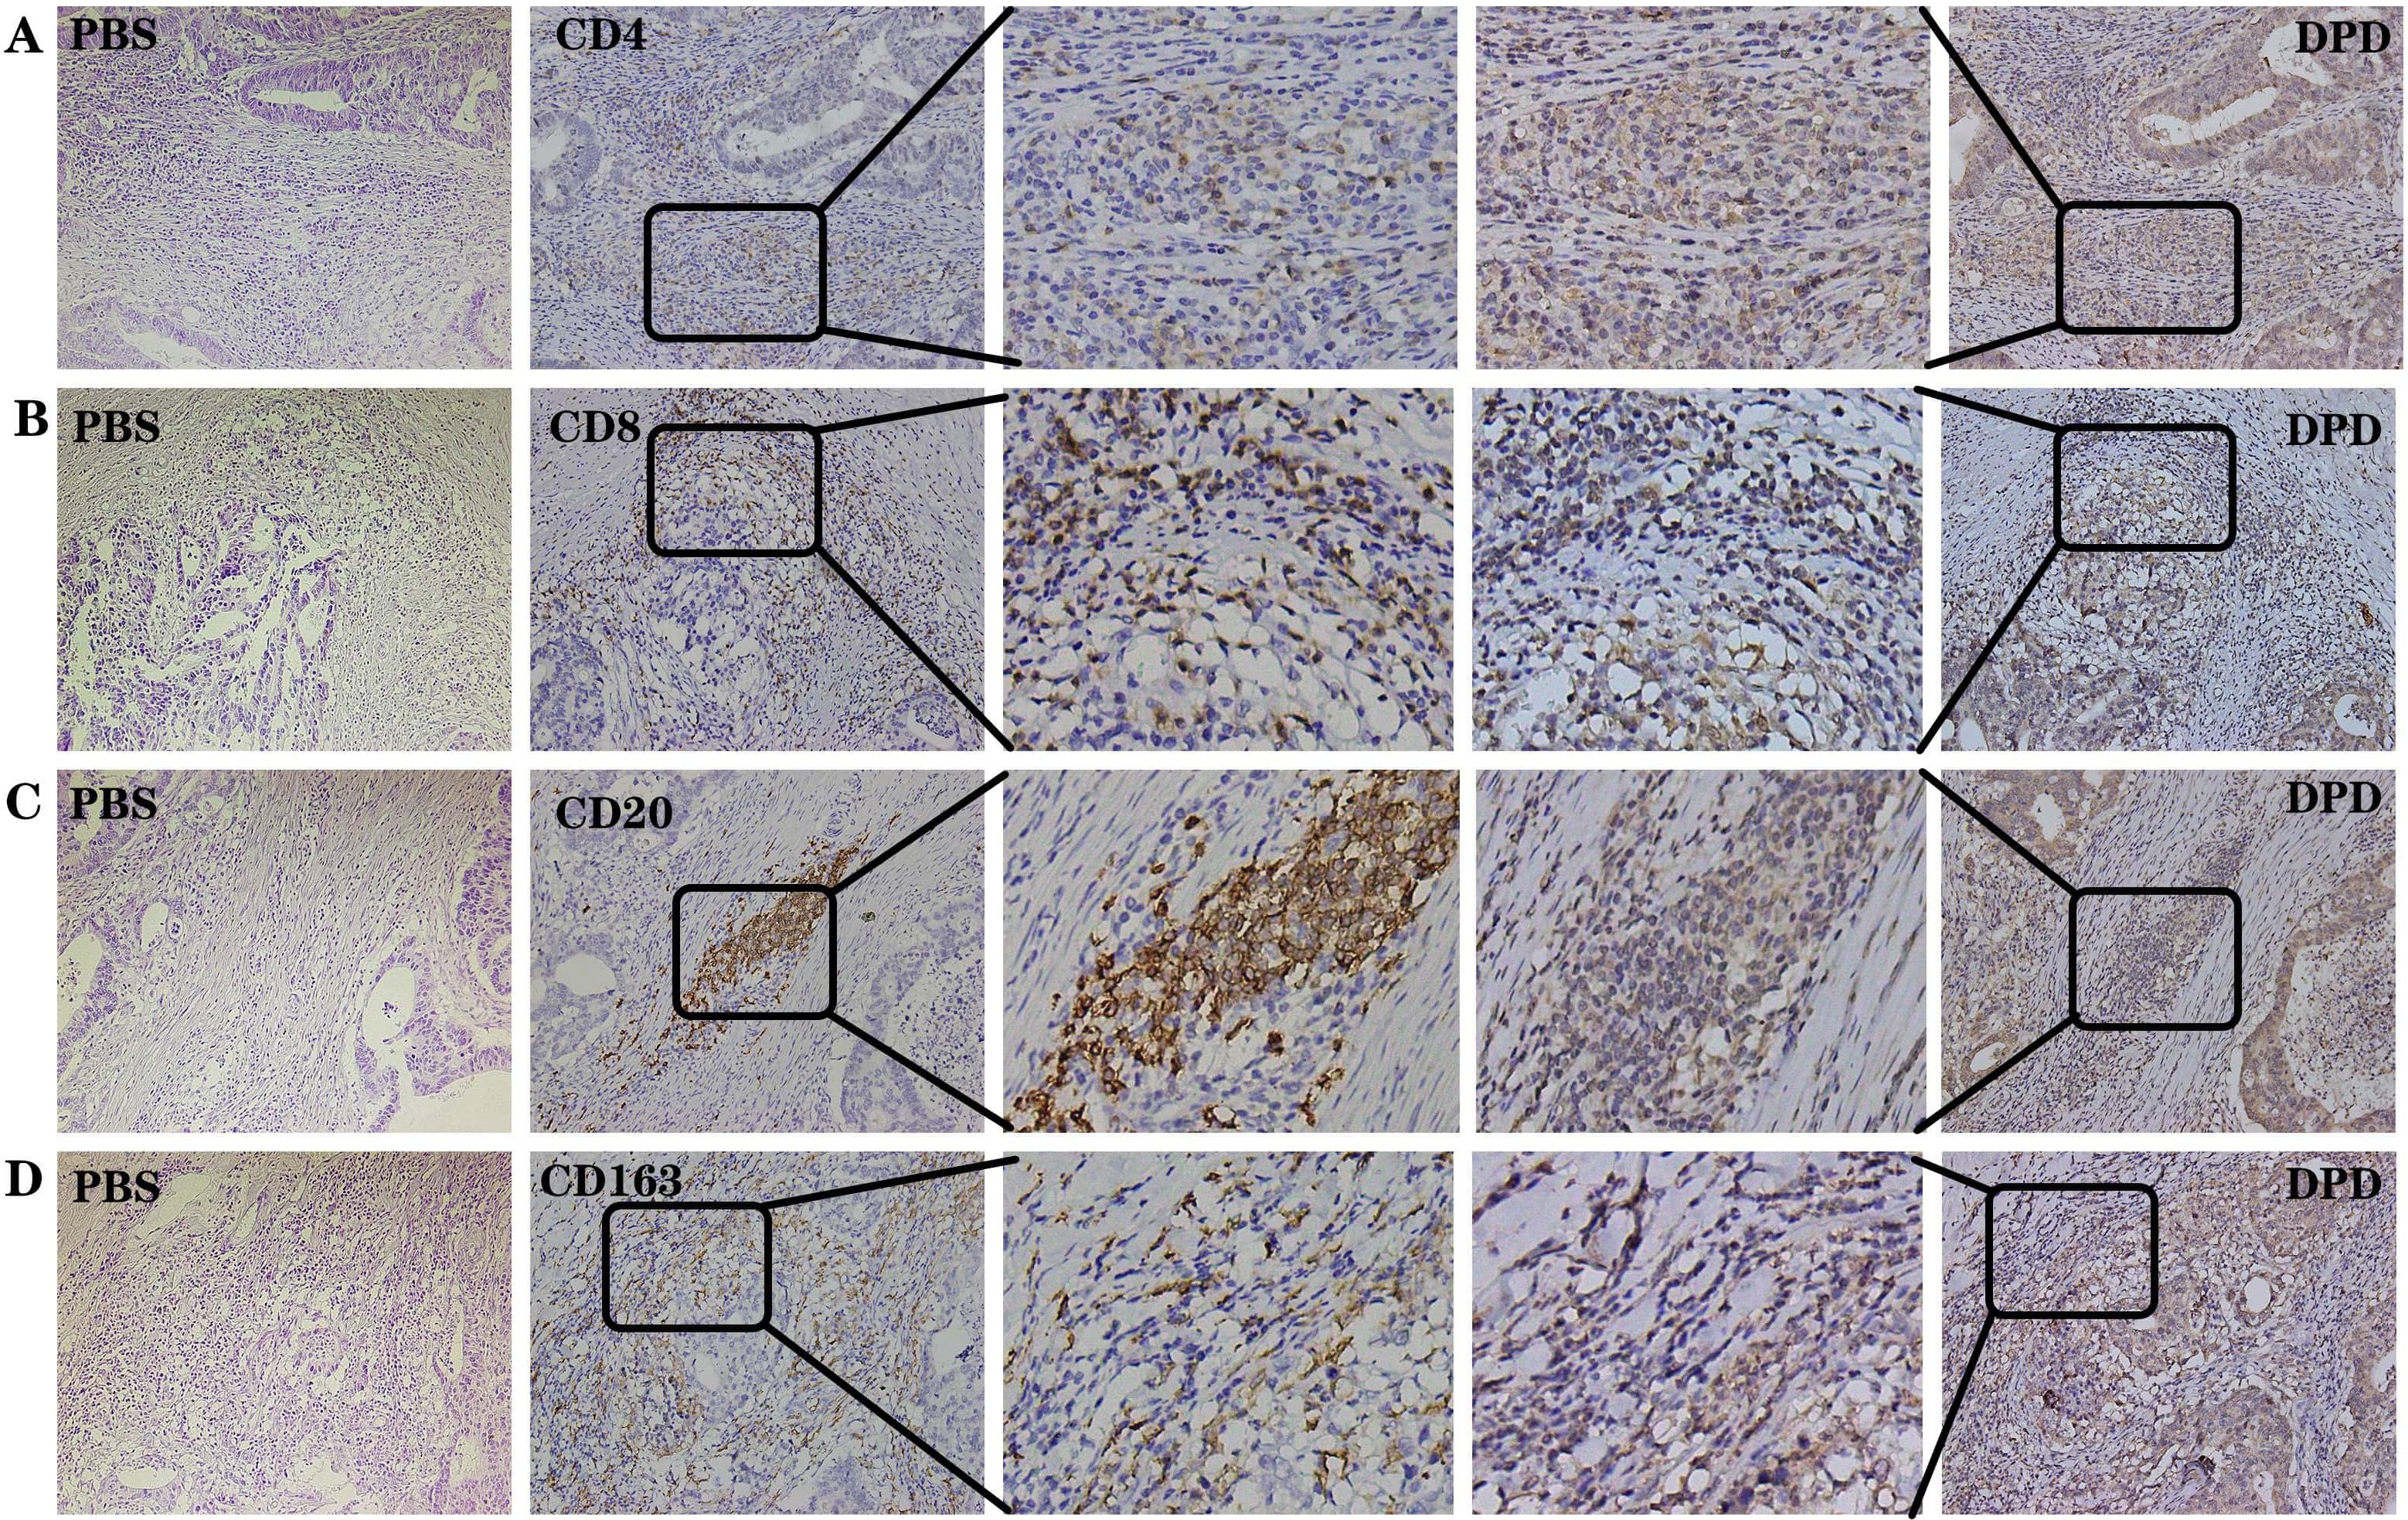 Fig. 2.
DPD and immune-related indexes were positively
expressed in the same region in the 30 samples with the strongest immune
infiltration. (A) Negative control, PBS. Positive control, CD4 and DPD. (B)
Negative control, PBS. Positive control, CD8 and DPD. (C) Negative control, PBS.
Positive control, CD20 and DPD. (D) Negative control, PBS. Positive control,
CD163 and DPD. The same sample was sliced continuously under the same field of
view. Magnification 200
According to the follow-up results of 219 cases of colorectal cancer, 115 with
poor prognoses were assigned to the chemotherapy-resistant group (10 cases with
recurrence after treatment, 19 cases with distant metastasis, and 86 fatal
cases); and the remaining 104 were assigned to the chemotherapy-sensitive group.
When we analyzed the relationship between DPD expression and drug resistance in
219 colon cancer samples we found that DPD expression was higher in the
chemotherapy-resistant group compared with that in the chemotherapy-sensitive
group. High expression of DPD significantly and positively correlated with
chemotherapy resistance (p
| n | DPD | r | p | ||
| + | – | ||||
| chemotherapy-resistance group | 115 | 86 | 29 | 0.367 | |
| chemotherapy-sensitive group | 104 | 40 | 64 | ||
| Note: High expression of DPD significantly and positively correlated with
chemotherapy resistance. Significant correlation: *p | |||||
Statistical analysis of DPD expression patterns in cancer and immune cells
allowed us to allocate the samples into the groups as follows: cancer cell + and
immune cell + group (n = 80), cancer cell + and immune cell – group (n = 45),
cancer cell – and immune cell + group (n = 3), and cancer cell – and immune
cell – group (n = 91) (Fig. 3). The small sample size of the cancer cell – and
immune cell + group excluded it from this analysis. Thus, the 216 remaining cases
were analyzed. DPD expression and survival data for 216 colon cancer samples were
analyzed. We found that high DPD expression predicted poor prognosis, with the
most unfavorable prognosis associated with the cancer cell + and immune cell +
group; and the most favorable prognosis associated with the cancer cell – and
immune cell – group (p
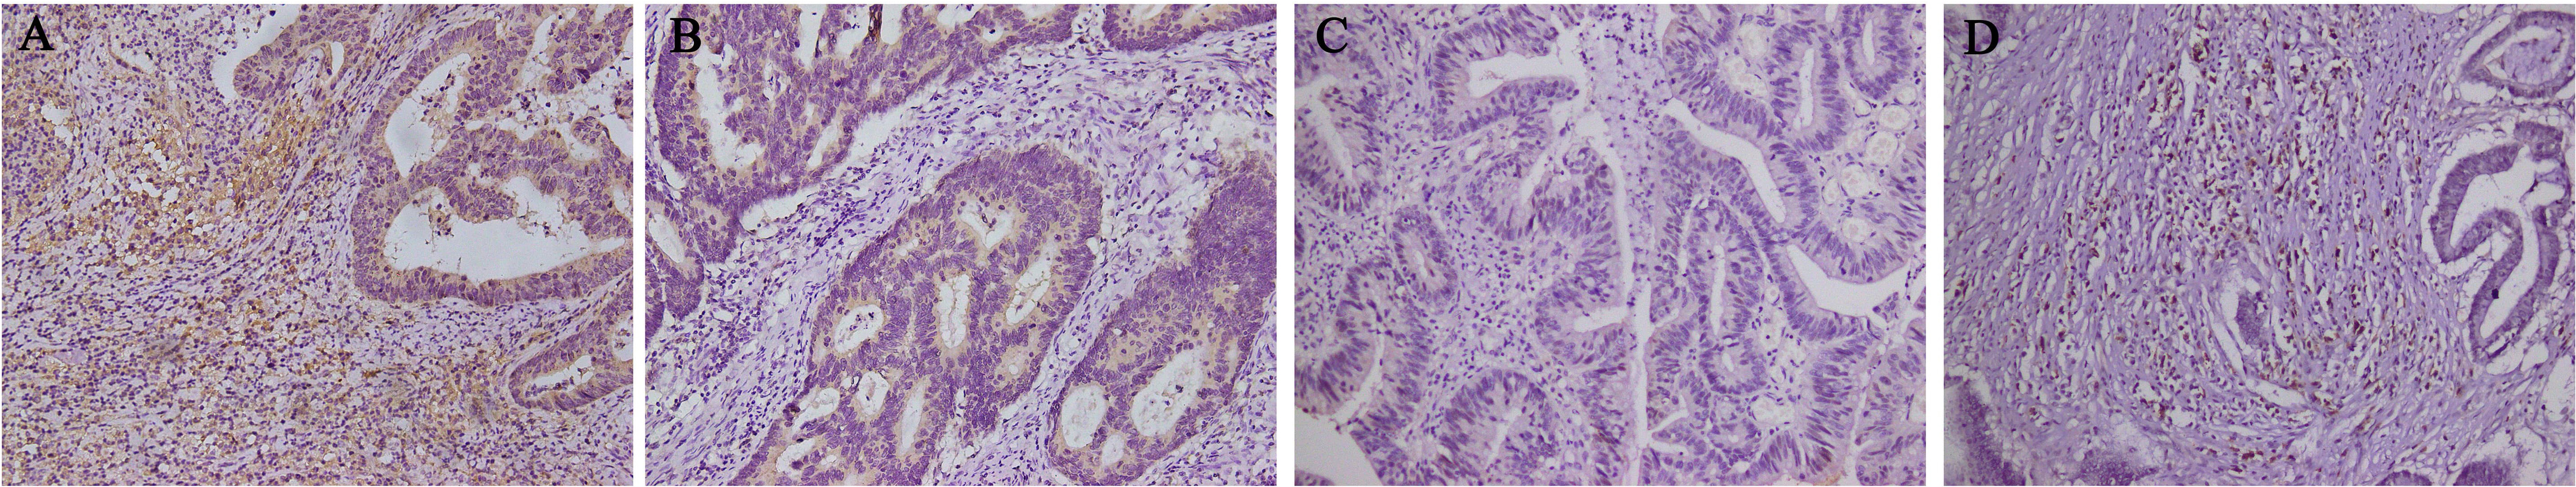 Fig. 3.
Basis of groupings according to the localization of DPD
expression (n = 219). (A) DPD expression in tumor cells and immune cells (n = 80).
(B) DPD expression in tumor cells but not in immune cells (n = 45). (C) DPD was
not expressed in tumor cells and immune cells (n = 91). (D) DPD was not expressed
in tumor cells but was in immune cells (n = 3). Magnification 200
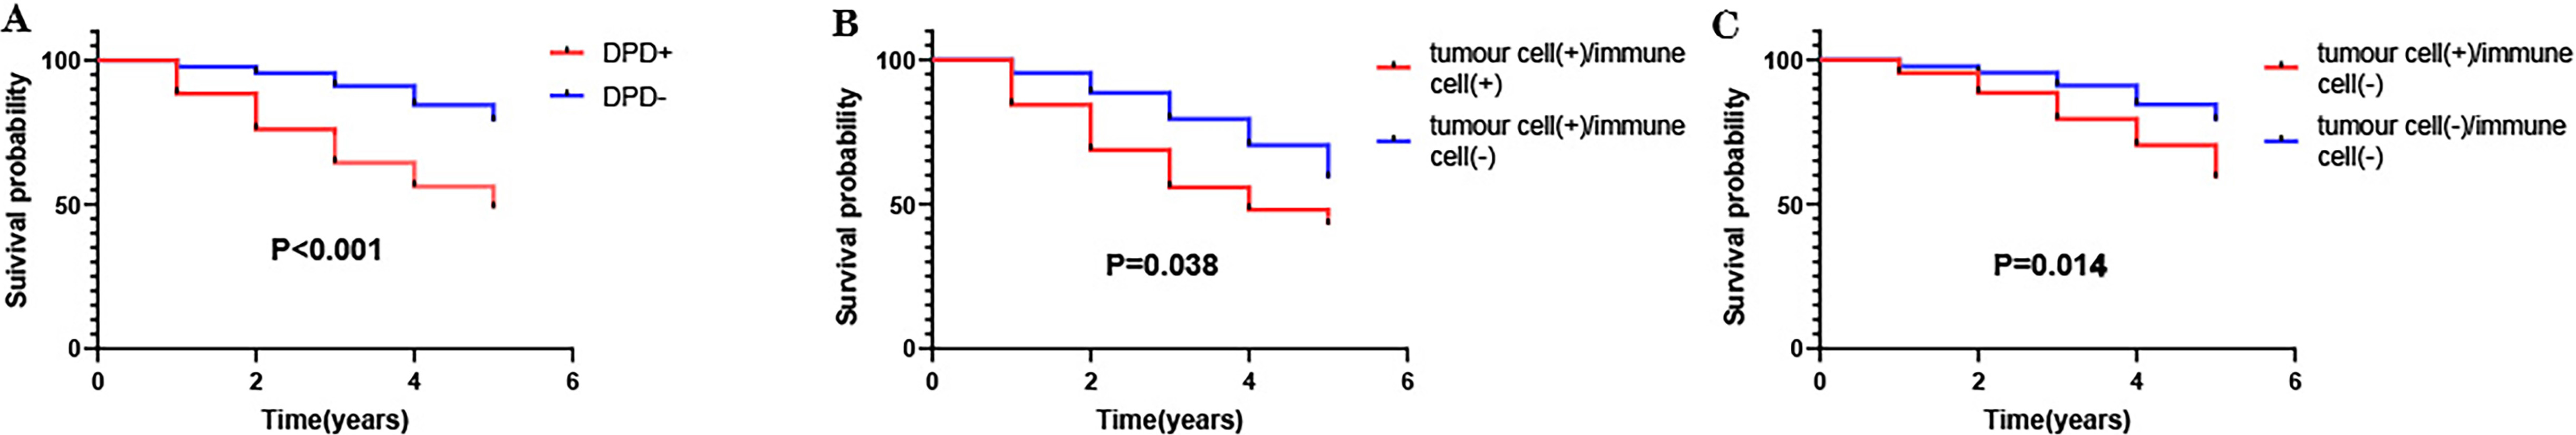 Fig. 4.
Association of DPD expression with survival of patients with colon cancer (n = 216). (A) Compared with the DPD-positive group (n = 125), the prognosis of the DPD-negative group (n = 91) was better. (B) Compared with the cancer cell + and immune cell + group (n = 80), the cancer cell + and immune cell – group (n = 45) experienced better prognosis. (C) Compared with the cancer cell + and immune cell – group (n = 45), the cancer cell – and immune cell – group (n = 91) experienced better prognosis.
| n | DPD | |||
|---|---|---|---|---|
| cancer cell +/immune cell + | cancer cell +/immune cell – | cancer cell –/immune cell – | ||
| chemotherapy-resistance group | 115 | 59 (51.3) | 27 (23.5) | 29 (25.2) |
| chemotherapy-sensitive group | 101 | 21 (20.8) | 18 (17.8) | 62 (61.4) |
| Note: DPD expression was higher in the chemotherapy-resistant group compared with that in the chemotherapy-sensitive group. | ||||
We then analyzed the correlation between DPD expression and immunoinfiltration
in these patients. This analysis revealed
that the number of immune cells in the cancer cell + and immune cell + group was
significantly higher compared with the other two groups (p
| DPD | n | immune infiltration amount | r | p | |
| + | – | ||||
| cancer cell + and immune cell + | 80 | 65 | 15 | 0.539 | |
| cancer cell + and immune cell – | 45 | 12 | 33 | ||
| cancer cell + and immune cell + | 80 | 65 | 15 | 0.413 | |
| cancer cell – and immune cell – | 91 | 37 | 54 | ||
| cancer cell + and immune cell – | 45 | 12 | 33 | –0.137 | 0.111 |
| cancer cell – and immune cell – | 91 | 37 | 54 | ||
| Note: The cancer cell + and immune cell + group positively correlated with the
number of immune cells. The numbers of immune cells in the cancer + and immune
cell – group and the cancer – and immune cell – groups were not significantly
different. Significant correlation: *p | |||||
Through bioinformatics analysis, we found that among 33 common cancers, DPD
exhibited the strongest significant positive correlation with MSI and TMB in
colon cancer (Fig. 5,
Supplementary 2,3). According to the MLH1, MSH2, MSH6, and PMS2 IHC staining results (Fig. 6A–I), 219 samples were divided into MSS (n = 187) and MSI (n = 32) groups.
According to the analysis of the muTarget database, mutation of MSH6 was
associated with increased DPD expression (Table 4). Furthermore, among patients
(n = 32) with MSI, the expression of DPD significantly and positively correlated
with the deletion of MSH6 (Fig. 6J–N, Table 5). Moreover, Statistical
analysis revealed that MSI significantly and positively
correlated with DPD expression and immune infiltration (p
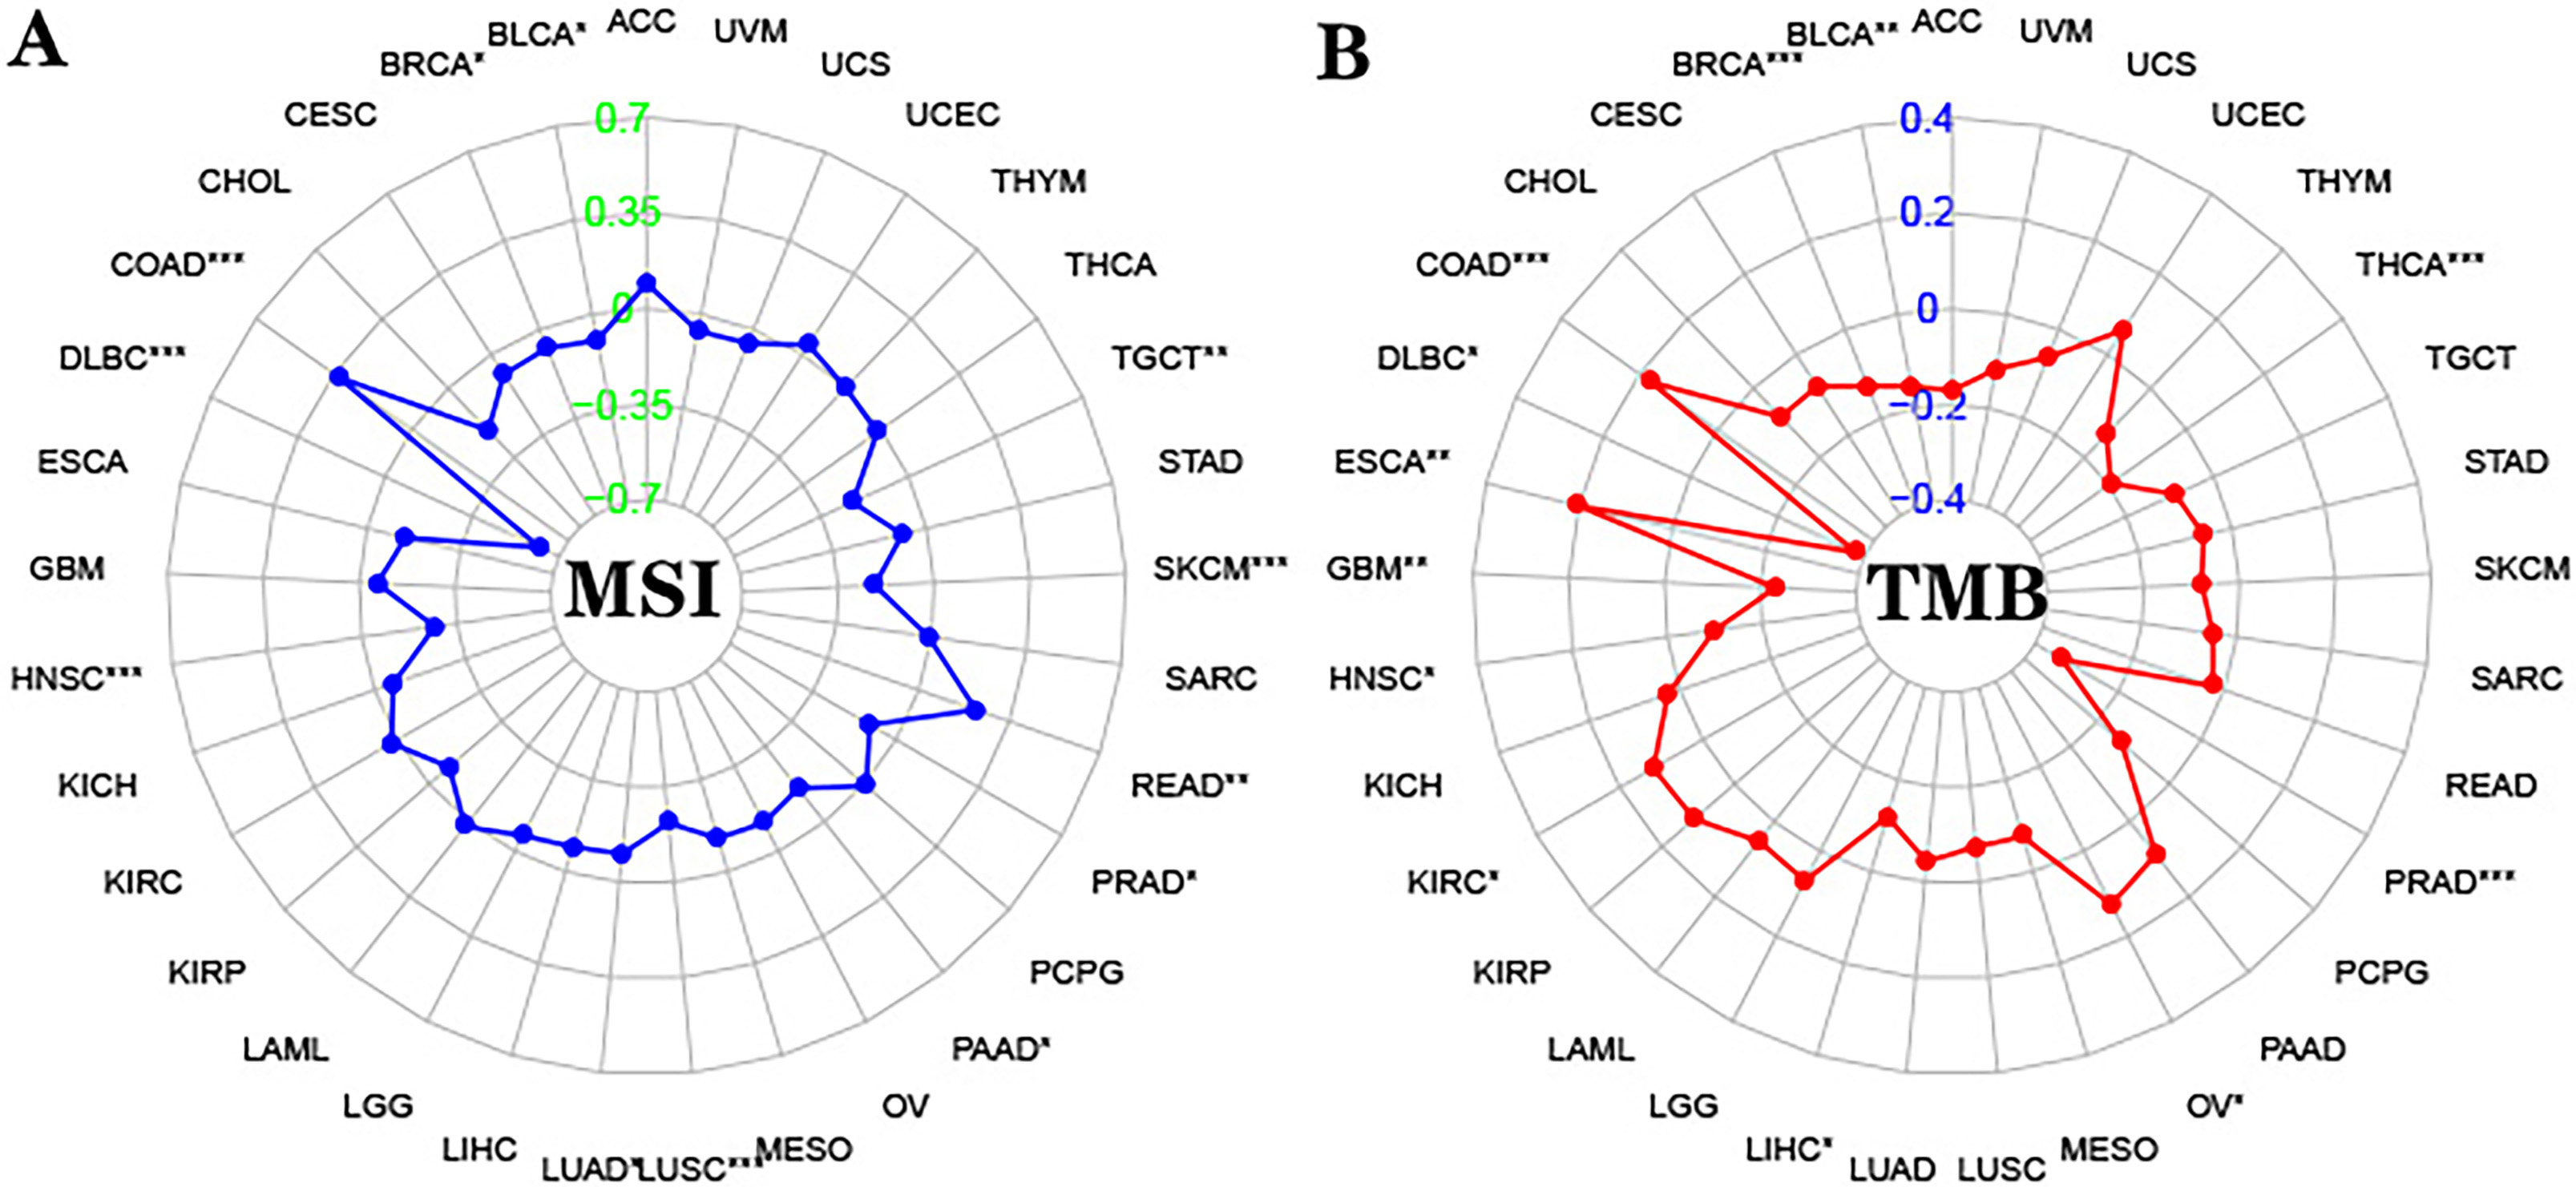 Fig. 5.
Correlation between DPD and MSI/TMB. (A) Correlation between
DPD expression and MSI in 33 types of cancer (DPD and MSI significantly and
positively correlated in COAD). (B) Correlation between DPD expression and TMB in
33 types of cancer (DPD and TMB significantly and positively correlated in COAD).
Abbreviations: ACC, Adrenocortical carcinoma; BLCA, Bladder Urothelial Carcinoma;
BRCA, Breast invasive carcinoma; CESC, Cervical squamous cell carcinoma and
endocervical adenocarcinoma; CHOL, Cholangiocarcinoma; COAD, Colon
adenocarcinoma; DLBC, Lymphoid Neoplasm Diffuse Large B-cell Lymphoma; ESCA,
Esophageal carcinoma; GBM, Glioblastoma multiforme; HNSC, Head and Neck squamous
cell carcinoma; KICH, Kidney Chromophobe; KIRC, Kidney renal clear cell
carcinoma; KIRP, Kidney renal papillary cell carcinoma; LAML, Acute Myeloid
Leukemia; LGG, Brain Lower Grade Glioma; LIHC, Liver hepatocellular carcinoma;
LUAD, Lung adenocarcinoma; LUSC, Lung squamous cell carcinoma; MESO,
Mesothelioma; OV, Ovarian serous cystadenocarcinoma; PAAD, Pancreatic
adenocarcinoma; PCPG, Pheochromocytoma and Paraganglioma; PRAD, Prostate
adenocarcinoma; READ, Rectum adenocarcinoma; SARC, Sarcoma; SKCM, Skin Cutaneous
Melanoma; STAD, Stomach adenocarcinoma; TGCT, Testicular Germ Cell Tumors; THCA,
Thyroid carcinoma; THYM, Thymoma; UCEC, Uterine Corpus Endometrial Carcinoma;
UCS, Uterine Carcinosarcoma; UVM, Uveal Melanoma (*: p
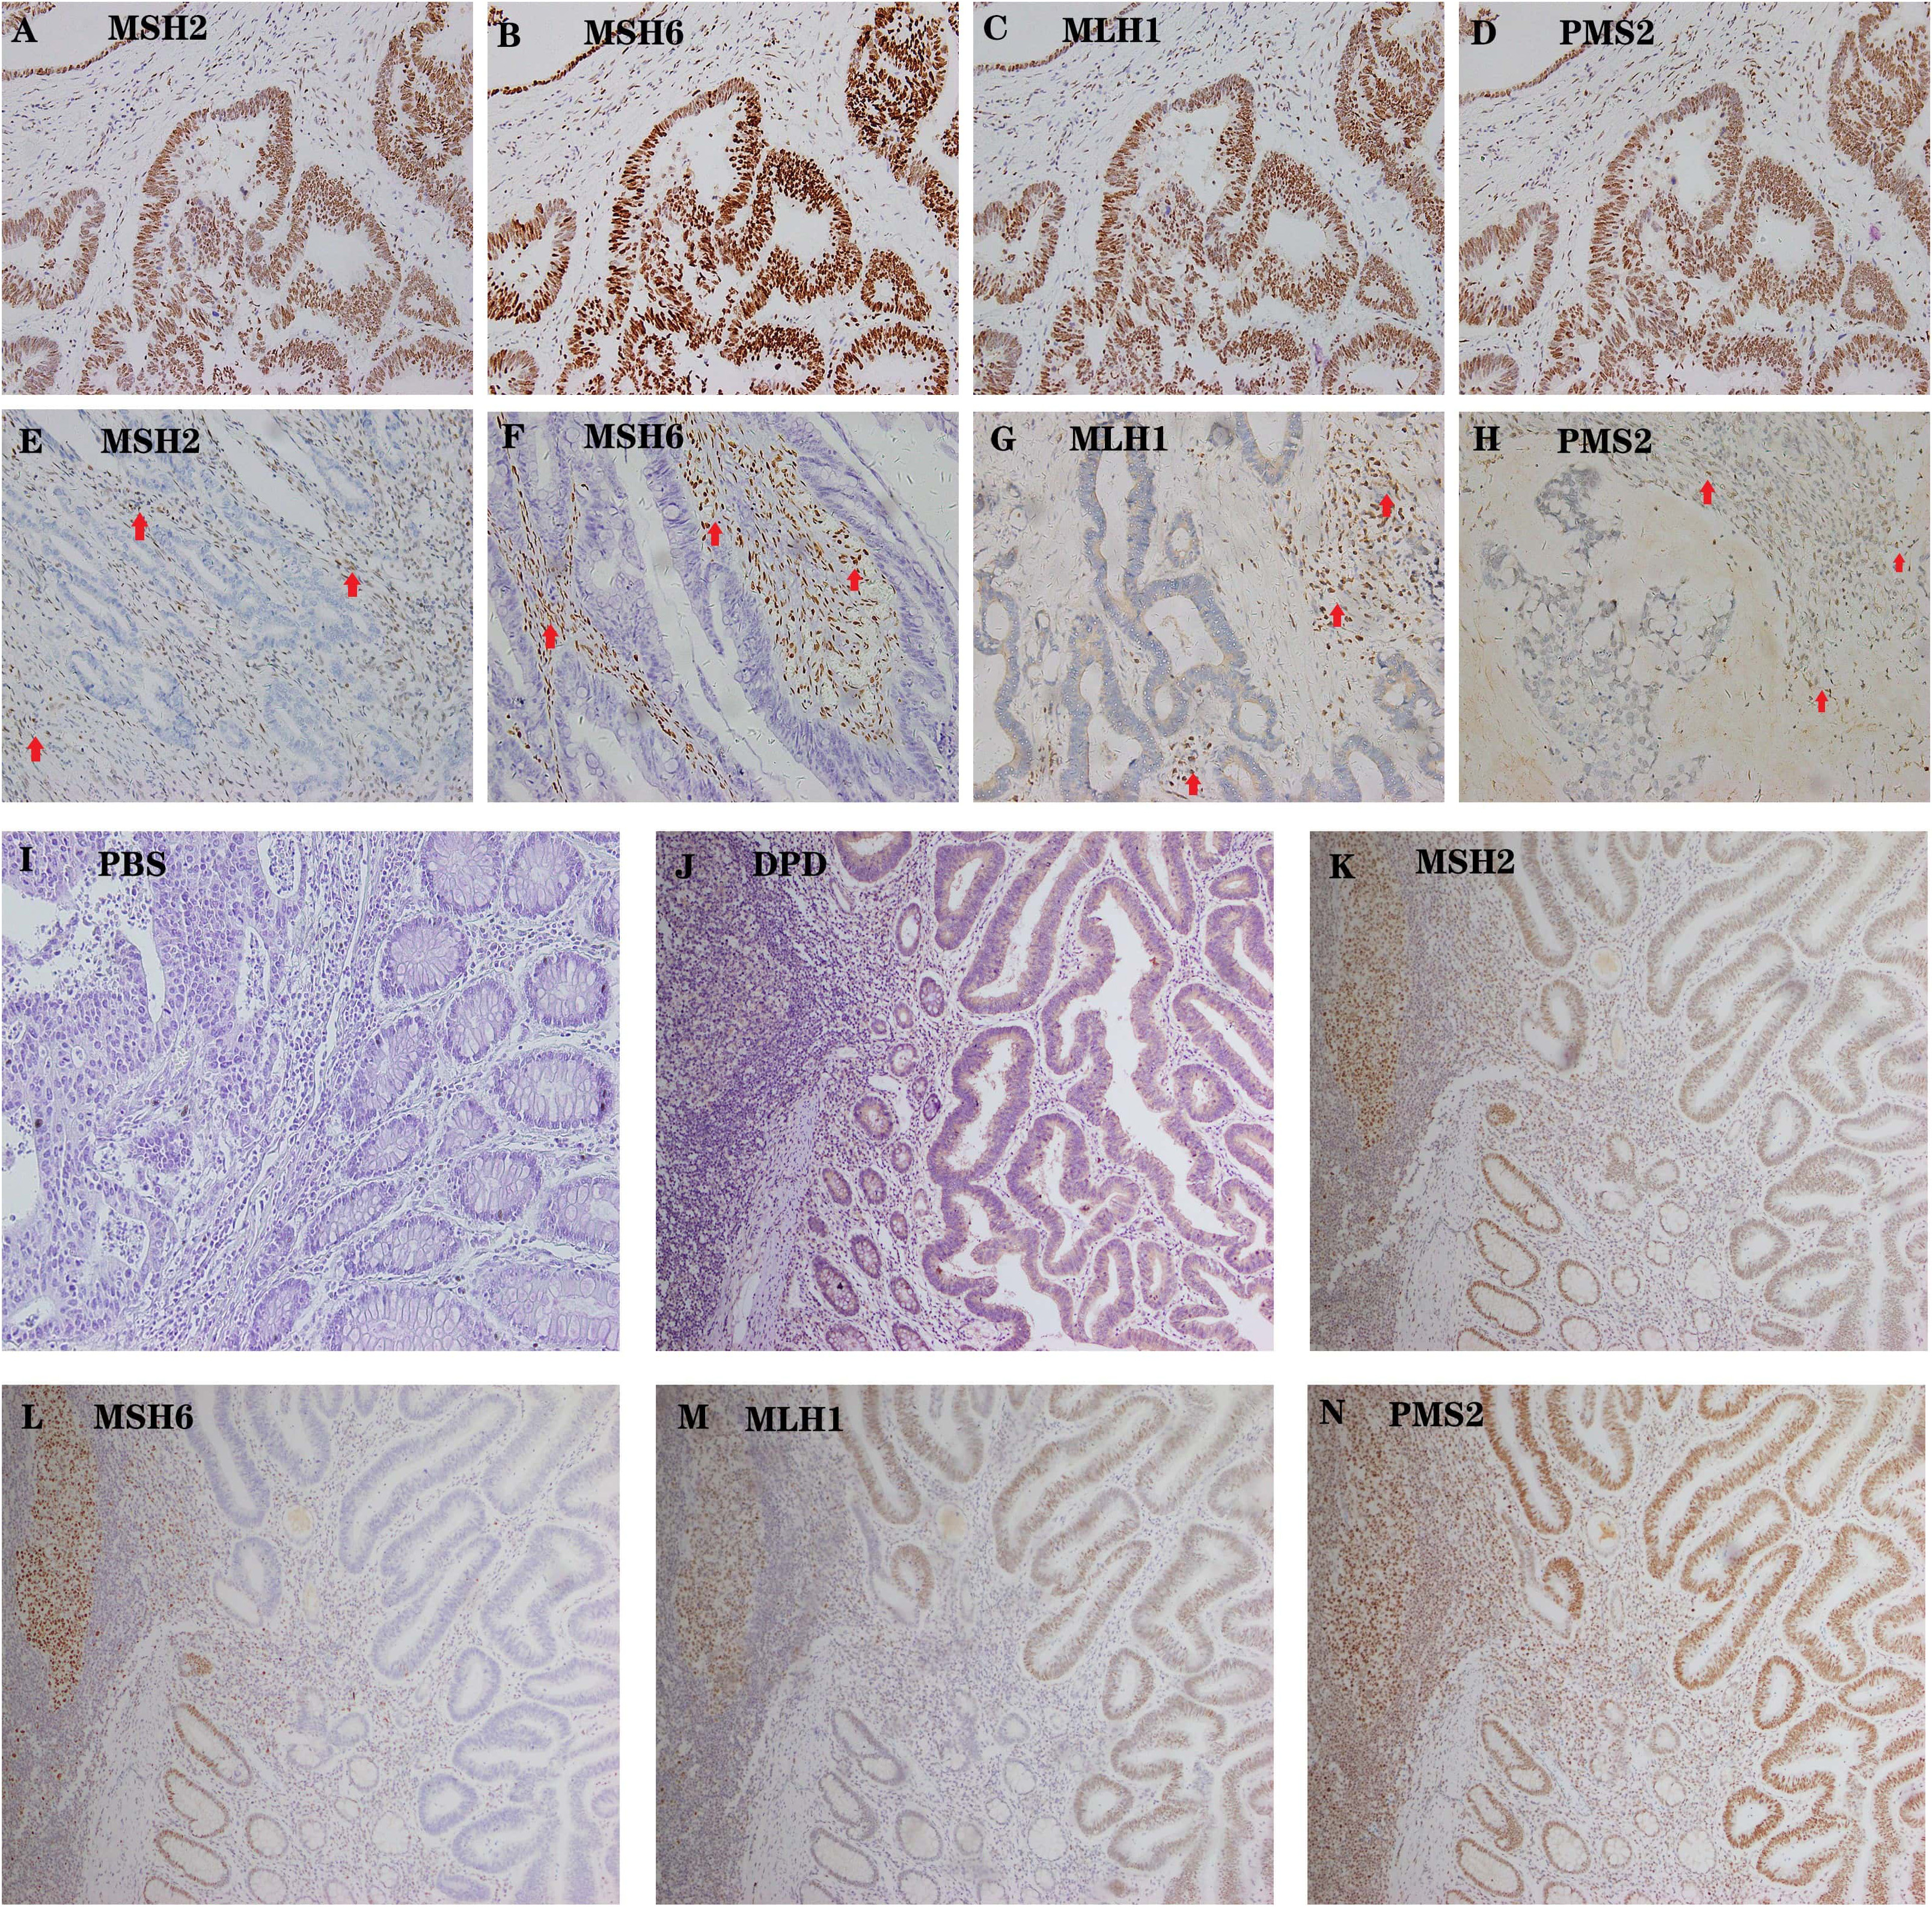 Fig. 6.
Representative examples of MSS AND MSI colon cancer. (A–D)
High expression of MSH2, MSH6, MLH1 and PMS2 in tumor cells as well as the
internal positive control (lymphocytes). Magnification 200
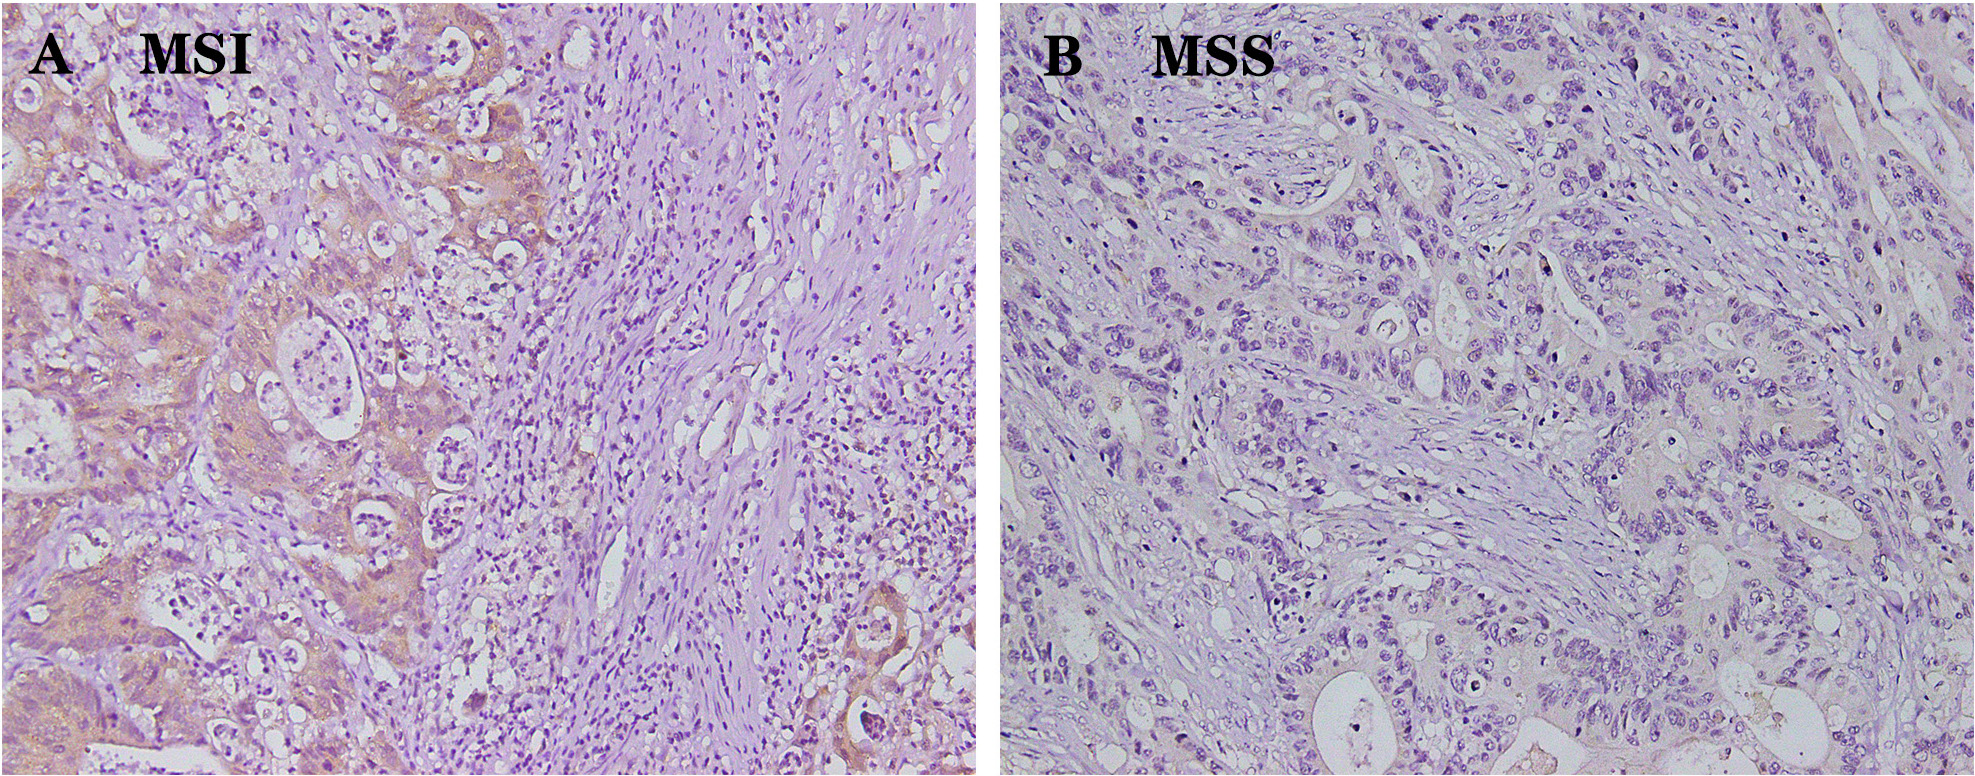 Fig. 7.
MSI was associated with increased DPD expression and increased
number of immune cells (n = 219). (A) In MSI patients, DPD expression and the
number of immune cells was high (The number of immune cells is higher than
average). (B) In MSS patients, DPD expression and the number of immune cells was
low (The number of immune cells is lower than average). Magnification
200
| Expression of | Mean mutant (n = 19) | Mean wild (n = 377) | FC (mutant/wild) | Direction | p-value |
| DPYD | 379.89 | 252 | 1.51 | up | 0.00953* |
| Note: Mutation of MSH6 was associated with increased DPD expression. Datas from
muTarget database. Significant correlation: *p | |||||
| n | DPD | r | p | ||
| + | – | ||||
| MSH6– | 10 | 10 | 0 | 0.357 | 0.045* |
| MSH6+ | 22 | 15 | 7 | ||
| Note: The expression of DPD significantly and positively correlated with the
deletion of MSH6. Significant correlation: *p | |||||
| n | DPD | r | p | immune infiltration amount | r | p | |||
| + | – | + | – | ||||||
| MSI | 32 | 25 | 7 | 0.172 | 0.011* | 23 | 9 | 0.153 | 0.024* |
| MSS | 187 | 101 | 86 | 94 | 93 | ||||
| Note: MSI significantly and positively correlated with DPD expression and immune
infiltration. Significant correlation: *p | |||||||||
GSEA revealed that high expression of DPD was enriched in gene sets related to “macrophage activation” and “T cells activation”, “positive regulation of immune effector process”, “positive regulation of cytokine production” (Fig. 8A), and in “Toll-like receptor signaling pathway” and “chemokine signaling pathway”, “cytokine-cytokine receptor interaction”, and “NOD-like receptor signaling pathway” (Fig. 8B). In summary, GSEA analysis identified a series of key immune-related functions and pathways. These findings suggest that DPD may affect tumor progression through its deep involvement in tumor immunomodulation.
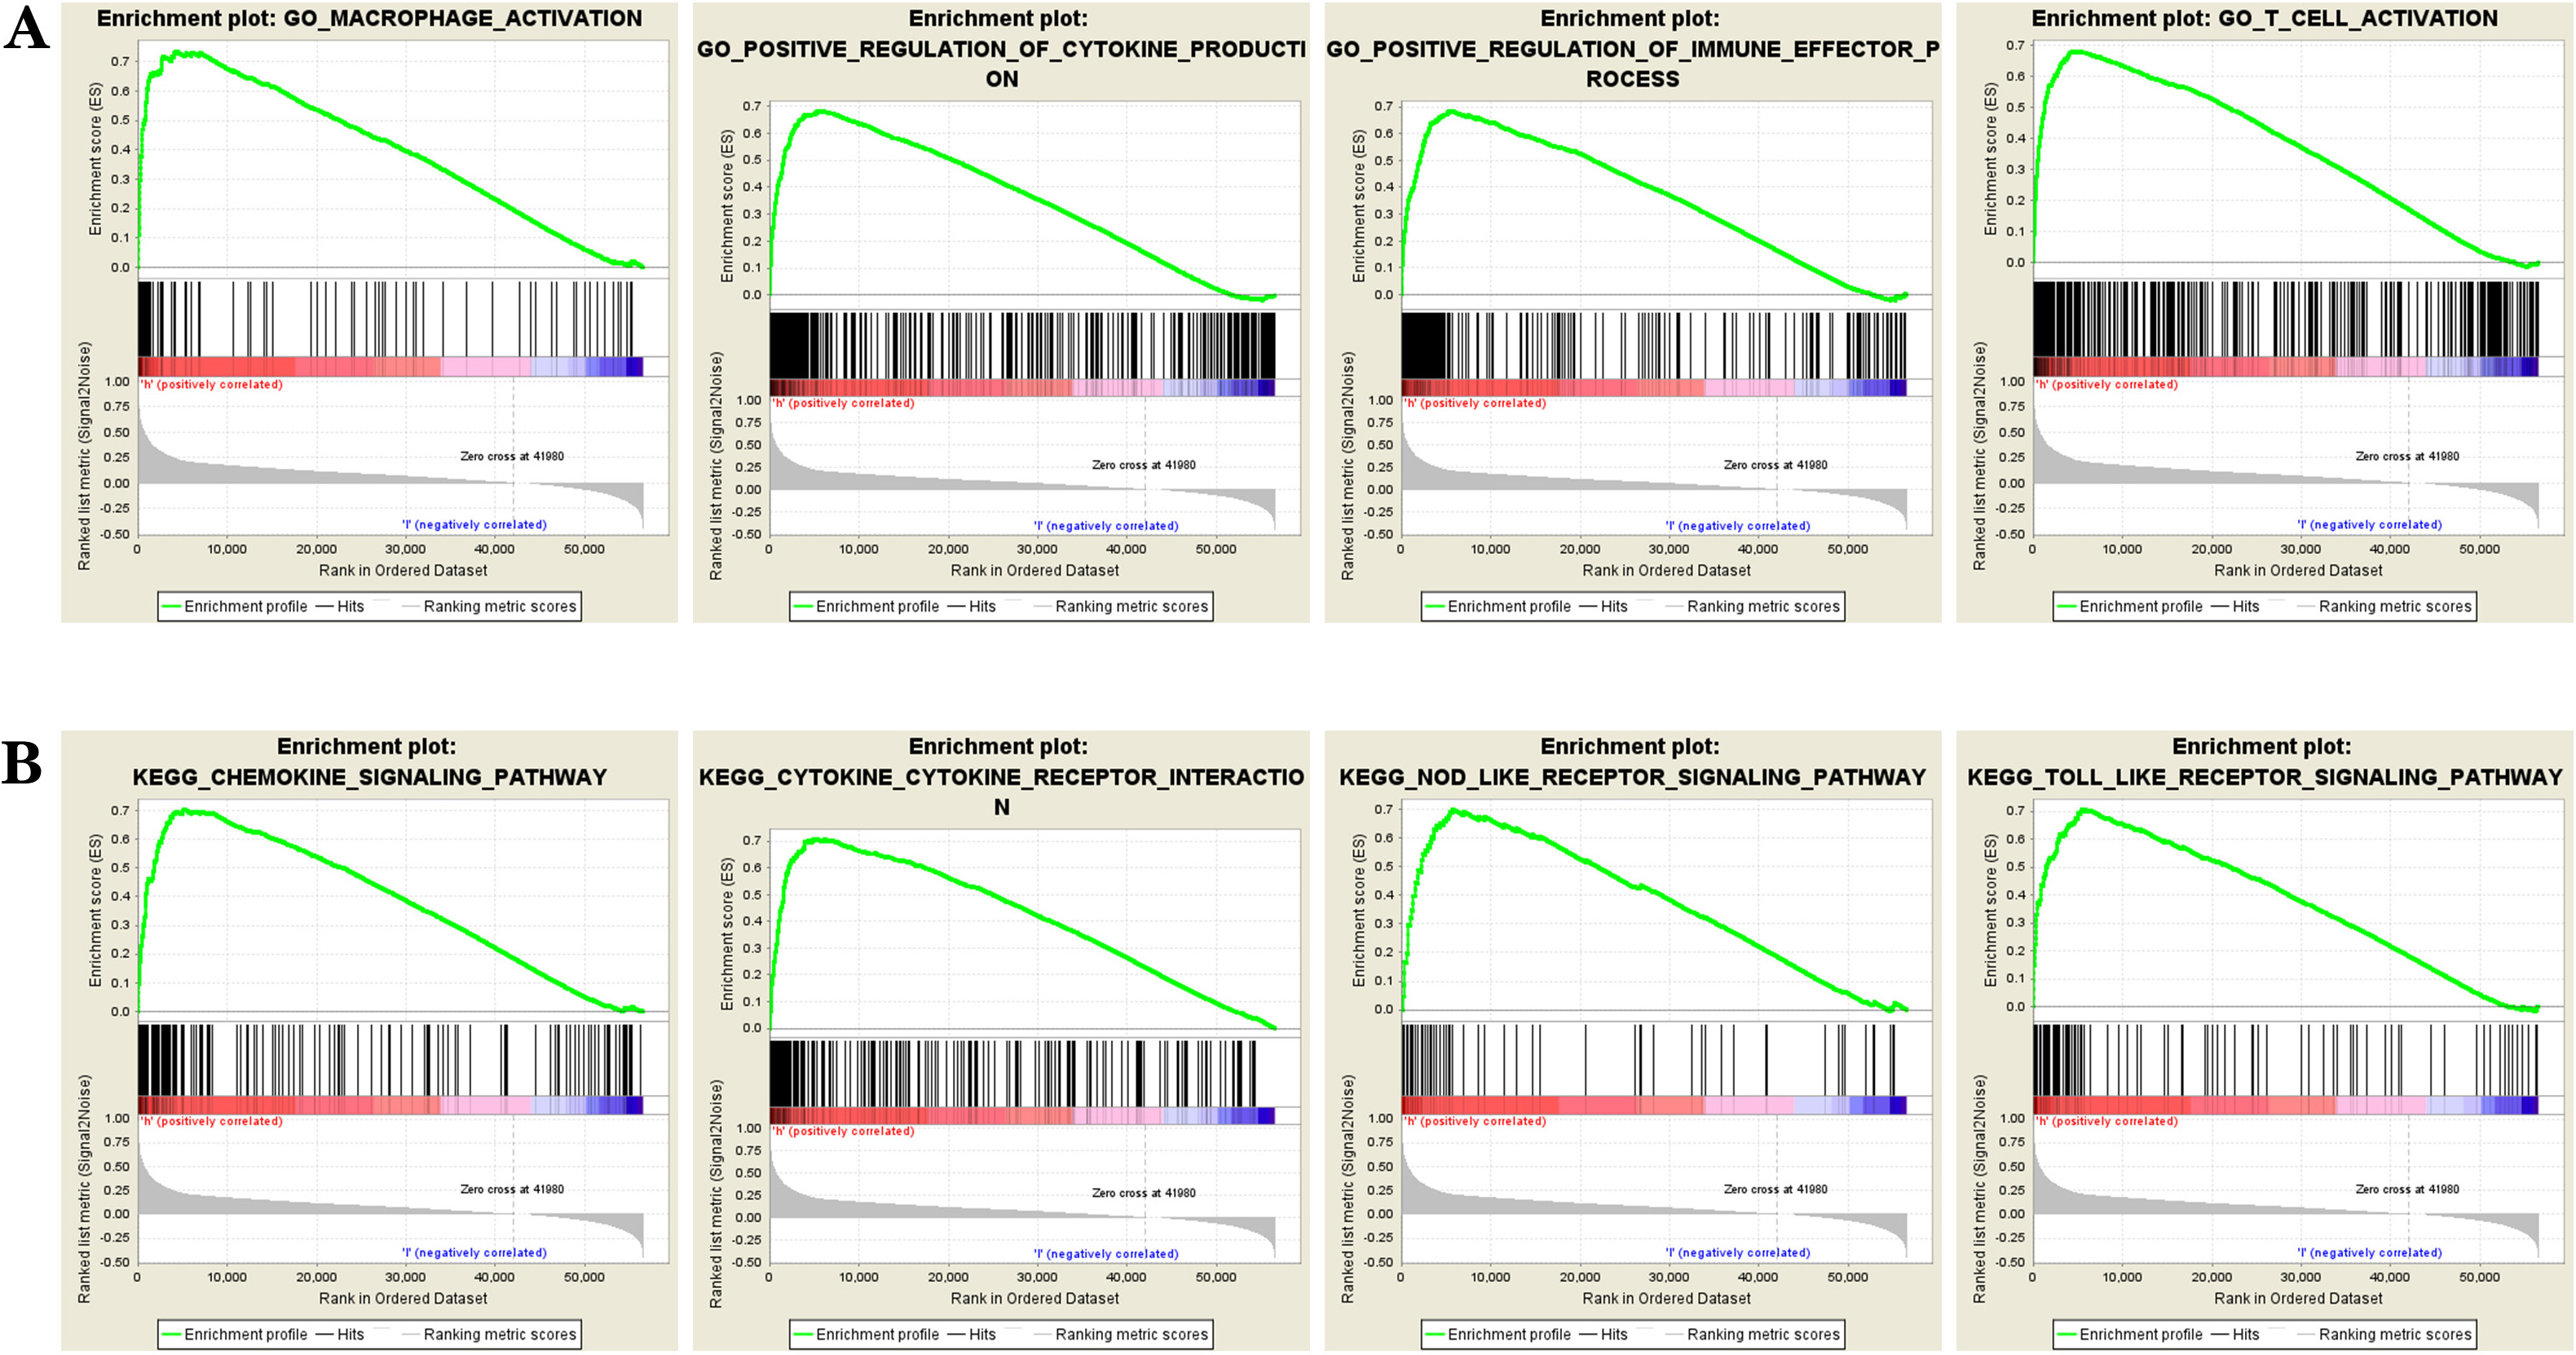 Fig. 8.
DPD enrichment analysis in colon cancer. (A) DPD is enriched in the terms “macrophage activation” and “T cells activation”, “positive regulation of immune effector process”, “positive regulation of cytokine production” and other functions. (B) DPD is enriched in the Toll-like receptor signaling pathway and chemokine signaling pathway, “cytokine-cytokine receptor interaction”, and “NOD-like receptor signaling pathway”. GSEA analysis identified a series of key immune-related functions and pathways. These findings suggest that DPD may affect tumor progression and prognosis through its deep involvement in tumor immunomodulation.
DPD, which catalyzes the initial reaction in the pathway that metabolizes 5-FU
as well as the rate-limiting reaction [5], contributes to the drug resistance of
colon cancer [3] and has always been one of the hotspots in drug resistance of
colon cancer. Although Takenoue et al. [7] reported 22 years ago that
DPD is mainly expressed in the cytoplasm of macrophages and plasma cells of
patients with colon cancer, no studies on the relationship between DPD and the
immune microenvironment of colon cancer were published during this time. At the
end of 2021, Malier et al. [3] reported that high expression of
macrophage DPD leads to increases drug resistance in colon cancer through a
mechanism potentially involving an eIF4E2-dependent mechanism independent of the
activity of the master transcription factor HIF-2
Here we show that DPD expression indicated poor prognosis and significantly correlated with tumor-associated immune cells and immune cell markers (B cells, CD4+ T cells and CD8+ T cells, macrophages, neutrophils, dendritic cells, and macrophages); however, the correlation with lymphocytes was relatively weak. GSEA enrichment analysis revealed that DPD expression was enriched in activation of T cells and macrophages, regulation of cytokines, and participation in immune and other functions as well as in the Toll-like receptor and chemokine signaling pathways. Other associations included those with cytokine and receptor interactions, the NOD-like receptor signaling pathway, and other pathways. Numerous studies show that these functions and pathways are closely related to tumor immunity. For example, Ozga et al. [8] showed that chemokines provide effective antitumor immune responses and participate in the generation and recruitment of immune cells, thus regulating the microenvironment that promotes tumorigenesis. Furthermore, Patra et al. [9] showed that Toll-like receptor-induced cytokines serve as immunotherapeutic targets in cancers and autoimmune diseases. Wicherska-Pawłowska et al. [10] showed that natural and synthetic agonists of Toll-like receptors and NOD-like receptors trigger death of malignant cells, recruit immune cells into the tumor microenvironment, and therefore are being explored as promising adjuvants in cancer immunotherapies. These results suggest that DPD plays an important role in regulating the immune response to colon cancer and promoting immune infiltration.
IHC data and analysis of the morphological characteristics of different cells in sections of colon cancer tissue revealed that DPD was expressed in cancer cells as well as in immune cells, which we refer to as “positive expression regions” with diverse phenotypes, but particularly in macrophages, which is consistent with immune-related functions and pathways predicted by GSEA enrichment analysis. We therefore speculate that DPD is required for the activation and recruitment of certain immune cells, such as macrophages. For example, we found that the expression of DPD positively correlated with the extent of immune cell infiltration. Further analysis revealed that the degree of immune cell infiltration was closely related to the expression of DPD in immune cells, but not in cancer tissues, suggesting that the high expression of DPD in immune cells rather than tumor cells is the main cause of immune invasion.
B cells, particularly plasma cells and dendritic cells, mediate antigen presentation and induction of immune invasion [11, 12, 13, 14]. We speculate that high expression of DPD promotes this process, which explains our observations that high expression of DPD in immune cells is often accompanied by an increase in immune invasion. Moreover, DPD expression strongly and positively correlated with tumor-associated immune cells and immune cell markers.
The presence of tumor-associated M2 macrophages tends to lead to poor prognosis, in contrast to that of M1 macrophages [15, 16]. For example, Malier et al. [3] showed that DPD is highly expressed in CD68- and CD163-positive macrophages. However, our present bioinformatics analysis did not detect an association of DPD expression with the M1 macrophage marker NOS2, leading us to speculate that a regulatory mechanism that determines the expression levels of DPD in the tumor immune microenvironment involves the recruitment and activation of M2 macrophages rather than M1-type macrophages. These events promote the role of M2 macrophages, thus leading to the tumor-promoting effects of DPD. Although DPD is expressed in other tumor-inhibiting immune cells in regions harboring CD8+ T cells [17], its expression levels did not significantly correlate with the pathogenesis of colon cancer. We therefore speculate that DPD plays a minor role in CD8+ T cells. The tumor-promoting effect of DPD through regulating the immune microenvironment is stronger than the tumor inhibiting effect, which in turn leads to poor prognosis rather than tumor-inhibiting effects.
Malier et al. [3] found that high expression of DPD in macrophages after hypoxia induction leads to 5-FU resistance, although the expression of DPD in cancer tissues is not high. However, we show here that in the absence of hypoxia induction, DPD was highly expressed in cancer tissues of some colon cancer patients and in immune cells, include macrophages. Thus, DPD may be highly expressed in other immune cells, such as B cells, T cells, etc. To study the relationship between high expression of DPD in immune cells and drug resistance, we divided clinical cases into chemotherapy-resistant and chemotherapy-sensitive groups and subdivided them into groups according to DPD expression as follows: Cancer cells + and immune cells + group, cancer cells + and immune cells – group, cancer cells - and immune cells + group, cancer cells – and immune cells – group. We found the interesting result as follows: of the 219 samples, 80 were assigned to the cancer + and immune + group, 45 to the cancer + and immune – group, 91 to the cancer – and immune – group, and 3 to the cancer – and immune + group. These findings suggest that hypoxia induction exerts a more significant effect on the expression of DPD in immune cells compared with cancer cells, albeit through an unknown mechanism. However, the absence of hypoxia samples data is a study limitation and we were unable to exclude an artifact caused by insufficient sample size.
Further analysis showed that the number of cancer cells + and immune cells + cases accounted for the highest proportion of cases in the chemotherapy-resistant group; and the number of cancer cells – and immune cells – cases accounted for the highest proportion in the chemotherapy-sensitive group. Furthermore, the prognosis associated with the cancer cells + and immune cells + group was the most unfavorable, whereas the prognosis of the cancer cells – and immune cells – group was the most favorable. These findings suggest that expression of DPD in cancer cells and tumor-infiltrating immune cells leads to drug resistance, which in turn leads to poor prognosis.
MSI and TMB [18, 19] are important indicators for predicting the outcome of immunotherapy. Here we found that among 33 common cancers, colon cancer was associated with the most significant positive correlations between DPD, MSI, and TMB. We further used IHC to analyze the relationship between MSI and DPD by dividing the cases into MSS and MSI phenotypes. We found that MSI positively correlated with DPD and the extent of immune infiltration. Moreover, the tissues of the MSI group frequently expressed high levels of DPD and were characterized by large numbers of infiltrating immune cells.
We believe that although the high expression of MSI and DPD indicates a high level of immune invasion, high expression of DPD recruits M2 macrophages and other tumor-promoting immune cells, which enhances their tumor-promoting effect. Moreover, as a rate-limiting enzyme in 5-FU metabolism, DPD will directly induce resistance to 5-FU, which leads to poor prognosis. These events may explain why the five-year survival rate of some colorectal cancer patients with MSI is lower after 5-FU treatment, although the extent of immune invasion is higher and easier to cure [20, 21]. We speculate that in patients with MSI, detecting the expression level of DPD predicts the therapeutic effect, which is of great clinical significance. However, more experiments are required to confirm this possibility. Moreover, these results indicate that DPD-induced resistance to 5-FU and the effect of the immune microenvironment significantly influenced the prognosis of patients with colon cancer. However, further research is required because of the small sample size of the MSI group.
Our bioinformatics analysis found that mutation of MSH6 leads to increased DPD expression, which may represent the mechanism through which MSI induces high expression of DPD. Although our IHC data support this possibility, further studies are required because of the small sample size.
Here we found a significant positive correlation between the expression levels of DPD and PD-1/PD-L1 (PDCD1/CD274). High expression of DPD indicates coordinately high expression of PD-1/PD-L1 and high TMB and MSI, which together lead to excessive immune cell infiltration, indicating that PD-1/PD-L1 inhibitors may improve prognosis. Thus, DPD potentially represents a new immune-related marker to predict the therapeutic efficacies of PD-1/PD-L1 inhibitors.
The present study on the relationship between DPD expression in the immune microenvironment of colon cancer and 5-FU resistance shows that DPD played an important role in linking the tumor immune microenvironment with 5-FU resistance. However, our study was limited to bioinformatic and IHC analyses. Functional analyses of DPD in colon cancer and immune cells are therefore required to support our hypotheses.
DPD, dihydropyrimidine dehydrogenase; IHC, Immunohistochemistry; MSI, microsatellite instability; TMB, tumor mutational burden; TCGA, The Cancer Genome Atlas; GO, Gene Ontology; KEGG, Kyoto Encyclopedia of Genes and Genomes; BP, Biological process; CC, Cellular component; MF, Molecular function; HPA, Human Protein Atlas; TIMER, Tumor IMmune Estimation Resource; UCSC Xena, Xena Functional Genomics Explorer; GSEA, Gene Set Enrichment Analysis; MSS, microsatellite stability; ACC, Adrenocortical carcinoma; BLCA, Bladder Urothelial Carcinoma; BRCA, Breast invasive carcinoma; CESC, Cervical squamous cell carcinoma and endocervical adenocarcinoma; CHOL, Cholangiocarcinoma; COAD, Colon adenocarcinoma; DLBC, Lymphoid Neoplasm Diffuse Large B-cell Lymphoma; ESCA, Esophageal carcinoma; GBM, Glioblastoma multiforme; HNSC, Head and Neck squamous cell carcinoma; KICH, Kidney Chromophobe; KIRC, Kidney renal clear cell carcinoma; KIRP, Kidney renal papillary cell carcinoma; LAML, Acute Myeloid Leukemia; LGG, Brain Lower Grade Glioma; LIHC, Liver hepatocellular carcinoma; LUAD, Lung adenocarcinoma; LUSC, Lung squamous cell carcinoma; MESO, Mesothelioma; OV, Ovarian serous cystadenocarcinoma; PAAD, Pancreatic adenocarcinoma; PCPG, Pheochromocytoma and Paraganglioma; PRAD, Prostate adenocarcinoma; READ, Rectum adenocarcinoma; SARC, Sarcoma; SKCM, Skin Cutaneous Melanoma; STAD, Stomach adenocarcinoma; TGCT, Testicular Germ Cell Tumors; THCA, Thyroid carcinoma; THYM, Thymoma; UCEC, Uterine Corpus Endometrial Carcinoma; UCS, Uterine Carcinosarcoma; UVM, Uveal Melanoma.
The datasets used and/or analyzed during the current study are available from the corresponding author on reasonable request.
ZC, SH, FW and SW designed and performed the experiments; ZC, LL analyzed and interpreted the data; LL, LX and HW collect literatures and drafted manuscript; ZC, SW proposed the concept, revise and review the manuscript. All authors contributed to author contributed to editorial changes in the manuscript. All authors read and approved the final manuscript.
The experiments were approved by the Ethics Committee of the Binzhou Medical University Hospital(KYLL-2022-31). Written informed consent was obtained from all patients. The experiments were carried out following the Declaration of Helsinki. No animal experiment is applicable.
Not applicable.
The study is financially supported by National Natural Science Foundation of China (NSFC) (NO.81772637).
The authors declare no conflict of interest.
References
Publisher’s Note: IMR Press stays neutral with regard to jurisdictional claims in published maps and institutional affiliations.