1. Introduction
Wastewater generation is an unavoidable consequence of anthropogenic activities;
however, concerns about the impact on human health of harmful microbes in
wastewater are growing [1]. One of the purposes of wastewater management is to
remove harmful microbes (bacteria and viruses) from the wastewater; therefore,
chemical disinfectants are inevitably used in wastewater management for
disinfection [2]. Wastewater treatment plants (WWTPs) commonly employ chemical
disinfection processes due to their effectiveness [3]. Chlorination and
chloramination are chemical disinfection processes with a long history of
application. These chemicals undergo reactions, generating halogenated
disinfection byproducts (DBPs) including trihalomethanes (THMs), haloacetic acids
(HAAs), haloacetamides (HAMs), and haloacetonitriles (HANs). Thus, DBPs have been
detected widely in drinking water, swimming pools, water treatment plants, source
water, and landfill leachate [4, 5, 6, 7, 8]. The previous studies reported that DBPs were
detected with various ranges of concentrations (a few micrograms per liter to
hundreds of micrograms per liter). Unfortunately, DBPs can cause adverse effects
on living organisms, and some regulations have been introduced to reduce the use
of disinfectants due to the significant hazards related to various DBPs [9].
To reduce the generation of DBPs, alternative disinfection processes have been
employed, such as ultraviolet (UV) irradiation and ozonation. UV irradiation
meets the required standards for low generation of DBPs, and ozonation has a
lower risk than chlorination and chloramination in terms of DBP formation from
natural organic matter (NOM) [10]. However, barriers to the implementation of
such alternative treatments have been identified, including imperfect
disinfection results for specific microbes. Eischeid et al. [11]
demonstrated that UV-resistant viruses, such as adenoviruses with double-stranded
DNA, can infect host cells even after DNA damage caused by UV irradiation.
Ozonation generates free radicals and ions, including HO,
HO, O, and O, which are necessary for disinfection
[12]. The ozone reaction is generally rapid, and the concentration of ozone is
halved within the first 30 s [13]. Removal of fungi is also challenging due to
resistance against ozonation. Thus, UV irradiation and ozonation have significant
limitations for the disinfection of harmful microbes. Chemical-based
disinfectants used since the early 1900s are still widely employed in WWTPs after
biological processes to reduce levels of harmful microbes that may induce
waterborne diseases [14].
Among DBPs, THMs have received considerable attention in recent years due to
their associated health risks [15]. Numerous toxicological and epidemiological
studies have been conducted on THMs in drinking water [15]. Furthermore, control
of THM discharge in final effluent from WWTPs has become a critical issue in the
United States [16]. Among other halogenated DBPs, HAAs, HAMs, and HANs are
partially regulated or unregulated by the United States Environmental Protection
Agency [17, 18]. The toxicity of DBPs has been investigated in vitro and
in vivo, indicating that DBPs cause cytotoxicity, genotoxicity,
mutagenicity, and developmental toxicity [19, 20, 21]. Particularly, our previous
research evaluated the endocrine disruption potency of DBPs, including HAAs,
HAMs, and HANs. We found that some DBPs showed agonistic or antagonistic effects
on human estrogen receptor (hER) [22, 23]. Estrogen-derived
functions, which are associated with the ERs, play critical roles in homeostasis,
growth, reproduction, and the regulation of the female reproductive system
[24, 25, 26, 27]. Owing to these properties, exogenous chemicals mimic estrogenic hormones
and interrupt the endocrine system. Thus, the chemicals result in adverse effects
on humans and other organisms [28]. The risks posed by endocrine-disrupting
chemicals (EDCs) are continuously increasing [29]. Moreover, numerous studies
reported that EDCs associated with ERs disrupt hormone systems and cause
population changes in aquatic organisms [30, 31]. Considering our previous
studies, DBPs can adversely affect the endocrine system in not only humans, but
also in aquatic organisms. Particularly, DBPs can significantly have a great
influence on fish species, because fishes are susceptible to exposure and
accumulation of chemicals in the aquatic environment. Such freshwater species can
be directly impacted due to major wastewater effluent with DBPs [32]. However,
there is still a lack of evidence on their endocrine disruptive activities,
especially reproductive toxicity in aquatic organisms. In this study, we aim to
investigate the binding effects of nine DBPs on the zebrafish and human ERs,
resulting in different interactions across species by using
ER reporter gene assay in terms of estrogenic and anti-estrogenic
activities. This study will shed light on the species-specific activity of
DBP-induced endocrine disruption.
2. Materials and Methods
2.1 Chemical Preparation
Cell viability and endocrine-disrupting effects are closely linked to chemical
purity. Iodoacetic acid (IAA), iodoacetamide (IAM), iodoacetonitrile (IAN),
chloroacetic acid (CAA), chloroacetamide (CAM), chloroacetonitrile (CAN),
bromoacetic acid (BAA), bromoacetamide (BAM), and bromoacetonitrile (BAN)
(97% purity; Sigma-Aldrich, St. Louis, MO, USA) were dissolved in dimethyl
sulfoxide (99.9% purity, D8418; Sigma-Aldrich). Given its influence on the
results, chemical purity was ensured through experimental evaluation of impacts
on both cell viability and endocrine-disrupting effects (Supplementary
Fig. 1).
2.2 Human Embryonic Kidney 293 (HEK293) Cell Culture
The HEK293 cell line was provided by the American Type Culture Collection
(CRL-1573; ATCC, Manassas, VA, USA). The cell line was used for transfection as a
host for the zER construct. The HEK293 cell line (ATCC#CRL-1573) used
for transfection as a host for the zER construct was obtained from the
American Type Culture Collection (ATCC, Manassas, VA, USA). HEK293 cells were
cultured in Dulbecco’s modified Eagle’s medium (DMEM; Therm Fisher Scientific,
Waltham, MA, USA) with 10% fetal bovine serum (FBS, A4136401; ThermoFisher
Scientific) and 1% penicillin–streptomycin (15140122; ThermoFisher Scientific,
Waltham, MA, USA) at 37 °C and 5% CO. Mycoplasma testing has been
done for the cell line using MycoAlert™ PLUS Mycoplasma Detection
Kit (LT07; Lonza, Walkersville, MD, USA). The used cell line has been
authenticated by using Short Tandem Repeat (STR) analysis.
2.3 Cell Viability
Cell viability was determined prior to evaluating estrogenic and anti-estrogenic
activities of DBPs. Each prepared stock of DBPs was diluted at a
ratio of 10 in DMEM (the range of working concentrations was 0.5–500
M). Cells were seeded in a 96-well plate at 1 10 cells/well and incubated under conditions of 37 °C and 5% CO.
After overnight incubation, working concentrations of DBPs that did not exceed
0.5% (v/v) were applied to the cells for 24 h. Cell viability was assessed using
Cell Counting Kit-8 (Dojindo, Kumamoto, Japan) according to the manufacturer’s
manual and measured at 450 nm using a microplate reader (SPARK; TECAN,
Männedorf, Switzerland).
2.4 Transfection Methodology
First, HEK293 cells were transfected with the pGreenFire Lenti-reporter plasmid
(pGF2-ERE-rFLuc-T2A-GFP-mPGK-Puro; TR455VA-P; System Biosciences, Palo Alto, CA,
USA). The plasmid was designed to express red-shifted luciferase and the green
fluorescent protein (GFP) reporter under the control of estrogen response element
(ERE), and to have resistance to puromycin. Briefly, cells were seeded at a
density of 3 10 cells/well in a 6-well plate (145380;
ThermoFisher Scientific, Waltham, MA, USA) prior to transfection. After overnight
incubation, the medium containing the virus was removed and treated with 5
g/mL polybrene (TR-1003; Sigma-Aldrich, St. Louis, MO, USA) for 8 h. The
virus-containing medium was aspirated and the transfected cells were incubated
overnight for recovery prior to treatment with 5 g/mL puromycin (J67236;
ThermoFisher Scientific, Waltham, MA, USA). Next, HEK293-ERE cells were
transfected with the piggyBac transposon gene expression system. This plasmid
(VB160216-10057; VectorBuilder Inc., Chicago, IL, USA) encodes a hyperactive
version of the piggyBac transposase. The zER expression vector was
custom-cloned by VectorBuilder (pPB-Neo-CAGzER, VB210426-1022cns).
Cells were seeded at 1 10 cells/well in a 6-well plate. After
overnight incubation, 0.75 L of Lipofectamine 3000 reagent (L3000;
ThermoFisher Scientific, Waltham, MA, USA) and 1 g of the vector
were mixed in 250 L of Opti-MEM medium (31985070; GIBCO, Grand
Island, NY, USA) and incubated for 15 min to form a DNA-lipid complex. The
complex was added to each well and incubated for 6 h. The complex medium was
discarded, and cells were cultured with their regular medium for recovery
overnight prior to treatment with 10 g/mL puromycin and 2 g/mL
neomycin (N1142; Sigma-Aldrich, St. Louis, MO, USA), respectively. Finally, the
transfected cells (HEK293-ERE-zER) were collected for testing.
2.5 Luciferase Reporter Assay for Agonistic and Antagonistic
Activities
HEK293-ERE-zER cells were used to evaluate the (anti) estrogenic
activities of DBPs. E2 (3301; Sigma-Aldrich, St. Louis, MO, USA) and
4-hydroxytamoxifen (HT, T176; Sigma-Aldrich, St. Louis, MO, USA) were selected as
reference chemicals with agonistic and antagonistic activities, respectively.
Cells were exposed to half-logarithmic (3.16-fold) dilutions of the reference
chemicals and DBPs. The exposure ranges were 10 to 10 M for E2,
10 to 10 M for HT, and 10 to 10 M for DBPs. To
investigate antagonistic activity, E2 was added to the culture medium at a fixed
concentration (10 M). The test chemicals were dissolved in
dimethylsulfoxide (DMSO) at working concentrations that did not exceed 0.5%
(v/v). Cells were seeded at a concentration of 110 cells/well
in a 96-well plate and incubated under conditions of 37 °C and 5%
CO. After overnight incubation, the working concentrations were added at a
1:1 ratio to the medium in each well and cultured for 24 h. Cells were lysed with
passive lysis buffer (E194A; Promega, Madison, WI, USA) after washing with
phosphate-buffered saline and the lysates were used to evaluate luciferase
activity with the Luciferase Reporter Assay System (E151A; Promega, Madison, WI,
USA). Luminescence was measured as relative luminescence using a microplate
reader (SPARK; TECAN, Männedorf, Switzerland) with an integration time of 3
seconds and settling time of 1 second.
2.7 Homology Modeling and Molecular Docking
The crystal structure of hER (Protein Data Bank [PDB] ID: 2YJA) was
selected as the template for molecular docking and homology modeling. The crystal
structure was the hER ligand-binding domain (LBD) with E2 as the ligand
[33]. The LBD structure of zER was structuralized through homology
modeling [34]. First, the LBD sequence of the target protein zER
(P57717) was validated against the UniProt database to generate the homology
model. The query sequence was inserted into the Protein Basic Local Alignment
Search Tool (BLASTp) to obtain an optimal template. hER-LBD (2YJA) was
chosen as the optimal template based on the BLASTp search. MODELLER 9.25, which
can conduct comparative protein structure modeling if certain spatial restraints
are satisfied, was used to create a homology model for zER-LBD. This
modeling tool forecasts the 3D structure of an input protein target sequence
based primarily on its alignment with one or more proteins with known template
structures to generate a zER-LBD model [35]. The LBD sequence of
zER and its template structure (2YJA) were used as the inputs to
MODELLER v9.25 (https://salilab.org/modeller/9.25/release.html). When
alignment was completed, the program automatically calculated a 3D model of the
target using its automodel function [35]. MODELLER generates 3D models
accommodating all main chain and side chain non-hydrogen atoms based on the input
target sequence. Ten candidate models were created, and the structure with the
lowest Discrete Optimized Protein Energy score was selected as the
zER-LBD model for molecular docking [36]. The quality of the generated
homology model was assessed using the computational protocols ERRAT [37],
PROCHECK [38], and ProSA [39]. The hER-LBD and zER-LBD
structures thus generated were used for molecular docking. Receptor preparation
was conducted by discarding the crystallographic water molecules and ligand.
Missing hydrogen atoms and charges were added during receptor preparation. E2 and
DBPs were selected as the test ligands, and their structures were downloaded from
the PubChem database (E2: 5757, IAA: 5240, IAM: 3727, IAN: 69356, CAA: 6580, CAM:
6580, CAN: 7856, BAA: 6227, BAM: 69632, and BAN: 11534). Each structure was
obtained in structure data file format and their geometries were improved using
the MM2 energy minimization method. The files were changed to PDB format using
Discovery Studio Visualizer 2016 (Accelrys Software Inc., San Diego, CA, USA).
Molecular docking was performed using AutoDock Vina (The Scripps Research
Institute, San Diego, CA, USA), which assumes that a receptor is rigid and
ligands are flexible during molecular docking. This method employs a docking
configuration file that includes protein and ligand information along with grid
box properties [40]. Root-mean-square deviation (RMSD) values 1.0 Å
indicated favorable binding free energies. The grid size was set to 40 points in
each of the x, y, and z directions, with a grid spacing of 1.0 Å. The energy
map was constructed using the distance-dependent function of the dielectric
constant, and the default settings were used for all other parameters. All docked
positions were computed using rankings based on binding energies. The position
with the lowest binding energy was selected and aligned with the receptor
structure for further analysis.
3. Results
3.1 Comparison of Cytotoxicity among DBPs
The cytotoxicity of DPBs was evaluated on HEK293 cells to determine the ranges
of exposure concentrations for testing endocrine disruption. The cell viability
of exposed cells was presented with concentration-response curves in
Supplementary Fig. 2. The half-maximum effective concentration
(EC) values for DBPs were as follows: 5.32 10 M for IAA,
4.35 10 M for IAM, 5.26 10 M for IAN, 1.03
10 M for CAA, 1.30 10 M for CAM, 1.29
10 M for CAN, 1.55 10 M for BAA, 5.13
10 M for BAM, and 5.72 10 M for BAN,
respectively. The result of EC values indicated differences in
cytotoxicity between DBPs. The DBPs containing iodine and bromine showed higher
cytotoxicity than chlorine-containing DBPs. Iodine- and bromine-containing DBPs
exhibited similar cytotoxicity except for BAA. We also investigated the
cytotoxicity of DBPs evaluated from other model systems and compared the
EC values (Table 1 (Ref. [20, 22, 23, 41, 42, 43, 44, 45, 46, 47, 48, 49, 50, 51, 52, 53]), and Fig. 1). Although some EC values exhibited
variance between model systems, the data showed a similar tendency to the present
result. Thus, we confirmed that the iodine- and bromine-containing DBPs induce
higher cytotoxicity than chlorine-containing DBPs.
Table 1.Comparison of half-maximal effective concentrations among
organisms.
| Chemical |
Target organism |
EC (M) |
Reference |
| Iodoacetic acid (IAA) |
Human embryonic kidney cell |
5.3 × 10 |
This study |
|
Salmonella Typhimurium |
1.8 × 10 |
[41] |
|
Salmonella Typhimurium |
3.0 × 10 |
[42] |
|
Saccharomyces cerevisiae |
5.5 × 10 |
[23] |
|
Human colorectal adenocarcinoma cell |
3.4 × 10 |
[43] |
|
Human colon epithelial cell |
5.6 × 10 |
[44] |
|
Human urothelial cell |
2.4 × 10 |
[45] |
|
Mouse neuroblastoma cell |
2.7 × 10 |
[46] |
|
Common carp hepatic microsomes |
2.0 × 10 |
[47] |
|
Retinal ganglion cells |
6.0 × 10 |
[48] |
|
Rat cerebellar granule cell |
9.8 × 10 |
[49] |
| Iodoacetamide (IAM) |
Human embryonic kidney cell |
4.3 × 10 |
This study |
|
Saccharomyces cerevisiae |
4.6 × 10 |
[23] |
|
Pig kidney cell |
5.0 × 10 |
[50] |
|
Rat hepatocyte cell |
6.0 × 10 |
[50] |
|
Human hepatocyte cell |
2.1 × 10 |
[50] |
|
Human lymphocyte cell |
5.0 × 10 |
[50] |
|
Chinese hamster ovary cell |
1.4 × 10 |
[42] |
|
Human colon epithelial cell |
3.9 × 10 |
[44] |
|
Human gastric epithelial cell |
4.3 × 10 |
[51] |
|
Human epidermal keratinocyte cell |
3.9 × 10 |
[51] |
| Iodoacetonitrile (IAN) |
Human embryonic kidney cell |
5.3 × 10 |
This study |
|
Saccharomyces cerevisiae |
2.0 × 10 |
[22] |
|
Chinese hamster ovary cell |
3.3 × 10 |
[52] |
| Chloroacetic acid (CAA) |
Human embryonic kidney cell |
1.0 × 10 |
This study |
|
Salmonella Typhimurium |
1.4 × 10 |
[41] |
|
Salmonella Typhimurium |
1.6 × 10 |
[42] |
|
Saccharomyces cerevisiae |
4.9 × 10 |
[23] |
|
Human urothelial cell |
7.9 × 10 |
[45] |
|
Human colorectal adenocarcinoma cell |
1.2 × 10 |
[43] |
|
Chinese hamster ovary cell |
8.1 × 10 |
[20] |
| Chloroacetamide (CAM) |
Human embryonic kidney cell |
1.3 × 10 |
This study |
|
Saccharomyces cerevisiae |
4.9 × 10 |
[23] |
|
Human gastric epithelial cell |
1.0 × 10 |
[51] |
|
Human epidermal keratinocyte cell |
1.4 × 10 |
[51] |
|
Chinese hamster ovary cell |
1.5 × 10 |
[42] |
| Chloroacetonitrile (CAN) |
Human embryonic kidney cell |
1.3 × 10 |
This study |
|
Saccharomyces cerevisiae |
5.3 × 10 |
[23] |
|
Human liver cancer cell |
5.5 × 10 |
[20] |
|
Chinese hamster ovary cell |
6.8 × 10 |
[52] |
| Bromoacetic acid (BAA) |
Human embryonic kidney cell |
1.5 × 10 |
This study |
|
Salmonella Typhimurium |
9.6 × 10 |
[41] |
|
Salmonella Typhimurium |
8.8 × 10 |
[42] |
|
Saccharomyces cerevisiae |
6.4 × 10 |
[23] |
|
Human urothelial cell |
6.7 × 10 |
[45] |
|
Human colorectal adenocarcinoma cell |
4.2 × 10 |
[43] |
|
Chinese hamster ovary cell |
1.0 × 10 |
[20] |
| Bromoacetamide (BAM) |
Human embryonic kidney cell |
5.1 × 10 |
This study |
|
Saccharomyces cerevisiae |
3.3 × 10 |
[23] |
|
Human gastric epithelial cell |
2.1 × 10 |
[51] |
|
Human epidermal keratinocyte |
3.3 × 10 |
[51] |
|
Chinese hamster ovary cell |
1.9 × 10 |
[42] |
| Bromoacetonitrile (BAN) |
Human embryonic kidney cell |
5.7 × 10 |
This study |
|
Saccharomyces cerevisiae |
2.0 × 10 |
[22] |
|
Human liver cancer cell |
8.4 × 10 |
[53] |
|
Chinese hamster ovary cell |
3.2 × 10 |
[52] |
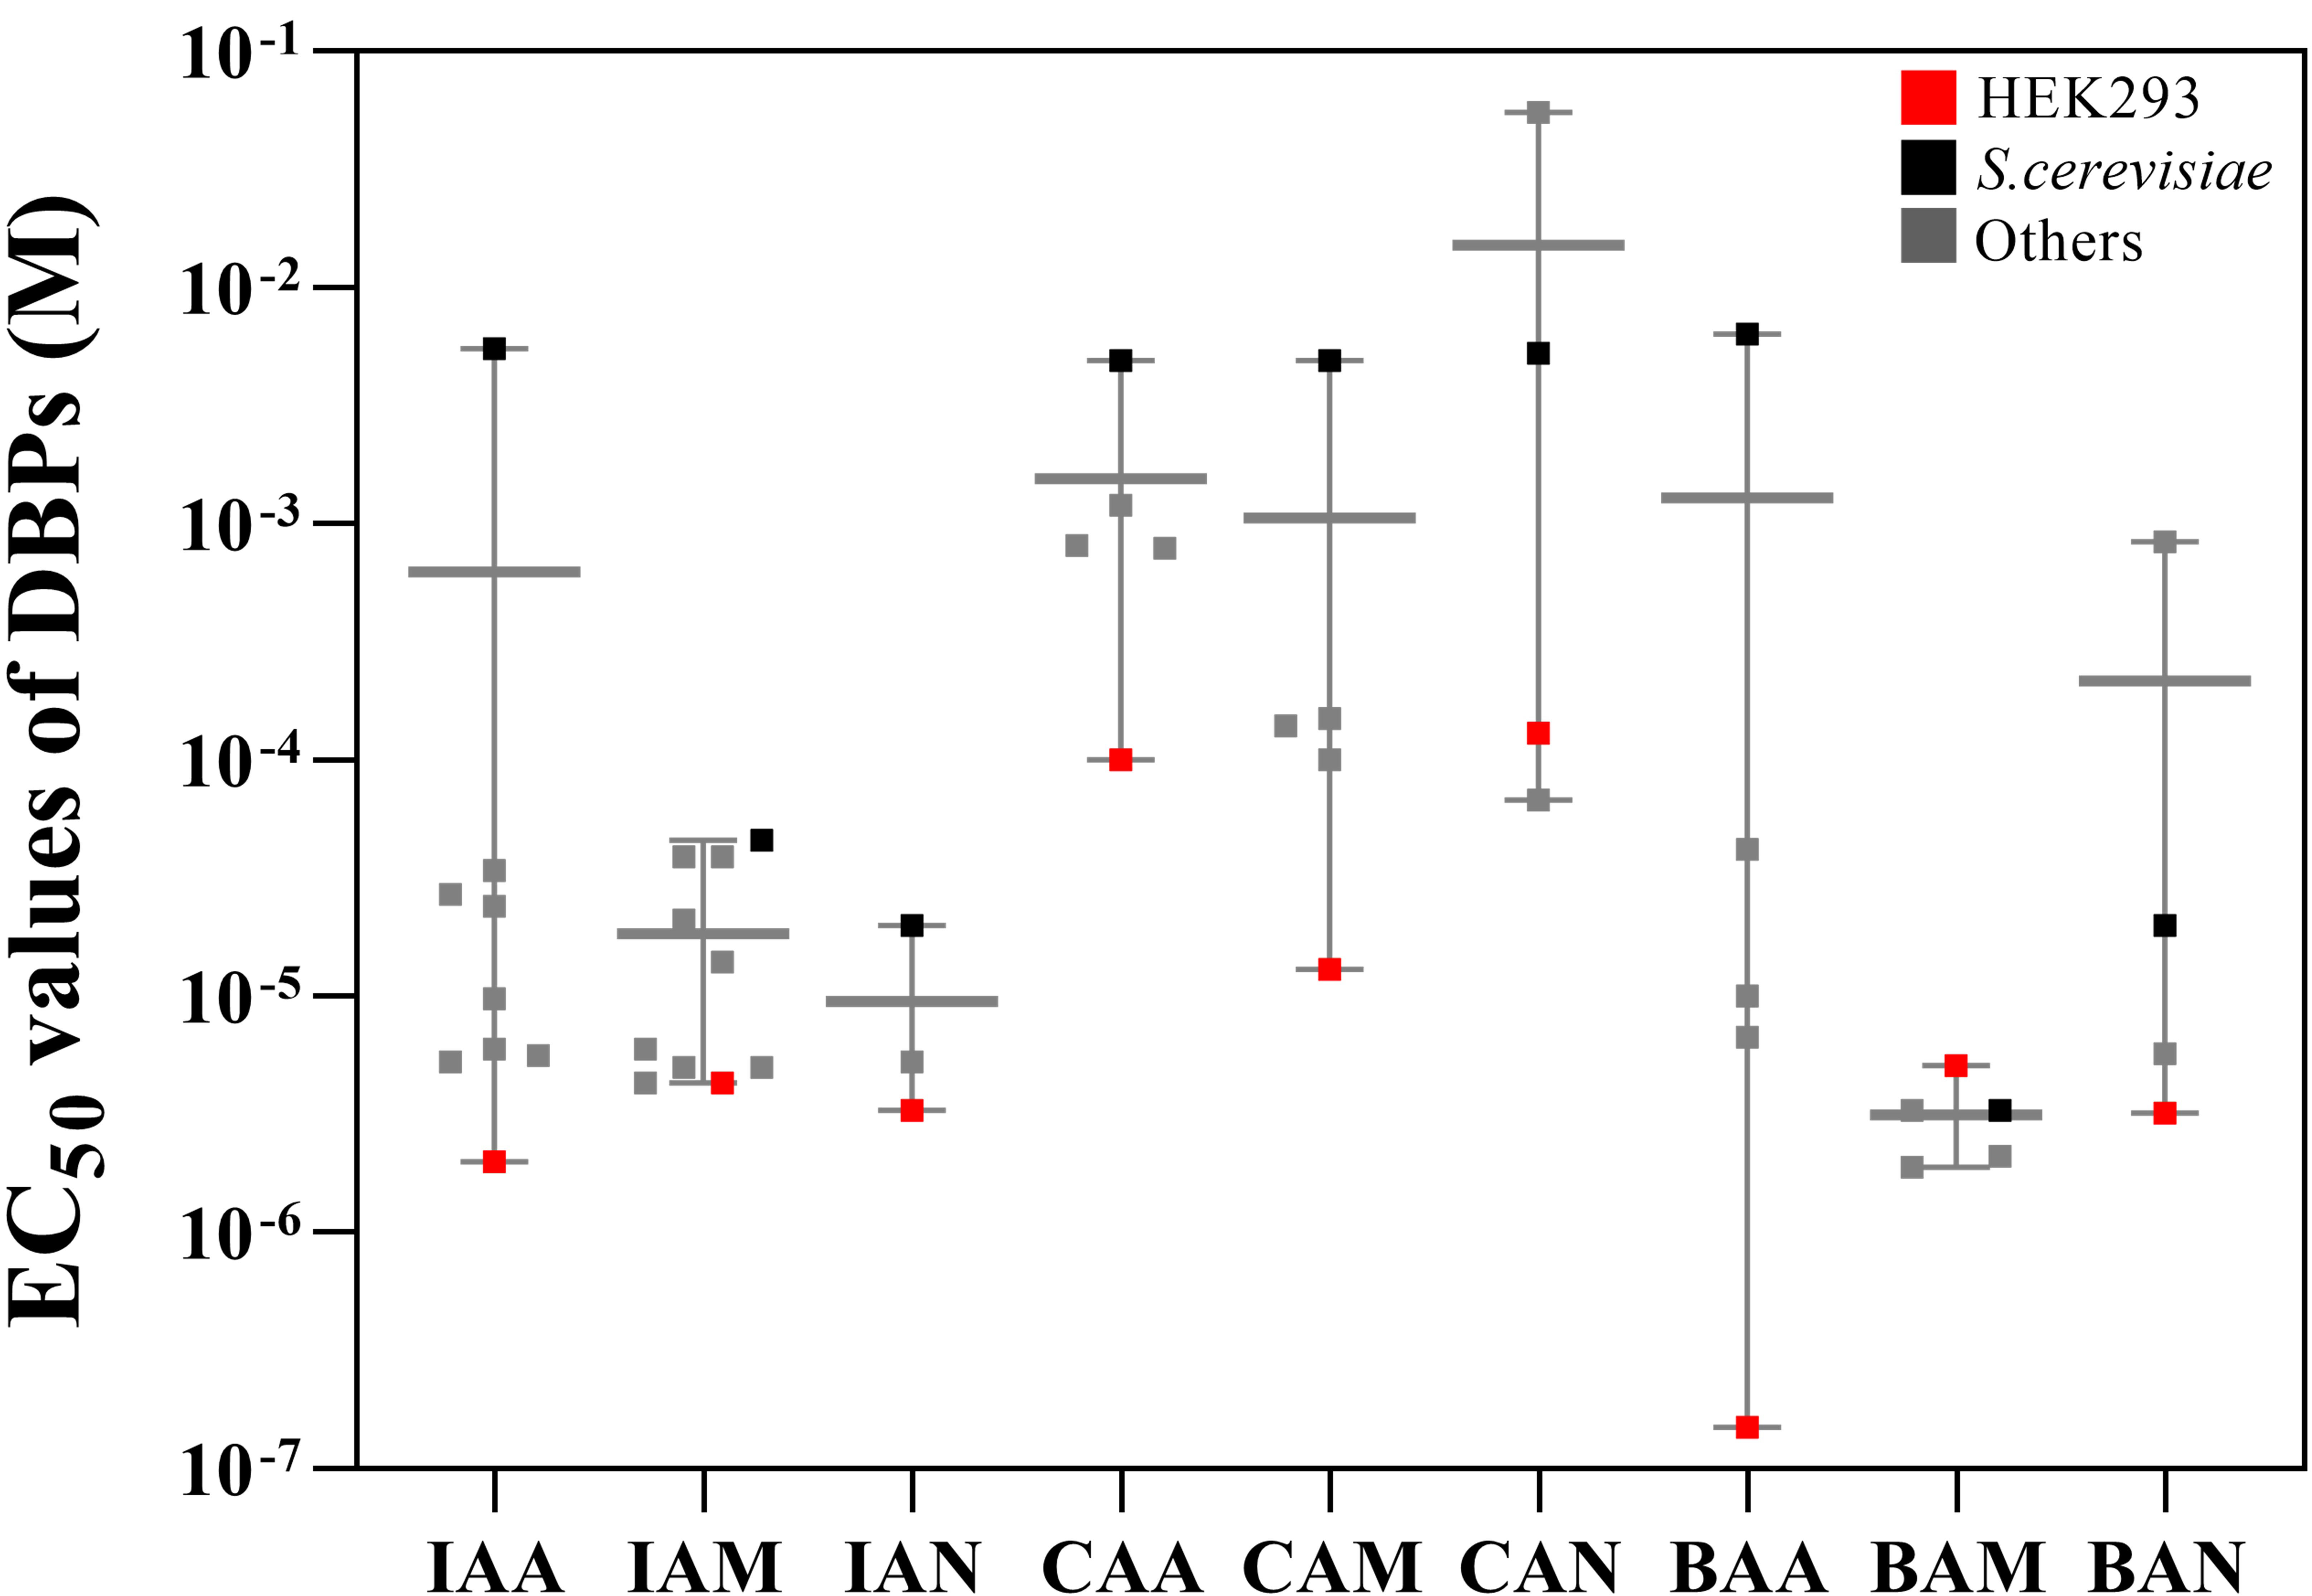 Fig. 1.
Comparison of the median lethal dose among organisms. Red
squares represent HEK293; black squares represent S. cerevisiae, and
gray squares indicate other organisms from previous studies. Abbreviations: IAA,
iodoacetic acid; IAM, iodoacetamide; IAN, iodoacetonitrile; CAA, chloroacetic
acid; CAM, chloroacetamide; CAN, chloroacetonitrile, BAA, bromoacetic acid;
BAM, bromoacetamide; BAN, bromoacetonitrile.
3.2 Responses of ERs to 17-Estradiol and
4-Hydroxytamoxifen
We assessed estrogenic and anti-estrogenic activities between the two
ERs using selective ER modulators, namely E2 and HT, prior to testing
for the endocrine disruption of DBPs. Dose-response curves illustrating the
effects of E2 and HT on zER and hER are shown in Fig. 2. The
EC values for E2 on zER and hER were 0.05 nM and 0.56
nM (Fig. 2A), respectively, while the half maximal inhibitory concentration (IC) values for HT were 0.006 M
and 0.26 M (Fig. 2B). Although the EC and IC values showed
10–40 fold differences in responses between zER and hER due
to the difference between hosts, their patterns and levels were similar to those
of standard chemicals. Furthermore, both ERs showed similar ligand interactions
in terms of residues and binding energy in molecular docking analysis (Table 2).
zER-LBD had 20 interacting residues for E2, while hER-LBD had
19 interacting residues. Especially, E2 formed the same hydrogen bond
interactions with residues in each binding pocket site of both ERs. In light of
these results, zER and hER showed a similar response upon E2
and HT exposure.
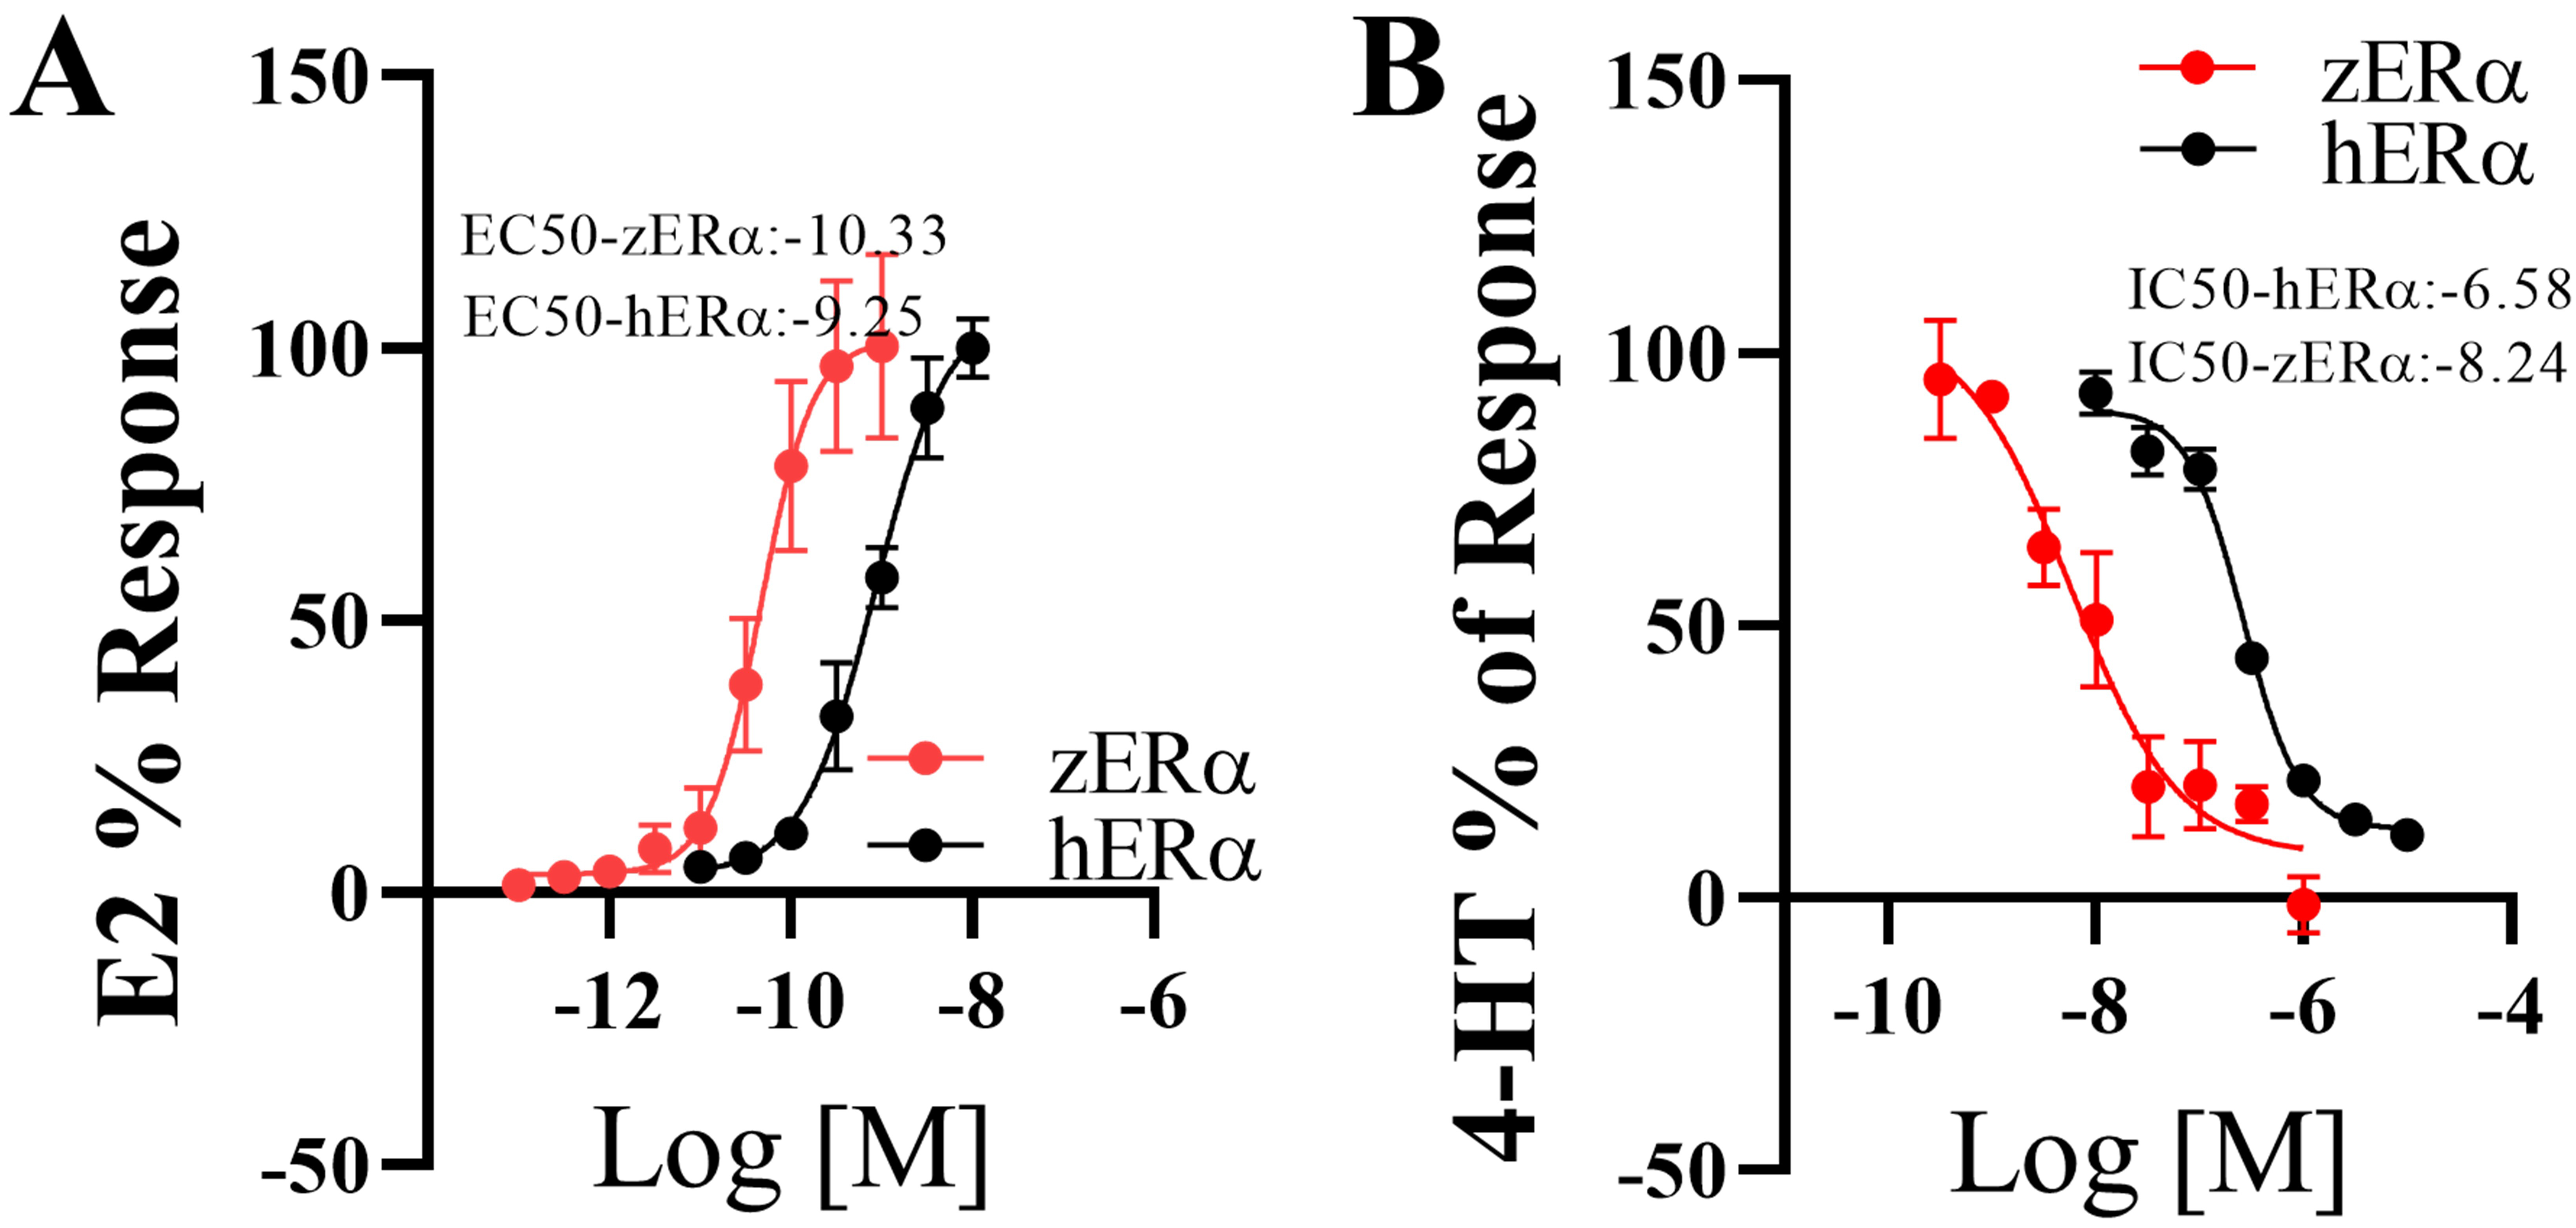 Fig. 2.
In vitro assays of the estrogenic/anti-estrogenic
activities of 17-estradiol (E2) and 4-hydroxytamoxifen (HT). Estrogenic
activity of E2 on both ERs (A). The induction level at the maximum
concentration of E2 (10 nM for hER and 1 nM for zER) was set
to 100%. Anti-estrogenic activity of HT on both ERs (B). For this
test, a fixed E2 concentration (1 nM E2 for hER and 0.1 nM E2 for
zER) was applied along with HT. The induction level of E2 was set to
100%. Data are presented as mean standard deviation (n = 3).
Table 2.Binding free energies for docking between 17-estradiol
(E2) and the ligand-binding domains of human and zebrafish estrogen receptor
alpha.
| Receptor |
Ligand |
Interacting residue number |
Binding free energy (Kcal/mol) |
Hydrogen bond interaction |
Hydrophobic interaction |
Van der Waals interaction |
| No. |
Amino acids |
No. |
Amino acids |
No. |
Amino acids |
| zER-LBD |
E2 |
20 |
−10.7 |
3 |
Glu321, Arg362, His492 |
9 |
Leu314, Ala318, Leu352, Leu355, Met356, Leu359, Phe372, Ile392, Leu493 |
8 |
Met311, Thr315, Met317, Met389, Phe393, Leu396, Gly489, Met496 |
| hER-LBD |
E2 |
19 |
−11.1 |
3 |
Glu353, Arg394, His524 |
9 |
Leu346, Ala350, Leu384, Leu387, Met388, Leu391, Phe404, Ile424, Leu525 |
7 |
Leu349, Leu384 Ile424, Phe425, Leu428, Gly521, Leu525 |
3.3 Dissimilar Ligand-Receptor Responses to DBPs between
zER and hER
Although zER and hER have similar homology, they did not
show identical responses to the DBPs in this study. In the estrogenic activity
assessment shown in Fig. 3, IAA (108.7%), CAN (50.3%), and BAN (54.7%) showed
significantly higher estrogenic effects on hER than zER.
Meanwhile, other DBPs did not induce robust estrogenic activity in hER.
For zER, some DBPs showed no or weak estrogenic activity (Fig. 3A,E,F). The maximum induction levels of other DBPs were 20.2% (CAA), 21.2%
(BAA), 21.8% (BAN), 12.8% (BAM), 19.8% (IAN), and 18.9% (IAM). The
anti-estrogenic activities were compared (Fig. 4) and the patterns showed
different responses, similar to the results of estrogenic activity assessment.
IAM, CAM, and BAM showed anti-estrogenic activities on hER. The ratios
of the maximal inhibitory induction were 51.3% (IAM), 28.0% (CAM), and 29.5%
(BAM). IAM exhibited the most potent activity. For zER, IAA, CAM, and
BAM showed anti-estrogenic activities. The ratios of maximum inhibitory induction
were 59.8% (IAA), 51.9% (CAM), and 49.2% (BAM). CAM and BAM consistently
exhibited anti-estrogenic activity in both ERs.
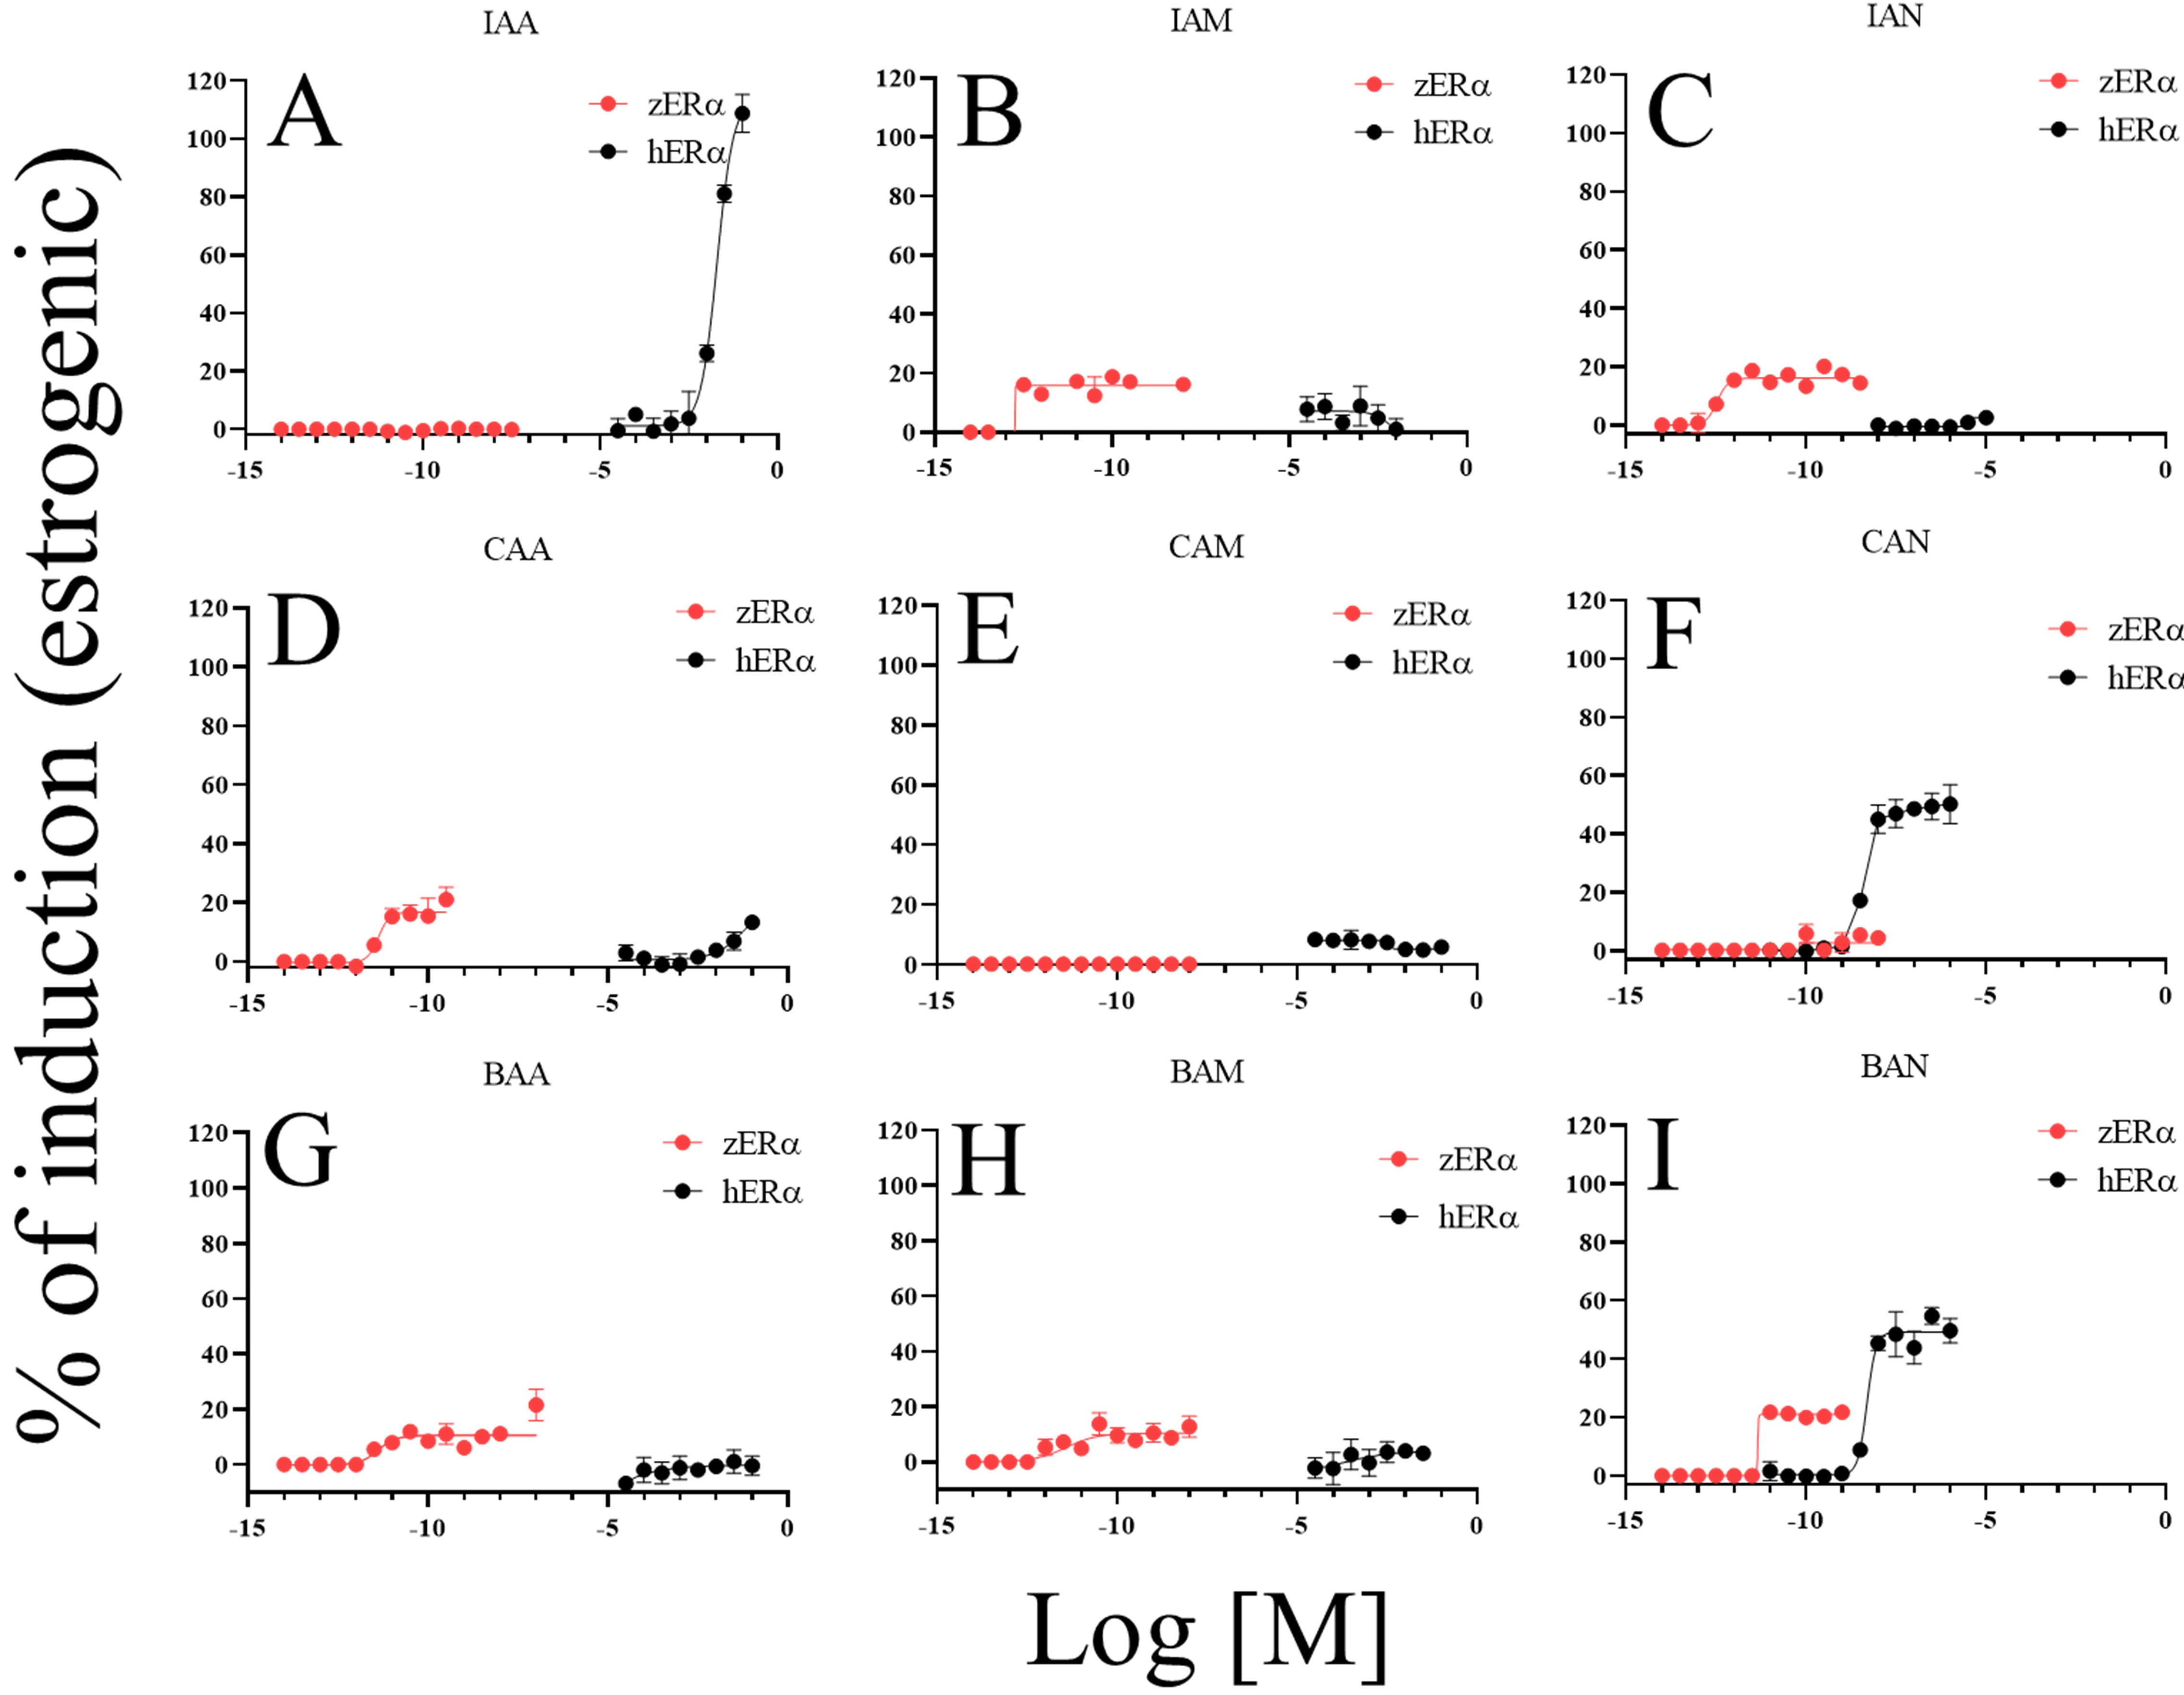 Fig. 3.
Comparison of estrogenic activities among DBPs and between
ERs. Estrogenic activity of DBPs on both ERs (A–I); IAA,
iodoacetic acid (A); IAM, iodoacetamide (B); IAN, iodoacetonitrile (C); CAA,
chloroacetic acid (D); CAM, chloroacetamide (E); CAN, chloroacetonitrile (F);
BAA, bromoacetic acid (G); BAM, bromoacetamide (H); BAN, bromoacetonitrile
(I). The induction level at the maximum concentration of 17-estradiol
(E2; 10 nM for hER and 1 nM for zER) was set to 100% and
induction levels of DBP were calculated as percentages relative to E2. Data are
presented as mean standard deviation (n = 4).
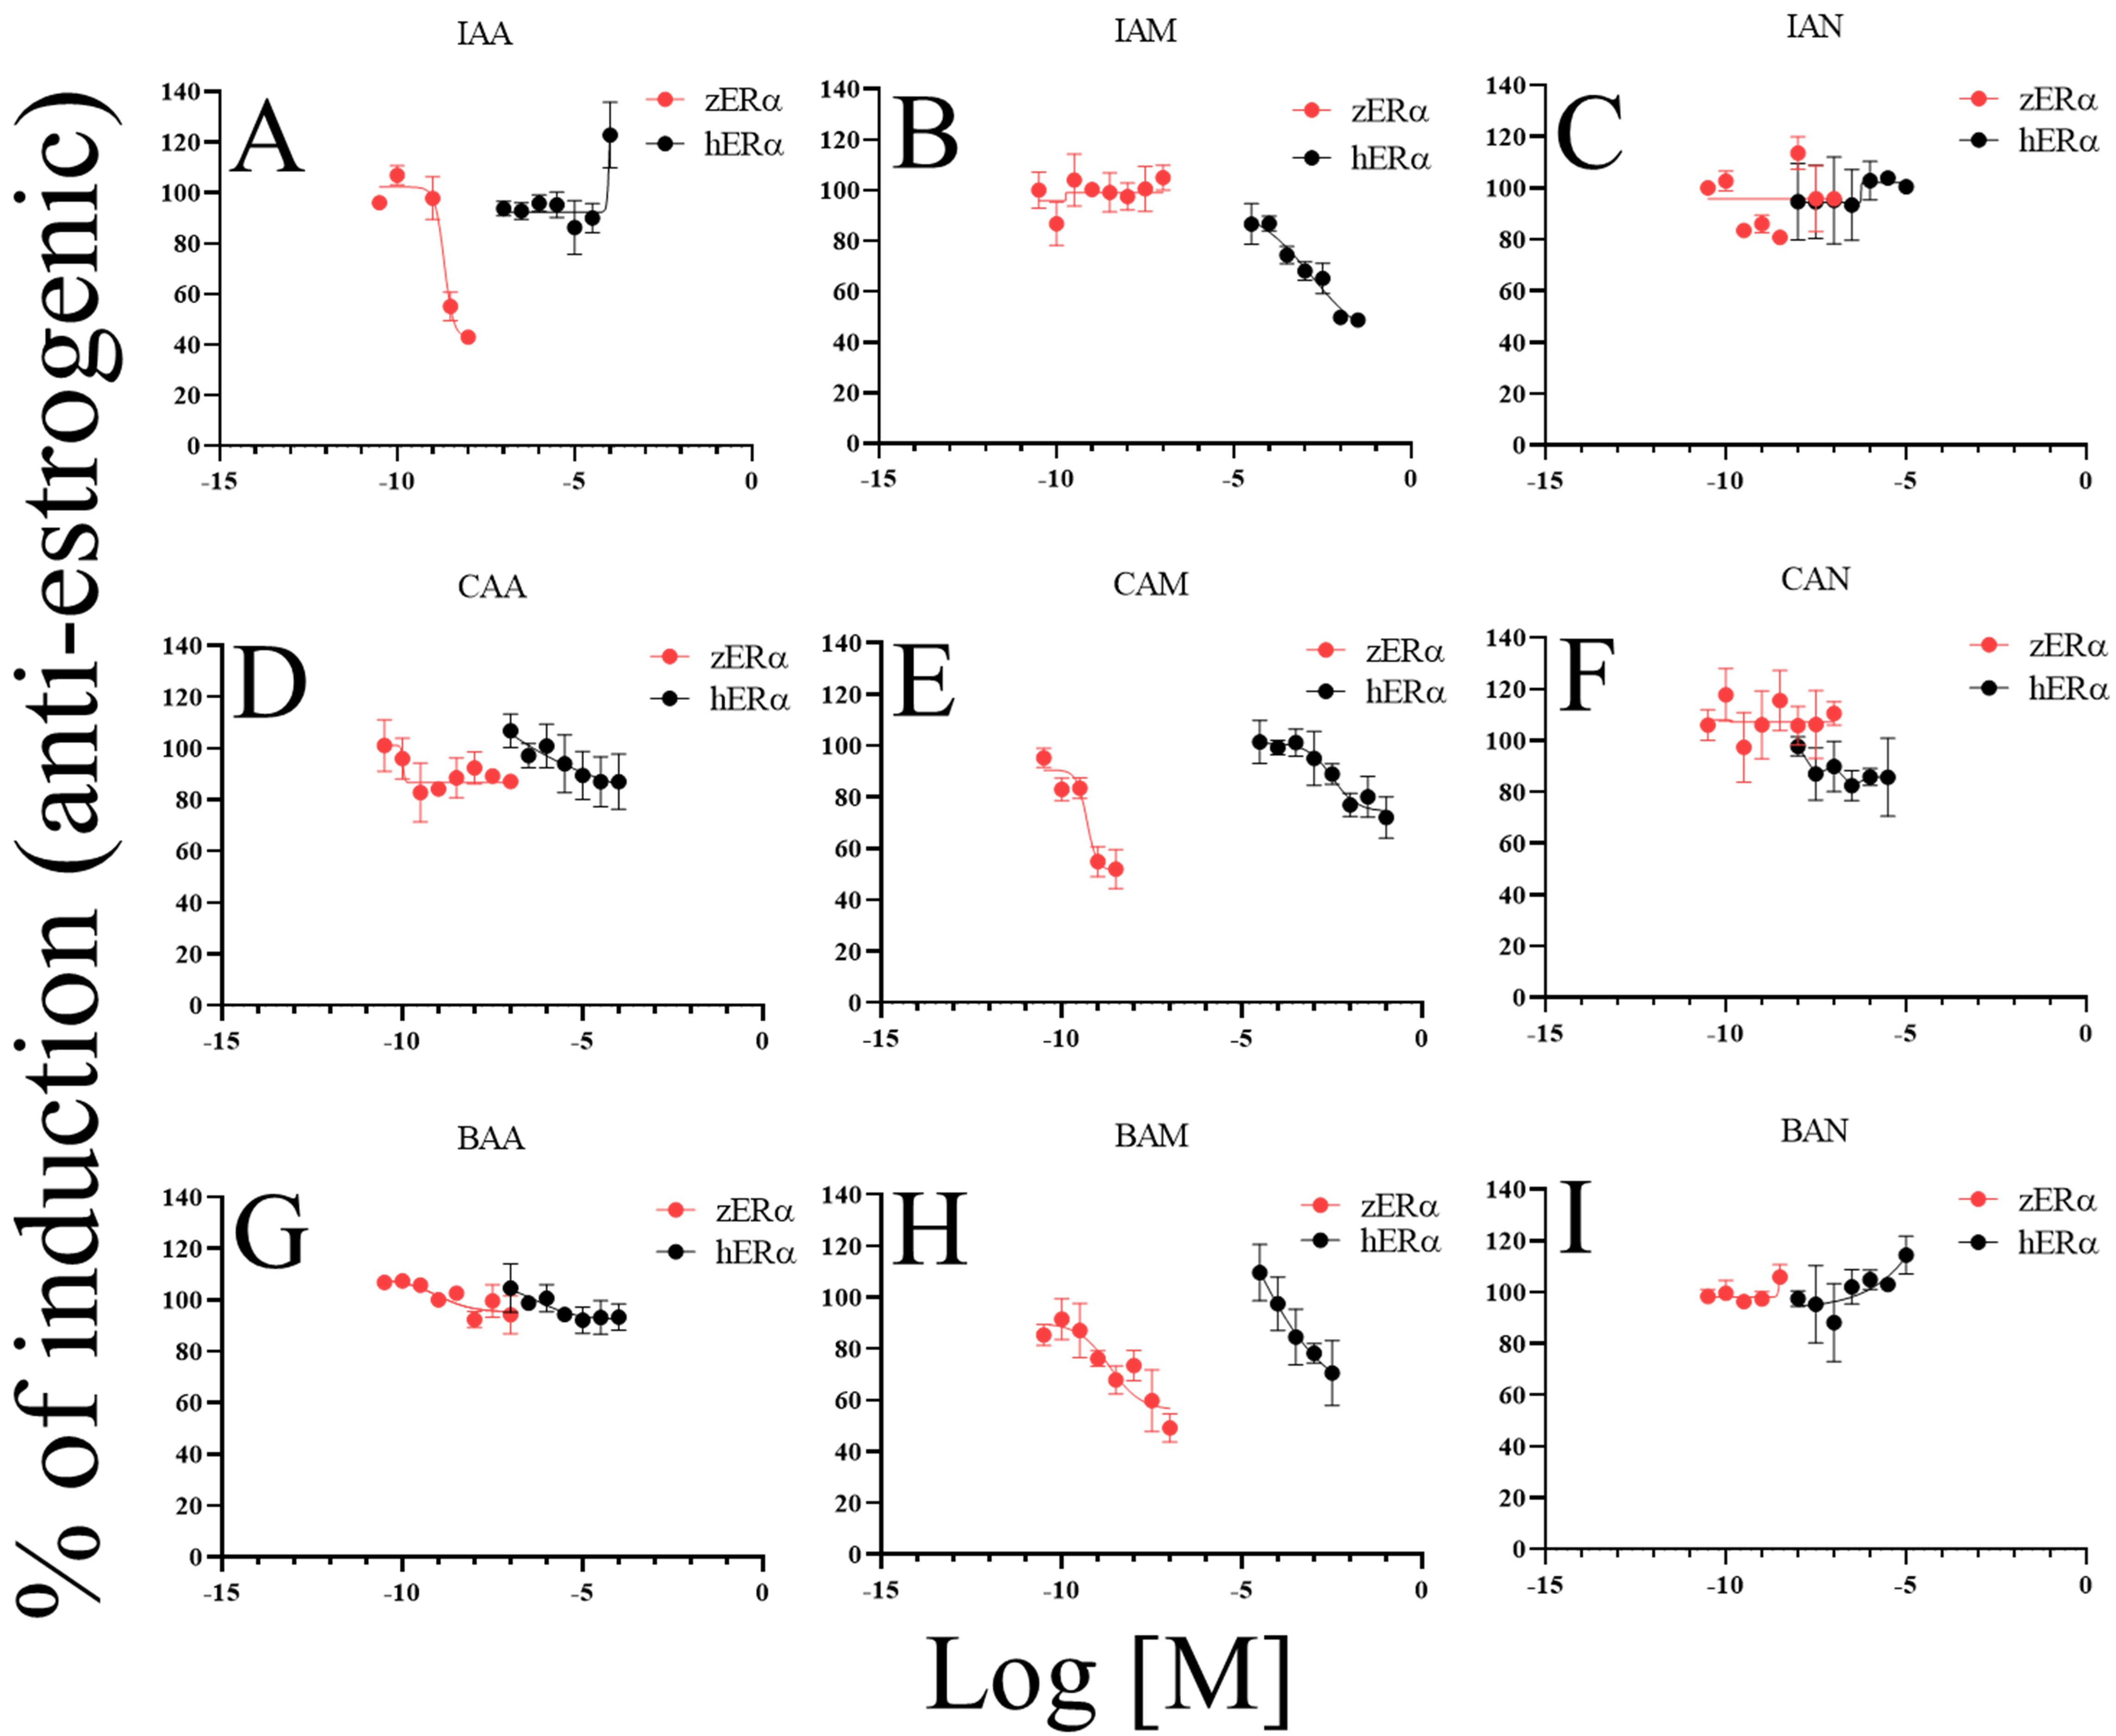 Fig. 4.
Comparison of anti-estrogenic activities among DBPs and between
ERs. Anti-estrogenic activity of DBPs on both ERs (A–I);
IAA, iodoacetic acid (A); IAM, iodoacetamide (B); IAN, iodoacetonitrile (C);
CAA, chloroacetic acid (D); CAM, chloroacetamide (E); CAN, chloroacetonitrile
(F), BAA, bromoacetic acid (G); BAM, bromoacetamide (H); BAN,
bromoacetonitrile (I). For this test, the culture medium was supplemented with
fixed concentrations of 17-estradiol (E2; 1 nM E2 for hER and
0.1 nM E2 for zER). The E2 induction levels were set to 100%. Data are
presented as mean standard deviation (n = 4).
CAA, CAM, BAM, and BAN showed identical response patterns for the two receptors.
However, non-identical responses to some DBPs were observed. Notable
dissimilarities were observed for IAA, IAM, and CAN. IAA had anti-estrogenic
activity for zER, but estrogenic activity for hER (Figs. 3A,4A); IAM functioned as an estrogen for zER, but as an intense
anti-estrogen for hER (Figs. 3B,4B); CAN caused no response in
zER but acted as an estrogen on hER (Figs. 3F,4F).
Therefore, we performed in silico molecular docking analysis to
understand the differing estrogenic activities of DBPs between the two
ERs (Table 3 and Supplementary Table 1). The DBPs were
successfully docked with zER-LBD and hER-LBD, respectively.
All DBPs bonded to each model with similar binding free energies (–2.70 to
–3.50 Kcal/mol). However, differences in the types and numbers of interactions,
and orientations, were observed between the two models.
Table 3.Docking results between DBPs and ligand-binding domains of
human and zebrafish estrogen receptor alpha.
| Receptor |
Interaction |
Ligand |
| IAA |
IAM |
IAN |
CAA |
CAM |
CAN |
BAA |
BAM |
BAN |
| zER-LBD |
Interacting residues |
7 |
10 |
8 |
7 |
9 |
9 |
8 |
9 |
8 |
| Binding free energy (Kcal/mol) |
–3.50 0.00 |
–3.38 0.04 |
–2.90 0.00 |
–3.36 0.05 |
–3.30 0.00 |
–2.90 0.00 |
–3.40 0.00 |
–3.40 0.00 |
–2.90 0.00 |
| Hydrogen bond interaction |
1 |
2 |
- |
2 |
2 |
- |
2 |
2 |
1 |
| Hydrophobic interaction |
- |
- |
2 |
- |
1 |
2 |
- |
- |
- |
| Van der Waals interaction |
6 |
8 |
6 |
5 |
6 |
7 |
6 |
7 |
7 |
| hER-LBD |
Interacting residues |
9 |
7 |
7 |
7 |
9 |
6 |
8 |
11 |
6 |
| Binding free energy (Kcal/mol) |
–3.48 0.44 |
–3.32 0.04 |
–2.80 0.00 |
–3.48 0.10 |
–3.40 0.00 |
–2.70 0.00 |
–3.50 0.00 |
–3.34 0.05 |
–2.72 0.08 |
| Hydrogen bond interaction |
2 |
1 |
1 |
2 |
2 |
1 |
1 |
1 |
1 |
| Hydrophobic interaction |
- |
- |
3 |
- |
- |
3 |
- |
- |
3 |
| Van der Waals interaction |
7 |
6 |
3 |
5 |
7 |
2 |
7 |
10 |
2 |
3.4 Correlation and Distance-Based Analyses of the Dissimilar
Responses of two ERs
In the comparison of estrogenic responses for each DBP, the activities of
acetamide and acetonitrile compounds showed negative correlations between
zER and hER (Fig. 5A). The DBPs with the largest negative
correlation coefficients between zER and hER in the acetamide
and acetonitrile classes were CAM (–0.68; p-value = 0.099, the null
hypothesis is not statistically significant) and CAN (–0.45; p-value =
0.664, the null hypothesis is not statistically significant), respectively
(Supplementary Table 2). For acetic acid-based DBPs, both negative and
positive correlations were found between the two ERs. Responses to IAA
were negatively correlated between zER and hER (–0.49;
p-value = 0.168, the null hypothesis is not statistically significant),
while CAA and BAA showed positive correlations between the two ERs
(Supplementary Table 3). Pearson’s correlation coefficients for the
anti-estrogenic responses indicated inconsistent and mixed correlations between
the two ERs for various DBPs (Fig. 5B).
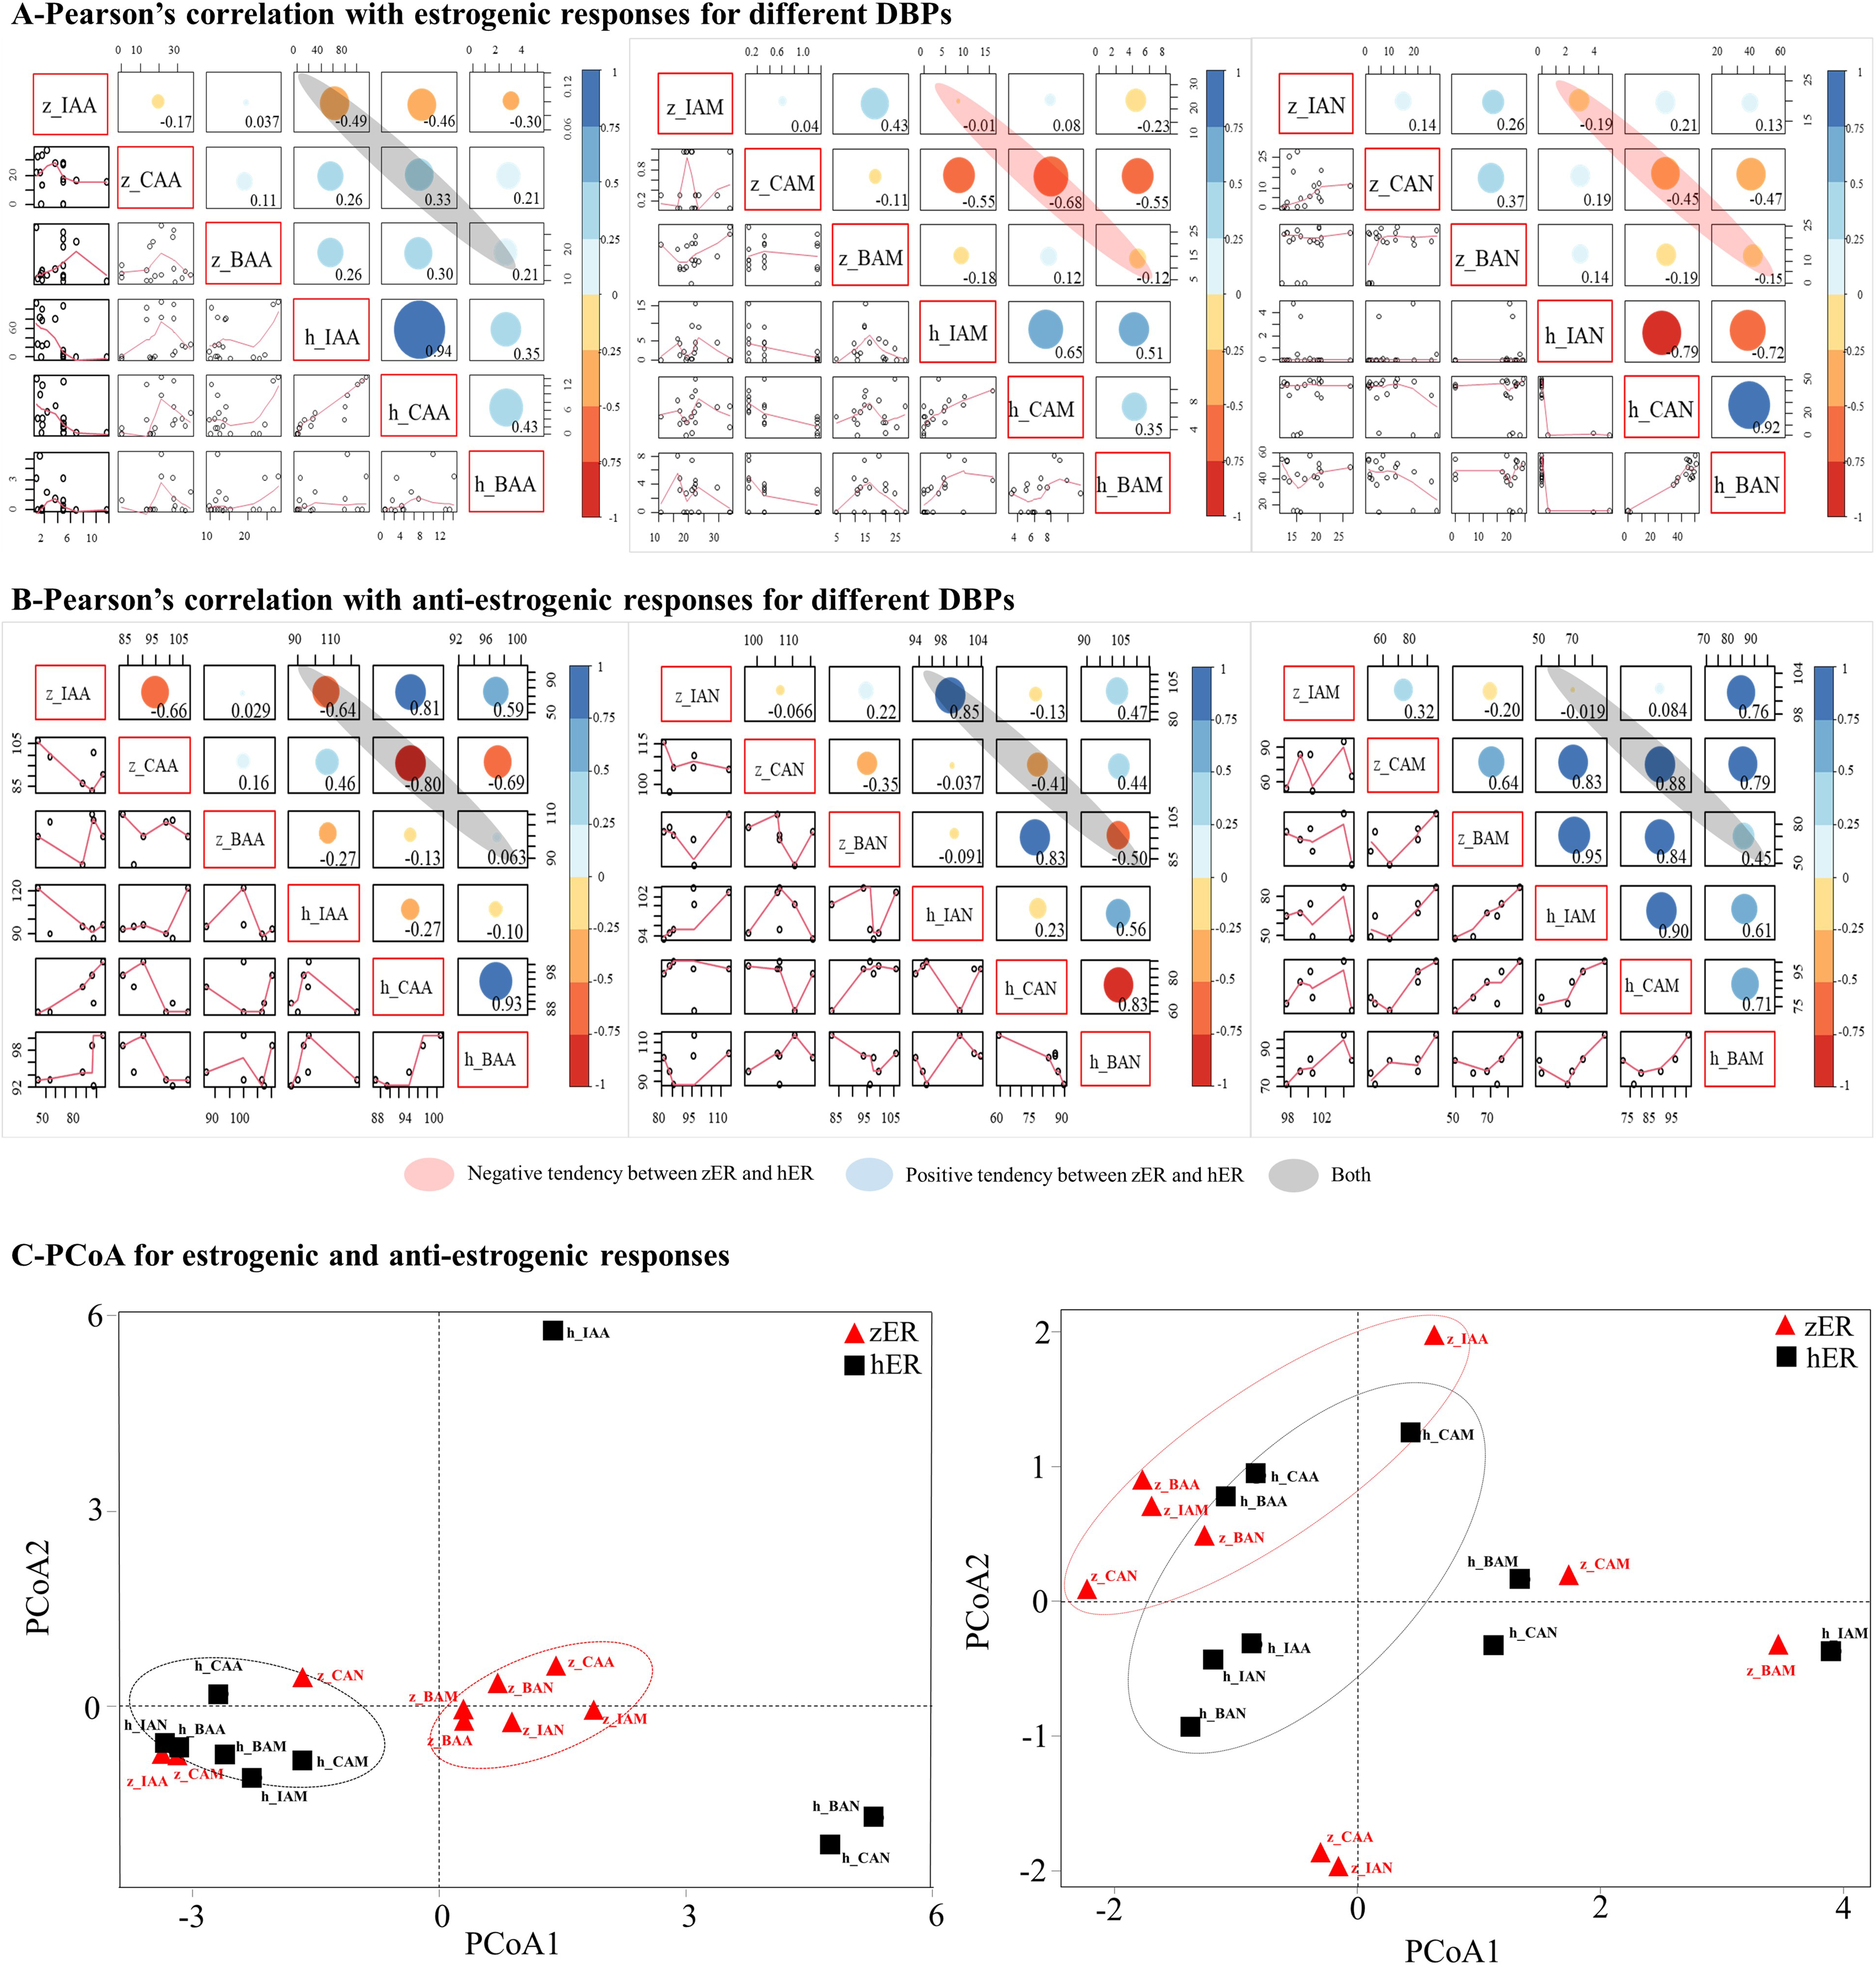 Fig. 5.
Correlation and Principal Coordinate Analyses. Results of
statistical analysis of the estrogenic responses (A) and the anti-estrogenic
responses (B) to various DBPs. Principal coordinate analysis (PCoA) of
zER and hER: estrogenic responses and anti-estrogenic
responses to various DBPs (C).
The PCoA data showed general inter-species differences in terms of the responses
of zER and hER (Fig. 5C). The two species were clearly
separated on plots of the estrogenic responses. IAA, CAM, and CAN, which had no
estrogenic effect on zER, were plotted closer to the
hER than
zER group. As hER had no or weak estrogenic responses to most
DBPs, the PCoA plots for zER interacting with IAA, CAM, and CAN were
relatively similar to those for hER (Figs. 3,5C). Meanwhile, the
plots for zER interacting with other DBPs clustered as a single group
that showed clear separation from the points representing hER. The
anti-estrogenic results differed somewhat from the estrogenic PCoA results. The
PCoA points were more dispersed than points on the estrogenic PCoA plots (Fig. 5C). The results were less regular than those for estrogenic PCoA plots, and the
irregular pattern of anti-estrogenic responses corresponded well with the
correlation coefficients (Fig. 5B,C).
3.5 Assessment of DBP Risks for Aquatic Animals
The EC and IC values represent the chemical concentrations that
induce and inhibit a response halfway between the baseline and maximum response
to exposure, respectively. According to those values, IAA, CAN and BAN caused
robust estrogenic endocrine disruption in hER, whereas all DBPs showed
low levels of estrogenic endocrine disruption in zER. IAA, CAM, and BAM
showed robust anti-estrogenic endocrine disruption in zER, whereas
hER was strongly affected by IAM (Table 4).
Table 4.Risk assessment results based on the effective concentrations.
| Response |
DBP |
EC/IC (M) |
EC/IC (M) |
Risk assessment for endocrine disruption |
| zER |
hER |
zER |
hER |
Zebrafish |
Human |
| Estrogenic activity |
IAA |
- |
2.4 × 10 |
- |
1.7 × 10 |
- |
++ |
| IAM |
2.3 × 10 |
- |
- |
- |
+ |
- |
| IAN |
4.9 × 10 |
- |
- |
- |
+ |
- |
| CAA |
5.5 × 10 |
5.2 × 10 |
- |
- |
+ |
+ |
| CAM |
- |
- |
- |
- |
- |
- |
| CAN |
- |
1.1 × 10 |
- |
3.2 × 10 |
- |
++ |
| BAA |
2.4 × 10 |
- |
- |
- |
+ |
- |
| BAM |
1.7 × 10 |
- |
- |
- |
+ |
- |
| BAN |
2.4 × 10 |
2.1 × 10 |
- |
1.0 × 10 |
+ |
++ |
| Anti-estrogenic activity |
IAA |
1.2 × 10 |
- |
6.0 × 10 |
- |
++ |
- |
| IAM |
- |
2.4 × 10 |
- |
1.5 × 10 |
- |
++ |
| IAN |
- |
- |
- |
- |
- |
- |
| CAA |
- |
- |
- |
- |
- |
- |
| CAM |
6.2 × 10 |
1.9 × 10 |
6.0 × 10 |
- |
++ |
+ |
| CAN |
- |
- |
- |
- |
- |
- |
| BAA |
- |
- |
- |
- |
- |
- |
| BAM |
1.4 × 10 |
2.5 × 10 |
1.5 × 10 |
- |
++ |
+ |
| BAN |
- |
- |
- |
- |
- |
- |
| The symbol “++” indicates a strong response of DBPs calculated with both
EC/IC and EC/IC values. The symbol “+” indicates a
weak response of DBPs calculated with only EC/IC values. The symbol
“-” indicates the non-response of DBPs. |
4. Discussion
In this study, we examined the effects of nine DBPs on zebrafish and human
ERs using in vitro reporter gene assay. Additionally,
statistical analysis and molecular docking studies were employed to compare and
understand ER responses. The result of cell viability showed that DBPs
containing iodine and bromine have higher cytotoxicity than chlorine-containing
DBPs. The cytotoxic effects of DBPs were similar to those described in previous
studies that used other mammalian cell types [52, 54]. The same trend was
observed in Salmonella typhimurium and Saccharomyces cerevisiae [22, 23, 41, 55]. Furthermore, toxicity has been tested in aquatic organisms,
including algae, Daphnia, and zebrafish embryos [56, 57, 58]. The toxic
effects of HAAs differed among organisms, as observed in the comparison of
Trimastix marina (IAA BAA CAA), Scenedesmus
sp. (CAA BAA IAA), Daphnia magna (IAA BAA CAA), and
zebrafish embryos (CAA BAA IAA). HANs showed the same toxicity trend as
HAAs in those organisms, while HAMs caused the same pattern of toxicity as HAAs
in zebrafish embryos. These facts indicate that DBPs can seriously affect aquatic
biota, and bromine- and iodine-containing DBPs induce greater toxicity than
chlorine-containing DBPs.
The results of the reporter gene assay showed that DBPs induced estrogenic and
anti-estrogenic effects on the two ERs. Interestingly, notable
dissimilarities between the two ERs were observed for some DBPs. Thus,
we applied molecular docking analysis to understand the differing estrogenic
activities of DBPs between the two ERs. Molecular docking analysis
offers binding free energy, interaction types, and the orientations of the ligand
and target receptor. Hence, molecular docking underlies fundamental molecular
mechanisms and has been actively used in comprehensive studies to evaluate
potential endocrine disruption [59, 60]. Our previous study reported the same
pattern of estrogenic activity in those two ERs upon exposure to E2.
Furthermore, high sequence similarity (78%) was identified between the two LBD
regions, and E2 interacted through hydrogen bonds with certain residues (Glu353,
Arg394, and His524 of hER-LBD and Glu321, Arg362, and His492 of
zER-LBD) [34]; these interactions correspond to the results of the
present study as well as a previously reported docking analysis [61]. In
particular, His524 is one of the primary residues in the hER 515–535 region, and
the primary residues are responsible for ligand binding and recognition. In
addition, hydrogen bonds drive the selective interactions that underpin molecular
recognition of the receptors and determine protein folding and structure [62]. As
shown in Table 3 and Supplementary Table 1, the DBPs were successfully
docked with zER-LBD and hER-LBD, respectively. The results
revealed common features that support the interpretation of the in vitro
results. IAA, CAN, and BAN, which showed estrogenic activities with
hER, interacted with the His524 residue via a hydrogen bond. For
zER, BAN, IAN, CAM, and BAM exhibited weak estrogenic activities, while
BAN and IAN interacted with His492 via a hydrogen bond and Van der Waals
interaction, respectively. Although CAA and BAA did not interact with this
residue via hydrogen bonding, hydrogen bond interactions with other residues,
such as the E2/zER-LBD complex, formed. As noted in the previous
section, primary residues such as His524 are responsible for binding and
recognition of the ligand [63], as confirmed by our previous study of the same
two ERs using BPA and its analogs [34]. Thus, interactions between DBPs
and the primary residues appear to induce ligand binding and recognition,
eventually resulting in estrogenic activity.
In the case of anti-estrogenic activity, it is difficult to define the activity
based on interactions with specific residues and binding free energy due to the
diverse modes of action driving anti-estrogenic effects [64]. However, two
features were observed in the docking complexes that showed DBP-induced
anti-estrogenic activity in this study. First, the DBPs interacted in different
orientations with residues in the binding pocket compared to the estrogens. CAM
and BAM formed hydrogen bonds with Val354 and Lys417 in the zER-LBD. In
the hER-LBD, CAM interacted with Glu353 and Leu387 via hydrogen bonds,
while BAM interacted with Thr347 via a hydrogen bond. Second, DBPs that interact
only with glycine residues (Gly321 for zER-LBD and Gly353 for
hER-LBD) via hydrogen bonds exhibited anti-estrogenic activity. These
features have been observed for other chemicals in previous studies [65, 66].
Chen et al. [66] reported that bisphenol AF and perfluorooctanoic
acid could compete for common key residues, such as Glu321 and Arg362, in the
binding pocket of zER, and induce anti-estrogenic effects. Cao
et al. [65] reported the binding of bisphenol analogs to residue Thr347
of hER via a hydrogen bond, suggesting that the binding mode may be a
major factor underlying reduced estrogenic activities through allosteric effects.
Based on these results, we speculate that anti-estrogenic DBPs have different or
inappropriate orientations when interacting with residues in the binding pocket,
resulting in anti-estrogen effects on both receptors. Meanwhile, BAM exhibited
weak estrogenic and anti-estrogenic activities when applied to zER.
Such double-directional endocrine-disrupting effects on an ER have been observed
previously for some chemicals. Phloridzin and protocatechuic acid have
double-directional endocrine-disrupting effects on proliferation of the MCF-7
cell line [67, 68]. When the intracellular environment lacks endogenous estrogen,
these double-directional EDCs show estrogen-like effects in cells, whereas the
same EDCs can exhibit anti-estrogenic activities in the presence of sufficient
estrogen. These chemicals have been proposed for use as alternatives to estrogen
therapy to overcome the associated side effects, however, the double-directional
effect of EDCs still can adversely influence the endocrine systems of organisms.
This study employed Pearson’s correlation coefficient and PCoA to compare
responses between zER and hER [69, 70]. Pearson’s correlation
coefficient has limited use for visualizing the myriad interactions of multiple
DBPs with two ERs, as it can only assess such relationships for
individual DBPs. The statistical significances of each Pearson’s correlation
co-existed. This means that both statistically significant and non-significant
points are shown. Therefore, further statistical analysis was required to explore
the general trends. The two species were clearly separated on plots of the
estrogenic responses. The anti-estrogenic results differed somewhat from the
estrogenic PCoA results. The results were less regular than those for estrogenic
PCoA plots. These facts indicate that the same DBP can induce completely
different patterns of endocrine disruption among species of biota, indicating
that risk assessment for DBPs should be conducted for each environment and
organism exposed to DBPs. Among DBPs, IAA showed the most distinctive effects
between zER and hER. This was the largest disparity in this
study. IAA, which showed the most potent endocrine disruption, has cytotoxic and
genotoxic effects on mammalian cells [20, 43, 71], and served as an endocrine
disruptor of the thyroid endocrine system in a study using a rat
pituitary-derived cell line [72]. On the other hand, CAN and BAN, which had
estrogenic activity when applied to hER, have mutagenic, carcinogenic,
and histopathological effects in mice [73, 74, 75]. Our previous study demonstrated
the effect of estrogenic endocrine disruption on hER [22, 23], while
these substances had no or weak estrogenic effects on zER. In terms of
anti-estrogenic endocrine-disrupting effects, CAM and BAM acted as strongly
anti-estrogenic compounds on zER in this study. CAM, which is widely
used worldwide as a pesticide and thus is frequently present in surface water,
causes strong thyroid hormone disruption in aquatic organisms [76]. Furthermore,
BAM can disrupt thyroid hormone homeostasis and cause developmental toxicity in
zebrafish [77]. IAA, which had the strongest effects among DBPs in this study,
causes pericardial edema, fin malformations, and delayed development in zebrafish
[78]. This study found that although CAM and BAM did not cause robust endocrine
disruption in hER, they caused anti-estrogenic endocrine disruption in
zER. Anti-estrogenic endocrine disruption can lead to adverse outcomes,
including alteration of the sex ratio and inhibition of normal ER-mediated
ovarian development in fish [79, 80]. DBP emitted from WWTPs into freshwater
environments is more likely to have adverse effects on aquatic organisms than on
humans, as WWTPs discharge their final effluent directly into rivers. Taken
together, our results indicate that DBPs can disrupt the endocrine systems of
both zebrafish and humans. These findings suggest that DBPs could possibly affect
the endocrine system of aquatic biota. However, further research is necessary to
confirm these functions in vivo and investigate the reproductive
toxicity of DBPs on endocrine systems.
5. Conclusions
To the best of our knowledge, this is the first study to compare endocrine
responses to halogenated DBPs between zER and hER. We
explored the cytotoxicity and endocrine disruption of nine DBPs, focusing on
halogenated DBPs, and revealed the differing responses using correlation and
distance-based analyses based on reporter assay data for two ERs. Among
the nine types of DBPs, IAA, CAN, and BAN triggered estrogenic activities in
hER. Meanwhile, IAA, CAM, and BAM inhibited estrogenic activities of E2
in zER. The effective concentrations of DBP used in this study are
frequently detected in effluent from WWTPs and aquatic environments. Aquatic
organisms, specifically fish, are exposed to effective concentrations of DBPs
throughout their life, and are thus more affected by endocrine disruption than
humans. Therefore, this study suggests that endocrine-disrupting effects of toxic
substances should be evaluated separately in multiple species.
Availability of Data and Materials
The datasets used and/or analyzed during the current study are available from
the corresponding author on reasonable request.
Author Contributions
SAL and CGP wrote original drafting of the manuscript, SAL, CGP, JHY and YJK
designed the research and conceptualization. SAL and CGP performed the research.
SAL, CGP, IC, CSR analyzed the data. YJK and ME performed review & editing. JHY
acquired funding & administrated the project. All authors read and approved the
final manuscript.
Ethics Approval and Consent to Participate
Not applicable.
Acknowledgment
The authors would like to acknowledge Dr. Da-Hye Kim at the University of
Antwerp for conducting the precedent research.
Funding
This study endowed research award from Next&Bio Inc., by the Strategies for
Establishing Adverse outcome pathways (AOPs) use in alternatives to animal
testing and their global standardization (No. 32201).
Conflict of Interest
The authors declare no conflict of interest. Next&Bio Inc. declare no competing financial interests and this paper is written for non-commercial purposes.


