


1 Key Laboratory of Gastrointestinal Cancer (Fujian Medical University), Ministry of Education, School of Basic Medical Sciences, Fujian Medical University, 350005 Fuzhou, Fujian, China
2 Department of Biological Sciences, Xi’an Jiaotong-Liverpool University, 215123 Suzhou, Jiangsu, China
3 Research Center for BioSystems, Land Use, and Nutrition (IFZ), Institute of Applied Microbiology, Justus-Liebig-University Giessen, 35392 Giessen, Germany
4 Fujian Key Laboratory of Tumor Microbiology, Department of Medical Microbiology, Fujian Medical University, 350005 Fuzhou, Fujian, China
†These authors contributed equally.
Academic Editor: Graham Pawelec
Abstract
Background: N1-methyladenosine (m1A) is a reversible post-transcriptional modification in mRNA, which has been proved to play critical roles in various biological processes through interaction with different m1A regulators. There are several m1A regulators existing in the human genome, including YTHDF1-3 and YTHDC1. Methods: Several techniques have been developed to identify the substrates of m1A regulators, but their binding specificity and biological functions are not yet fully understood due to the limitations of wet-lab approaches. Here, we submitted the framework m1ARegpred (m1A regulators substrate prediction), which is based on machine learning and the combination of sequence-derived and genome-derived features. Results: Our framework achieved area under the receiver operating characteristic (AUROC) scores of 0.92 in the full transcript model and 0.857 in the mature mRNA model, showing an improvement compared to the existing sequence-derived methods. In addition, motif search and gene ontology enrichment analysis were performed to explore the biological functions of each m1A regulator. Conclusions: Our work may facilitate the discovery of m1A regulators substrates of interest, and thereby provide new opportunities to understand their roles in human bodies.
Keywords
- m1A
- substrate
- machine learning
RNA epigenetics has been an emerging field in the past ten years, with more than 170 types of RNA modifications identified in the human epitranscriptome [1]. Apart from the well-studied N6-methyladenosine (m6A), N1-methyladenosine (m1A) is recognized as a reversible RNA modification of increasing interest present on eukaryotic messenger RNA (mRNA) and transfer RNA (tRNA) [2]. It was found that m1A occurs on tRNA at positions 9, 14, and 58 [3], with the m1A58 serving a pivotal role in the tRNA stability [4]. Transcriptome-wide mapping of m1A confirmed that m1A modification occurs in thousands of different eukaryotic mRNAs, and it is estimated that more than 20% of transcript mRNAs in humans contain m1A modifications [5].
Similar to the other epigenetic modifications studied, m1A on the mRNA can bind with regulator proteins to play critical biological functions in humans. It is installed by the methyltransferases, TRMT6/61A and TRMT61B, and removed by the demethylases, ALKBH3 and ALKBH1 [2]. In addition, four m1A readers, YTHDF1-3 and YTHDC1, were identified to interact directly with m1A to serve critical roles in the regulation of m1A-carrying RNAs [6]. YTHDF1-3 are three paralogs of the YTHDF family and share high identity with sequence similarity of about 85% [7]. YTHDC1 is significantly different from the YTHDF family proteins in terms of amino acid sequence and protein size [8]. The common characteristic of YTHDF1-3 and YTHDC1 is that they all have a YTH domain to serve various biological functions. The domain has 100–150 residues and is characterized by a curved six-strand beta sheet surrounded by 4–5 alpha helices [9].
It has been shown that m1A regulators appear to interact with mRNA m1A modifications through post-transcriptional control mechanisms to perform a series of biological functions. YTHDF1 can facilitate efficient protein translation [6, 10], while YTHDF2 can lead to the increased mRNA instability and control its lifetime [6, 11]. YTHDF3 was considered to share some common binding sites with both YTHDF1 and YTHDF2 [12], which suggested that it may play a synergistic function with YTHDF1 and YTHDF2. It facilitates the gene translation by interacting with some ribosomal proteins to help YTHDF1 and participates in the decay of mRNA to assist YTHDF2 [12]. In addition to the YTHDF protein family, the role of YTHDC1 in regulating RNA is also pivotal. It was demonstrated to be involved in pre-mRNA splicing by recruiting its associated protein serine/arginine splicing factor SRSF3, which participates in exclusion splicing and exon inclusion [13, 14].
It is critical to understand the binding tendencies of YTHDF1, YTHDF2, YTHDF3, and YTHDC1 and the relative downstream biological processes they regulate. Many database websites of post-transcriptional modification sites such as MeT-DB and RMBase [15, 16] have been constructed, and different kinds of known human RNA modification sites are well-deposited in the websites such as WHISTLE [17, 18, 19] or m6A-ATLAS [20], etc. [21, 22, 23]. Sequencing techniques such as iCLIP [24] or Par-CLIP [25] have been developed, which are effective in identifying the substrates of RNA binding proteins (RBPs), including m1A regulators. However, there are usually two limitations of these approaches. Firstly, the implementation of the wet-lab experiment is time-consuming and laborious. Secondly, the coverage is limited, with restricted identified sites on the transcripts with low expression rates. Nevertheless, these wet-lab experiments provide enough data for the computational methods to predict the future sites of interest, saving the laborious process of the wet-lab experiments. So far, there have been many sequence-based prediction works conducted, including iRNA-PseDNC [26], iRNA-Methyl [27], m6A prediction [28], MutilRM [29] and RAM-ESVM [30]. In addition to sequence features, genome-derived features have been additionally incorporated in some recent prediction works [17, 31], showing a better prediction performance compared to the convention methods.
YTHDF1-3 and YTHDC1 were often studied as m6A regulators. However, how they interact with m1A to perform biological functions is poorly investigated. In this work, we submitted the framework m1ARegpred (m1A regulators substrate prediction), based on machine learning and the combination of both sequence- and genome-derived features. Firstly, the site information was collected from the wet-lab experiment data. Then, using eight sequence encoding methods and 56 genome features, the sequence information was converted to a format compatible with the machine learning tasks. Support vector machine was selected as the machine learning algorithm in the framework. Finally, the performance of the prediction was evaluated using different metrics. The m1ARegpred framework is expected to help identify the substrates of m1A regulators, thereby providing a foundation for future related research. In addition, we also analyzed the biological characteristics of these regulators, including performing motif analysis of the substrates of each regulator and exploring their biological functions through gene ontology enrichment analysis (GO enrichment analysis). We hope this bioinformatics framework may provide new opportunities for future studies to understand the roles of m1A regulators in human bodies. The project code is available at https://github.com/SXWuFJMU/m1ARegpred.
The transcriptome-wide m1A sites used in this study were retrieved from the m6A-Atlas database [20], which contains the wet-lab experiments data collected from four different techniques including m1A-seq, RBS-seq, miCLIP, and m1A-MAP. In the model construction, we used the m1A regulators substrates collected from 11 datasets obtained from three cell types. The target sites of four RBPs were identified by either Par-CLIP [25] or iCLIP [24]. The data were all downloaded from Gene Expression Omnibus (GEO) repository. The detailed information on the m1A regulator binding sites is summarized in Table 1 (Ref. [10, 12, 14, 32, 33, 34, 35, 36]).
| Dataset | Reader | Site | Cell line | Technique | Source |
| 1 | YTHDF1 | 762 | Hela | PAR-CLIP | GSE63591 [10] |
| 2 | 12906 | HEK293T | iCLP | GSE78030 [32] | |
| 3 | YTHDF2 | 820 | Hela | PAR-CLIP | GSE49339 [33] |
| 4 | 6784 | HEK293T | iCLP | GSE78030 [32] | |
| 5 | 528 | HNP1 | GSE158020 [34] | ||
| 6 | YTHDF3 | 57 | Hela | PAR-CLIP | GSE86214 [12] |
| 7 | 6857 | HEK293T | iCLP | GSE78030 [32] | |
| 8 | YTHDC1 | 1258 | Hela | PAR-CLIP | GSE74397 [35] |
| 9 | 453 | GSE58352 [36] | |||
| 10 | 1302 | GSE71096 [14] | |||
| 11 | 13845 | HEK293T | iCLP | GSE78030 [32] |
The substrates of m1A regulators were considered as positive sites by searching for the overlaps of m1A sites and m1A regulators peaks. The negative sites were selected randomly from the non-positive adenine sites in the same m1A regulators peaks on the same transcript of the positive sites. The ratio of positive sites and negative sites was kept as 1:1.
Considering that the polyA selection may cause bias in the experiment in the library preparation, we respectively built the full transcript model and mature mRNA model based on the datasets. In the prediction model of full transcript, both exon and intron binding sites were included, while only exon binding sites were considered in the mature mRNA model.
Eight sequence encoding methods were used, including Kmer, ENAC, PS2, NCP, ANF, EIIP, PSTNP, and correlation factor. In this study, the sequences with 41 base pairs (bp) length flanking the target sites were used for encoding.
Kmer, enhanced nucleic acid composition (ENAC), and position-specific of two
nucleotides (PS2) are three simple and effective methods. Kmer [37] provides
4
The chemical properties of nucleotides (NCP) and EIIP values of trinucleotides (EIIP) encode the sequences considering their chemical characters. For NCP [28], the nucleotide on each position on a sequence was encoded to three dummy variables, respectively referring to whether the nucleotide has the ring structures, hydrogen bonds, and functional groups (amino group equals one and keto group equals zero). Therefore, the i-th nucleotide on the sequence were encoded as (1,1,1)/(0,1,0)/(1,0,0), or (0,0,1) respectively for A, C, G, U. EIIP [39] describes the distribution of electron-ion energies of a sequence. In this study, the distribution of electron-ion energies of trinucleotides was considered. For each sequence, 64 features representing different trinucleotides (from AAA to UUU) were respectively calculated as the product of the trinucleotide frequency and the EIIP value, while the EIIP value of a trinucleotide is the sum of the EIIP value of all three nucleotides (A, C, G, U equals to 0.126, 0.134, 0.08 and 0.134).
For accumulated nucleotide frequency (ANF) [28], 41 features were generated from
each position on the sequence. The feature of the i-th nucleotide is defined as
the frequency of that nucleotide in the first i nucleotides in the sequence. For
position-specific trinucleotide propensity (PSTNP) [39], 39 features were
generated to represent the trinucleotides from the 1st to the 39th position on
the sequence. The feature of the i-th trinucleotides was calculated as Z
The Sequence-order-correlated factor [40] is
an encoding method to incorporate the global sequence-order information. In this
study the correlation factors considered were from 1-tir to 5-tir, therefore
there are five features generated from each sequence. The
56 genome features were applied in this study to describe the genome information of the target sites. All the genome features can be found in the R “m6ALogisticModel” package (version1.0.1) (http://www.rnamd.com/exomepeak2/). The genome features can be divided into seven classes. Features 1–16 are dummy variables referring to whether the target sites fall within a certain region on the transcript. The features were generated using the GenomicFeatures R package [42] using transcript annotations hg19 TxDb package. Features 17–20 describe the relative position of the target site on the transcript, while features 21–29 indicate the length of the region where the target site is located. Features 30–41 use dummy variables to indicate whether the target site falls on a certain motif while features 42–45 provide the conservation scores of the sites, including the Phast-Cons score [43] and the fitness consequence scores [44]. Features 46–47 represent the RNA secondary structure around the target sites using RNAfold from the Vienna RNA package [45]. Finally, features 48–56 describe the characters of the gene or transcript containing the sites. The detailed information is summarized in Supplementary Table 2.
In machine learning, excess features may lead to over-fitting, in which the statistical model fits too closely to the training set, thus decreasing the accuracy of the future prediction. Therefore, the features were selected to identify the most effective features for prediction. F-score [46] is an algorithm often used in feature selection [34, 47]. A feature with a higher F-score shows better predictive attribution. The F-score for the i-th feature is be defined as follows:
where n
The incremental feature selection (IFS) method [46] was used to perform the selection process. Specifically, we ranked the features according to their F-score from high to low. For N starting from one, we built the model using top N features to see the performance. Then we repeated the above steps, with N plus one each time. Finally, we chose the feature number when the performance stops increasing. AUROC and AUPRC were selected as the main metrics in the evaluation of performance in the selection process.
At the beginning of the performance evaluation of the models for each m1A regulator, the m1A regulator binding sites identified in the different experiments were mixed. 20% of the total datasets were sampled for independent testing set and the remaining 80% of the sites were used for model training. A 5-fold cross-validation was conducted during the model construction.
In a real scenario, the sites of interest may come from a completely different biological condition from the training sites, such as different cell lines and techniques. To further test the capability to predict the targeted sites under various biological conditions, we then conducted dataset-level cross-validation. In each round of the cross-sample test, the datasets generated from each sample were used as an independent testing set, while the remaining were mixed for the training model.
The support vector machine algorithm (SVM) has been previously used in mammalian miRNA target prediction [48], pre-miRNA prediction [49], protein kinase-specific phosphorylation sites prediction [50], and human RNA methylation sites prediction [51, 52]. Therefore, the SVM with the radial basis function as the kernel function was chosen to build the predictor in this study. We then compared it with other machine learning algorithms, including random forest, gradient boosting machines (GBM), the k-nearest neighbors (KNN), and bayesian to ensure the best performance of the model. The parameters in these functions were set to default values. When verifying the performance of the model, five common metrics were considered, including the area under the receiver operating characteristic (AUROC) [53], the area under the precision-recall curve (AUPRC), accuracy (Acc), sensitivity (Sn), and specificity (Sp), where the receiver operating characteristic is plotted by true positive rate (TPR) and false positive rate (FPR), and the precision-recall curve is plotted by recall and precision:
where TP refers to the number of true positives, and TN refers to the number of true negatives. FP means false positive while FN means false negative. AUROC was chosen as the main indicator. The model construction and performance evaluation were conducted in R, and the machine learning algorithm was from the caret package.
Sequence-derived features can reflect the intuitive characteristic of the sequence flanking the targeted sites, and genome-derived features show a new perspective in effectively predicting targeted sites. Previous studies have shown that the combination of sequence- and genome-derived features can obtain the optimal performance of the prediction. Here, eight sequence encoding methods and a series of genomic features were used to construct the m1ARegpred model. Feature selection was conducted to select the features most related to the m1A regulator substrates to avoid over-fitting. The results of feature selection are shown in Fig. 1. The selected feature numbers were around twenty. Among them, the YTHDF3 model, either full transcript or mature mRNA, possessed the least feature numbers. The full transcript model and mature mRNA model of YTHDC1 required more features, possibly due to a larger training set. The genomic-derived features, PSTNP, and correlation factor provided more features with high predictive ability. The detailed results of feature selection are summarized in Supplementary Fig. 1.
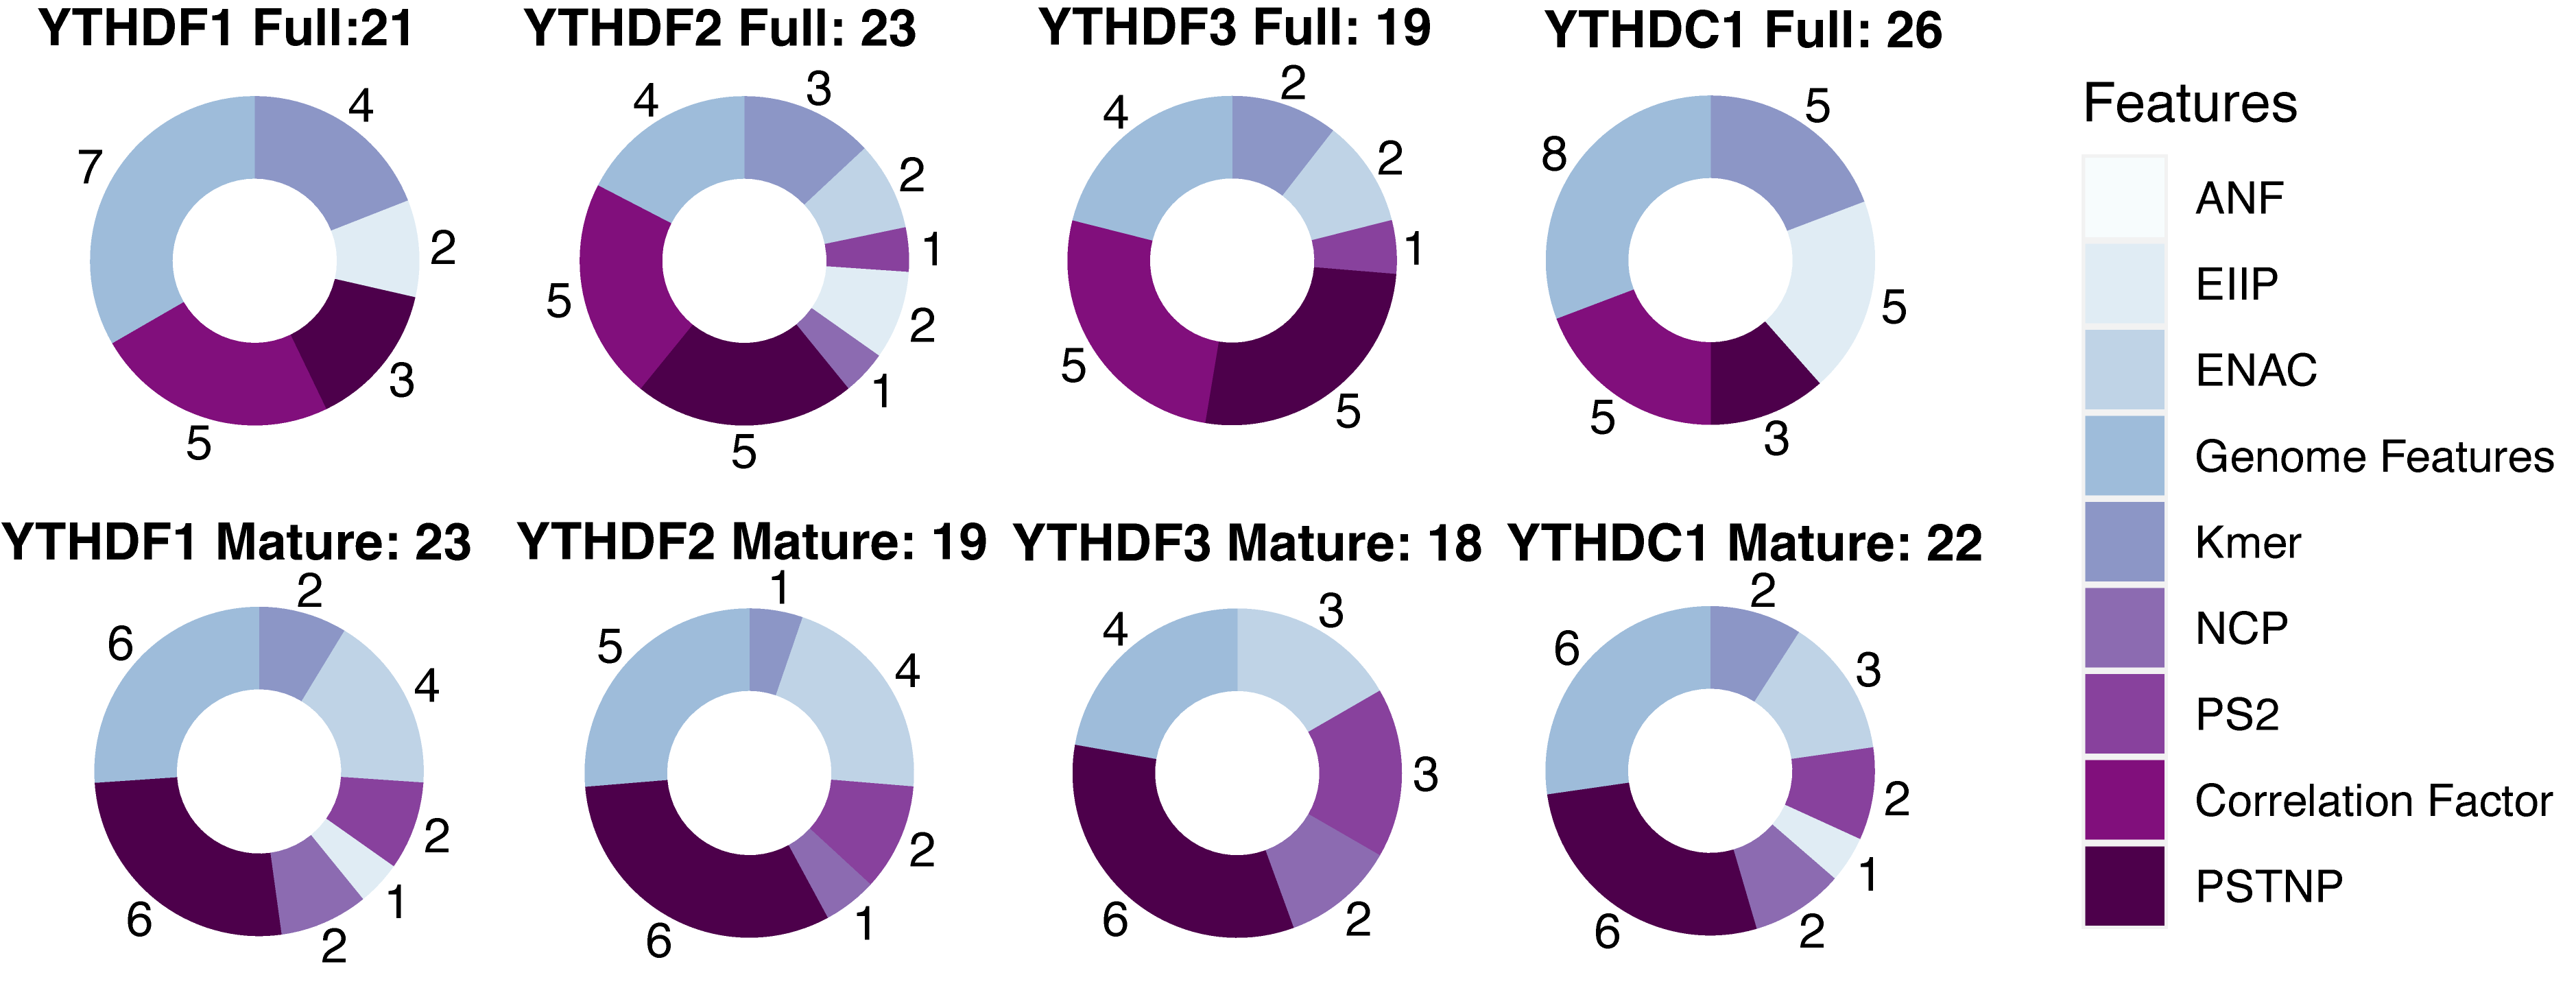 Fig. 1.
The results of feature selection (Detailed in Supplementary Fig. 1). There were nine types of features to be evaluated, including eight sequence encoding methods and several genome features. The features were ranked according to the F-score, and the optimal feature subsets were selected using IFS method. Different feature combinations were selected for different regulator predictors. PSTNP, correlation factor, and genome features provided more features for the final model constructions.
The feature combination obtained through a series of selections showed high accuracy in prediction (Fig. 2). For each m1A regulator, 80% of the total sites were used for training, and five-fold cross-validation was performed on the training data. For the remaining independent testing set, AUROC and AUPRC were used to evaluate the performance. On average, the m1ARegpred achieved AUROC scores of 0.92 and 0.857, and AUPRC scores of 0.91 and 0.842 in the independent testing set for the full transcript model and mature mRNA model respectively. We then used single sequence-coding methods to build the model, including Kmer, EIIP, ANP, and PSTNP. As expected, the m1ARegpred framework of combining and selecting features showed high accuracy, exceeding the performance of using any sequence-derived features alone. The AUROC score of the models are summarized in Table 2. Other compared metrics, including AUPRC, ACC, Sn, and Sp were listed in Supplementary Table 3. In the real scenario, the frequency of the negative sites often overrides that of the positive sites. Therefore, we then prepared unbalanced testing sets with positive-to-negative ratio of 1:5 to further evaluate the models. The m1ARegpred again showed the highest performance among all the competing methods, as shown in Supplementary Table 4.
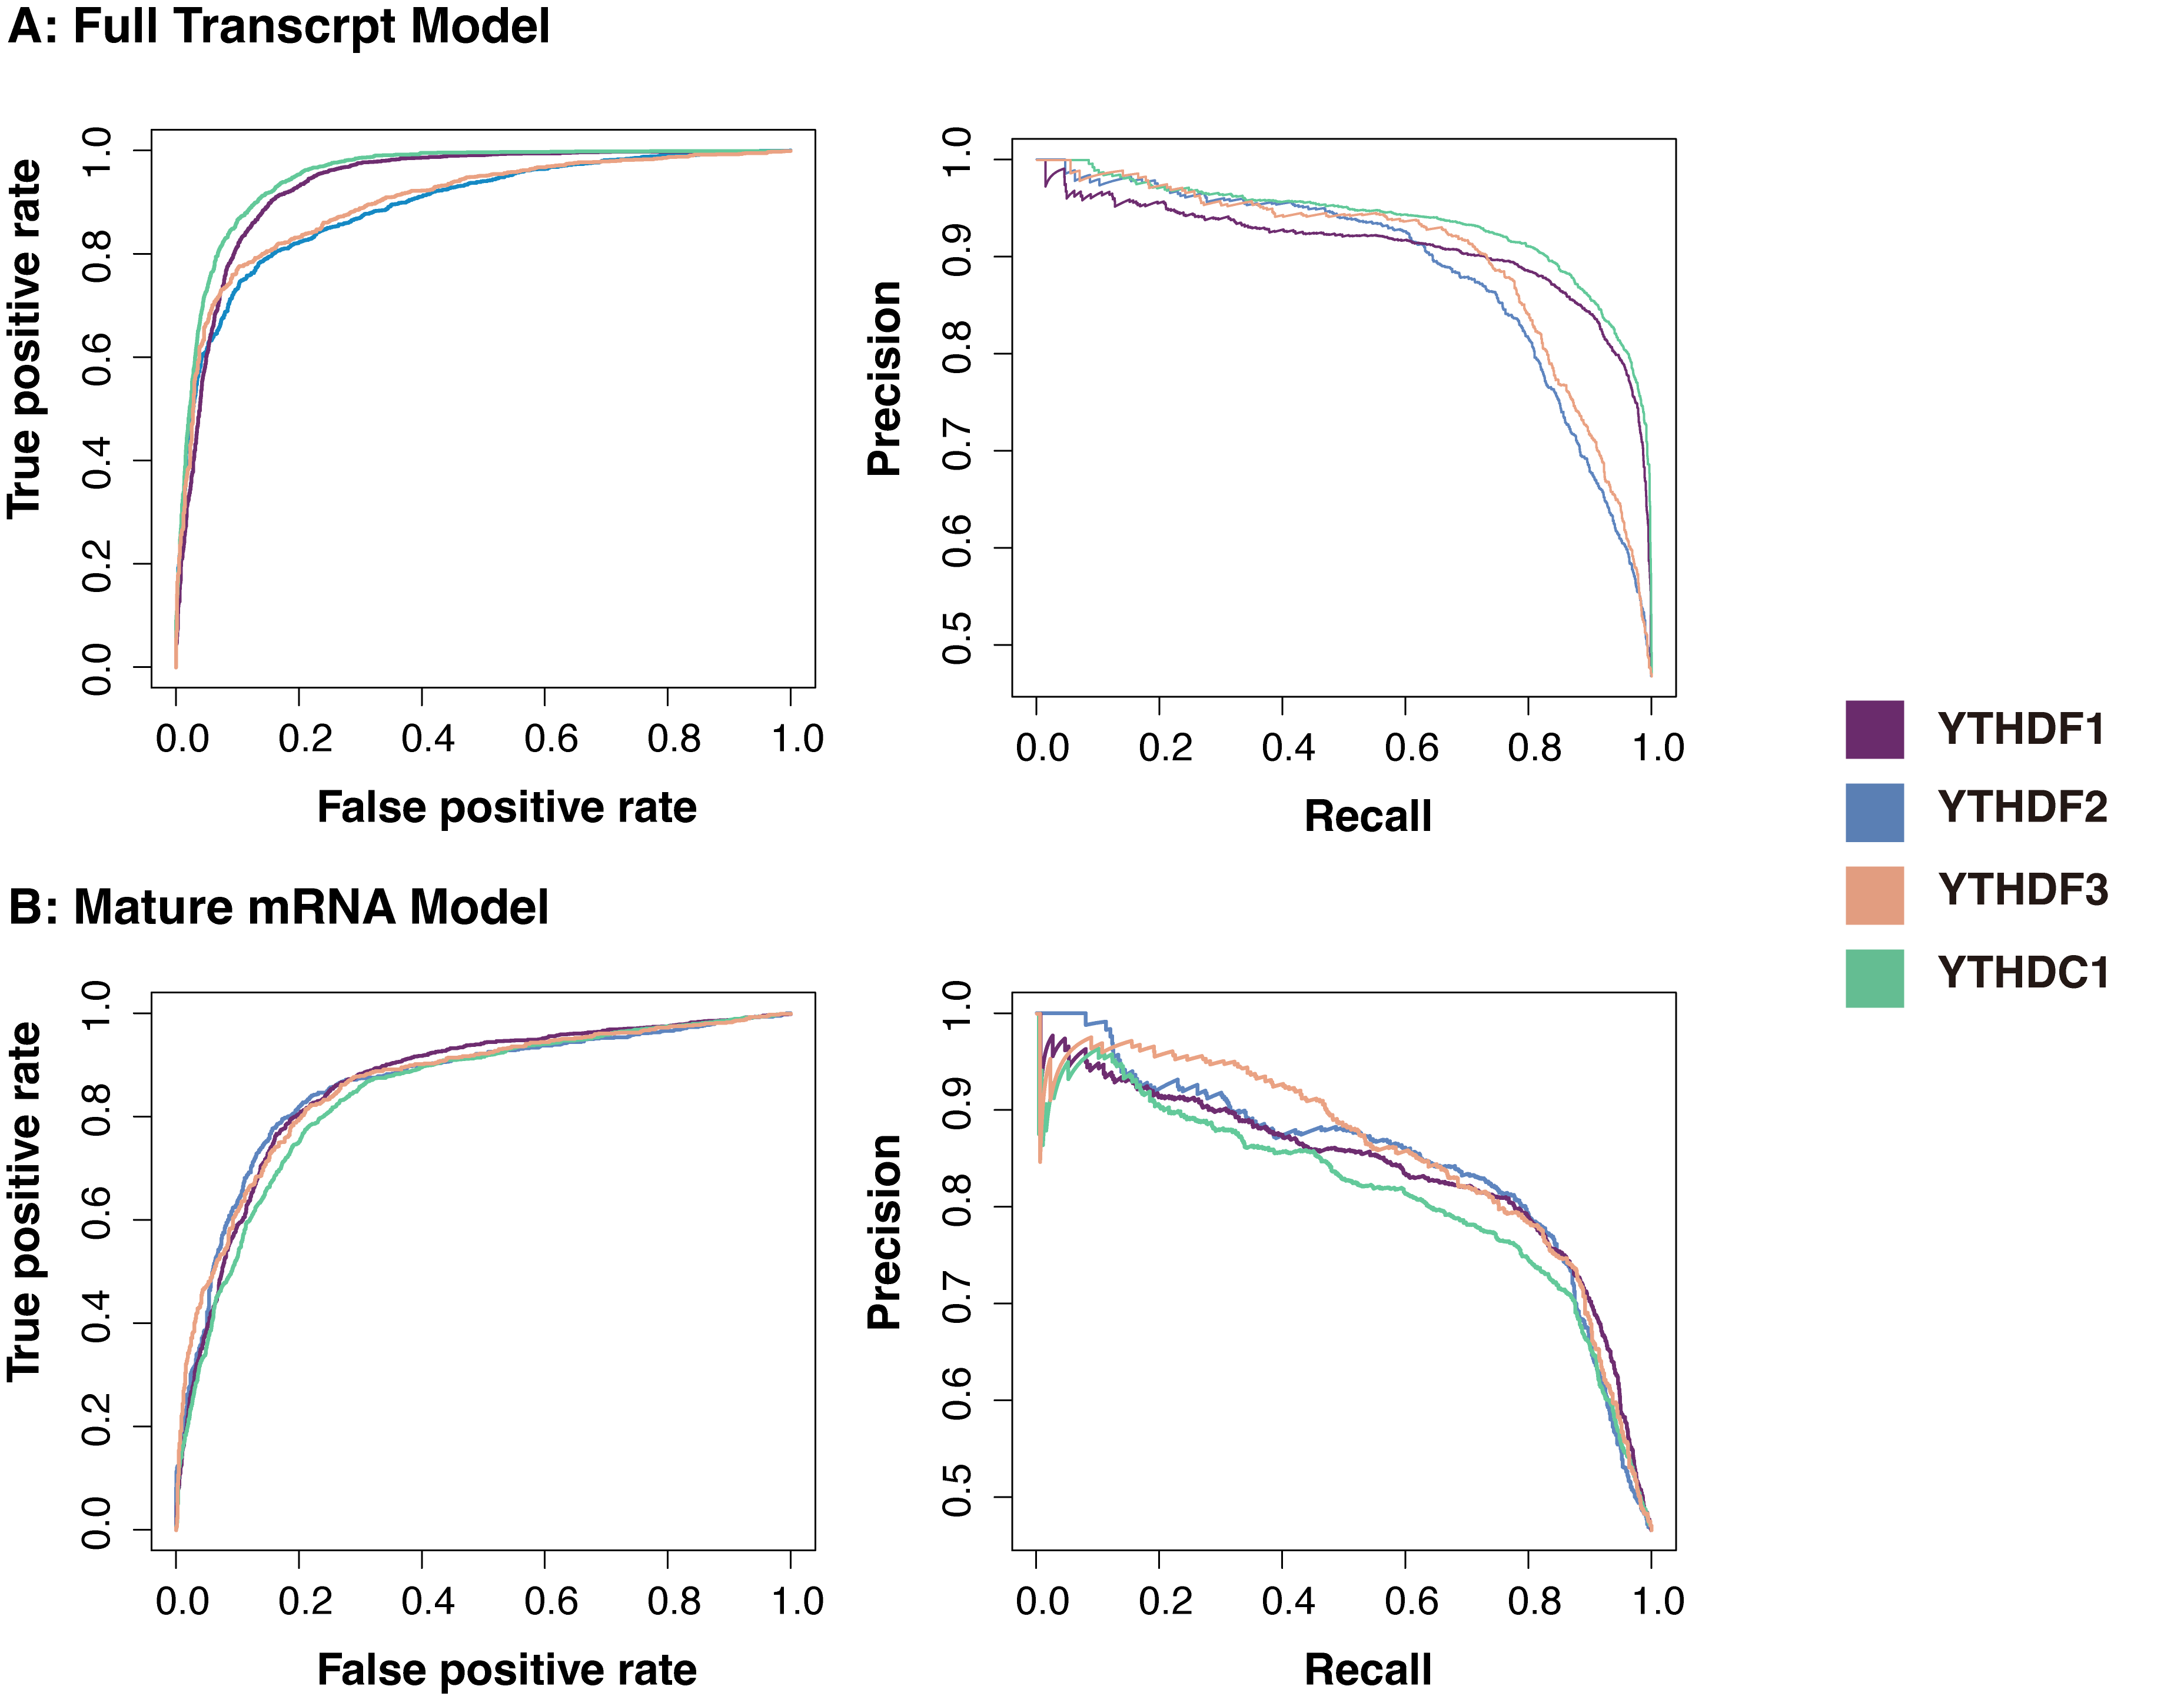 Fig. 2.
Performance of the predictors. (A) The ROC curve (left) and AUCPR curve (right) of the full transcript models. (B) The ROC curve (left) and AUCPR curve (right) of the mature mRNA models. The area under the receiver operating characteristic curve (AUC) and the area under the Precision-Recal curve (AUPRC) are the measures of the ability of the predictor to distinguish between two classes. Generally, the scores of all the predictors were high (over 0.8).
| Full Transcript Model | |||||
| Method | YTHDF1 | YTHDF2 | YTHDF3 | YTHDC1 | Average |
| m1ARegpred | 0.935 | 0.891 | 0.900 | 0.952 | 0.920 |
| Kmer | 0.819 | 0.757 | 0.771 | 0.834 | 0.795 |
| EIIP | 0.843 | 0.830 | 0.803 | 0.859 | 0.834 |
| ANP | 0.671 | 0.661 | 0.649 | 0.678 | 0.665 |
| PSTNP | 0.829 | 0.800 | 0.809 | 0.842 | 0.820 |
| Mature mRNA Model | |||||
| Method | YTHDF1 | YTHDF2 | YTHDF3 | YTHDC1 | Average |
| m1ARegpred | 0.863 | 0.860 | 0.863 | 0.843 | 0.857 |
| Kmer | 0.699 | 0.679 | 0.697 | 0.707 | 0.696 |
| EIIP | 0.729 | 0.710 | 0.720 | 0.727 | 0.722 |
| ANP | 0.605 | 0.624 | 0.641 | 0.624 | 0.624 |
| PSTNP | 0.769 | 0.787 | 0.802 | 0.770 | 0.782 |
We further evaluated the capability of our framework to recognize the m1A regulator binding sites under different biological conditions (Table 3). In this test, a dataset level leave-one-out experiment was conducted, in which the sites from each sample were selected as the testing set, while the remaining datasets were mixed as the training set to construct the model. In addition, we also evaluated the performance of the single sequence encoding methods for comparison. In the cross-condition test, our framework obtained AUROC scores of 0.817 on the full transcript model and 0.843 on the mature mRNA model, which again exceeded the single conventional sequence-derived features (see Supplementary Table 5 for more details).
| Full Transcript Model | |||||
| Method | YTHDF1 | YTHDF2 | YTHDF3 | YTHDC1 | Average |
| m1ARegpred | 0.740 | 0.859 | 0.840 | 0.828 | 0.817 |
| Kmer | 0.571 | 0.713 | 0.575 | 0.640 | 0.625 |
| EIIP | 0.639 | 0.762 | 0.574 | 0.699 | 0.669 |
| ANP | 0.572 | 0.617 | 0.563 | 0.613 | 0.591 |
| PSTNP | 0.657 | 0.773 | 0.672 | 0.702 | 0.701 |
| Mature mRNA Model | |||||
| Method | YTHDF1 | YTHDF2 | YTHDF3 | YTHDC1 | Average |
| m1ARegpred | 0.868 | 0.881 | 0.819 | 0.831 | 0.843 |
| Kmer | 0.589 | 0.703 | 0.593 | 0.643 | 0.629 |
| EIIP | 0.637 | 0.757 | 0.666 | 0.696 | 0.673 |
| ANP | 0.585 | 0.660 | 0.602 | 0.652 | 0.619 |
| PSTNP | 0.749 | 0.817 | 0.699 | 0.760 | 0.756 |
Support vector machine (SVM) is one of the most widely used algorithms [19, 51, 54, 55, 56], which shows stable prediction performance. However, to verify the rationality of choosing SVM as the machine learning algorithm to build our proposed models, the performances of SVM, GBM, random forest, KNN, and bayesian were compared for the prediction of m1A regulator binding sites on the full transcript model and mature mRNA model respectively. The metrics used for evaluation include AUROC, AUPRC, Acc, Sn, and Sp. The average scores of different machine learning algorithms are shown in Fig. 3 (see detailed prediction results in Supplementary Table 6). Among all the machine learning algorithms, SVM, random forest and gradient descent machines show the highest performances on the independent testing set. Finally, SVM was chosen for our framework to predict target sites. The KNN performance is quite competitive, which indicated that the sequences are possibly highy homologous. Therefore, a CD-HIT-EST with cut-off of 0.8 was applied to the datasets to reduce the redundacy prior to the model constructions. The results showed that the performances were little affected by the potential redundancy (Supplementary Table 7).
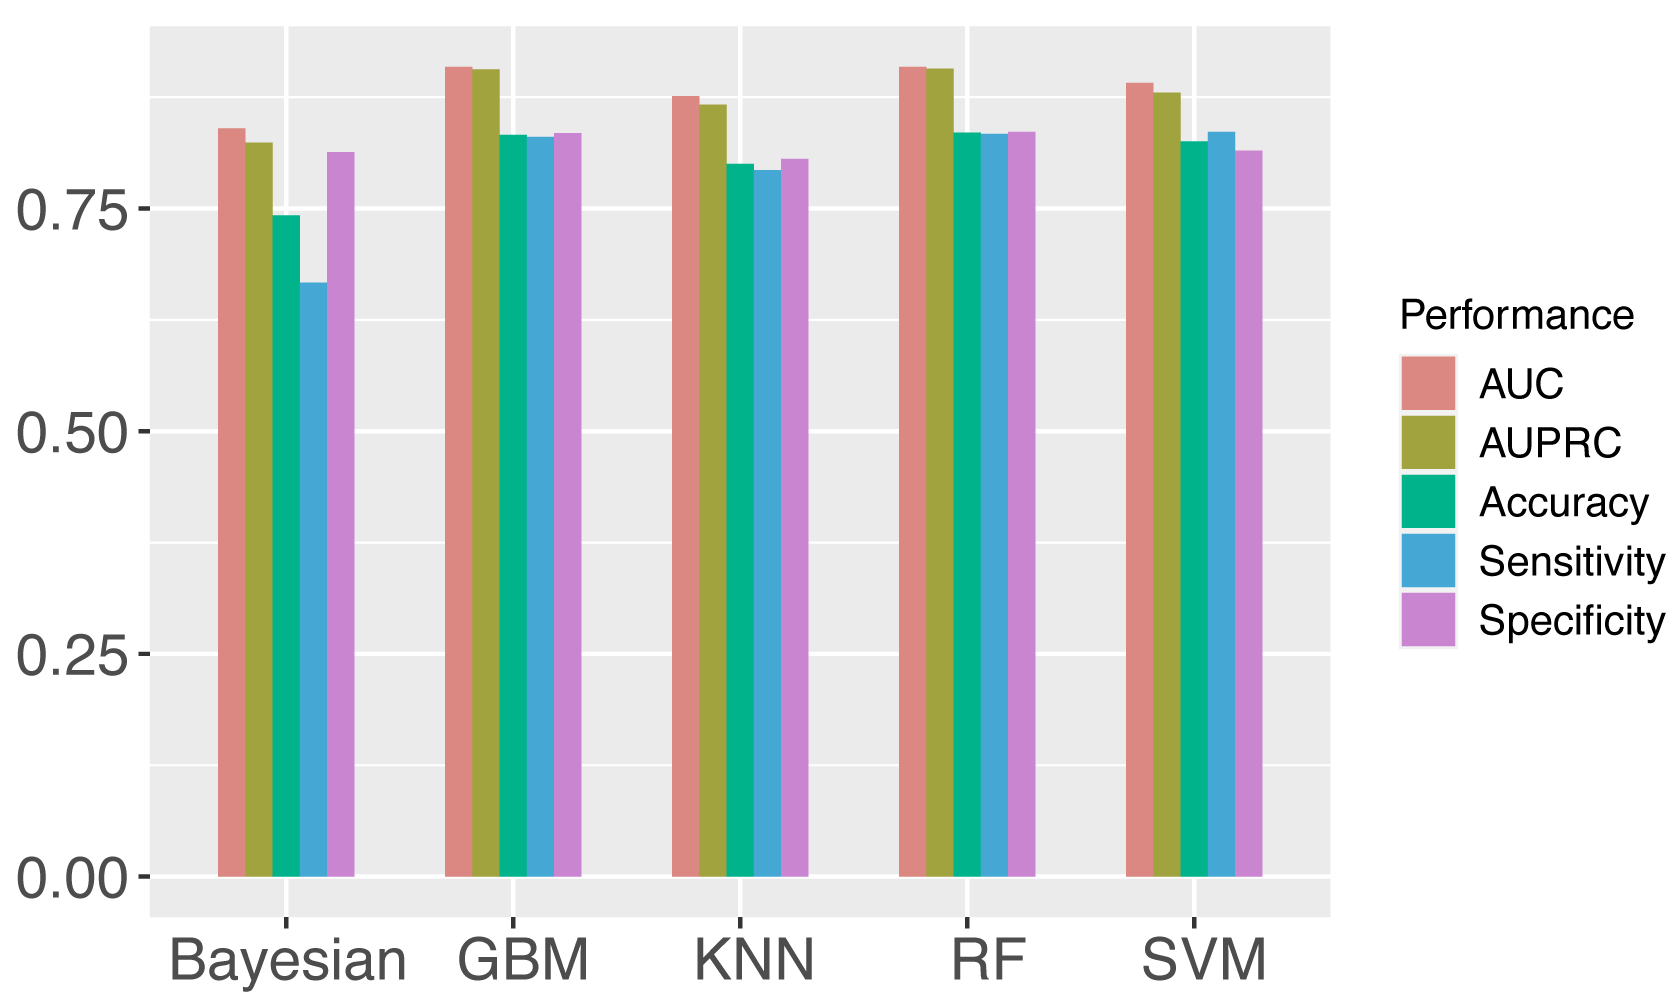 Fig. 3.
Comparison of different machine learning algorithms (Detailed in Supplementary Table 6). The performance of each algorithm was calculated as the average value of eight models. AUC, AUPRC, Acc, Sn, Sp were evaluated, and SVM was finally chosen for the models.
To better understand the sequence pattern that may contribute to the prediction, motif analysis was performed on the m1A regulator substrates using XSTREME with default parameters from the MEME suit [57]. YTHDF family proteins and YTHDC1 were often studied as the regulator of m6A, thus their biological characteristics as m6A regulators have been well-addressed. In this study, the proteins were studied as m1A regulators. The training data were used to analyze the substrates of m1A regulator binding sites and explore the regulator function of the YTHDF family proteins and YTHDC1 as m1A regulators. The most enriched motif of each regulator substrate is shown in Fig. 4. Similar to the previous study, m1A sites tend to locate within a GC-rich context [5]. The result also suggests that some targeted sites showing a “GGUUCRA” motif in all of the regulators, including YTHDF1, YTHDF2, YTHDF3, and YTHDC1. This is consistent with previous studies which found that a small part of m1A modifications shows a “GUUCRA” motif [58, 59].
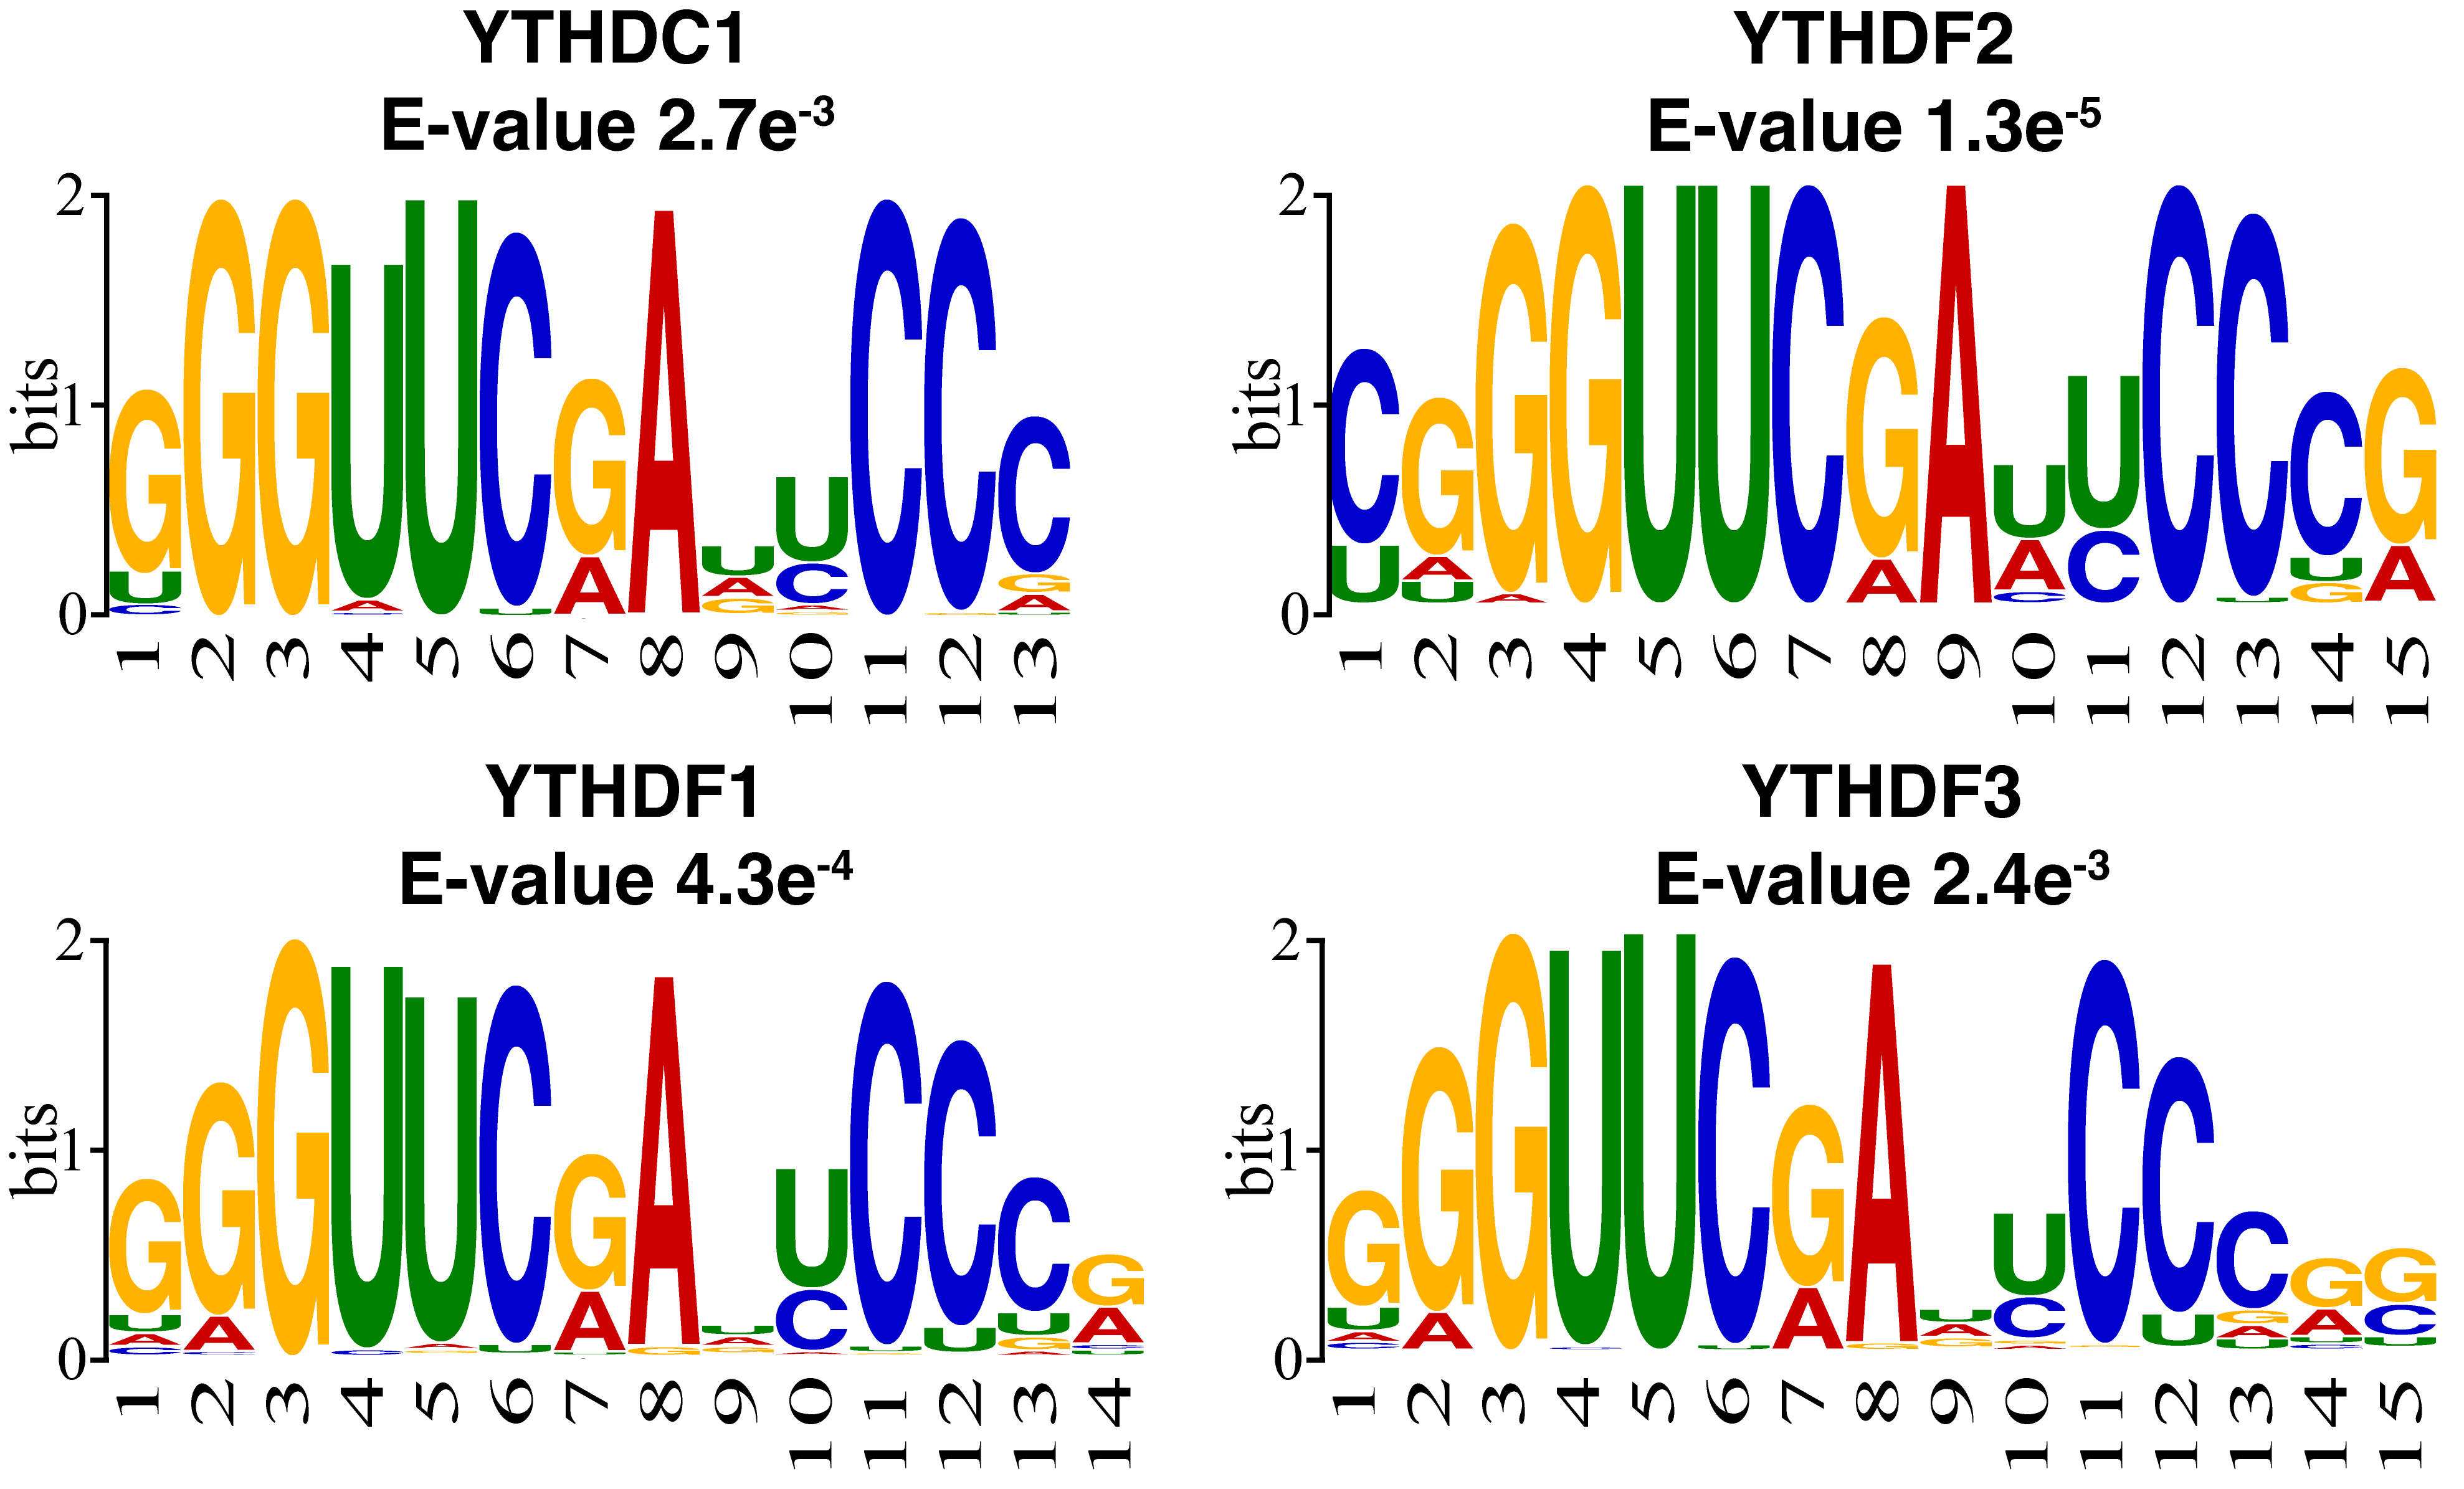 Fig. 4.
Motif analysis of the reader substrates using XSTREME. The positive training data were used for motif discovery. Four regulator substrates showed a similar motif of “GUUCRA”.
To explore the correlation among m1A regulator, m1A modification, and biological function, GO enrichment analysis was performed using DAVID websites [60]. Fig. 5 shows the top five relative GO biological process terms of each regulator. YTHDF1 substrates are enriched under the GO terms of translational initiation and cytoplasmic translation, which is supported by the previous studies that YTHDF1 is involved in mRNA catabolic process and translation initiation [6, 10]. It was found that in the YTHDF1 knockdown samples, the ribosome-bound mRNA reads were significantly lower than that in the control samples, which results in a decreased translation efficiency [10]. YTHDF2 targets are associated with nonsense-mediated decay, which corresponds to our knowledge that it is related to the decrease of the mRNA stability [6, 11] and accelerates the degradation of m1A-carrying transcripts [6]. It was found that the depletion of cellular YTHDF2 led to the increase of m1A-containing mRNA, while the increase of m1A levels through depleting the m1A eraser ALKBH3 led to the destabilization of m1A-modified mRNA [61]. YTHDF3 is related to translational initiation and nonsense-mediated decay, which was reported to coordinate with YTHDF1 and YTHDF2 respectively in translation initiation and mRNA decay [12]. YTHDC1 is reported to be involved in mRNA splicing according to the GO enrichment analysis, which is supported by its interaction with the splicing factor SRSF3 in exon inclusion and exclusion splicing [13, 14]. It recruits SRSF3 and prevents SRSF10 binding to help exon inclusion [14].
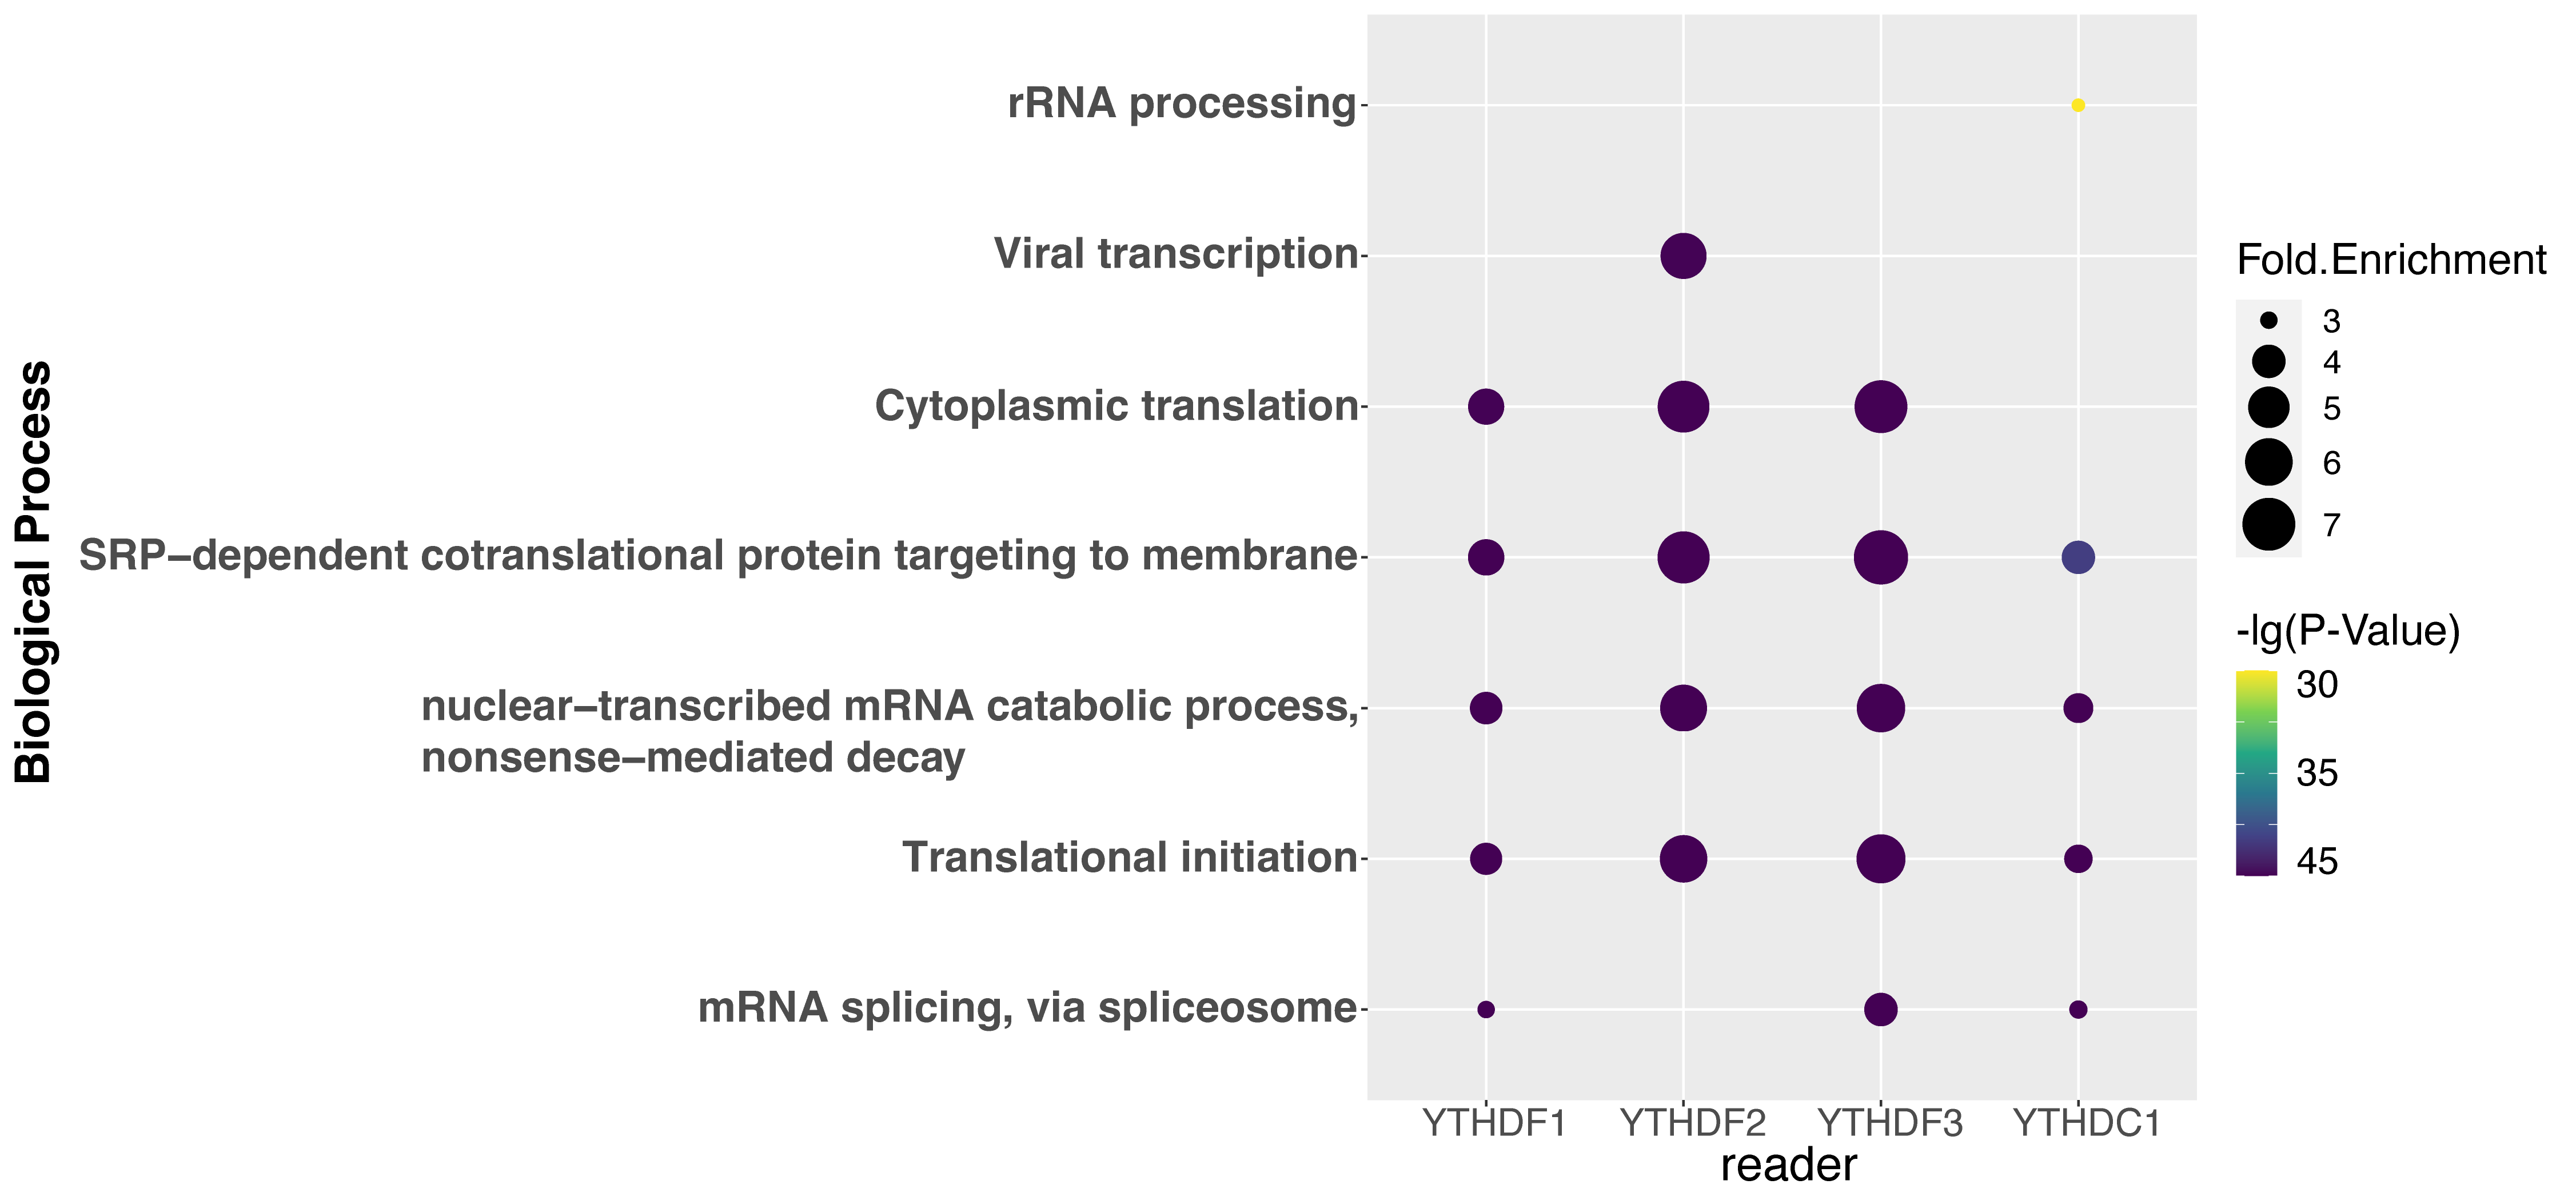 Fig. 5.
Gene ontology enrichment analysis of the regulator substrates. The top 5 GO terms of each regulator are shown.
In this study, we report a model based on SVM algorithm to predict the substrates of m1A regulators, including YTHDF1-3 and YTHDC1. Due to the bias in the poly-A selection process in the experiment, full transcript models and mature mRNA models were respectively made. Eight sequence-encoding methods and a series of genome-derived features were selected for the most effective feature combination. Our framework achieved high performance in both independent testing set and cross-sample testing set. Then we used different sequence-derived features subsets to perform the same procedure to build the predictor as comparisons. The result shows that our framework had higher performance than using the conventional sequence encoding method. Different machine learning algorithms were compared, and SVM was finally chosen for the model. Subsequently, motif analysis and gene enrichment analysis were conducted to explore the biological functions mediated by YTHDF1-3 and YTHDC1. The results of motif analysis show that some substrates of the regulators represent a “GUUCRA” motif, which is consistent with our knowledge. Our GO analysis results also provide additional evidence to the findings in previous wet-lab experiments studies.
In addition, there are some limitations to be improved in future studies. Firstly, it is found that the prediction performance on the cross-sample testing set is lower than that on the independent testing set. It may be due to the subtle inconsistency between different techniques or the different modification rates among various cell lines [62, 63]. Secondly, the performance can be further improved. Recent studies applying the deep learning algorithms showed effectiveness in site predictions [64, 65, 66]. Therefore, increasing the current genome features or applying the deep learning algorithm may contribute to better performance. Thirdly, due to different attention paid to various RBPs, there are not enough data for prediction for some of the RBPs. Currently, the wet-lab experiments only provide enough data for four readers, with the m1A methyltransferases (writers) and m1A demethylases (erasers) to be identified.
Conceptualization—SXW; methodology & software—JHY and MXL; writing—original draft preparation—JHY; writing—review and editing—HS; supervision & project administration—SXW; experiment and review—WJL, WJF, and XXX. All authors have read and agreed to the published version of the manuscript.
Not applicable.
Not applicable.
Scientific Research Foundation for Advanced Talents of Fujian Medical University (XRCZX2020012).
The authors declare no conflict of interest.
Supplementary material associated with this article can be found, in the online version, at https://doi.org/10.31083/j.fbl2709269.
References
Publisher’s Note: IMR Press stays neutral with regard to jurisdictional claims in published maps and institutional affiliations.