


1 Women's Hospital, Zhejiang University School of Medicine, 310006 Hangzhou, Zhejiang, China
2 Department of Gynecology, The first Affiliated Hospital of Wenzhou Medical University, 325000 Wenzhou, Zhejiang, China
3 Women's Reproductive Health Laboratory of Zhejiang Province, Women's Hospital, Zhejiang University School of Medicine, 310006 Hangzhou, Zhejiang, China
†These authors contributed equally.
Academic Editor: Graham Pawelec
Abstract
Background: Enhanced glycolysis occurs in most human cancer cells and is related to chemoresistance. However, detailed mechanisms remain vague. Methods: Using proteinomics analysis, we found that the glycolytic enzyme Phosphoglycerate mutase 1 (PGAM1) was highly expressed in the paclitaxel-resistant ovarian cancer cell line SKOV3-TR30, as compared to its parental cell line SKOV3. Cell Counting Kit-8 proliferation experiment, plasmids and siRNA transfection, pyruvic acid and lactic acid production detection, immunofluorescence staining of functional mitochondria and oxygen consumption rate and extracellular acidification rate measurement were uesd to assess the glycolytic metabolism and paclitaxel resistance in ovarian cancer cells. The expression and prognostic effect of PGAM1 in 180 ovarian cancer patients were analyzed. Results: SKOV3-TR30 cells display higher glycolytic flux and lower mitochondrial function than SKOV3 cells. Down-regulation of PGAM1 in SKOV3-TR30 cells resulted in decreased paclitaxel resistance. Up-regulation of PGAM1 in SKOV3 cells led to enhanced paclitaxel resistance. Analysis of the glycolytic flux revealed that PGAM1-mediated pyruvic acid or lactic acid production could modulate the capabilities of ovarian cancer cell resistance to paclitaxel. Our data also show high expression of PGAM1 as significantly correlated with reduced overall survival and reduced progression free survival in ovarian cancer patients. Conclusions: PGAM1 acts to promote paclitaxel resistance via pyruvic acid and/or lactate production in ovarian cancer cells. Inhibiting PGAM1 may provide a new approach to favorably alter paclitaxel resistance in ovarian cancer.
Keywords
- Phosphoglycerate mutase 1
- paclitaxel resistance
- glycolysis
- pyruvate
- ovarian cancer cell
Ovarian cancer is one of the most common malignancies and has the highest mortality of any female reproductive system disease [1, 2, 3, 4, 5]. A short-term complete response to first-line chemotherapy is achieved in nearly three quarters of patients with advanced disease. However, most patients relapse within two years and ultimately die of relapsed cancer displaying increased chemoresistance [1, 2, 3, 4, 5, 6]. Although abundant research has recently focused on new agents such as bevacizumab and Poly (adenosine diphosphate-ribose) polymerase (PARP) inhibitors [7, 8, 9], primary surgery followed by combined chemotherapy of paclitaxel and carboplatin remains the standard treatment strategy [10, 11]. Paclitaxel, as an anti-microtubule drug, has been recommended to be the first-line chemotherapy agent for ovarian cancer for more than two decades. However, overcoming paclitaxel resistance has become a long-term challenge to improve the prognosis of ovarian cancer patients.
Enhanced glycolysis occurs in most human cancer cells and is related to chemoresistance. In normal cells, glucose is catabolized into pyruvic acid, which then enters the tricarboxylic acid cycle for either oxidative phosphorylation or, less usually, to be anaerobically converted into lactic acid. In cancer cells, aerobic glycolysis is preferred regardless of oxygen concentration [12, 13]. With the enhanced glycolysis in cancer cells, more ATPs are generated. This is believed to be one of the mechanisms by which rapid growing cells withstand external stresses such as hypoxia and drug exposure. In this way, cancer cells exposed to drug treatments can escape extermination through a series of adaptive alterations, including those of the glycometabolism [14]. In leukemias, for example, cancer cells residing at higher oxygen tensions remain highly glycolytic in comparison to most of the surrounding normal tissue cells [15, 16]. Zhang et al. [17] also reported that glycometabolic adaptation could mediate drug resistance in leukemia cells. Here, to gain insight into the mechanisms by which paclitaxel resistance occurs in ovarian cancer, we have made use of proteomic analysis between the paclitaxel-resistant ovarian cancer cell line, SKOV3-TR30, and its parental cell line, SKOV3 focusing on the alterations linked to the glycolytic metabolism. In screening for differentially expressed proteins, Phosphoglycerate mutase 1 (PGAM1), a critical enzyme in coordinating glycolysis [18], was identified to be particularly highly expressed in the SKOV3-TR30 cell line [19].
PGAM1 reversibly catalyzes a unique step during glycolysis, controlling the metabolite levels of its substrate, 3-phosphoglycerate (3-PG), and product, 2-phosphoglycerate (2-PG), in the later stages of the glycolytic pathway [20, 21, 22]. PGAM1 has been reported to be highly expressed in lung cancer [23], polymorphic gliomas [24], and it is positively correlated with poorer prognosis of patients with gliomas [25]. Higher PGAM1 activity has also been observed in the hepatocellular carcinoma cell line, HepG2, as compared to the normal immortalized human hepatocyte cell line L02 [26]. It seems that PGAM1-mediated glycolysis may play a potent role in modulating cell growth and/or apoptosis.
In the present study, we show that paclitaxel resistance in ovarian cancers relies heavily on a PGAM1 mediated glycolytic metabolism. Overexpression of PGAM1 in SKOV3 ovarian cancer cells leads to increased glycolytic flux and increased paclitaxel resistance. Conversely, knockdown of PGAM1 in SKOV3-TR30 cells results in decreased glycolytic flux and decreased paclitaxel resistance. We also found that a high-expression of PGAM1 was correlated with poorer prognosis including PFS and OS, suggesting that PGAM1 might act to modulate the sensitivity of ovarian cancer patients to paclitaxel.
The human ovarian adenocarcinoma cell line SKOV3 was purchased from the American
Type Culture Collection (ATCC, Rockefeller, USA) and maintained in McCoy’s 5A medium
(Corning, 10-050-CV) supplemented with 10% fetal bovine serum (FBS) at 37 °C and
5% CO
Paclitaxel was purchased from the Bristol-Myers Squibb Company. Pyruvic acid and lactic acid were purchased from Merck (Merck, Darmstadt, Germany). The primary antibodies used for Western blotting were anti-PGAM1 (ab96622) and anti-beta-actin (Proteintech, 60008-1-Ig). The antibody anti-PGAM1 (ab2220) was used for immunohistochemistry. HRP-labeled secondary anti-mouse (Proteintech, SA00001-1) and anti-rabbit (Proteintech, SA00001-2) were purchased from Proteintech Group Inc (Wuhan, China).
SKOV3 and SKOV3-TR30 cells were harvested when grown to approximately 70% confluence. Whole cell lysate was extracted using an ultrasonic water bath for 5 min with a 5 min interval, repeated three times. Samples were centrifuged at 14000 g, 40 min, at 4 °C. The supernatant was then extracted. Protein samples were diluted to a concentration of 5 ug/uL. SKOV3 and SKOV3-TR30 protein were mixed in the ratio of 1:1. Took 50 ug samples SKOV3and SKOV3-TR30 individually and 1:1 mixture and adjusted PH between 8.0 and 9.0. The samples were labelled using DIGE dye Cy2, Cy3 or Cy5, each for 30 min in the dark. These three samples were mixed together and then loaded on a 13-cm PH 3-10NL nonlinear strip (Amersham, 17-6001-15). Isoelectric focusing (IEF) was performed on an IPGhpor unit (Ettan IPGphor Isoelectric focusing System, GE Amersham) at 20 °C overnight with the following voltage program: 12 h at 30 V, 1 h at 500 V, 1 h at 1000 V, 8 h at 8000 V and 4 h at 500 V. After IEF, a second dimension separation was performed on a 12.5% polyacrylamide gel using Hofer SE 600 (GE Amersham, Piscataway, NJ, USA). The IPG strips were reduced in an equilibration buffer and the incubated in the same buffer with 2.5% w/v iodoacetamide.
Labeled proteins were then scanned using a Typhoon scanner (UMax, Taiwan, China) at different wavelengths of 488 nm (cy2), 532 nm (cy3) and 633 nm (cy5).
All the procedures above were repeated for three times. Images were acquired and
analyzed using the DeCyder 2D V 6.5 software (GE Healthcare, Beijing, China) to obtain the
average ratio, and these were analysed for significant differences using an
unpaired Student’s t-test. Significant differences in protein spot
expression was defined as follows: (i) p
Differentially expressed spots were then excised from the gels. The proteins
were processed and digested following standard procedure. Protein candidates
combining peptide mass fingerprinting/tandem MS search were analyzed by the
MASCOT version 2.2 search engine against the International Protein Index (IPI)
human database (downloaded in Dec 10, 2010, 86702 sequences). The threshold of
expectation value utilized for protein identification in this study was
p-value
A total of 193 formalin-fixed paraffin-embedded tissue samples were obtained from patients diagnosed with ovarian adenocarcinomas including serous, mucinous, endometrioid and clear cell carcinomas from January 2002 to December 2009 from the Women’s Hospital, School of Medicine, Zhejiang University. All patients underwent primary surgery followed by paclitaxel-based chemotherapy. Telephone follow-ups were carried out yearly after the first operation. The deadline of the follow-up was December 2020. Clinical information was obtained from the medical records by two gynecological oncologists with the patients’ permission. A total of 13 patients were excluded because of a lack of complete data. The patients ranged in age from 23 to 89 years (median 50 years). The FIGO stage was reevaluated according to the FIGO staging 2014. Paclitaxel resistance was defined as patients with progressive disease during primary chemotherapy or suffering recurrence of disease within 6 months of completing primary chemotherapy. Paclitaxel-sensitivity was defined as patients suffering recurrence beyond 6 months, or patients without recurrence. Pathological diagnosis was reconfirmed by an expert pathologist for all 180 specimens. The study was approved by the Research Ethics Committee of Women’s Hospital, School of Medicine, Zhejiang University. Anti-PGAM1 antibody (ab2220, 1:150) was used for the IHC following the protocol provided by Abcam. The scoring method and analysis of IHC were performed.
The pCMV5 (+)-PGAM1 plasmid was constructed as follows. A full length of PGAM1 mRNA (NM_002620.1) was synthesized and cloned into a pCMV5 vector by Genscript. A pCMV5 (+) vector was then designated as negative control. Cells were grown to 70–80% confluence before plasmid transfection. The ratio of X-tremeGENE HP DNA Transfection Reagent (Roche, 06300236001): DNA was 2:1. 2 ug DNA was used for each well in 6-well plates. The targeting site for PGAM1 was 5′-CAAGAACUUGAAGCCUAUCAA-3′. PGAM1 siRNA was synthesized by GenePharma (Shanghai, China). SiRNA was transfected into cells with lipofectamine 2000 Reagent (Invitrogen, 11668019). Cells were grown to 70–80% confluence before siRNA transfection according to the manufacturer’s instructions. Plasmid and siRNA were both transfected for 12 h and the culture medium was then replaced by new complete medium and left for another 12 h.
For cell viability detection for paclitaxel-sensitivity, cells were seeded at 4000 cells per well in 96-well plates after transfection with plasmid or siRNA. SKOV3 and SKOV3-TR30 cells were then exposed to paclitaxel at various final concentrations (0, 5, 10, 15, 20, 25, 30 nM for SKOV3 and 0, 50, 100, 150, 200, 250, 300 nM for SKOV3-TR30) for 48 or 72 h. Each concentration was set for 5 multiple wells and each cell viability detection was conducted in triplicate. Cell viability was then detected using a Cell Counting Kit-8 (Dojindo, Kumamoto, Japan) using a Varioskan Flash microplate reader (Thermo Fisher Scientific, Waltham, USA) for spectral analysis at a wavelength of 450 nm.
Cells were seeded at 4000 cells per well in 96-well plates and cultured for the appropriate time. The culture medium was then piped out to detect pyruvic acid (using pyruvic acid assay kit, sigma-aldrich, MAK071) or lactic acid (using lactic acid assay kit, sigma-aldrich, Saint Louis, USA) concentrations according to the manufacturer’s instructions. Cell viability was detected using a Cell Counting Kit-8 (CCK-8) as previously mentioned. The increased pyruvic acid concentration was divided by the absorbance of CCK-8. Each well was set for 5 multiple wells and separate experiments were done for three replicates and the P value was then calculated.
SKOV3 and SKOV3-TR30 cells were seeded at 5
SKOV3 and SKOV3-TR30 cells were seeded in XF24 culture plates (Seahorse
Bioscience, USA) at a density of 5
p-trifluoromethoxyphenylhydrazone (FCCP) was supplemented into “B” well. Then
mixture of rotenone and antimycin A (Rot/AA, 0.5
Proteins were extracted from the whole-cell lysate. Appropriate amounts of proteins were loaded on 12% SDS-PAGE and transferred to 0.22 um PVDF membranes. The membranes were blocked with 5% Bovine Serum Albumin in TBST and incubated in primary antibodies at 4 °C overnight, and then in secondary antibodies for 1 hour at room temperature. The bands were detected using an EZ-ECL kit (BI biological industries, 20-500-120) and scanned using an Imagequant LAS400 mini imager (GE Healthcare, Beijing, China).
All statistics were conducted using the SPSS version 20.0 statistical software package (IBM Corp, Armonk, NY, USA). The differences in proteomic analysis between SKOV3 and SKOV3-TR30 were estimated using a Student’s t-test. The correlations between the IHC of PGAM1 protein and clinicopathologic parameters were evaluated using chi-square tests. PFS and OS curves were determined using the Kaplan-Meier method and differences in survival were compared using a log-rank test. The influence of PGAM1 expression on survival was assessed using the Cox regression analysis. Cell viability was evaluated using a Student’s t-test. A p-value of less than 0.05 (two-tailed was considered as statistically significant.
We had previously established a SKOV3-TR30 cell line that had acquired
paclitaxel resistance with a 27-fold increase over its parental SKOV3, a
paclitaxel-sensitive cell line. We then carried out a MALDI-TOF-TOF following 2-D
DIGE (two-dimensional fluorescence difference in gel electrophoresis)
quantitative proteomic analysis between the two cell lines. In this mining we
identified 57 differentially expressed protein gel spots between SKOV3/SKOV3-TR30
with ratios of more than 1.5-fold. 49 of these were then successfully
authenticated. Fig. 1A shows a partial image of one of the three replicate gels.
DeCyder software analysis showed that the SKOV3/SKOV3-TR30 ratios ranged from
–7.93-fold to 9.42-fold. Gel spots were then picked and digested by tryptan.
Protein identification was executed by MALDI-MS. 356 among 558 identified
proteins were differentially expressed (fold change
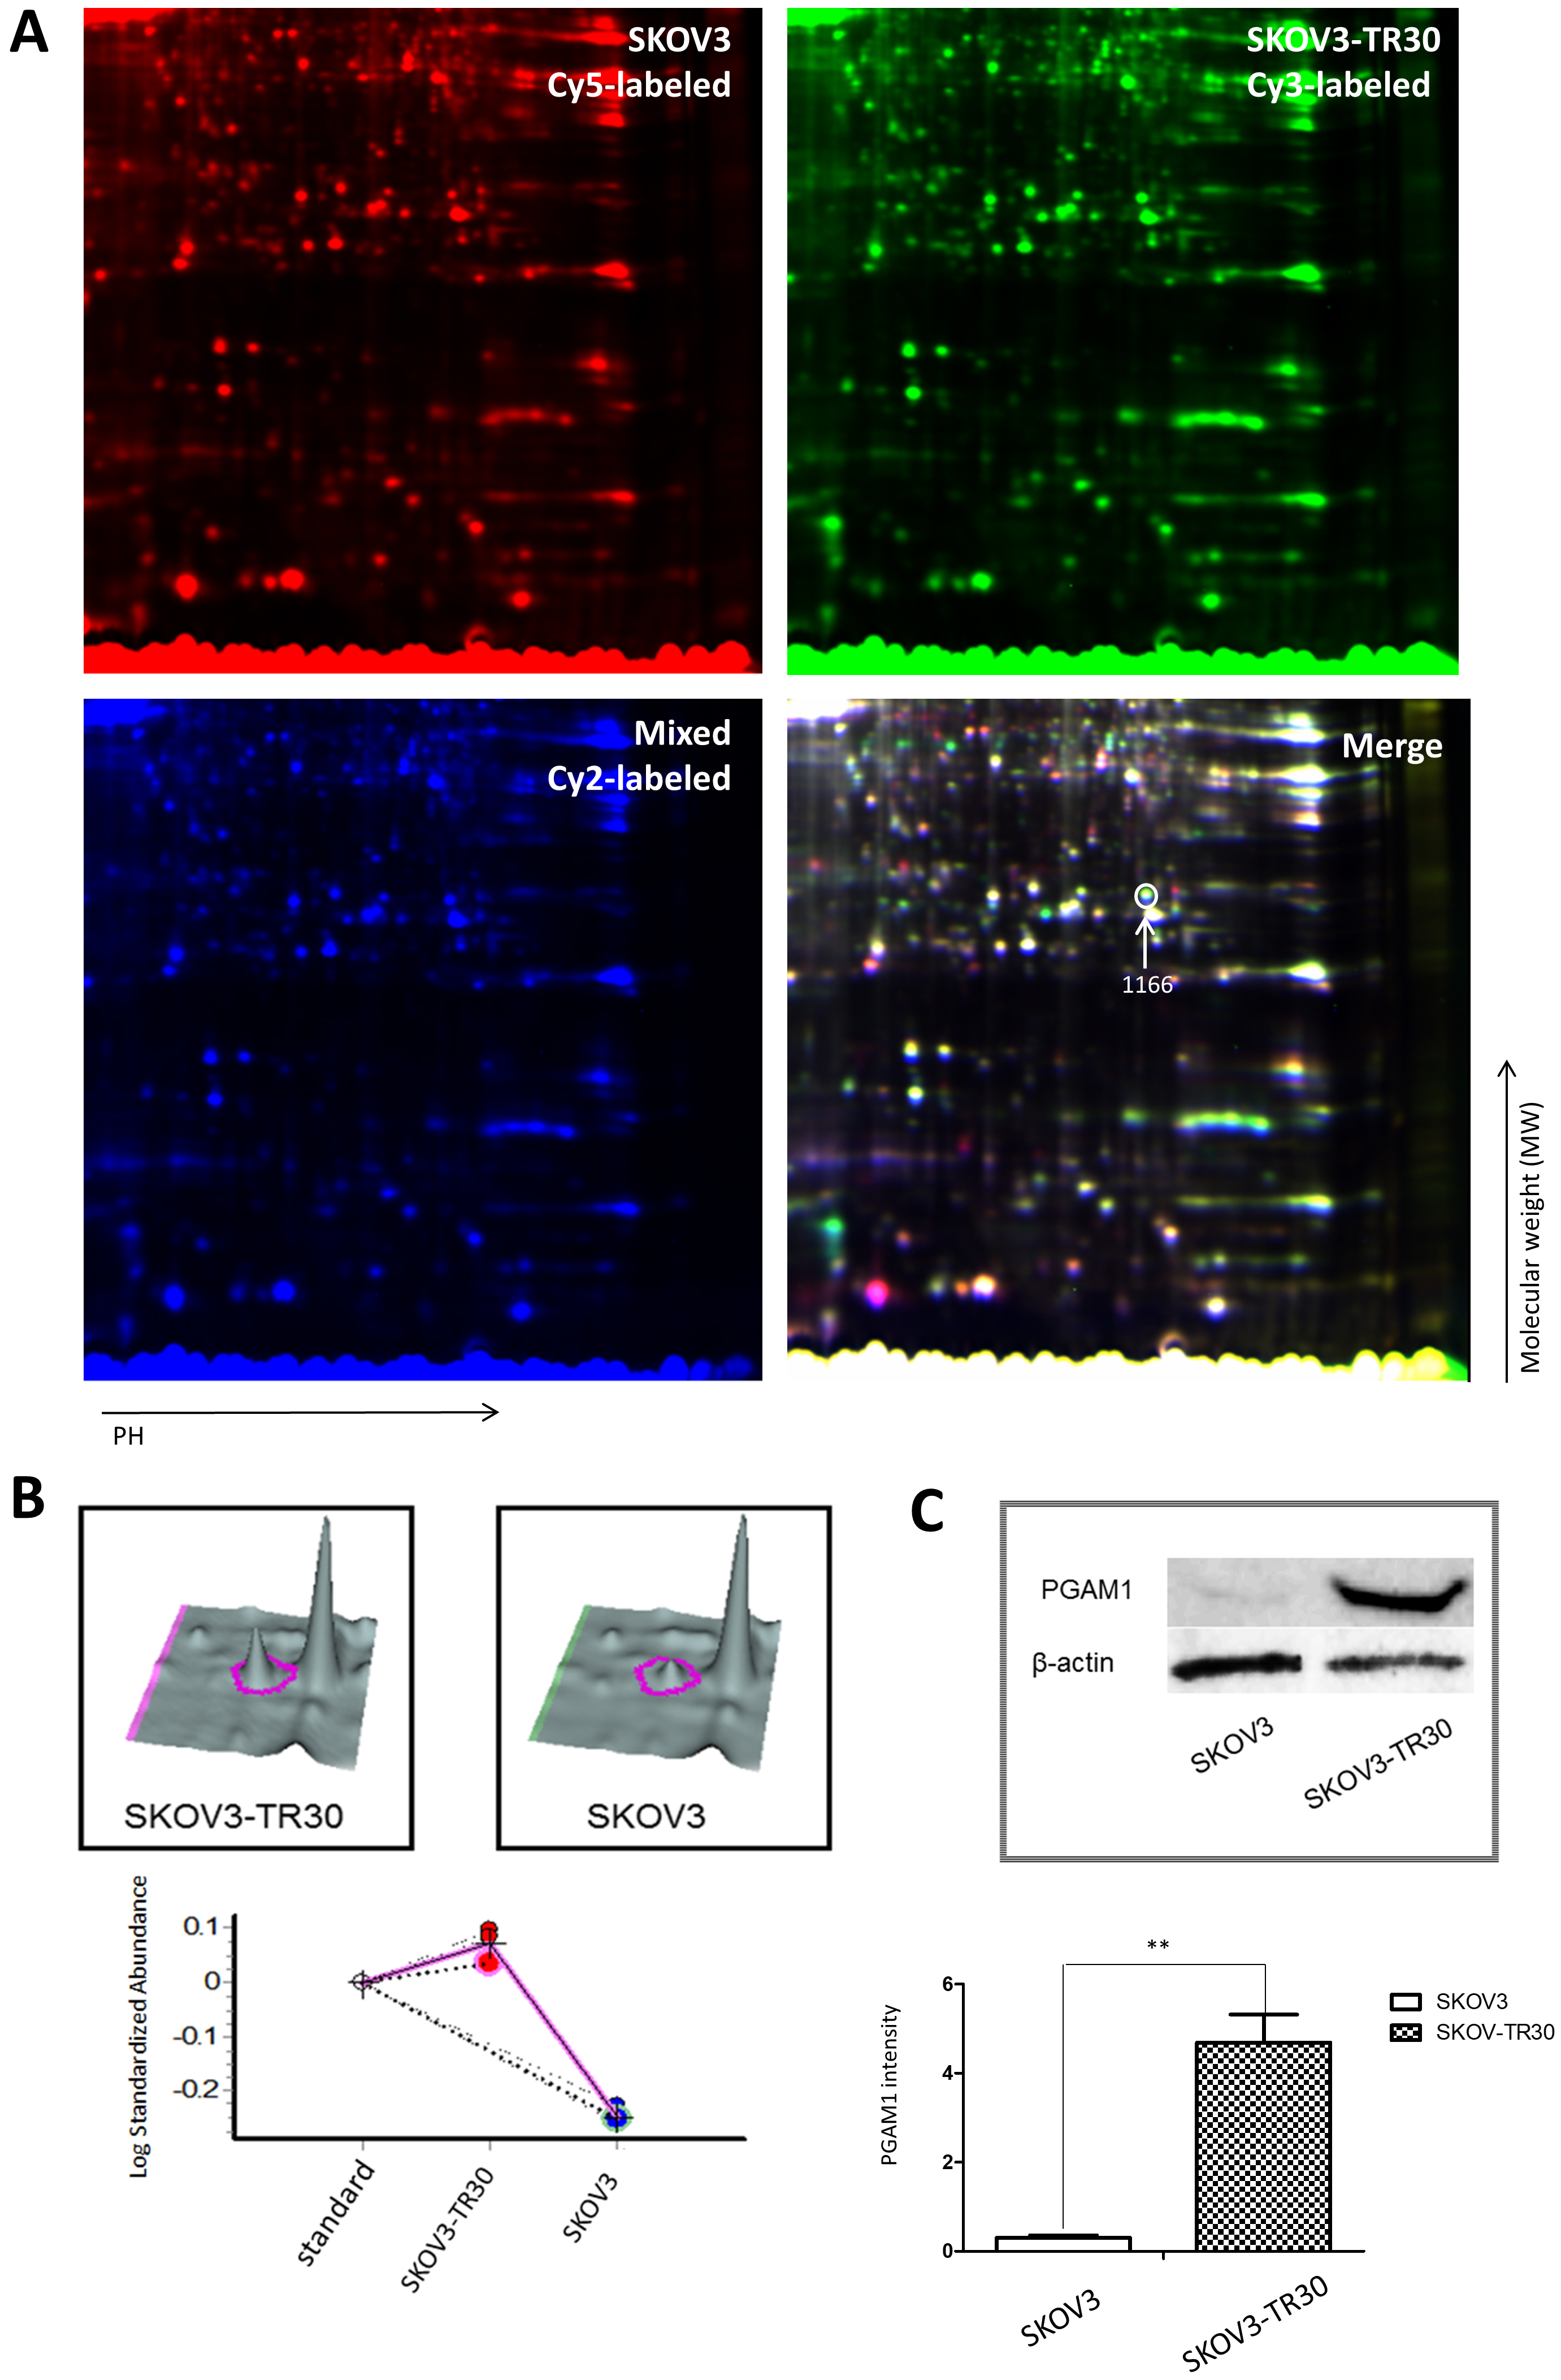 Fig. 1.
Two-dimensional fluorescence differences in gel electrophoresis (DIGE), quantitative proteomic analysis and validation of PGAM1 expression by western blotting in SKOV3 and SKOV3-TR30 cells. (A) Partial image of one in three replicate gels of SKOV3 and SKOV3-TR30 whole cell lysates. The SKOV3 sample was labeled with cy5 dye and the SKOV3-TR30 sample was labeled with cy3 dye while the mixture of the two cell lines was labeled with cy2 dye. The merged image was then analyzed using DeCyder software. The #1166 gel spot with an arrow was one of the 49 differently expressed protein spots using MALDI-TOF-TOF. (B) Three-dimensional volumetric models of the gel spot #1166 where PGAM1 was located. Expression levels were then measured using DeCycler analysis and calculated with standardized log abundance. (C) Western blotting of PGAM1 expression in SKOV3 and SKOV3-TR30 whole cell lysate.
PGAM1 coordinates biosynthesis and glycolysis, in which many glycolytic
intermediates including pyruvic acid and lactic acid are produced and are used as
precursors for the anabolic pathway [19, 20]. We examined the glycolytic flux in
SKOV3 and SKOV3-TR30 cells by measuring the intermediate product, pyruvic acid,
and the end-product, lactic acid. Cells cultured for 24, 48, or 72 h were
subjected to analysis and cell viability was simultaneously detected. Results
showed that both pyruvic acid production at 24, 48 and 72 h (each p
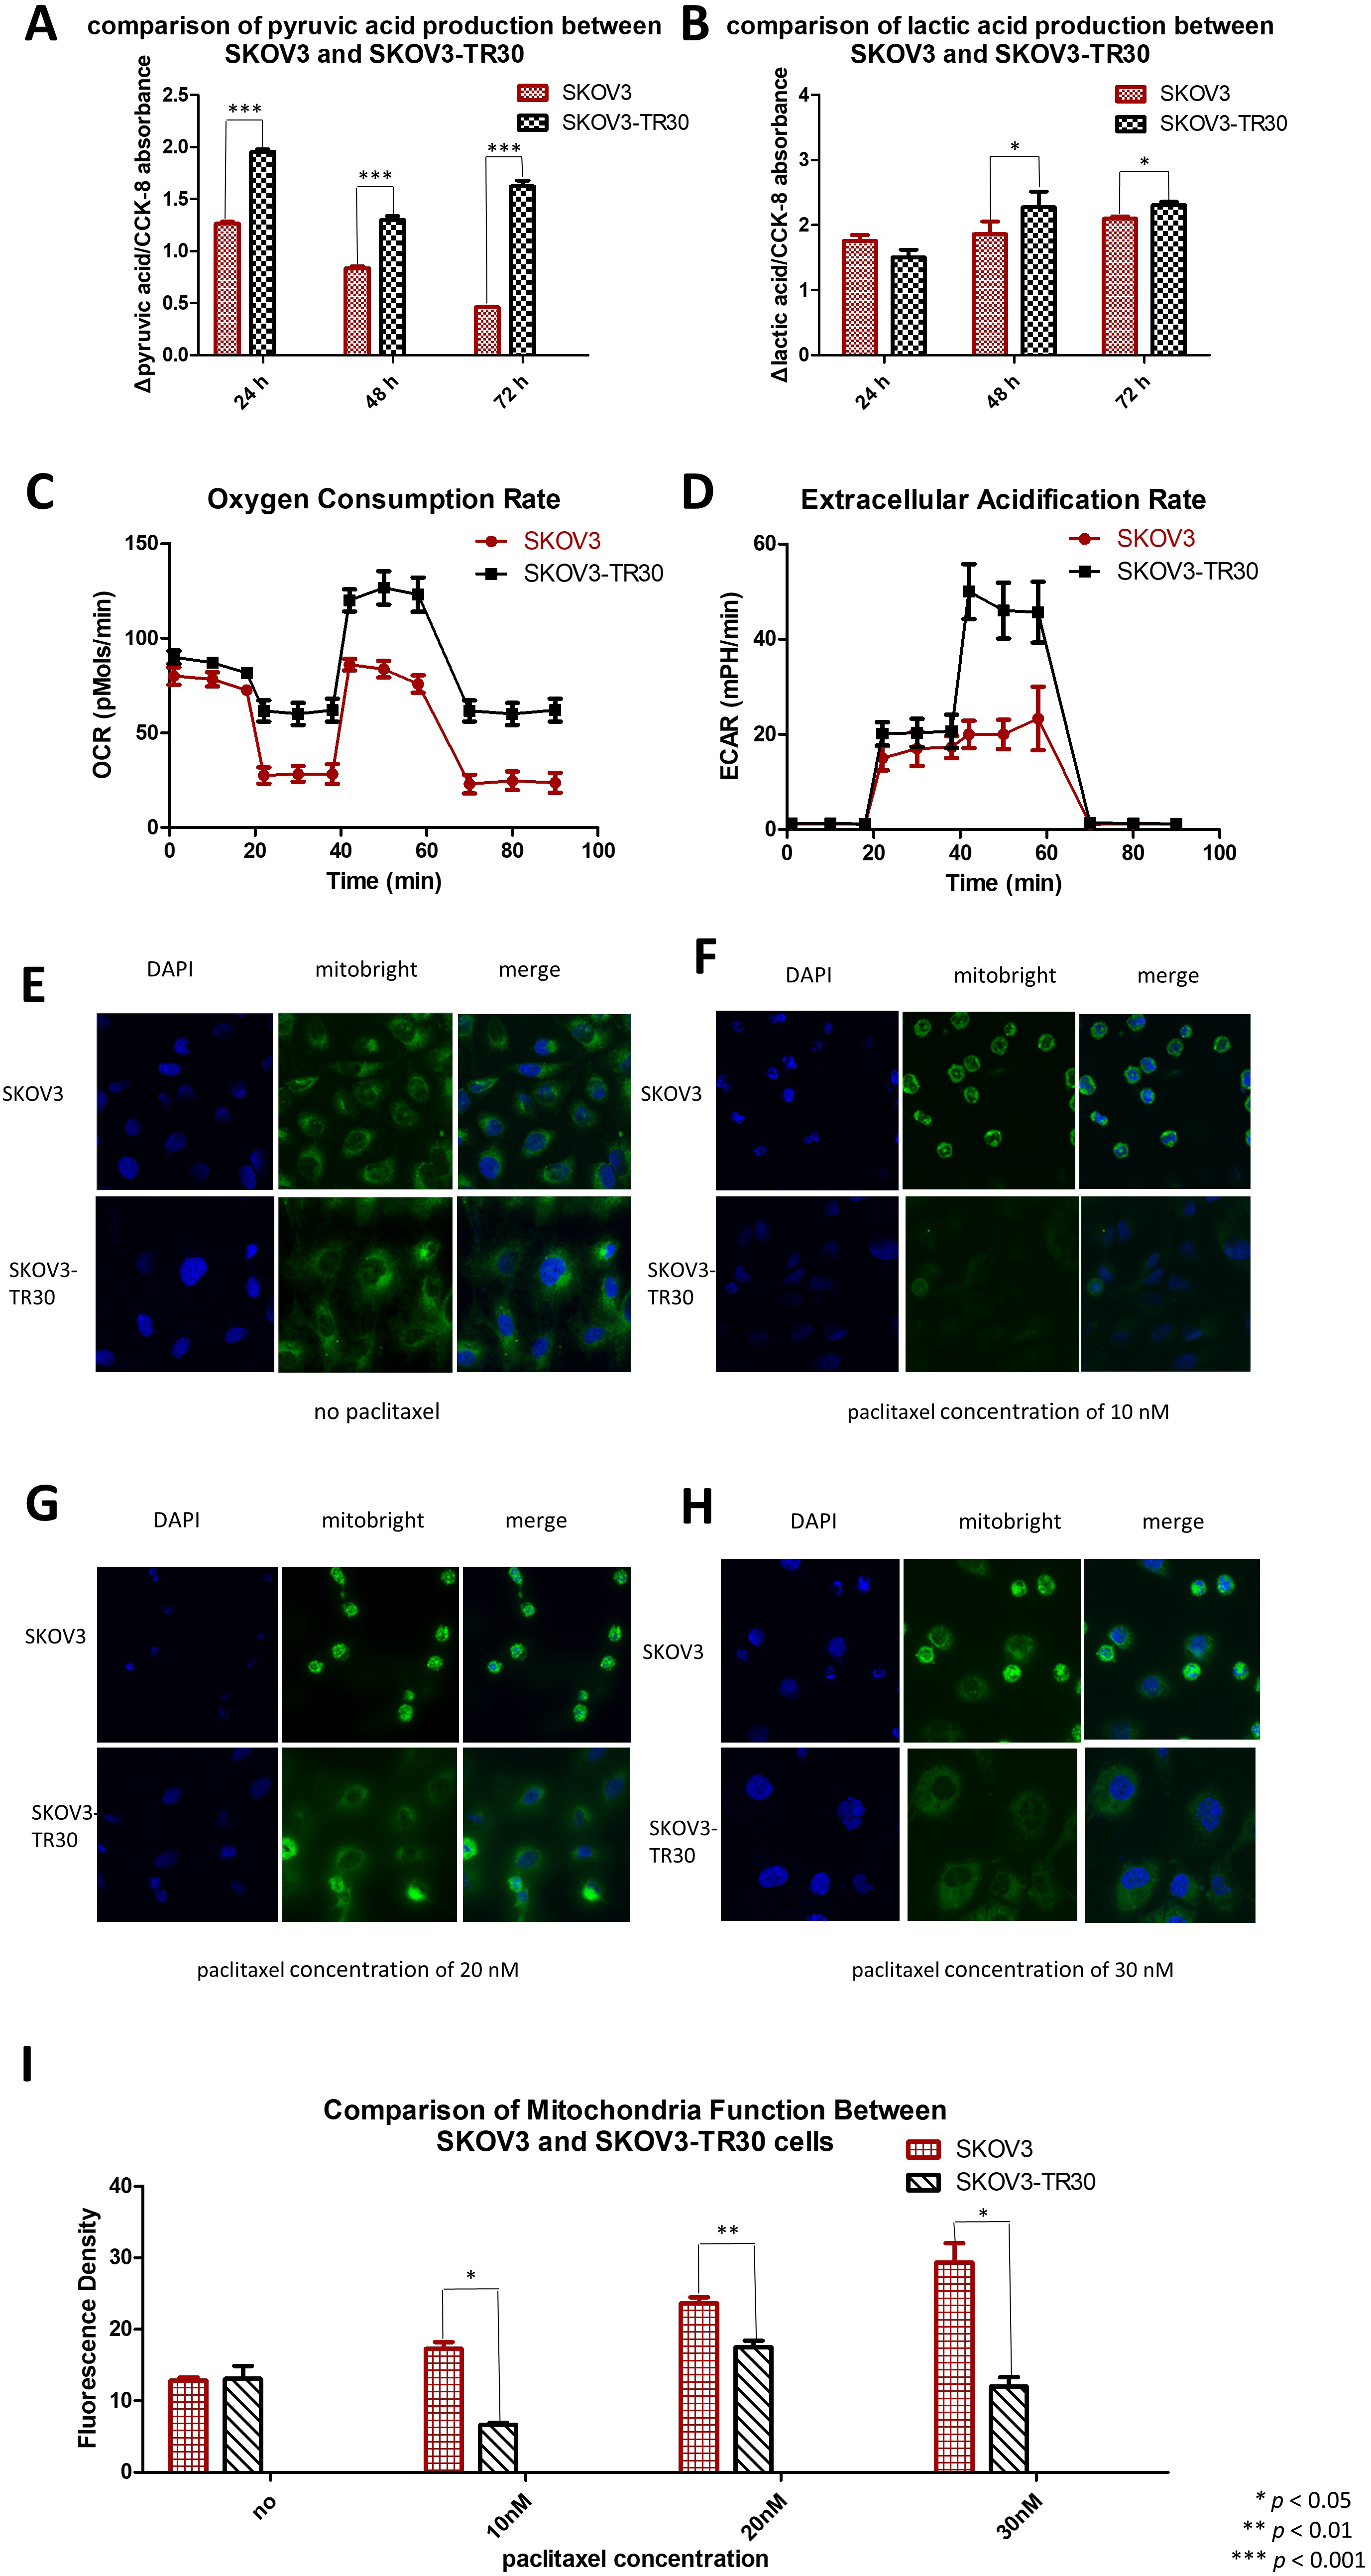 Fig. 2.
SKOV3-TR30 cells manifest larger glycolytic flux than SKOV3 cells. Comparison of pyruvic acid (A) and lactic acid (B) production between SKOV3 and SKOV3-TR30 cells when cultured for 24 h, 48 h and 72 h. Oxygen consumption rate (C) and extracellular acidification rate (D) are both higher in SKOV-T30 cells than in SKOV3. SKOV3 and SKOV3-TR30 cells were cultured without any paclitaxel in the culture medium (E), or exposed to 10 nM (F), 20 nM (G) and 30 nM (H) paclitaxel for 24 h. Representative images were photographed using a confocal fluorescence microscope after immunofluorescence staining. (I) The fluorescence density was measured using the software Image J and was significantly increased under the exposure of 10 nM paclitaxel (p = 0.012), 20 nM paclitaxel (p = 0.002) and 30 nM paclitaxel (p = 0.038). DAPI: staining for the nuclei. Mitobright: staining for mitochondria.
We also analyzed alterations in mitochondrial function in SKOV3 and SKOV3-TR30 cells under the stress of paclitaxel exposure. In the absence of paclitaxel treatment, Mitobright Green staining revealed no differences in mitochondrial signaling between SKOV3 and SKOV3-TR30 (Fig. 2E). However, under paclitaxel stimulations of concentrations of 10 nM (Fig. 2F), 20 nM (Fig. 2G) and 30 nM (Fig. 2H), the signal was remarkably enhanced in SKOV3 cells, but remained unchanged in SKOV3-TR30 cells. These observations indicate that without paclitaxel treatment mitochondrial function remains similar between the two cell lines. Conversely, under paclitaxel exposure, SKOV3 cells showed a stronger mitochondrial function than SKOV3-TR30 cells (Fig. 2I), suggesting enhanced glycolysis rather than oxidative phosphorylation.
Having revealed a larger glycolytic flux in SKOV3-TR30 cells, we next examined whether paclitaxel sensitivity in ovarian cancer cells is dependent on the changes in pyruvic acid and lactic acid. Based on human serum pyruvic acid concentration with a normal range at 0.03~0.1 mmol/L and lactic acid below 2.4 mmol/L, we manipulated the parental SKOV3 cells by adding differing amounts of pyruvic acid at concentrations of 0.01, 0.05, 0.1, 0.2, 0.5 and 1.0 mmol/L (Fig. 3A) or lactic acid at concentrations of 0.1, 1, 10, 20, 100 and 200 mmol/L (Fig. 3E) in the culture medium for 24, 48 and 72 h. Firstly, we determined the toxicity of additional pyruvic acid and lactic acid using a CCK-8 assay. The results showed that no toxicity had resulted from any of the concentrations of pyruvic acid or from the lower concentrations of lactic acid, but had occurred in the case of a high concentration (200 mmol/L) of lactic acid.
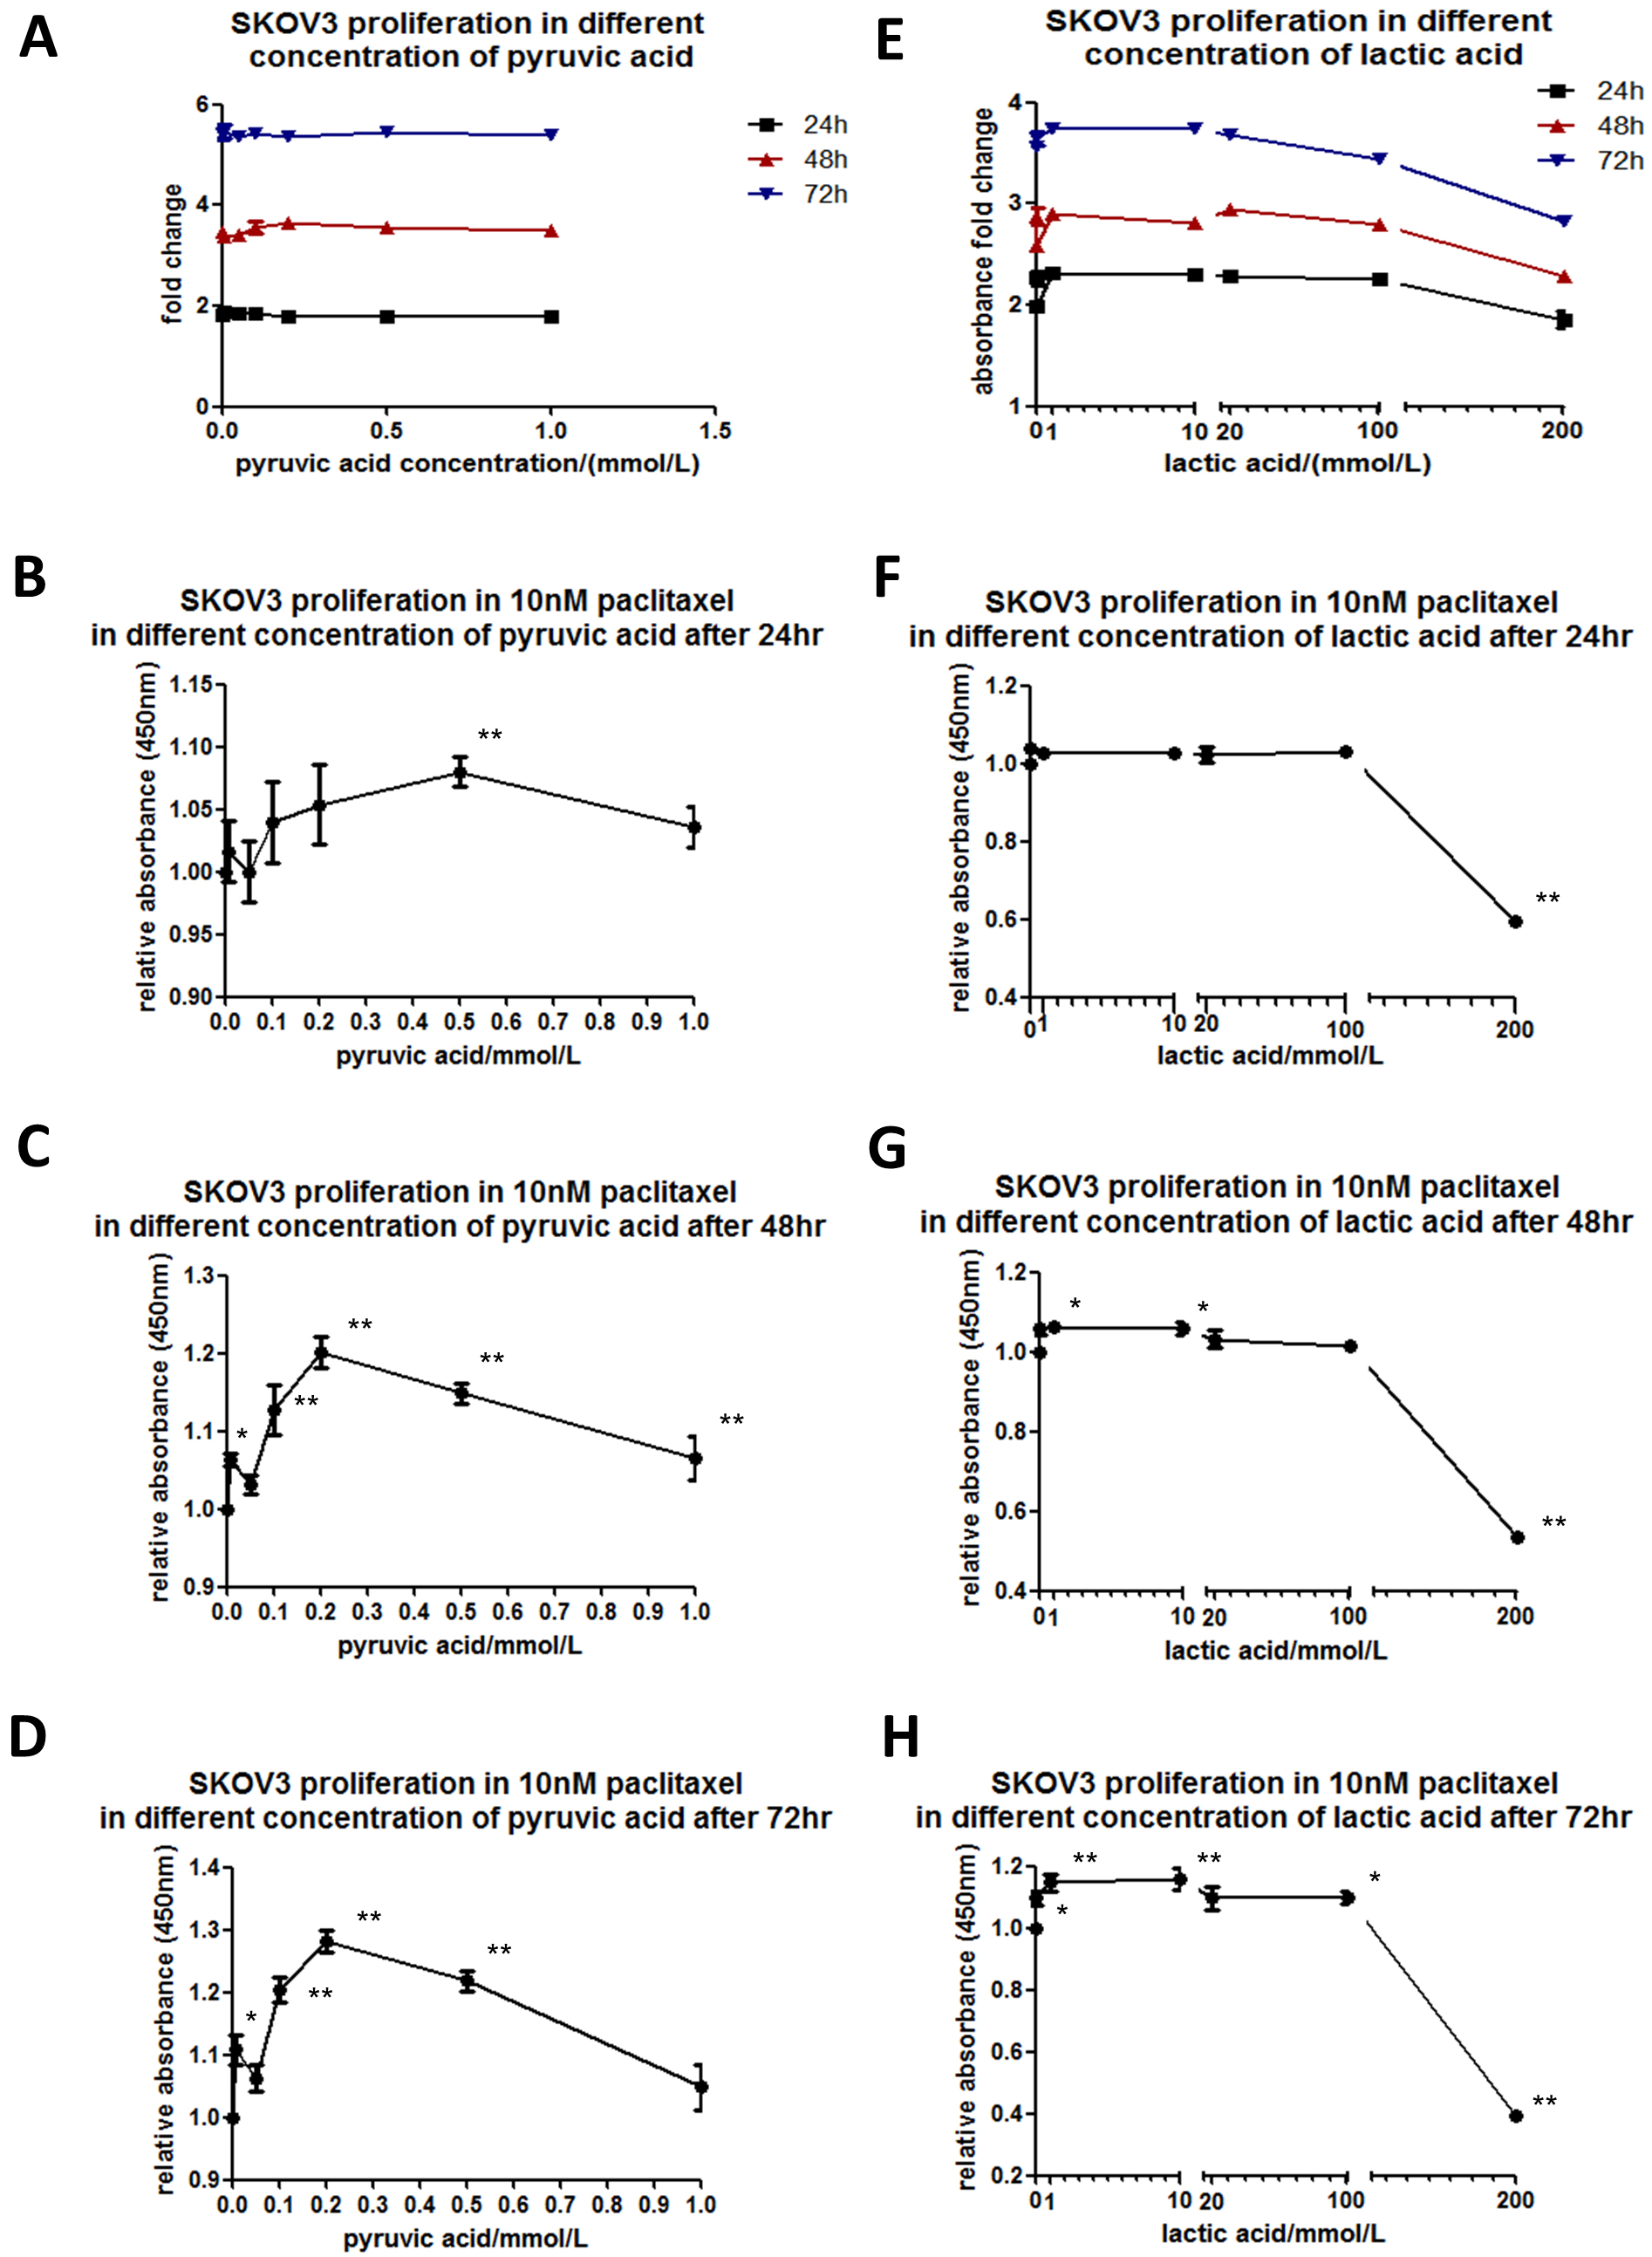 Fig. 3.
Paclitaxel sensitivity depends on pyruvic acid or lactic acid in SKOV3 cells. SKOV3 cells were cultured while adding different concentrations of pyruvic acid (A) at 0.01, 0.05, 0.1, 0.2, 0.5 or 1.0 mmol/L or lactic acid (E) at concentrations of 0.1, 1, 10, 20, 100 or 200 mmol/L in the culture medium for 24, 48 or 72 h. Cell viability was determined using a CCK-8 assay. The line chart was plotted according to the absorbance fold change compared to the value where no pyruvic acid was added. SKOV3 cells were cultured in the culture medium with 10 nM paclitaxel. Indicated concentrations of pyruvic acid (B–D) or lactic acid (F–H) were added to observe the relative absorbance by CCK-8 kit compared to the corresponding values where no pyruvic acid or lactic acid was added, when cultured for 24, 48 or 72 h.
We applied the pyruvic acid or lactic acid of the appropriate concentrations for SKOV3 cells treated with 10 nM paclitaxel. The relative absorbances in CCK-8 kit were analyzed under indicated concentrations of pyruvic acid (Fig. 3B–D) or lactic acid (Fig. 3F–H). Interestingly, in the culture with pyruvic acid at a concentration of 0.5 mmol/L for 24 h, the cells showed a significant decrease in paclitaxel sensitivity. With prolonged culture time for 48 or 72 h, significant differences were shown at all concentrations of pyruvic acid, with a peak at 0.2 mmol/L. The cells cultured with lactic acid at concentrations of 0.1, 1, 10, 20 or 100 mmol/L for 24 h showed no differences in paclitaxel sensitivity. However, with prolonged culture time for 48 or 72 h, significant differences were shown at all the above concentrations of lactic acid. 200 mmol/L lactic acid showed toxicity for all cells that had been treated for 24 h or beyond. These results indicate that paclitaxel sensitivity in SKOV3 cells is dependent on both the dosage and treatment time of pyruvic acid or lactic acid.
Given the higher expression of PGAM1 and elevated glycolytic flux in the SKOV3-TR30 cells than that in the parental SKOV3 cells, we considered whether paclitaxel sensitivity is regulated by PGAM1 mediated glycolysis. Using Western blot, we firstly examined PGAM1 expression patterns in the parental SKOV3 cells exposed to different concentrations of paclitaxel. PGAM1 expression was up-regulated after an increased dosage of paclitaxel, with a peak at 20 nM in SKOV3 cells (Fig. 4A). Beyond a paclitaxel concentration of 20 nM, the cells quickly died. We secondly analyzed if the alteration of the glycolysis flux influences PGAM1 expression in the parental SKOV3 cells. Different amounts of pyruvic acid were added into the culture medium and PGAM1 expression was again measured using Western blot. Fig. 4B shows that PGAM1 was up-regulated upon additional pyruvic acid and achieved a peak at a concentration of 0.1 mmol/L in SKOV3 cells. We then up-regulated PGAM1 by expressing the pCMV5 (+)-PGAM1 plasmid in the SKOV3 cells (Fig. 4C), where increased pyruvic acid production (Fig. 4D) and decreased paclitaxel sensitivity was detected (Fig. 4E,F). We attenuated PGAM1 in SKOV3-TR30 cells by shRNA and subsequently evaluated the effects on glycolytic flux and paclitaxel sensitivity. As Fig. 4G shows, down-regulation of PGAM1 in SKOV3-TR30 cells resulted in significantly declined pyruvic acid production (Fig. 4H) and paclitaxel resistance at 48 or 72 h (Fig. 4J). Fig. 5 depicts PGAM1 modulating paclitaxel resistance in ovarian cancer cells via pyruvic acid production.
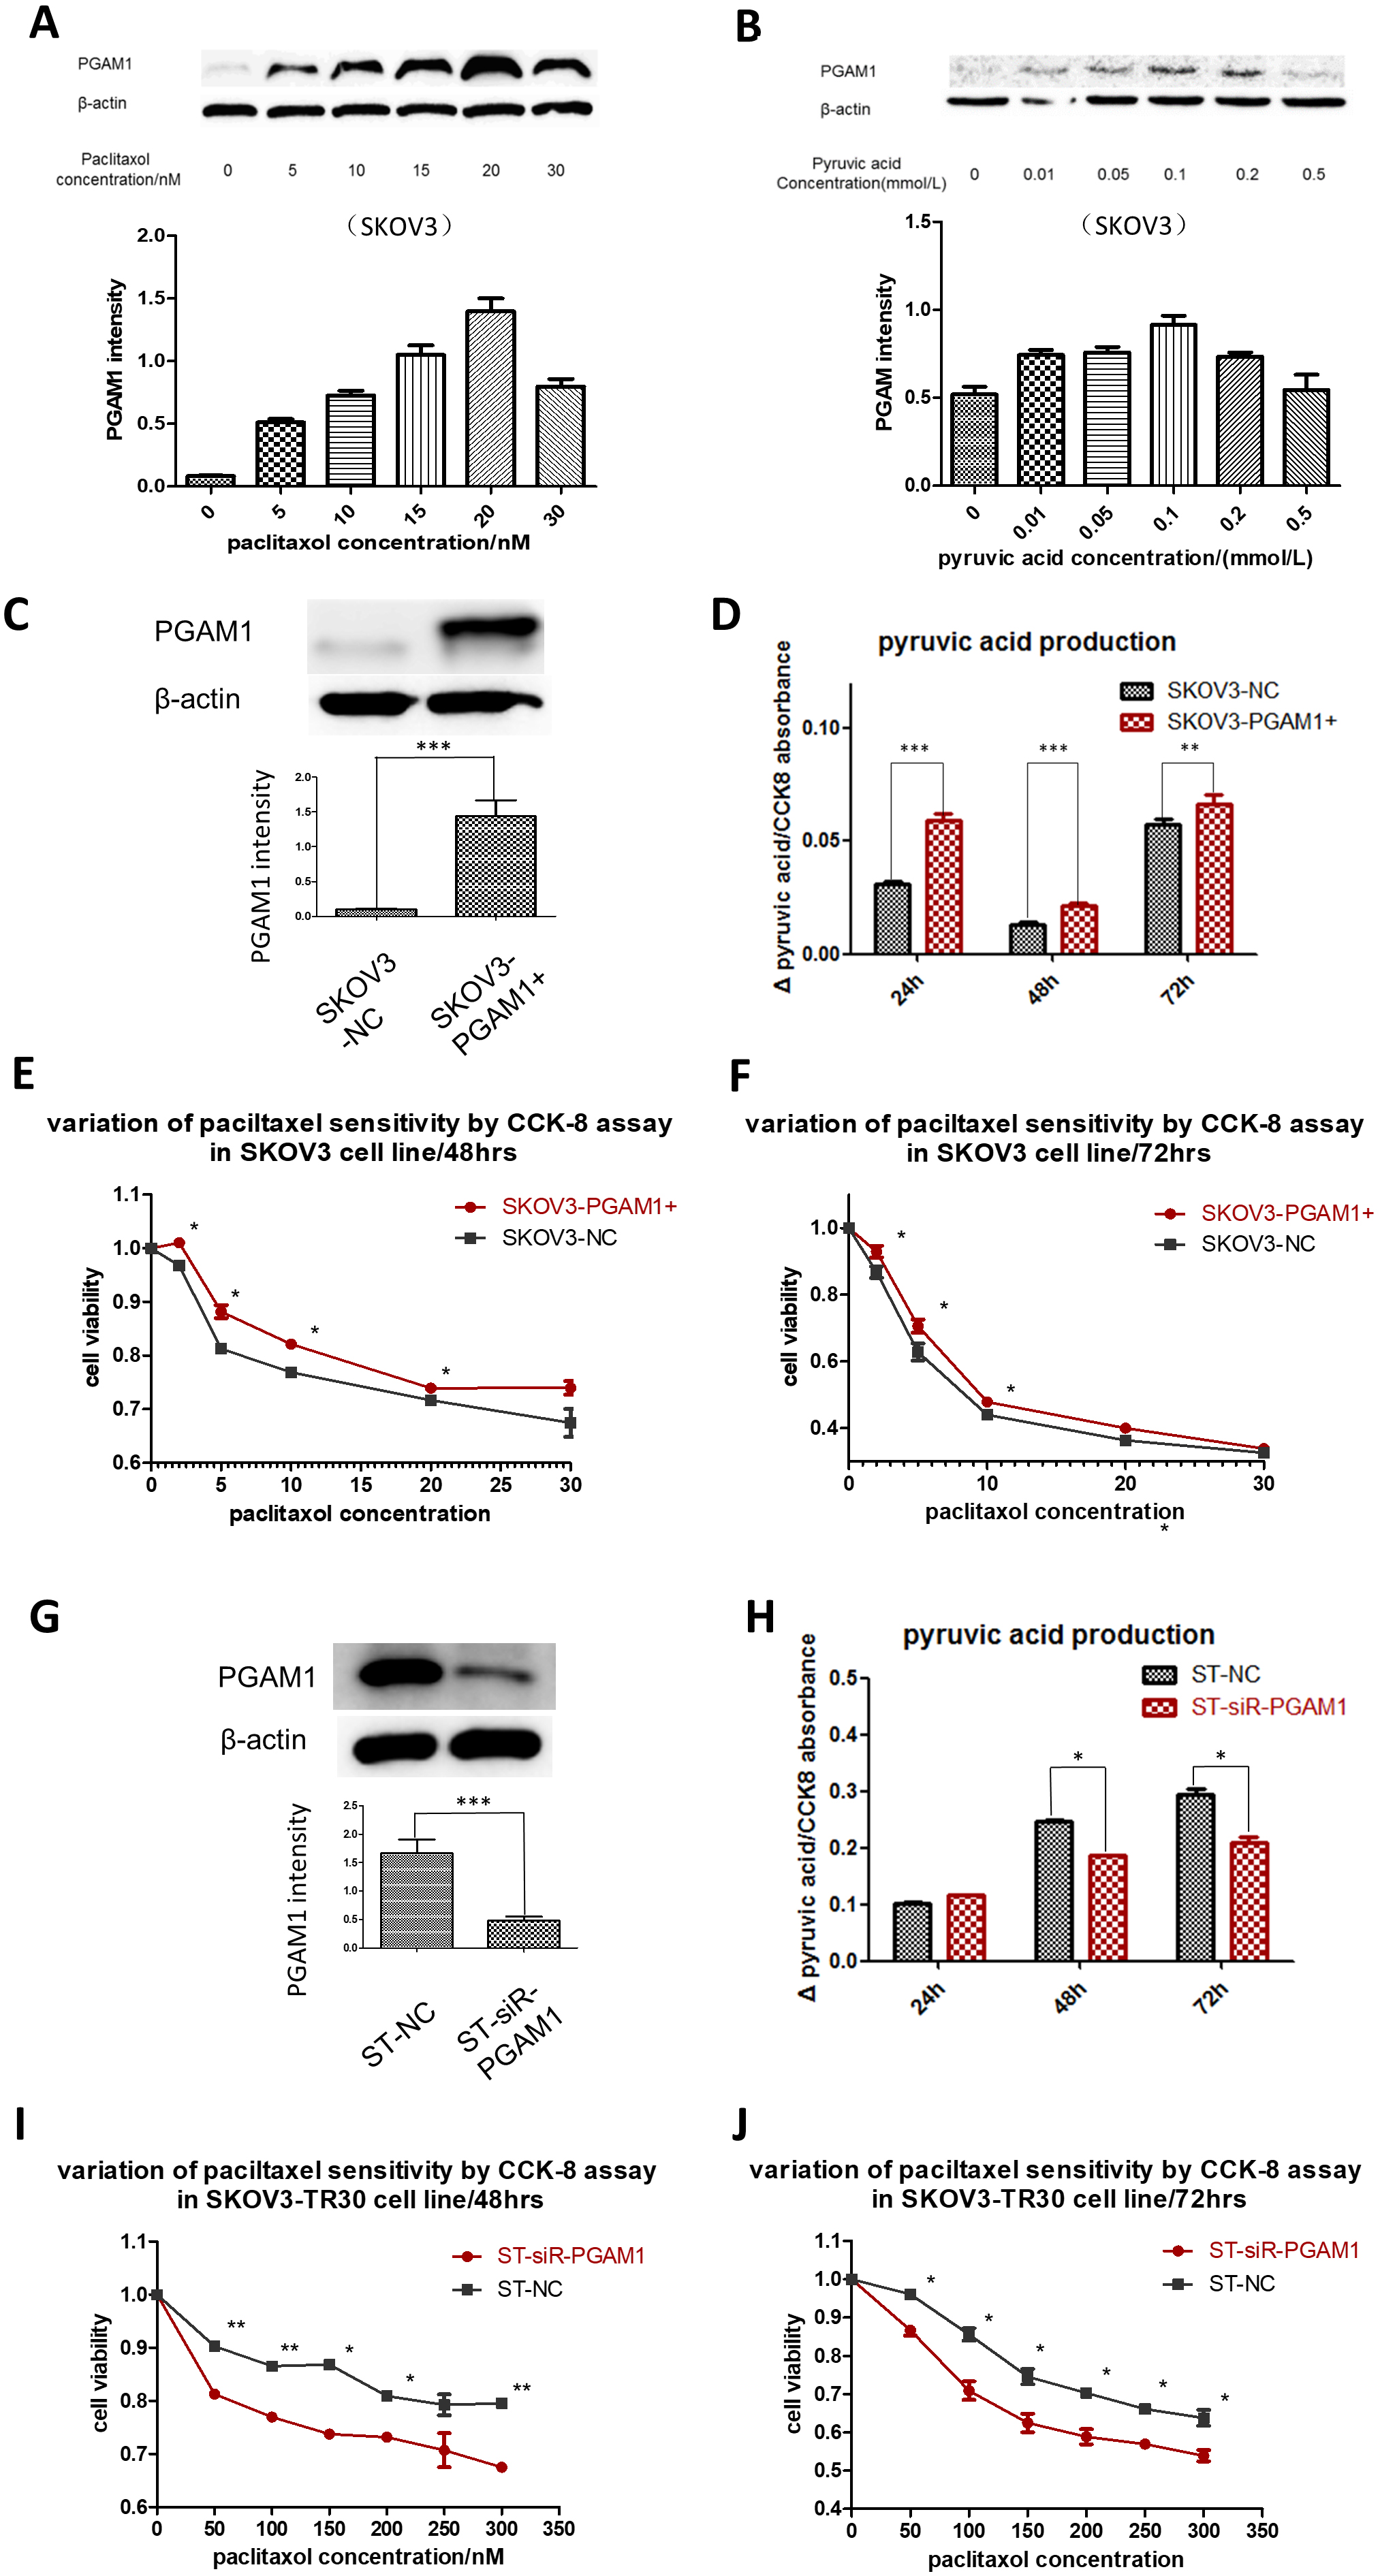 Fig. 4.
PGAM1 modulates paclitaxel sensitivity via pyruvic acid
production in ovarian cancer cells. (A) Cells were treated with different
concentrations of paclitaxel. Western blotting was performed to detect PGAM1
variation. PGAM1 expression could be induced by a low dose of paclitaxel
stimulation in the paclitaxel-sensitive cell lines SKOV3. (B) PGAM1 could also be
induced when increasing the pyruvic acid concentrations of the culture medium in
the SKOV3 cell line. (C) PGAM1 was over-expressed by plasmids in the
paclitaxel-sensitive cell line SKOV3. Significant differences of pyruvic acid
production were found between cultures at 24, 48 and 72 h, as shown in the
histogram below (D). The line charts showed paclitaxel sensitivity under the same
procedure (E) and (F). (G) Down-regulation of PGAM1 by siRNA in SKOV3-TR30 (ST)
cells resulted in decreased paclitaxel resistance. Western blot indicating siRNA
transfection efficiency. (H) Histogram showing the differences of pyruvic acid
production in the culture medium when cells were cultured for 24, 48 and 72 h
between SKOV3 and SKOV3-TR30 cells. There was no significant difference in
pyruvic acid production when culturing for 24 h, but notable differences appeared
when culturing for 48 and 72 h. Cell viability was determined using a CCK-8 kit.
The line charts below show paclitaxel sensitivity when cells were treated with
the indicated paclitaxel concentration for 48 (I) and 72 h (J). Results are shown
as means
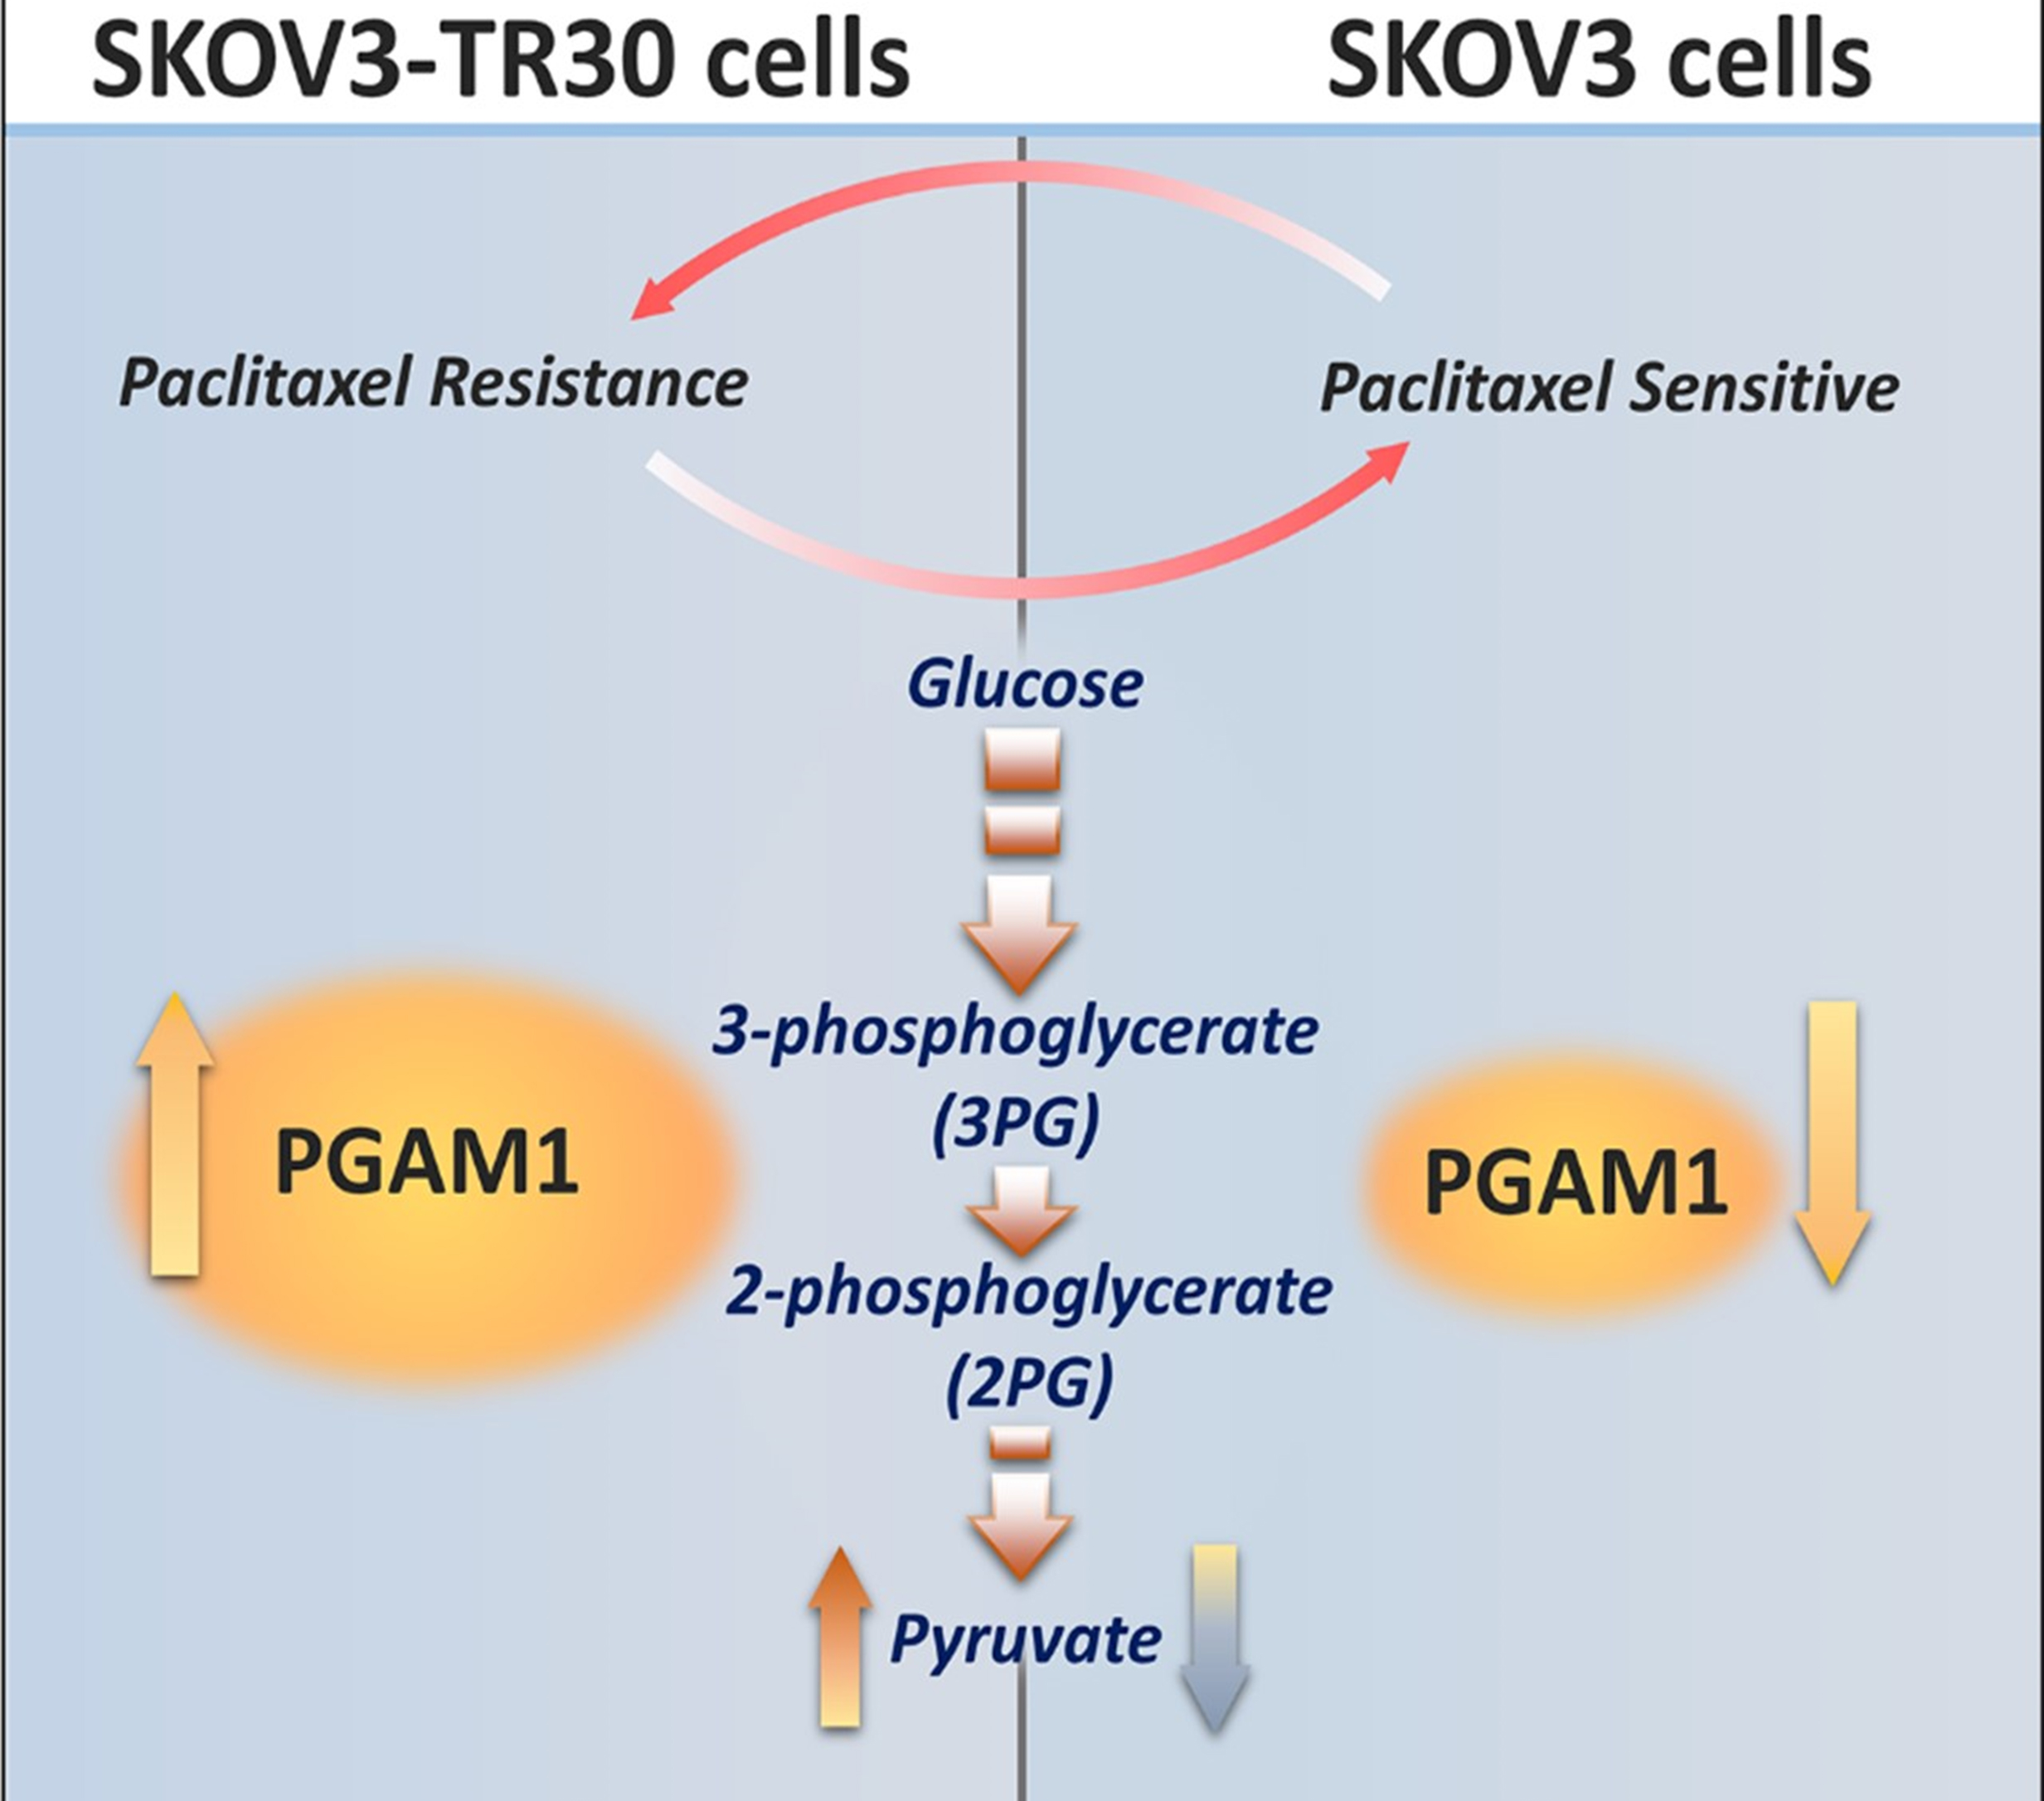 Fig. 5.
Diagram depicting PGAM1 modulating paclitaxel resistance in ovarian cancer cells via pyruvic acid production.
We then explored another cell line A2780/A2780/TAX and found that the primary expression of PGAM1 between A2780 and A2780/TAX was not as remarkable as that between SKOV3 and SKOV3-TR30. When A2780 cells were subjected to an increased dosage of paclitaxel with a peak around 15–20 nM. Whilst knockdown of PGAM1 in A2780/TAX cells resulted in decreased paclitaxel resistance, overexpression of PGAM1 in A2780 could not lead to increased paclitaxel resistance. The reason for this may be that the expression of PGAM1 in both A2780 and A2780/TAX cell lines is already high, therefore the overexpression of PGAM1 could not further alter the level of paclitaxel resistance (Supplementary Fig. 1).
We analyzed the expression of PGAM1 protein by immunohistochemical (IHC)
staining in 180 primary epithelial ovarian cancer tissues obtained from ovarian
cancer patients obtained from the Women’s Hospital, School of Medicine Zhejiang
University. The PGAM1 protein was detected in the cytoplasm of ovarian cancer
cells (Fig. 6A). Significant differences in PGAM1 high-expression was noted
between paclitaxel-sensitive and paclitaxel-resistant ovarian cancer tissues
(p = 0.003, Table 1), with a percentage of 44.36% (59/133) in
paclitaxel-sensitive tissues and a percentage of 70.73% (29/41) in
paclitaxel-resistant ovarian cancer tissues. Univariate regression analysis
indicated that PGAM1 high-expression was strongly correlated with a larger volume
of ascitic fluid (p = 0.010) and suboptimal primary surgery (p
| Variable | N | PGAM1 expression | p value | ||
| Low | High | ||||
| Age (years) | |||||
| 79 | 36 | 43 | 0.293 | ||
| 101 | 54 | 47 | |||
| FIGO stage | |||||
| I/II | 41 | 25 | 16 | 0.101 | |
| III/IV | 138 | 64 | 74 | ||
| missing | 1 | ||||
| Tumor grade | |||||
| Low grade | 58 | 30 | 28 | 0.748 | |
| High grade | 116 | 57 | 59 | ||
| missing | 6 | ||||
| Ascitic fluid volume (mL) | |||||
| 106 | 62 | 44 | 0.010* | ||
| 72 | 28 | 44 | |||
| missing | 2 | ||||
| Serum CA125 (U/mL) | |||||
| 87 | 47 | 40 | 0.328 | ||
| 90 | 42 | 48 | |||
| missing | 3 | ||||
| Primary surgery | |||||
| Optimal | 131 | 76 | 55 | ||
| Suboptimal | 49 | 14 | 35 | ||
| Chemosensitivity | |||||
| Sensitive | 133 | 74 | 59 | 0.003** | |
| Resistant | 41 | 12 | 29 | ||
| missing | 6 | ||||
| *p | |||||
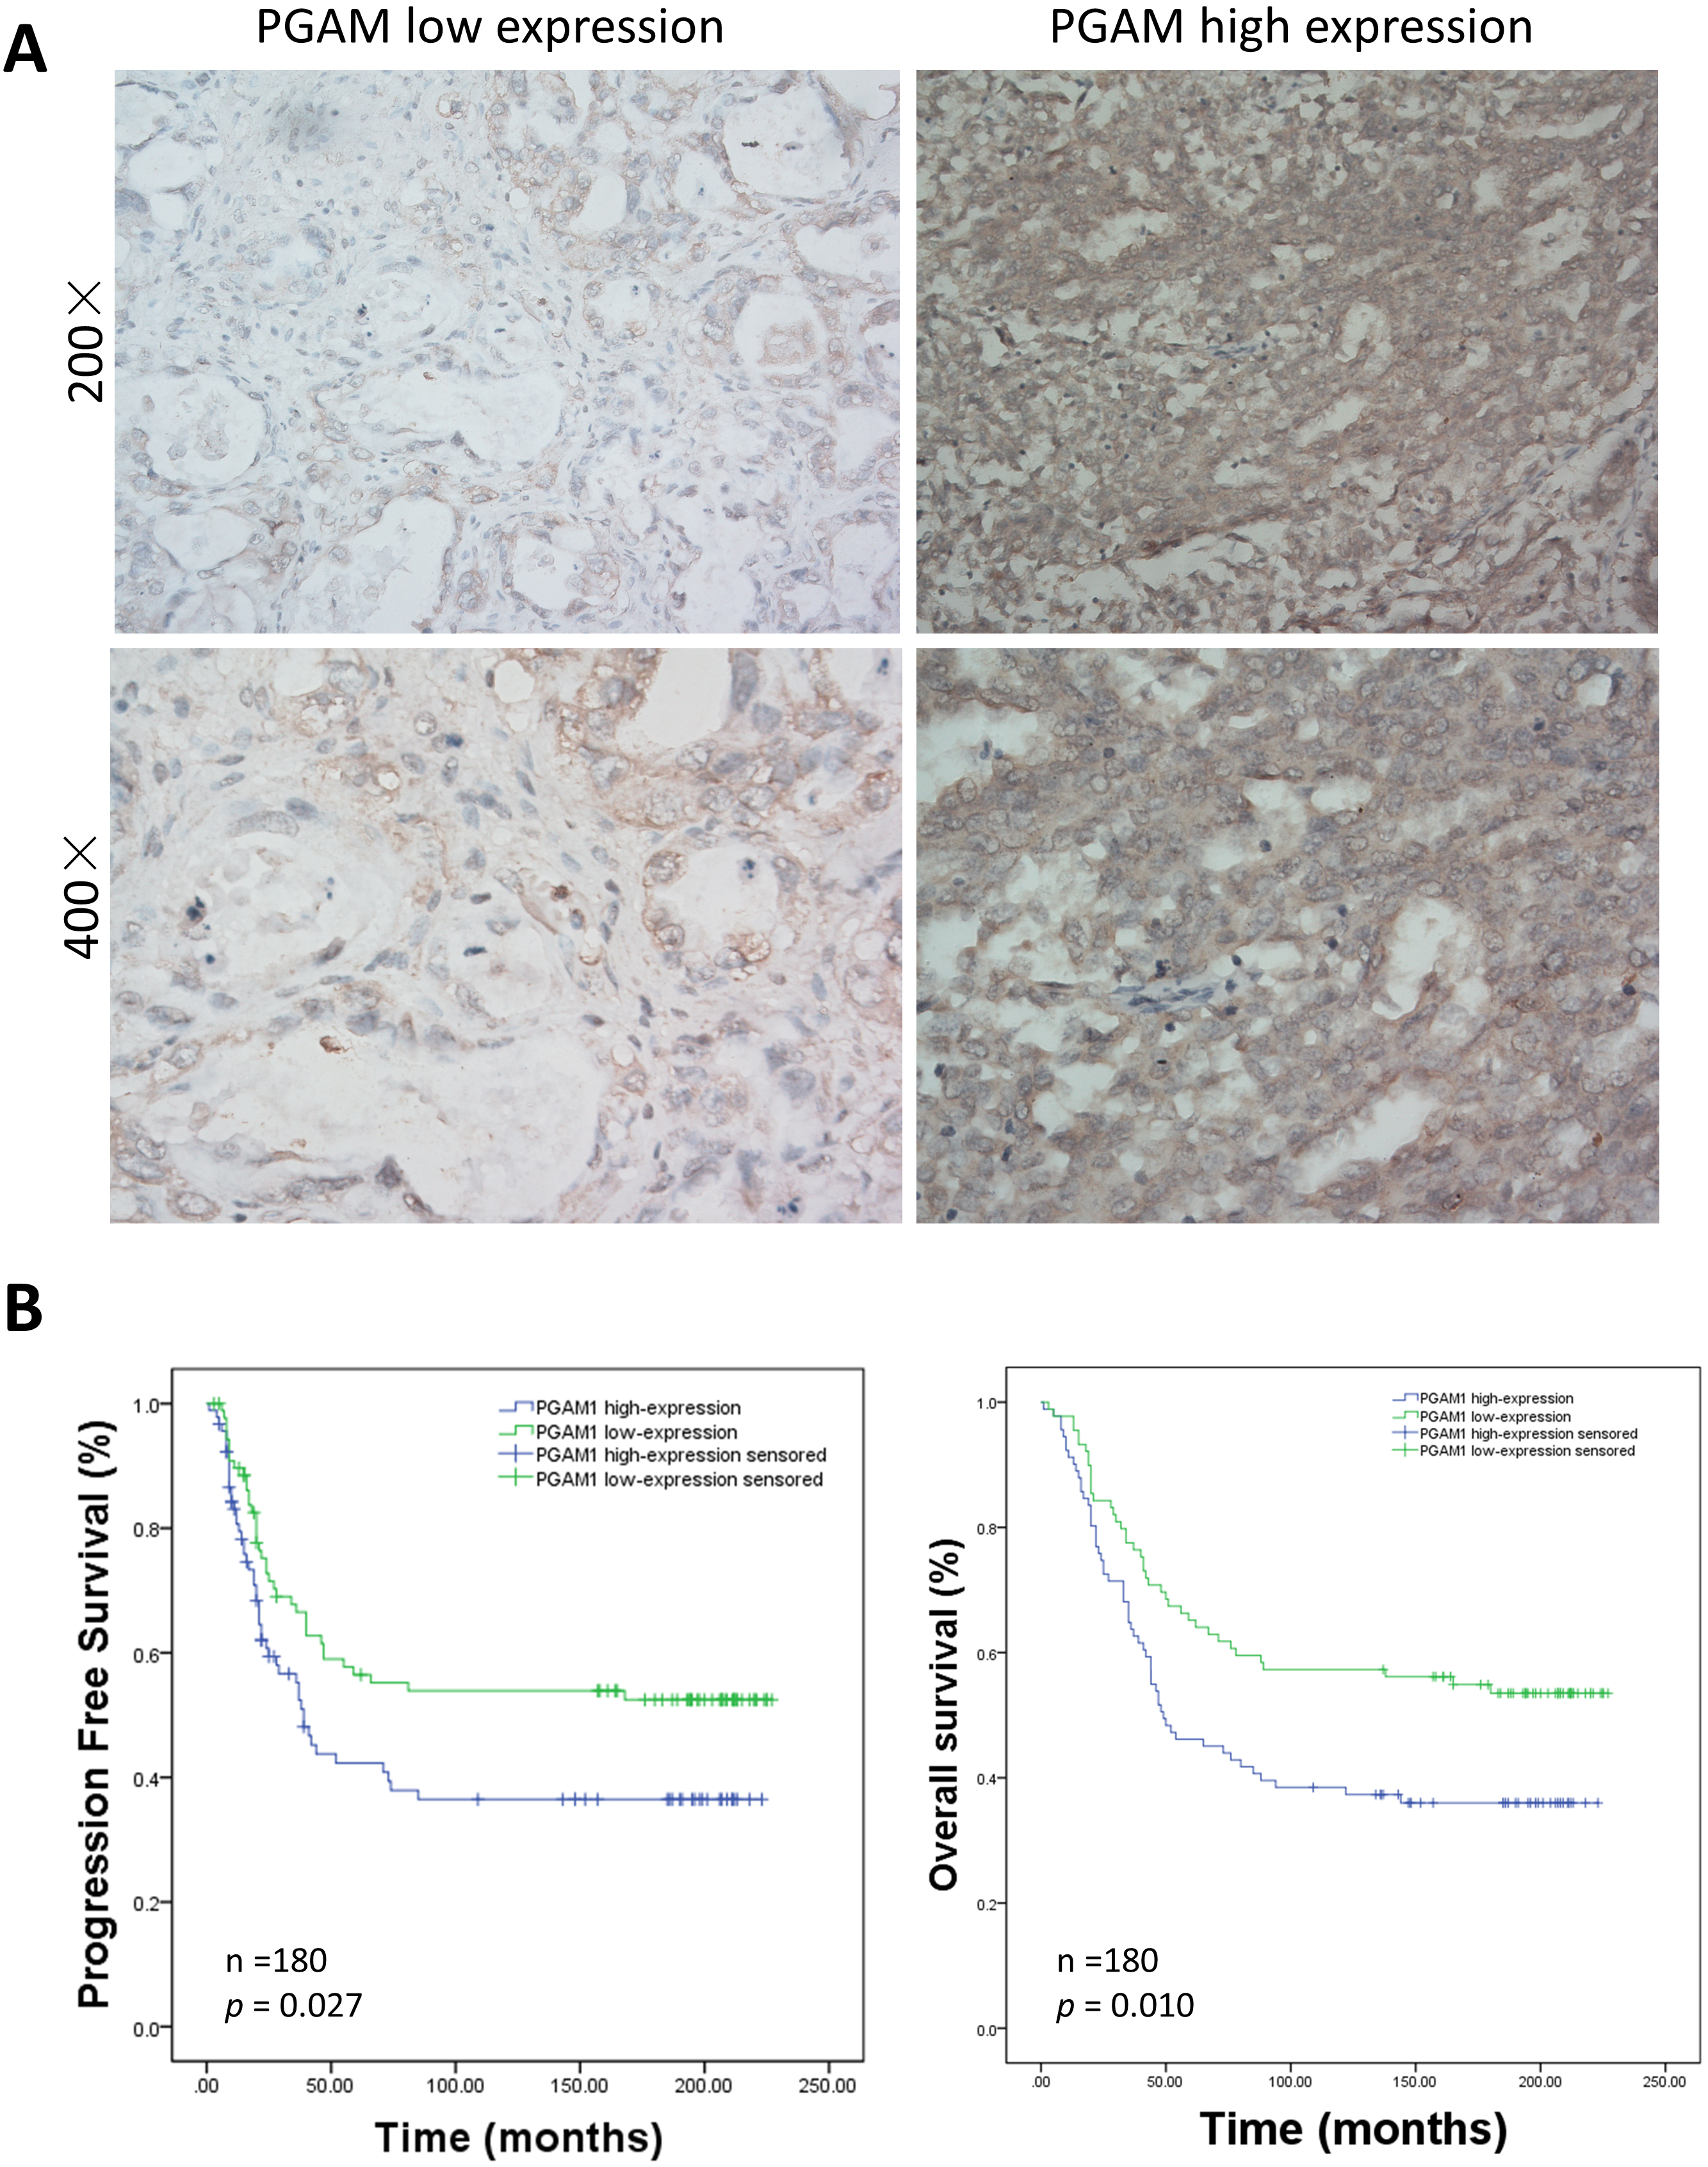 Fig. 6.
Relationship between immunohistochemical staining of PGAM1 expression and patient survival. (A) Representative PGAM1 staining of paraffin-embedded block from 180 ovarian cancer patients. (B) Analysis of PGAM1 expression in the prognostic value of patients with ovarian cancer using Kaplan-Meier survival curves for PFS and OS.
Aerobic oxidation of glucose is the main catabolic pathway for normal cells to obtain energy where oxygen supply is sufficient. Conversely, cancer cells prefer anaerobic oxidation, even under the conditions of sufficient oxygen supply [28, 29]. In this case, glucose is catabolized into pyruvic acid, and primarily decomposed into lactic acid, leading to a lower level but faster ATP generation to meet the biosynthetic demands for rapid proliferation [30]. The increased expressions of many enzymes, including PGAM1, have been demonstrated to be involved in this process. Furthermore, altered metabolism may confer cancer cells a chemoresistance phenomenon [31]. Here we demonstrate that PGAM1 mediated pyruvic acid production participates in the regulation of paclitaxel resistance in ovarian cancer cell line with a high expression of PGAM1 also being significantly correlated with poorer prognosis in ovarian cancer patients.
In an earlier study, Evans et al. [32] reported that MJE3, a small-molecule acting as a PGAM1 enzyme inhibitor, but not other library members, could inhibit breast cancer cell proliferation. Its action relates to the four key steps controlling glycolytic flux, namely glucose import, and export of hexokinase, phosphofructokinase, and lactate [33]. Related to this process, upregulated PGAM1 in human cancers contributes to biosynthesis regulation. Inhibition of PGAM1 by shRNA or the small molecule inhibitor PGMI-004A results in increased 3-PG and decreased 2-PG levels in cancer cells. This leads to significantly decreased glycolysis, PPP flux, and biosynthesis, as well as attenuated cell proliferation and tumor growth [12, 21, 34]. It is interesting that in our study that among the 125 (35%) out of 356 successfully mined proteins that participated in metabolic processes, PGAM1 was the only remarkable enzyme involved in the glycolic pathways by which paclitaxel resistance could be manipulated in ovarian cancer cells. In addition, our immunohistochemical staining of 180 primary epithelial ovarian cancer tissues also showed that highly expressed PGAM1 was strongly correlated with poorer prognosis including PFS and OS.
Metabolic status has also been demonstrated to be a useful prognostic parameter in patients with non-small-cell lung cancer [35]. The characteristics of cancer cells is their metabolic plasticity and metabolic symbiosis [36]. On this basis, a reversion strategy of metabolic reprogramming was postulated to have potential towards countering radiotherapy or chemotherapy resistance. Chao et al. [37] reported a clinical trial with large hepatocarcinoma patients who received transarterial chemoembolization (TACE) with or without bicarbonate locally infused into the tumor site. They found that bicarbonate clearly enhanced anti-tumor abilities and accounted for this observation as probably due to the bicarbonate neutralization of lactate. Correspondingly, in this paper we examined paclitaxel resistance as influenced by pyruvate or lactate concentrations. Results showed that both could enhance ovarian cancer cell resistance to paclitaxel. However, it was shown that pyruvate was superior to lactate in this regard.
In our study, an increased PGAM1 expression followed ovarian cancer cells being exposed to paclitaxel. Upon modifying PGAM1 expression the influence of the changed expression of PGAM1 on the ovarian cancer cell responses to paclitaxel was clearly observed. Our results revealed that upon facing external paclitaxel stress ovarian cancer cells possess the capacity to enhance their glycolytic flux via the up-regulation of PGAM1, to withstand paclitaxel cytotoxicity in parental SKOV3 cells. Conversely, in the PGAM1 highly expressed SKOV3-TR30 cells, reducing the glycolytic flux via the down-regulation of PGAM1 was able to reverse paclitaxel cytotoxicity. However, this description could be somewhat of an oversimplification and the mechanism requires further clarification. As a working hypothesis we suggest that cancer cells can be artificially divided into two categories, one being proximal to blood vessels and the other distanced from the blood vessels. Cancer cells near the blood vessels first contact chemotherapeutics and display enhance glycolysis as a reaction to the chemical threat. These cells then further respond to rapidly produce a large quantity of glycolytic products, such as pyruvic acid and lactic acid. Despite this, such cells cannot survive for long. However, the cells located distanced from the blood vessels then receive the message from increased concentration of glycolytic products, and begin to overexpress PGAM1 and become more resistant to chemotherapeutics. This hypothesis needs further verification by data in vivo.
We concluded that PGAM1is highly expressed in paclitaxel-resistant ovarian cancer cell line, SKOV3-TR30, and in cancer patients with poorer prognosis. PGAM1 acts to modulate paclitaxel resistance via pyruvic acid and/or lactate production in ovarian cancer cells. Although the inhibition of an individual enzyme may be not effective enough to conquer chemoresistance in ovarian cancer, blocking PGAM1 may help providing a new approach to reverse paclitaxel resistance in ovarian cancer patients.
PGAM1, Phosphoglycerate mutase 1; PARP, poly (adenosine diphosphate–ribose) polymerase; 3-PG, 3-phosphoglycerate; 2-PG, 2-phosphoglycerate; ATP, adenosine triphosphate; PFS, progression free survival; OS, overall survival; ATCC, American Type Culture Collection; FBS, fetal bovine serum; FIGO, international federation of gynecology and obstetrics; IHC, immunohistochemistry; mRNA, messenger RNA; siRNA, small interfering RNA; DIGE, two-dimensional fluorescence difference in gel electrophoresis; PPP flux, pentose phosphate pathway flux; TACE, transarterial chemoembolization.
WGL and XX designed the study and provided administrative management. YF, XZ and SFZ performed most of the experiments. YF and WGL wrote the manuscript; SFZ re-checked the quantitative proteomic results; SSX collected patients’ clinical data; XJC prepared the reagents and performed cell culture; CYZ performed the immunohistochemical staining and scoring; YF and YMX edited and revised the manuscript. All authors have read and finally approved the manuscript.
Formalin fixed, paraffin-embedded tissues and clinic data were obtained by the approval of Ethics Committee of Women’s Hospital, School of Medicine, Zhejiang University.
The authors acknowledge Chris Wood for discussion.
This research was supported by grants from the Medicine and Health Research Project of Zhejiang Province (No.2017211914), The Research Project in Health Commission of Zhejiang Province (No.2013KYA106) and The Research Project of Department of Education of Zhejiang Province (No.Y201328866).
The authors declare no conflict of interest.
Publisher’s Note: IMR Press stays neutral with regard to jurisdictional claims in published maps and institutional affiliations.