


1 Department of Pharmaceutical Sciences, University of Perugia, 06126 Perugia, Italy
2 Department of Experimental Medicine, University of Perugia, 06123 Perugia, Italy
3 UMR 7021 CNRS, Université de Strasbourg, 67401 Illkirch, France
4 Cellular Informatics Laboratory, RIKEN, Wako, 351-0198, Saitama, Japan
5 Department of Health Sciences, Università degli Studi di Milano, 20142 Milan, Italy
6 Struttura Complessa di Neonatologia e Terapia Intensiva Neonatale-Azienda Ospedaliera Santa Maria della Misericordia, 06126 Perugia, Italy
7 Department of Biology, University of Pisa, 56127 Pisa, Italy
8 Interdepartmental Research Center “Nutraceuticals and Food for Health'', University of Pisa, 56127 Pisa, Italy
Academic Editor: Thomas Heinbockel
Abstract
Background: It has been established that sphingomyelin present human breast milk is useful for the brain maturation and cognitive development. At 10 days of breastfeeding the sphingomyelin content is double that present in cow’s milk and its content is independent of the maternal diet. The aim of the study was to analyze the content of sphingomyelin in breast milk at 3 months of breastfeeding and to consider the effect of this molecule on synaptic function and nerve conduction through the probable expansion of myelinated axons. Methods: Therefore, to begin to define and assess this, we performed sphingolipidomic analysis in human breast milk. Then, we cultured embryonic hippocampal cells (HN9.10) in the presence of sphingomyelin at a concentration from 0.6% to 31% of human milk, estimated by considering its bioavailability and its passage into the interstitial fluid. To highlight the effect of sphingomyelin in the cells, cell viability and morphology were evaluated. Analyses of neutral sphingomyelinase gene and protein expression was performed. The entry of sphingomyelin into the cell was studied in immunofluorescence; the expression of heavy neurofilament (NF200) was tested with immunocytochemical technique. Results: We demonstrated that sphingomyelin is able to enter cell nucleus and overexpress the sphingomyelin phosphodiesterase 4 (SMPD4) gene encoding for neutral sphingomyelinase (nSMase), an enzyme useful for its own metabolism. Later, cells displayed changes of the soma and the appearance of neurites supported by NF200 overexpression. Conclusions: We speculated that the sphingomyelin present in human breast milk is useful in part to regulate nuclear activity and in part to form myelin sheet to facilitate nerve cell maturation. As brain development occurs at 0–3 years, these data open a new avenue of potential intervention to integrate the infant formulas with SM to obtain a product similar to the maternal milk.
Keywords
- human milk
- sphingomyelin
- embryonic hippocampal cells
- cell differentiation
- neurites
Multiple studies show intimate connections between maternal nutrition, among different environmental and maternal factors, and human breast milk (HBM) composition [1]. Thus, several studies have implicated changes in human fatty acid (FA) composition but not in macronutrient composition in relation to maternal dietary intakes [2, 3, 4, 5]. This is relevant considering that human milk fat globules (MFGs) contain specific lipids, proteins, non-protein nitrogenous compounds and oligosaccharides [6]. Previous work in our group demonstrated a difference in sphingolipid (Sph) content between human and bovine milk, indicating a specie-specific composition of the milk [7]. Moreover, the Sph component of HBM at 10 days of breastfeeding was independent of maternal nutrition. In fact, the milk from mother fed on Mediterranean diet was very similar to that of mothers fed on a diet rich in vegetables or in proteins (meat, fish and eggs) [7]. We concluded that Sphs of HBM was produced by the metabolism of mammalian gland. Recently, Jiang et al. [8] have reviewed studies showing the effect of dietary sphingomyelin (SM) from HBM in impacting as well as gut health also cognitive development. Thus, SM composition in HBM is specifically designed to meet infant nutritional requirements during early life when the brain develops. Therefore, mother’s own milk might be considered an optimal nutrition source for the nervous system maturation in infants.
SM is the cornerstone of the large family of Sphs including interconnected metabolic lipids able to regulate various cellular mechanisms and biologic processes [9]. The biologic function of SM is regulated by tissue distribution and cellular compartmentalization. First, SM is an ubiquitous lipid but it is particularly abundant in the nervous system where has a structural and functional role. Importantly, it is an essential molecule in myelin sheath that surrounds some nerve cell axons, a critical component of both central and peripheral nervous systems, forming a protective barrier against axonal damage and facilitating the movement of nervous impulses [10]. As a consequence, SM in the cerebral spinal fluid was considered a biomarker of demyelination [11]. Second, SM is present in biological membranes where interacts with cholesterol to form lipid rafts [12]. Interestingly, dysregulation of lipid rafts was related with neurodegenerative disease pathogenesis [13]. Moreover, SM is an important regulatory molecule of the nuclear function [14]. Inside the nucleus, SM is preferentially located in perichromatin regions [15] in association with inner nuclear membrane microdomains [14]. Here, SM both anchors active chromatin and is catabolized by neutral sphingomyelinase (nSMase) by regulating duplication and transcription processes and, consequently, controlling the brain health and disease [16], including neurodegenerative disease [17].
Given the connections between the SM in HBM and SM in brain physiopathology, it became important to identify the possible specific changes of SM at different breastfeeding times and to study the bioactive role of SM in the differentiation of the brain embryonic cells. In this study, we analyzed the SM species in the human milk at 10 days, 3 and 12 months from the beginning of breastfeeding. We further studied the effect of SM in embryonic hippocampal cell differentiation.
Lipids standards for lipidomic analysis were purchased from Avanti Polar Lipids
(Alabaster, AL, USA). The chemicals, at analytical grade, were purchased by
Sigma-Aldrich (St. Louis, MO, USA). All aqueous solutions were prepared using
purified water at a Milli-Q grade (Burlington, MA, USA). Anhydrous sodium
sulfate, chloroform, hexane, methanol and potassium hydroxide were purchased from
Carlo Erba Reagents (Milan, Italy). Supelco™ 37 component fatty
acid methyl esters (FAME) mix, containing the methyl esters of 37 fatty acids was
supplied by Supelco (Bellefonte, PA, USA). Dulbecco’s modified Eagle’s medium
(DMEM), L-glutamine, trypsin, and ethylenediaminetetraacetic acid disodium and
tetra-sodium salt (EDTA), fetal bovine serum (FBS) were from Microgem srl
(Pozzuoli, NA, Italy). Penicillin–streptomycin, and 6X loading dye were obtained
from Thermo Fisher Scientific (Waltham, MA, USA). Dulbecco’s phosphate buffer
saline (PBS) pH 7.4, and agarose were from Invitrogen srl (Milan, Italy).
Dimethylsulfoxide (DMSO), ethanol, hydrochloric acid, sodium chloride, and sodium
hydroxide were purchased from Carlo Erba Reagenti srl (Milan, Italy). Fixing
solution and cell stain solution were from Cell Biolabs, INC (San Diego, CA,
USA). Anti-nSMase, anti-
Ten milk donor women at Banca del Latte Umano Donato (BLUD, Struttura Complessa di Neonatologia e Terapia Intensiva Neonatale– Azienda Ospedaliera Santa Maria della Misericordia - Perugia, Italy) were considered for the study from January 2020 to January 2021. The Bioethics Committee of Perugia University has approved the study (n.2018-05), all procedures were performed accordingly. Women were included on a voluntary basis, signed the informed consent and were anonymized. No sensitive data were collected. The inclusion criteria were mothers who had followed a Mediterranean diet during pregnancy and breastfeeding. The exclusion criteria were a history of pathology, the presence of pathologies transmissible with milk, the use of drug, alcool and smoke, gemellar pregnancies.
Milk of ten donor mothers at 10 days of breastfeeding, at 3 months and at 1 year of breastfeeding were considered for the study. The mothers did not undergo any treatment. Immediately after collecting at nine o’clock, the milk samples were submitted to Holder pasteurization to eliminate harmful germs [4]. All samples were stored in a –20 °C freezer before analysis. Milk from the donor bank was used for babies of other mothers who had none or had low milk supply. The quantity administered was dependent on the quantity of milk that the direct mother of the child was able to produce and was calculated on the basis of the pre- and post-breastfeeding infant weight.
Milk lipid extraction and gas chromatography analysis were performed as
previously reported [4]. Of note, the fatty acid methyl esters (FAME) of total
lipids were prepared by transmethylation with methanolic KOH and analyzed by
high-resolution gas chromatography. A DANI 1000DPC gas-chromatograph (Norwalk,
CT, USA), equipped with a split–splitless injector and a flame ionization
detector, was used. FAME separation was performed with a CP-Select CB for FAME
fused silica capillary column (50 m
Sph extraction and LC–MS/MS analysis were performed as previously described
[7]. Sphs were extracted from three independent 25
Quantitative analysis was performed interpolating each peak area of analyte/area internal standards with a calibration curve for each sphingolipid. Data represent the mean for the three independent aliquots of HBM.
Immortalized hippocampal neurons HN9.10e (kind gift of Kieran Breen, Ninewells
Hospital, Dundee, UK) were grown in DMEM supplemented with 10% FBS, 2
mM l-glutamine, 100 IU/mL penicillin, 100
MTT assay was used to test cellular viability, as previously reported [18].
HN9.10 cells were seeded into 96-well plates (1
HN9.10e cells were cultured as above reported for 72 h in absence or presence of
increasing concentration of SM (0.5, 1, 5, 10, 15, 20, 25
HN9.10e were cultured for 48 h for immunocytochemical analysis performed as
previously reported [19]. The cells were centrifuged at 1200 g for 15 min. The
pellet was fixed with 10% formalin for 24 h and embedded in paraffin. Bond Dewax
solution was used to remove paraffin from sections before rehydration and
immunostaining on the Bond automated system (Leica Biosystems Newcastle, Ltd.,
United Kingdom). Immunostaining for neurofilament heavy protein (NF200) detection
was performed by using anti-NF200 antibody (NOVOCASTRA Laboratories, Ltd.,
Newcastle, United Kingdom) and Bond Polymer Refine Detection (Leica Biosystems,
Newcastle, Ltd., United Kingdom). The observations were performed by using
inverted microscopy EUROMEX FE 2935 (ED Amhem, Netherlands) equipped with a CMEX
5000 camera system (40
The SM localization was studied by using the SM probe, enhanced green
fluorescent protein-nontoxic-lysenin (EGFP-NT-Lys). The probe was purified from
E.coli strain BL21(DE3) harboring pET28/EGFP-NT-Lys according to
Tomishige et al. [20], with a little modification. In brief, after
bacteria culture reaches OD
Cells were cultured for 24 h in the absence or presence of 1.0
HN9.10e were cultured for 24 h for RTqPCR analysis. Total RNA was extracted from
control and SM-treated cells by using RNAqueous®-4PCR kit
(Ambion, Inc., Austin, TX, United States). Samples were treated and RTqPCR was
performed to study the gene expression SM phosphodiesterase 4 (SMPD4,
Hs04187047_g1). Glyceraldehyde-3-phosphate dehydrogenase (GAPDH,
Hs99999905_m1) and 18S rRNA (S18, Hs99999901_s1) were used as
housekeeping genes. mRNA relative expression levels were calculated as
2
Three experiments in duplicate where performed for each analysis. Graphs were
represented as mean
In previous studies, we showed that the maternal diet changed fatty acid (FA) composition and did not alter Sph composition of HBM at 10 days of breastfeeding [4, 7].
Given the undeniable positive effects of the Mediterranean diet for the properties of breast milk, we examined the variations in the composition of fatty acids in women who followed the Mediterranean diet throughout the breastfeeding period. Therefore, milk donor mothers from BLUD of Perugia hospital who had followed a Mediterranean diet were chosen for the study. The criteria of inclusion and exclusion were above reported. Mothers of different ages and with different weights in early pregnancy and with different weight gain during pregnancy were considered. The milk of the same mothers was analyzed at 10 days, 3 months and 1 year of breastfeeding. As shown in Fig. 1a,b, total and each saturated FA (SFA) did not change in time. Differently, both monounsaturated FA (MUFA) and polyunsaturated FA (PUFA) reduced at 3 months and even more a 1 year. Of note, among MUFA myristoleic, palmitoleic and oleic acids and among PUFA oleic acid significantly reduced (Fig. 1c,d).
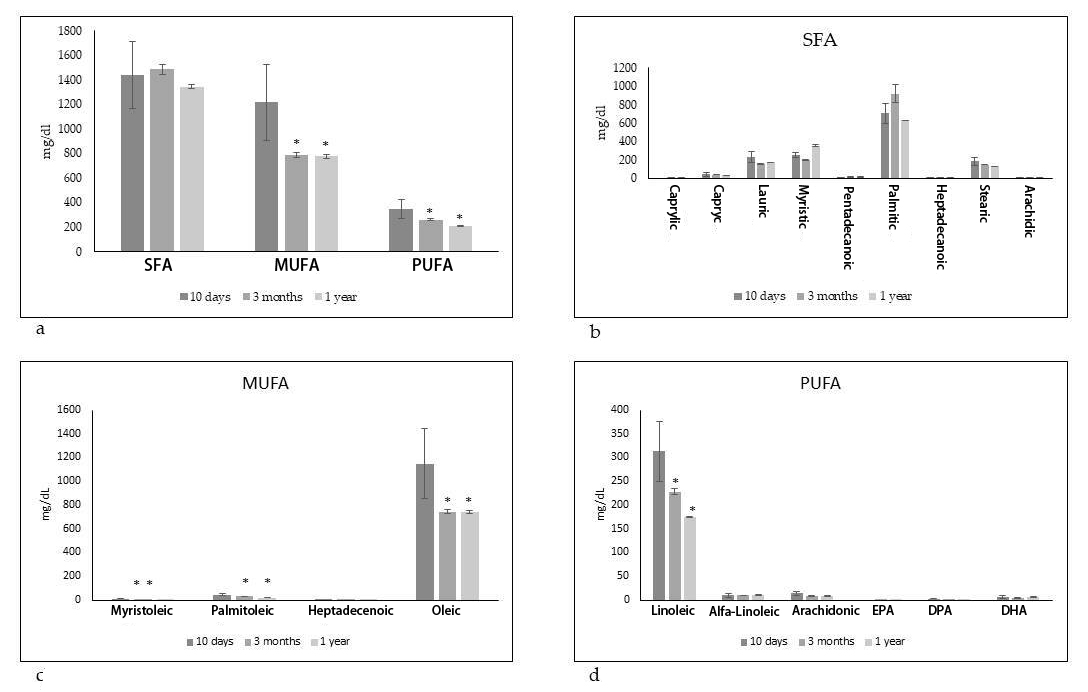 Fig. 1.
Fatty acid composition in human breast milk of mothers fed on
Mediterranean diet at different times of breastfeeding. SFA, saturated fatty
acids, MUFA, monounsaturated fatty acids and PUFA polyunsaturated fatty acids.
(a) Total lipids. (b) SFA species. (c) MUFA species. (d) PUFA species. Data are
expressed as mean
Given the above results it was interesting to analyze the Sph composition in the
same HBM samples. Fig. 2a shows total SM or dihydroceramides (DHCer) or Cer
species. It is evident that a longer breastfeeding time induced a lower SM level
and a higher Cer level. Furthermore, the value of DHCer was 0.18 + 0.07
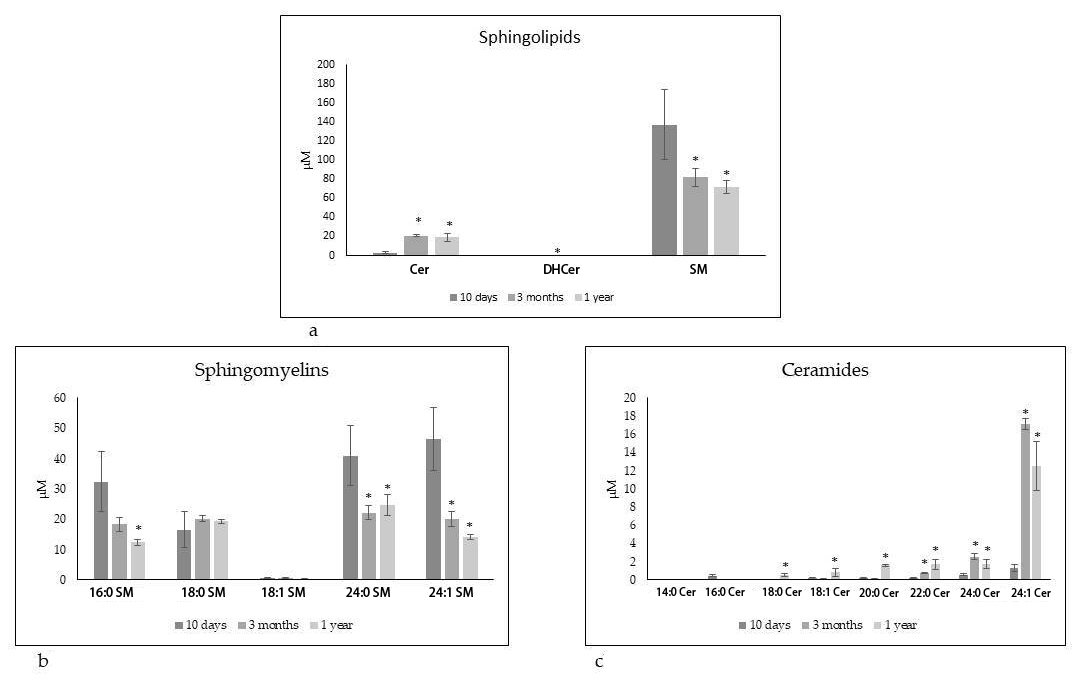 Fig. 2.
UFLC MS/MS analysis of human breast milk. Sphingolipid
composition at different times of breastfeeding. (a) Total sphingolipid family.
(b) Sphingomyelin species. (c) Ceramide species. Data are expressed as
To understand the significance of the results obtained, we hypothesized the
relationship between SM and the maturation of nerve cells. To test this
hypothesis, we investigated the contribution of SM on the HN9.10 embryonic
hippocampal cell differentiation. We first set out to study the dose-dependent
effect of SM on HN9.10 cell viability after 24 h of culture by using MTT assay
and using 1% and 2% DMSO were used as positive controls. Considering the value
of SM in 3 months milk (about 80
The results demonstrated that SM from 0.5
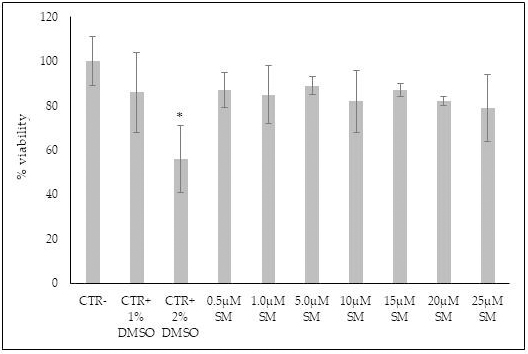 Fig. 3.
The effect of sphingomyelin on HN9.10 cell viability. Cells
were cultured with increasing doses of SM prepared by using absolute ethanol as
vehicle and the viability was measured by MTT assay. Values were reported as
percentage viability of the control sample prepared by using only absolute
ethanol prepared as reported in 3.6. (CTR-dark gray) or without absolute ethanol
(CTR-light gray). 1% DMSO and 2% DMSO were used as positive controls. Data were
expressed as mean
Therefore, we sought to see the effect of each SM concentration in the
morphological changes of HN9.10, knowing from our previous studies that the
differentiation of these embryonic hippocampal cells was demonstrable with change
of the soma characteristics and with the appearance of neurites [21, 19]. In
order to accomplish this goal, a series of experiments of cell culture for 72 h
with increasing doses of SM was performed to determine the minimally sufficient
SM dose necessary for HN9.10 differentiation. As shown in Fig. 4a, the control
sample was characterized by a very low percentage of cells with neurites that
appeared short (Fig. 4c,d). 0.5
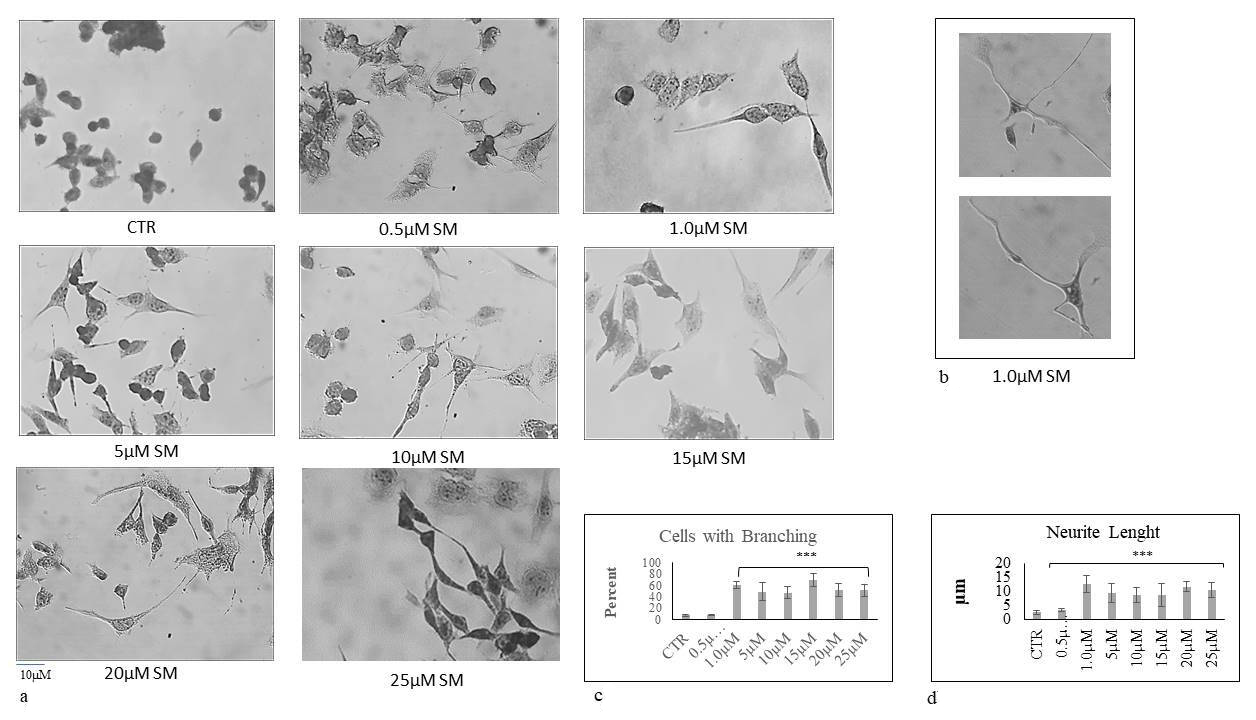 Fig. 4.
The effect of sphingomyelin on HN9.10 cell morphology. Cells
were cultured with increasing doses of SM and the morphologic analysis was
performed as reported in the “Materials and Methods”. (a,b) The observations
were performed by using inverted microscopy EUROMEX FE 2935 (ED Amhem,
Netherlands) equipped with a CMEX 5000 camera system (40
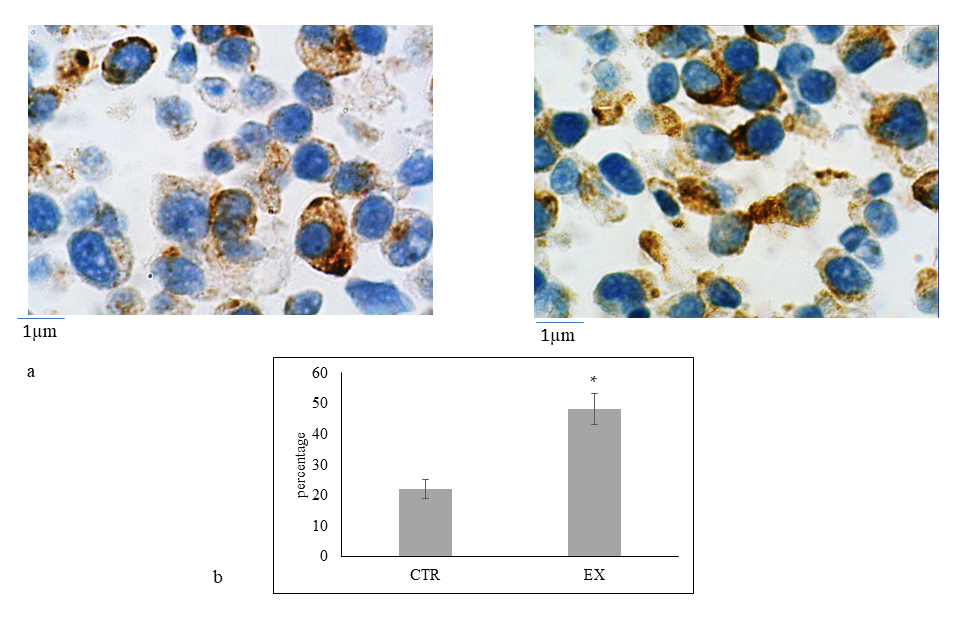 Fig. 5.
Immunocytochemical analysis of Neurofilament 200 kDa (NF200).
(a) On the left control sample and, on the right experimental sample (HN9.10
treated with 1.0
This result led us to hypothesize that SM could enter the cell and reach the nucleus where it regulated gene transcription, supporting our previous studies [15, 16]. In order to verify this hypothesis, we used for the first time a specific SM probe (EGFP-NT-Lys) to ascertain the SM localization inside the cells. To monitor the probe incorporation, the cells were counterstained with DAPI (4’,6-diamidin-2-fenilindol) to label the nuclei and the samples were analyzed at progressive times. Interestingly, the fluorescent probe was located after 30 min away from the nucleus, then in the perinuclear area and finally inside the nucleus (Fig. 6). To test whether the entrance of SM into the nucleus might be responsible for the regulation of gene expression and consequently of protein synthesis of enzymes responsible for its metabolism, RT-PCR and western blotting analysis were performed. In that contest, SM upregulated SMPD4 gene encoding for nSMase (Fig. 7a). Accordingly, nSMase protein was overexpressed (Fig. 7b,c).
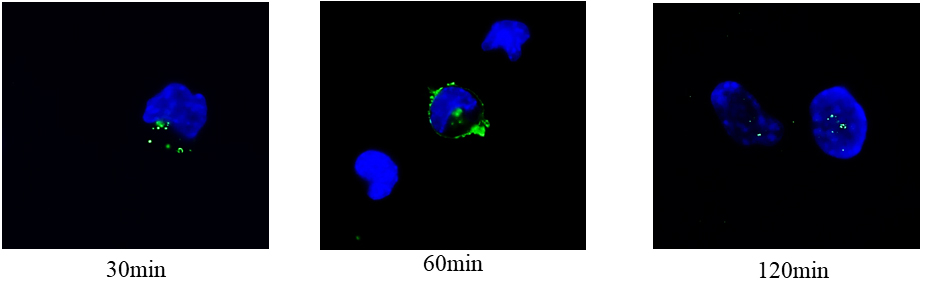 Fig. 6.
Localization of sphingomyelin in time with fluorescent probe EGFP-NT-Lys.
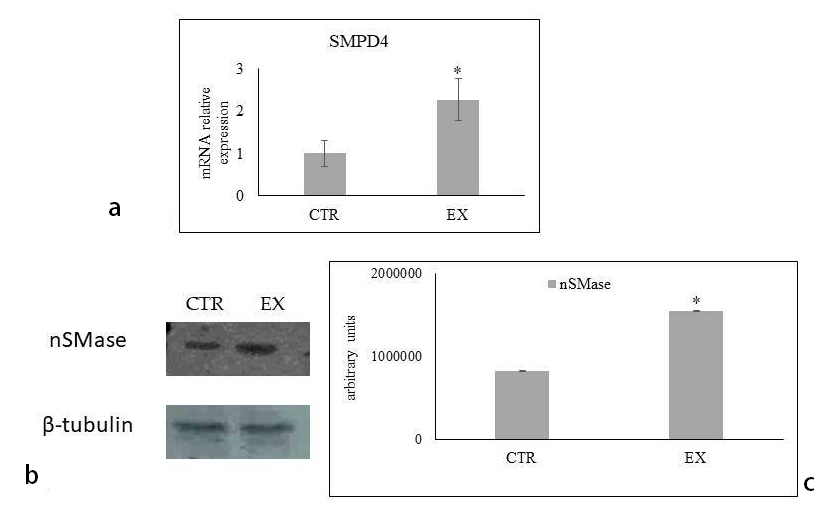 Fig. 7.
Effect of sphingomyelin on gene and protein expression. (a)
SMPD4 gene expression analyzed by RT-PCR. (b) Immunoblotting of nSMase
protein. (c) Quantification of area density by Chemidoc Imagequant LAS500 by
specific IQ programm. Data were expressed as mean
Based on previous studies, we showed that lipid composition of HBM at 10 days of breastfeeding was dependent on the maternal diet [4]. Of note, a maternal diet rich in proteins or in vegetables was responsible for the production of a milk with a FA composition different from a milk of mothers who had followed a Mediterranean diet. Based on our biochemical analysis, we showed a reduction of MUFA and PUFA in HBM after 3 months of breastfeeding maintaining constant the Mediterranean diet in mothers. Interestingly, the mothers followed the same type of diet in all the periods considered, including the lipid content. This is relevant considering that generally the maternal intake of carbohydrates and fatty acids (in quantity and quality) influences the FA composition of HBM. Thus, our data suggest a change of lipid metabolic pathway in mammary gland in time.
This question that consider of mammary gland as a metabolic actor for the production of a milk in which some components are independent of the maternal diet is important. Notably, we have previously demonstrated that a maternal diet rich in proteins or in vegetables or a Mediterranean diet did not influence the Sph composition of the milk [7]. Moreover, the Sph level in HBM was double that found in cow’s milk [7].
Taken together, these results raise the possibility that Sphs of HBM was specie-specific and might be dependent on the human mammary gland metabolism. In this regard, considering that Sphs are the most abundant lipids in the brain and that they are essential for brain health [22], Sphs of HBM might have important roles for the newborn development. Recently, implication of SM beneficial effects in the neuronal development in infants was reported [23]. It is know that the maturation process of the brain continues at least until the third year of life [24]. Of note, the hippocampus, which is crucial for mediating spatial memory begins its rapid growth phase at approximately 32 weeks gestation, continuing for at least the first 18 postnatal months [25, 26]. In this study, we identified a reduction of SM and an increase of Cer in HBM during the progression of breastfeeding. At present it is difficult to say with certainty that there is an adaptation of the content of HBM SMs to the development of the breastfed infant’s brain and the maturation of nerve cells. However, given the findings of this study and published work, the Sph composition in HBM should be always considered thereby providing a possible and plausible hypothesis that high level of SM might be essential at 0–3 year of life for the maturation of nerve cells. Therefore, an integration with SM might be useful during breastfeeding beyond 3 months. Consistent with this theory, we studied the effect of SM in embryonic hippocampal cell differentiation. The results demonstrated that SM treatment induced a change of the soma and the appearance of neurites. To highlight the molecular mechanism of the neurite growth, we demonstrated that SM induced NF200 overexpression.
Importantly, we used a specific probe to investigate whether SM was able to enter the nucleus of HN9.10 cells where it could act regulating gene expression and transcription [15]. Due to its lipophilic nature, it is possible that SM enters the nucleus without a specific transporter as a free molecule or in the form of vesicles but there are no data on this in literature yet. The positive results was not surprising; indeed, there is considerable evidence linking SM to the nuclear activity in nerve cell physiopathology, reviewed by Garcia-Gil and Albi E [16]. However, to our knowledge, this is the first study to describe the entry of SM into the nucleus with a fluorescent probe (EGFP-NT-Lys), notably in HN9.10 cells.
Thus, we hypothesized that SM, reached the nucleus, was able to influence gene expression. Interestingly, we found that SM was able to upregulate SMPD4 gene encoding for nSMase, an enzyme essential for its own metabolism, supporting previous studies showing how SM metabolism is fine regulated inside the nucleus [14]. Our data suggest that nSMase is regulated by SM, indicating a nutrigenomic effect of SM. Together, these findings have suggested that SM might contribute to HN9.10 cell differentiation. Although the underlying reason for the reduction of SM in HBM in time is unknown, we speculate that nSMase may increase in mammary gland in time. Further studies are underway to study this point.
We can speculate that the high level of SM in HBM in the first period of breastfeeding might be useful in part to enter by 2 h into cell nucleus to stimulate nuclear activity and in part to form myelin sheet after 72 h, when neurite are formed. Further studies will clarify the role of SM in other nerve cells.
In summary, this study demonstrates reduction of SM in HBM after 3 months of breastfeeding. In vitro system of embryonic hippocampal cells, SM is able first to enter into the nucleus overexpressing the gene for nSMase useful for its own metabolism and then to induce cell differentiation characterized by change of the soma and appearance of neurites. The results implicates the SM as important mediator of neural cell differentiation. As brain development occurs at 0–3 years, these data open a new avenue of potential intervention to integrate the infant formulas with SM to obtain a product similar to the maternal milk.
Cer, ceramide; nCerase, ceramidase, neutral ceramidase; SM, sphingomyelin; nSMase, neutral sphingomyelinase; RTqPCR, reverse transcription quantitative PCR; SMPD4, sphingomyelin phosphodiesterase 4; SphK2, sphingosine kinase 2.
The conception and design of the study (SC and EA), experiments (CA, TK, NT, MDC, RP, PS, L Co, ST, CG, MRC, AM) acquisition of data (CA, RP, PS), analysis of data (CA, AM, EA, L Ce), interpretation of data (SC, EA, TB, MGG), drafting the article or revising it critically for important intellectual content (SC, EA), final approval of the version to be submitted (SC, EA and TB). All authors have read and agreed to the published version of the manuscript.
The Bioethics Committee of Perugia University has approved the study (n.2018-05), all procedures were performed accordingly. Women were included on a voluntary basis, signed the informed consent and were anonymized.
We thank Giuseppa Verducci from Perugia University for the fatty technical support.
This research received no external funding.
The authors declare no conflict of interest. SC is serving as one of the Editorial Board member of this journal. We declare that SC had no involvement in the peer review of this article and has no access to information regarding its peer review. Full responsibility for the editorial process for this article was delegated to TH.
Publisher’s Note: IMR Press stays neutral with regard to jurisdictional claims in published maps and institutional affiliations.