1. Introduction
Acute liver failure (ALF) is a serious disease defined as destruction of
parenchymal tissue accompanied by the impairment of protein synthesis and
detoxifying function, reflected by the presence of jaundice, coagulopathy and
liver encephalopathy within short period of time after first symptoms appeared.
Liver dysfunction results from potentially reversible liver parenchyma necrosis
which is most often caused by viral infection or acetaminophen overdose [1].
Despite reversibility of the disease, it is associated with a high mortality
rate. Depending on the aetiology, in the mild course of ALF, it can be
effectively treated causally as in acetaminophen overdose, where acetylcysteine
can be administered as an antidote. In acute hepatotropic viral infections and
different drug overdoses, there is no effective causal treatment, therefore
symptomatic treatment is applied [2]. Patients with mild to moderate onset of ALF
are usually treated in internal medicine or paediatric wards, where medical
management includes prevention of liver failure complications, fluid therapy, and
pharmacological liver supportive treatments, such as ornithine administration
[3]. In fulminant or hyperacute course of the disease, the only therapeutic
option is liver transplantation [4]. However, organ transplantation has important
drawbacks including high cost, low organ availability, the necessarily of using
life-long immunosuppression treatment and risk of multiple complications [1, 5, 6]. In view of the donor shortage, the need for immunosuppressive treatment, and
post-transplant complications, there is imperative to develop a new alternative
therapy capable of improving the clinical condition of patients, reducing
mortality, or prolonging patient survival [7]. Stem cell-based therapy may be a
promising alternative or adjuvant treatment to the currently used methods [8, 9, 10, 11].
Cell therapies with bone marrow mesenchymal stem cells (BM-MSCs) [12], Wharton’s
jelly mesenchymal stem cells (WJ-MSCs) [13], hepatocyte-like cells derived from
human amniotic epithelial cells (hAEC-HLCs) [14], and hepatocyte-like cells
derived from induced pluripotent stem cells (iPS-HLCs) [15] have been proven
effective in animal models of ALF. Implanted cells could partially take over the
function of damaged liver parenchyma (e.g., hepatocyte implantation) [16],
increase liver regenerative ability (e.g., mesenchymal stem cells implantation)
[17, 18] or suppress destructive inflammatory reaction (e.g., amniotic epithelial
and mesenchymal cells implantation) [19, 20]. It is also suggested that the
mechanism of therapeutic action of the above-mentioned cells may be more related
to the secreted paracrine factors and microvesicles than to the transplanted
cells themselves [21, 22].
Experimental mouse and rat models of ALF using carbon tetrachloride (CCl)
and D-galactosamine (D-GalN) allow observation of the progression of liver
diseases, particularly those observations that cannot be performed in patients
for ethical and medical reasons [23, 24]. Therefore, animal models of induced
hepatotoxicity can be used in the preclinical assessment of acute and chronic
liver injury therapies. Unfortunately, the various mechanisms of xenobiotic
toxicity and different sensitivity of animal species and strains to intoxication
result in different intoxication effects and, as a consequence, some difficulties
in data interpretation and extrapolation to humans [24]. Additionally, different
approaches to liver injury assessment make it difficult to perform comparative
analysis and choose the optimal in vivo model [23].
The main mechanism of liver injury by CCl involves its biotransformation
resulting in free radical generation, i.e., CCl, cell membrane oxidation,
and DNA damage [25]. Free radicals are generated by cytochrome P450 (CYP)
enzymes, in particular the CYP2E1 isozyme, which reduce CCl to CCl
and then covert it to superoxides. The oxidative metabolites damage the cell
membrane, leading to the cytoplasmic ion imbalance and necrotic cell death.
Histological evidence of CCL-induced liver damage can be observed mainly in
zone 3 of the hepatic acinus [26]. The CCl model of liver injury is one of
the most widely used, but unfortunately, in terms of its mechanism of action, it
has no direct equivalent in human liver injury. Histopathological changes in
acute CCl intoxication are very similar to acetaminophen overdose, which is
one of the causes of acute liver injury in humans [27, 28]. To induce ALF in mice
and rats, the CCl dose should be 40–750 L per 100 g b.w.
[29, 30, 31].
D-GalN is a highly hepatospecific compound. Unlike other hepatotoxins, D-GalN
does not directly damage other organs and does not cause irritation when
injected. In hepatocytes, D-GalN is eliminated by the pathway responsible for
galactose metabolism. During the first phase, D-GalN is phosphorylated to
galactosamine-1-phosphate (GalN-1-P), then converted to UDP-galactosamine, which
has a higher affinity for UDP than for galactose. GalN-1-P is an inhibitor of
UDP-glucose pyrophosphorylase-catalysed reaction. Together with UDP, the trapping
effect leads to uridine deficiency and inhibition of RNA synthesis. As a
consequence, inhibition of protein synthesis leads to apoptotic cell death [32].
In mice and rats, a single D-GalN intraperitoneal injection of 26.6 mg and 20 mg,
respectively, changes gene expression related to injury but does not cause
visible histopathological changes [33]. Rats are more susceptible to D-GalN
intoxication than mice. To develop full-blown acute liver failure, D-GalN dose
should be 80–140 mg in rats [34, 35] and 150–270 mg per 100 g b.w. in mice [36, 37]. Furthermore, the effect of D-GalN intoxication is highly dependent on the
animal strain.
In the present pilot study, we compared the dynamics of development of acute
liver failure induced in Sprague Dawley rat and BALB/c mouse experimental models
by classical hepatotoxins, CCl, and D-GalN at doses described as effective
[38, 39, 40] or modified by us due to excessive mortality in CCl-intoxicated
mice. We adopted the following criteria of dose selection: signs of acute liver
injury in histopathological examination and liver panel; low mortality rate; wide
therapeutic window; good animal condition in therapeutic window. We analysed the
usefulness of these models with a view to their future introduction into
preclinical experiments on stem cell therapy. In particular, it allowed us to
identify potential experimental time cut-off points based on histopathological
and molecular changes and determine when stem cell therapeutic intervention could
be effective as a first-line or adjuvant therapy in the inhibition of progression
of these changes in ALF. It is important to define window of treatment in each
ALF model, because too late or too early cell implantation could be ineffective
in terms of cell homing and suppression of inflammatory reaction and may have
negative influence on the final effect of cell therapy.
2. Materials and Methods
2.1 Animals
Six-week-old male BALB/c mice (18–25 g b.w.) and two-month-old male Sprague
Dawley rats (180–220 g b.w.) were provided by the Animal House of the
Experimental Medicine Centre of the Medical University of Silesia and were
treated in accordance with the Directive 2010/63/EU on animal experimentation
using protocols reviewed and approved by the Local Ethics Committee for Animal
Experiments of the Medical University of Silesia (decision no. 18/2018).
Animals (six per cage) were housed under standard conditions of temperature (22
°C 2 °C), humidity (50–60%), light/dark cycle (12
h/12 h), and light intensity (60–400 lux). Water and standard laboratory chow
(Labofeed) were available ad libitum.
2.2 Experimental Design
Mice and rats were randomly divided into 8 groups of 12 individuals each.
D-galactosamine hydrochloride (Cayman Chemical: 22981) was dissolved in
physiological saline. Carbon tetrachloride (Chempur: 118804704) was diluted 1:1
in olive oil (Sigma-Aldrich). The xenobiotics were administered intraperitoneally
(i.p.) at the doses shown in Table 1. Animals were not fasted during the
experiment. At each of the scheduled time points (12 h, 24 h, 48 h, and day 7),
three animals per group were anaesthetized by i.p. injection of 100 mg/kg
ketamine and 10 mg/kg xylazine and sacrificed. Blood and tissue samples were
taken on the day of anaesthesia. Samples from control groups were collected at
the same time after the last saline or oil injection.
Table 1.Course of intraperitoneal injections in rats and mice.
| Hepatotoxin |
Control groups |
Acute liver injury |
| Rats |
Mice |
Rats |
Mice |
| Carbon tetrachloride |
Single injection of 400 L/100 g b.w. olive oil |
Single injection of 100 L/100 g b.w. olive oil |
Single injection of 200 L/100 g b.w. |
Single injection of 50 L/100 g b.w. |
| D-GalN hydrochloride |
Single injection of 500 L/100 g b.w. saline |
Single injection of 250 L/100 g b.w. saline |
Single injection of 50 mg/100 g b.w. |
Single injection of 150 mg/100 g b.w. |
| Animals from experimental groups received hepatotoxin solvents at the same
volume as control rats and mice injected with hepatotoxin solutions, saline or
olive oil. |
2.3 Blood Tests
1 mL of orbital sinus blood was collected to assess liver damage by liver
function tests that measured the activity of alanine transaminase (ALT),
aspartate transaminase (AST), and alkaline phosphatase (ALP), and total protein
(TP). Blood tests were performed by the kinetic method using Chemistry Analyzer
(Beckman Coulter: AU480), and reagents and protocols provided by the
manufacturer. Blood smears were stained with May Grunwald-Giemsa dye, to assess
cell morphology.
2.4 Histopathological Analysis
The liver samples were taken from the left lateral lobe and cut into small
pieces, which were fixed in 10% buffered formaline solution, processed using the
standard paraffin technique, and stained with haematoxylin and eosin. Liver
inflammation was assessed by a simple grading algorithm evaluating parenchymal
injury and interface hepatitis. Hepatitis was graded as follows: normal liver
parenchyma (0), hepatitis with minimal activity (1), hepatitis with mild activity
(2), hepatitis with moderate activity (3), and hepatitis with marked activity
and/or multiacinar bridging necrosis (4) [19, 20]. Liver steatosis was graded as
follows: 5% (none; 0), 5–33% (mild; 1), 34–66% (moderate; 2), and 67%
(severe; 3) [41].
Sirius red staining was performed to differentiate collagen fibres from the
background and evaluate the progression of liver fibrosis. Dewaxed, rehydrated,
4-m-thick liver sections were incubated with Weigert’s haematoxylin
for 8 min and with picrosirius red in saturated picric acid for 60 min. Finally,
they were washed thoroughly with acetic acid and water, covered, and examined
under polarized light (Olympus BX-43 polarizer).
To quantify the percentage area occupied by collagen fibres, fifteen random
fields of 0.0944 mm from each slide were photographed at 200
magnification and analysed using ImageJ analysis software (version: 1.53c 26 June
2020, National institutes of Health, Bethesda, Maryland, United States) [42] and
the Ishak semi-quantitative scoring system [43, 44]. Moreover, the thickness of
collagen fibres was evaluated under polarized light using the protocol described
by Rich and Whittaker [45].
2.5 Immunohistochemistry
Paraffinized 4-m-thick rat and mouse liver sections were dewaxed
and rehydrated. Endogenous peroxidase activity was quenched with 3%
HO for 10 min. The sections were immunohistochemically stained to
detect Ki-67, a marker of proliferation, and activated caspase-3 (Cas-3), a
marker of apoptosis. Liver sections stained with isotype-matched mouse IgG served
as negative controls. Immunoreactivity was visualized using diaminobenzidine
(Vector Laboratories).
To visualize Ki-67, antigens were retrieved by incubation with citric acid-based
antigen unmasking solution (Vector Laboratories) for 60 min. Blocking of
non-specific binding was done using 2.5% equine serum (Vector Laboratories) for
60 min. Subsequently, liver sections were incubated with anti-Ki67 (SP6) antibody
(ab16667; Abcam) diluted 1:400 for 20 h at 4 °C. Next, the sections were
incubated with anti-rabbit secondary antibody conjugated with peroxidase (Vector
Laboratories) at room temperature for 30 min. Sections taken from human tonsil
served as positive controls.
Apoptotic cells were identified in the liver slices after 30 min of antigen
retrieval and incubation with citric acid-based antigen unmasking solution
(Vector Laboratories). Blocking of non-specific binding was done using 5% goat
serum (Vector Laboratories). It was followed by incubation with Cas-3 antibody
(#9661; Cell Signalling) diluted 1:500 for 20 h at 4 °C. Next, liver
slices were incubated with anti-rabbit secondary antibody (Cell Signalling) at 4
°C for 30 min and at room temperature for 30 min.
On each slide, ten random fields of 0.3779 mm each were photographed at a
magnification 100 or 200 times. The data were analysed using ImageJ software and
expressed as the mean number of positive cells per field of interest (Ki67) or on
a semi-quantitative scale (Cas3) (Fig. 1, Ref. [46]).
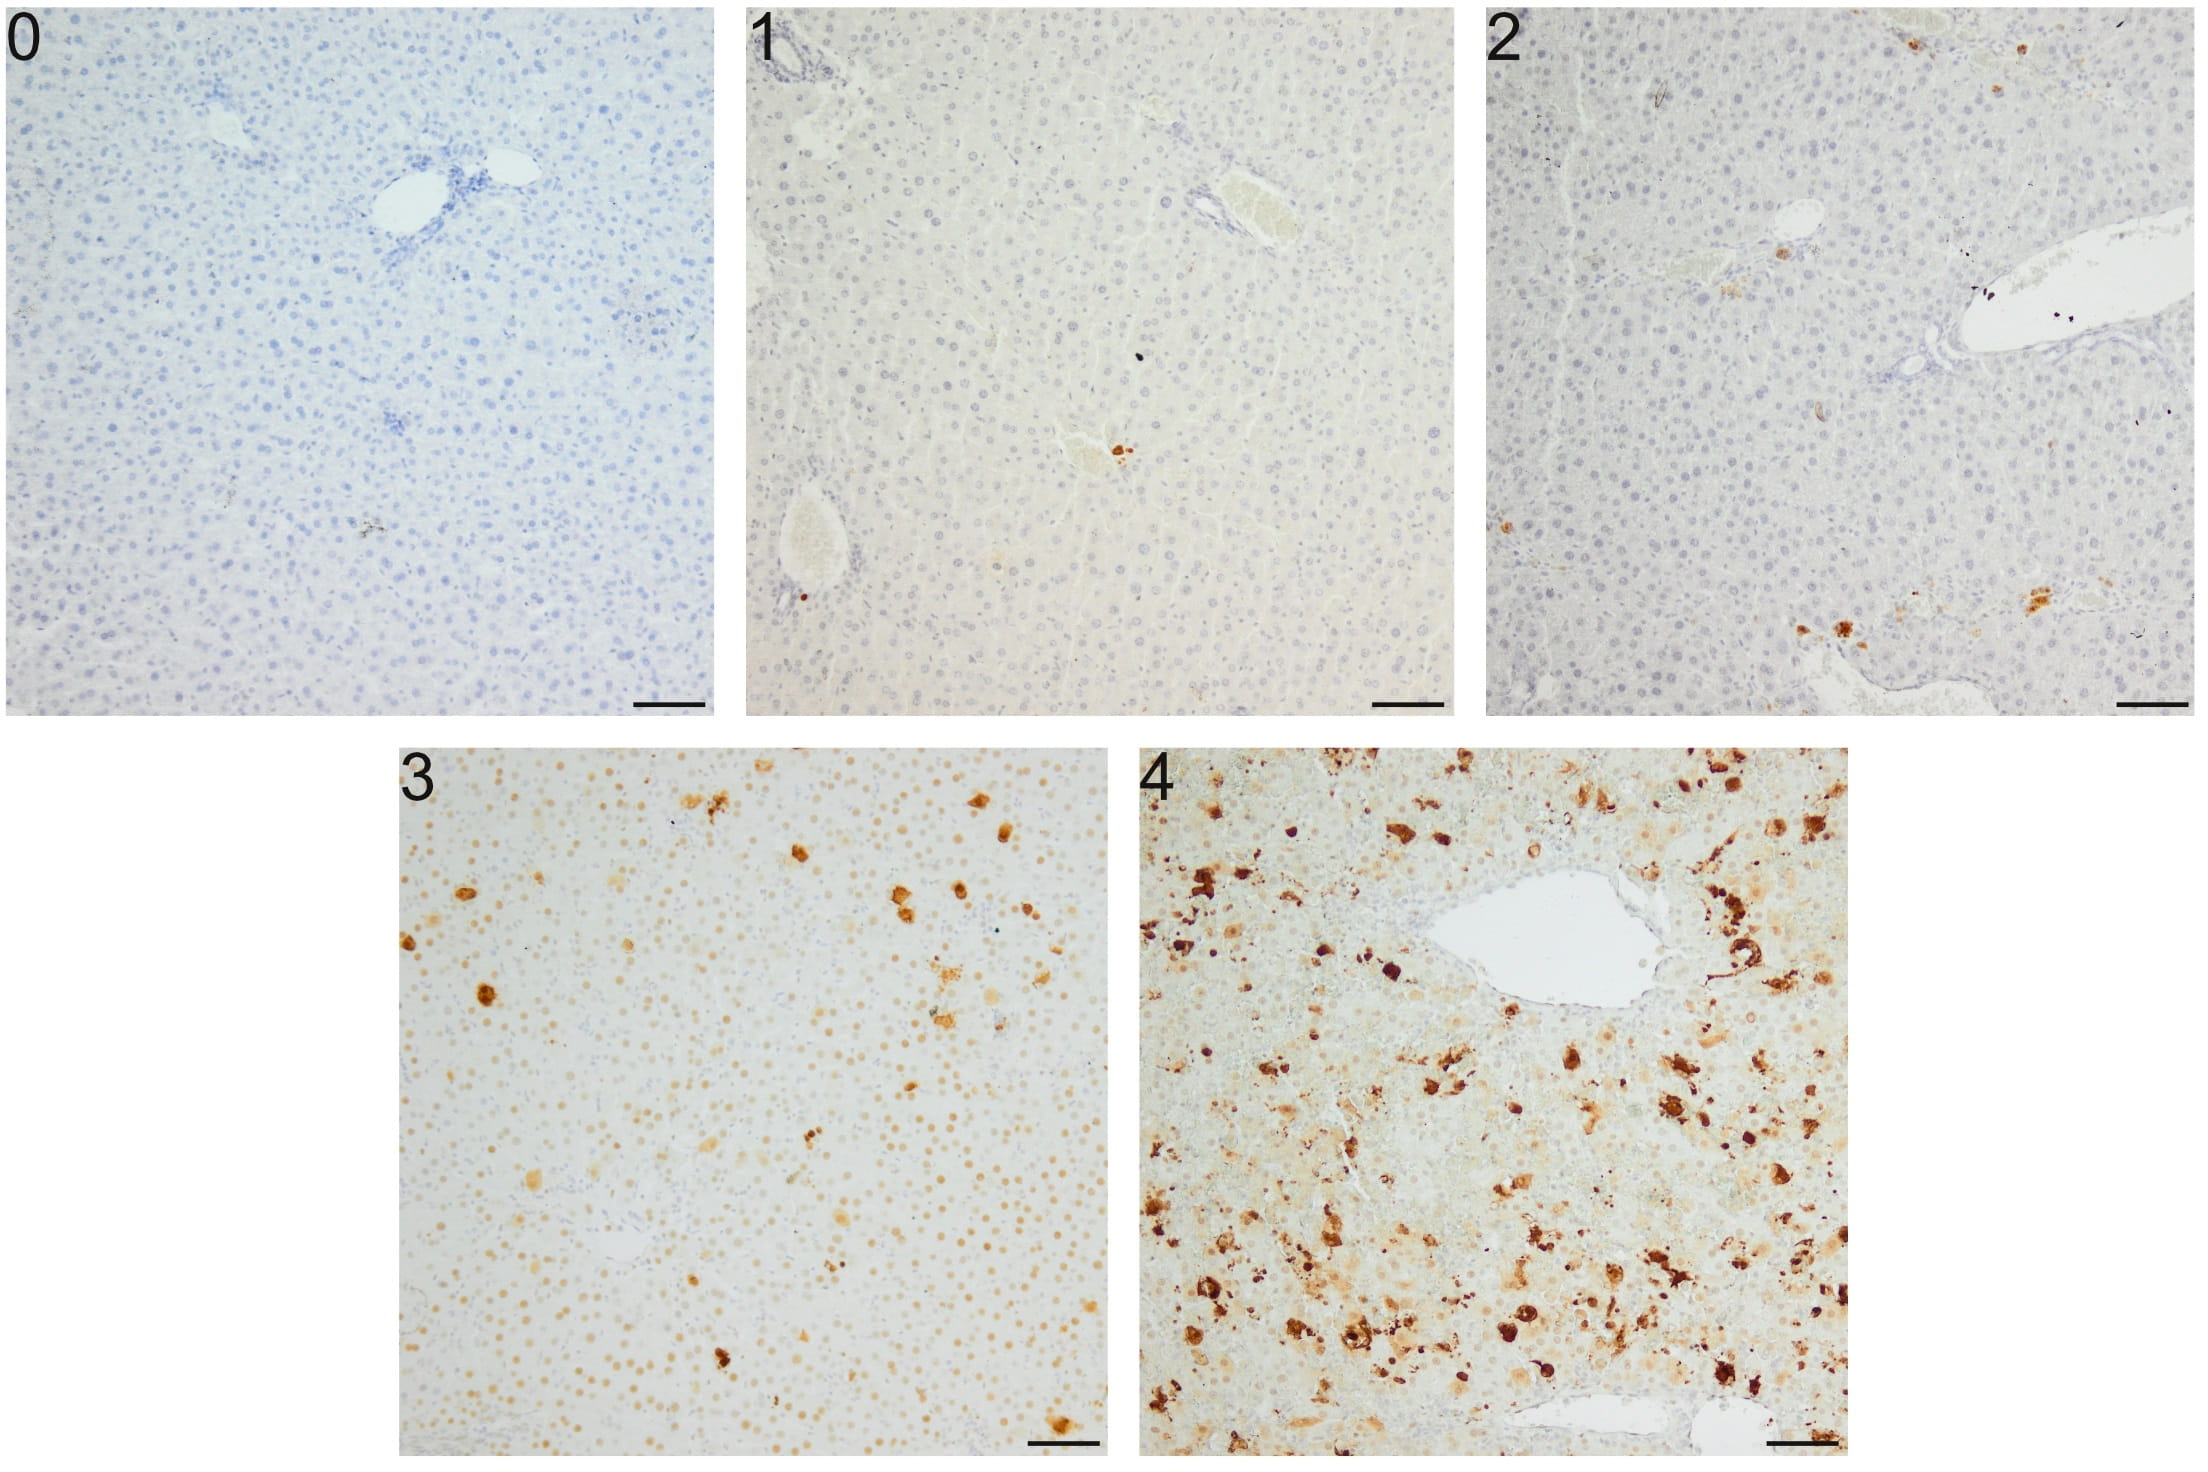 Fig. 1.
Semi-quantitative scale for Cas-3 immunoreactivity analysis in
apoptosis induced in mice by a single i.p. dose of D-GalN. (0) Lack of positive
cells. (1) Few (10) positive cells per field. (2) 10–25 positive cells per
field. (3) 25–50 positive cells per field. (4) 50 positive cells per field;
apoptotic cells form clusters. Repeatability of this scoring method was estimated
via evaluation of intra- and inter-observer correlation. Intra-observer
repeteability was substantial ( = 0.68), and inter-observer
repeteability was moderate ( = 0.43). A semi-quantitive scale was
constructed according to previous recommendations [46]. Mag. 100, the
scale bar represents 50 m.
2.6 RNA Extraction from the Liver
Total RNA was isolated using RNA Extracol reagent (Eurx, Poland) according to
the manufacturer’s instructions. Tissues were homogenized using Unidrive X 1000
homogenizer (CAT, Germany). Nucleic acid concentration and quality were measured
with Nanodrop ND-2000 (Thermo Scientific, USA). RNA was stained with Simply Safe
(Eurx, Poland) and visualized after agarose gel electrophoresis.
2.7 Quantitative Real-Time Polymerase Chain Reaction—qRT-PCR
First-strand cDNA synthesis was performed with total RNA and random hexamer
primers using smART First Strand cDNA Synthesis Kit (Eurx, Poland) according to
the manufacturer’s instructions. Reference genes were selected in separate qPCR
among HPRT1, TFRC, ACTB, TBP, and PPIH genes for rat samples and among HPRT1,
ACTB, GUSB, and PPIH genes for mouse samples. In both cases, ACTB showed a stable
expression in the examined samples and was chosen as an endogenous positive
control.
The expression of TNF, IL-6, Gadd45a, COL1A1, COL3A1, TGF,
CYP2E1, PPAR, C-met, and HGF genes (Table 2, Ref. [47, 48, 49, 50, 51, 52]) was detected
using FastStart Essential DNA Green Master (Roche, Switzerland) in Light Cycler
96 (Roche, Switzerland). All samples were tested in triplicate. Oligonucleotide
primers used for the reactions were purchased from Sigma Aldrich Company (USA).
Each run was completed using melting curve analysis to confirm the specificity of
the amplification and the absence of primer dimers. The relative expression of
the examined genes was calculated according to the 2 method.
Table 2.List of genes evaluated in the study.
| Gene name |
Gene abbreviation |
Function |
Literature |
| Tumor necrosis factor alpha |
TNF- |
Inflammation |
[47] |
| Interleukin 6 |
IL-6 |
| Type I collagen |
COL1A1 |
Liver fibrosis |
[48] |
| Type III collagen |
COL3A1 |
| Transforming growth factor beta |
TGF- |
| Tyrosine-protein kinase Met |
C-met |
Angiogenesis |
[47, 49] |
| Hepatocyte growth factor |
HGF |
| Cytochrome P450 2E1 |
CYP2E1 |
Oxidative stress |
[50] |
| Peroxisome proliferator-activated receptor alpha |
PPAR- |
Lipid metabolism |
[51] |
| Growth arrest and DNA-damage-inducible protein alpha |
Gadd45a |
Carcinogenesis |
[52] |
2.8 Statistical Analysis
Statistical analysis was performed with the STATISTICA 13 software (Version:
13.1, TIBCO Software inc., Palo Alto, CA, USA). If the data
were not normally distributed, an appropriate non-parametric Kruskal-Wallis test
was used. When the data met the assumptions of normality and variance
homogeneity, one-way analysis of variance (ANOVA) with appropriate post-hoc tests
were used. For independent groups, Student’s t-test was also used in
justified cases. The statistical significance of differences was set as
p 0.05.
3. Results
3.1 Blood Smears and Serum Biochemistry
There were some significant differences in the proportion of lymphocyte and
segmented neutrophile subpopulations examined microscopically within the groups
of intoxicated rats and mice (Table 3). We observed an upward trend in the number
of segmented neutrophils in CCl- and D-GalN-treated rats at 12 h and 24 h
and in CCl-treated mice at 24 h and 48 h. These changes were accompanied by
decreases in the lymphocyte counts in CCl-treated rats (at 12 h and 24 h)
and mice (at 12 h, 24 h and 48 h).
Table 3.Percentage of blood cells determined on routine smears taken
from rats and mice intoxicated with CCl and D-GalN.
| Time points |
Lymphocytes [%] |
Monocytes [%] |
Eosinophils [%] |
Band Neutrophils [%] |
Segmented neutrophils [%] |
|
Carbon Tetrachloride Rats |
| Control |
74 (67–79) |
0 (0–0) |
6 (3–7) |
1 (0–3) |
20 (15–25) |
| 12 h |
35 (30–36)*** |
1 (0–2) |
0 (0–0) |
0 (0–0) |
64 (64–68)*** |
| 24 h |
44 (43–46)** |
0 (0–0) |
0 (0–0) |
0 (0–0) |
59 (57–62)** |
| 48 h |
74 (73–76) |
1 (0–3) |
1 (0–2) |
2 (1–3) |
21 (19–23) |
| 7 d |
61 (57–66) |
2 (1–4) |
0 (0–0) |
0 (0–0) |
36 (33–39) |
|
Carbon Tetrachloride Mice |
| Control |
46 (42–47) |
0 (0–2) |
0 (0–1) |
0 (0–1) |
53 (50–58) |
| 12 h |
36 (26–36)* |
0 (0–3) |
0 (0–0) |
0 (0–0) |
64 (61–74) |
| 24 h |
11 (8–16)*** |
1 (0–2) |
0 (0–0) |
0 (0–0) |
88 (82–92)*** |
| 48 h |
24 (22–31)** |
2 (0–3) |
0 (0–0) |
0 (0–1) |
73 (66–78)* |
| 7 d |
40 (35–55) |
0 (0–0) |
0 (0–2) |
0 (0–0) |
60 (43–65) |
|
D-Galactosamine Rats |
| Control |
78 (76–88) |
0 (0–0) |
2 (2–6) |
2 (0–5) |
15 (8–18) |
| 12 h |
58 (52–74) |
0 (0–0) |
0 (0–0) |
0 (0–0) |
42 (26–48)* |
| 24 h |
63 (48–79) |
0 (0–2) |
0 (0–1) |
0 (0–0) |
37 (18–52) |
| 48 h |
74 (58–83) |
1 (0–5) |
2 (1–2) |
0 (0–0) |
24 (15–35) |
| 7 d |
69 (69–69) |
3 (3–3) |
1 (1–1) |
1 (1–1) |
26 (26–26) |
|
D-Galactosamine Mice |
| Control |
62 (48–62) |
3 (0–4) |
0 (0–2) |
0 (0–1) |
38 (31–49) |
| 12 h |
66 (54–81) |
0 (0–1) |
0 (0–0) |
0 (0–0) |
33 (19–46) |
| 24 h |
76 (67–85) |
0 (0–2) |
0 (0–0) |
0 (0–1) |
24 (15–30) |
| 48 h |
68 (67–74) |
1 (0–2) |
0 (0–0) |
0 (0–1) |
30 (26–31) |
| 7 d |
66 (57–70) |
1 (1–2) |
0 (0–1) |
0 (0–0) |
33 (27–42) |
| Data are presented as median (min–max). No basophils were identified in blood
smears; *p 0.05, **p 0.01, ***p
0.001—statistically significant as compared to controls; n = 3. |
We found increasing values of some serum parameters between 12 h and 48 h,
namely ALT and AST, mostly in rats and mice intoxicated with CCl and in
rats treated with D-GalN (Table 4). In rats treated with CCl, we observed
elevated activity of ALT, which increased by 8- and 11-fold at 12 h and 24 h,
respectively, and by 25-fold at 48 h. In the corresponding group of mice, an
increase of ALT was noticed at 12 h (225-fold), 24 h (231-fold), and 48 h
(25-fold).
Table 4.Changes in the serum parameters of rats and mice intoxicated
with CCl and D-GalN.
| Time points |
Alanine transaminase (ALT) [U/L] |
Aspartate transaminase (AST) [U/L] |
Alkaline phosphatase (ALP) [U/L] |
Total Protein [g/dL] |
|
Carbon Tetrachloride Rats |
| Control |
50.7 (49.3–66.2) |
201.6 (131.4–260.4) |
229.5 (172.5–289.4) |
6.2 (5.7–6.3) |
| 12 h |
441.2 (413.2–469.1)*** |
314.6 (234.4–394.7) |
241.1 (225.1–358.1) |
6.4 (5.8–6.9) |
| 24 h |
563.6 (516.3–611.0)*** |
563.8 (447.5–680.0)* |
235.1 (194.6–275.5) |
5.5 (5.1–5.9) |
| 48 h |
1301 (888.7–1713.3)* |
1060.3 (595.7–1524.9) |
559 (516.9–601.1) |
5.8 (5.7–5.9) |
| 7 d |
54.1 (43.9–81.4)# |
140.9 (139.3–166.1) |
167.2 (163.4–237) |
5.9 (5.8–6.5) |
|
Carbon Tetrachloride Mice |
| Control |
137.1 (128.5–274) |
989 (923.3–1054.7) |
65.5 (54–79.3) |
4.7 (4.6–5) |
| 12 h |
30957.5 (29795–32120)*** |
21258.5 (20663.5–23761)*** |
250.2 (151–268) |
5.5 (5.1–6) |
| 24 h |
31700 (31500–38600)*** |
3532.5 (3048–4136)** |
270.5 (215.4–316.3) |
4.8 (4.6–5.3) |
| 48 h |
3447.4 (2878.2–3770.3)*** |
3314.3 (2282.5–4585.6) |
288.6 (276.2–295.3) |
4.1 (4–4.7) |
| 7 d |
61 (30.4–73.2)## |
522.5 (429.1–539)# |
133.9 (14.4–159.3) |
5.1 (4.8–6) |
|
D-Galactosamine Rats |
| Control |
51.6 (48.7–61.5) |
198.4 (178–220.2) |
202 (154.3–268.9) |
6.2 (6–6.3) |
| 12 h |
415.1 (380.4–719.2)* |
476.1 (432.1–611.5)** |
227.3 (213.5–376.3) |
6.1 (5.5–6.5) |
| 24 h |
2509.1 (1889.4–3128.8)* |
2280.1 (1721.8–2838.5)* |
264.3 (257–474.7) |
5.7 (5.6–5.9) |
| 48 h |
1833.5 (1707–1960.1)*** |
1445.8 (1439.7–1452)*** |
407.7 (357.9–715.9) |
5.2 (4.7–5.4) |
| 7 d |
58.3 (50.7–66)### |
98.3 (88.3–105)### |
155.5 (143–199.6) |
6.1 (5.8–6.1) |
|
D-Galactosamine Mice |
| Control |
143.6 (134.6–206.8) |
1049.6 (636–2328.7) |
114.3 (105.6–119.6) |
4.5 (4.4–5.1) |
| 12 h |
176.5 (161.1–207.8) |
1057.9 (854.9–1334) |
278.2 (235.5–288.4) |
5.1 (4.6–6) |
| 24 h |
194.7 (162.4–227) |
805.9 (715.7–1148.1) |
151.4 (150.8–172.1) |
4.5 (4.1–4.8) |
| 48 h |
187.3 (152.7–221.9) |
1054.2 (890.2–1938.6) |
155.5 (133.7–168.2) |
3.8 (3.5–3.9) |
| 7 d |
136 (110.3–138.3) |
702.7 (685.9–719.6) |
209.3 (205.2–236.3) |
4.5 (4.2–5.1) |
| Data are presented as median (min-max). *p 0.05, **p
0.01, ***p 0.001—statistically significant as compared to
controls; #p 0.05, ##p 0.01, ###p
0.001—statistically significant as compared to 48 h; n = 3. |
In D-GalN-intoxicated rats, elevated activities of aminotransferases were
observed at 12 h (8-fold increase), 24 h (48-fold increase), and 48 h (35-fold
increase) for ALT and at 24 h (11-fold increase) and 48 h (7-fold increase) for
AST.
Alkaline phosphatase increased especially in CCl-treated mice between 12 h
and 48 h (3–4 fold) and, to a lower extent, in CCl-treated rats (48 h) and
D-GalN-treated mice (12 h) and rats (48 h). Total protein concentration remained
unchanged in all experimental groups and at all time points (Table 4).
3.2 Histopathological Findings
In the livers of rats treated with CCl, we found the first signs of damage
12 h after a single intraperitoneal injection, namely minor infiltration around
central veins and ballooning degeneration in hepatocytes of zone 3 of the hepatic
acini. The area of liver parenchyma occupied by ballooning degeneration was
8–20% at 12 h, then increased to 20–80% at 24 h, and decreased to 3% at
48 h. Liver necrosis around the central veins occurred 24 h after CClinjection and persisted to 48 h. Liver histology returned to the initial state
7 days after intoxication with the exception of persistent hemosiderin-laden
macrophage clusters and a few small lymphocyte clusters (Fig. 2, Table 5).
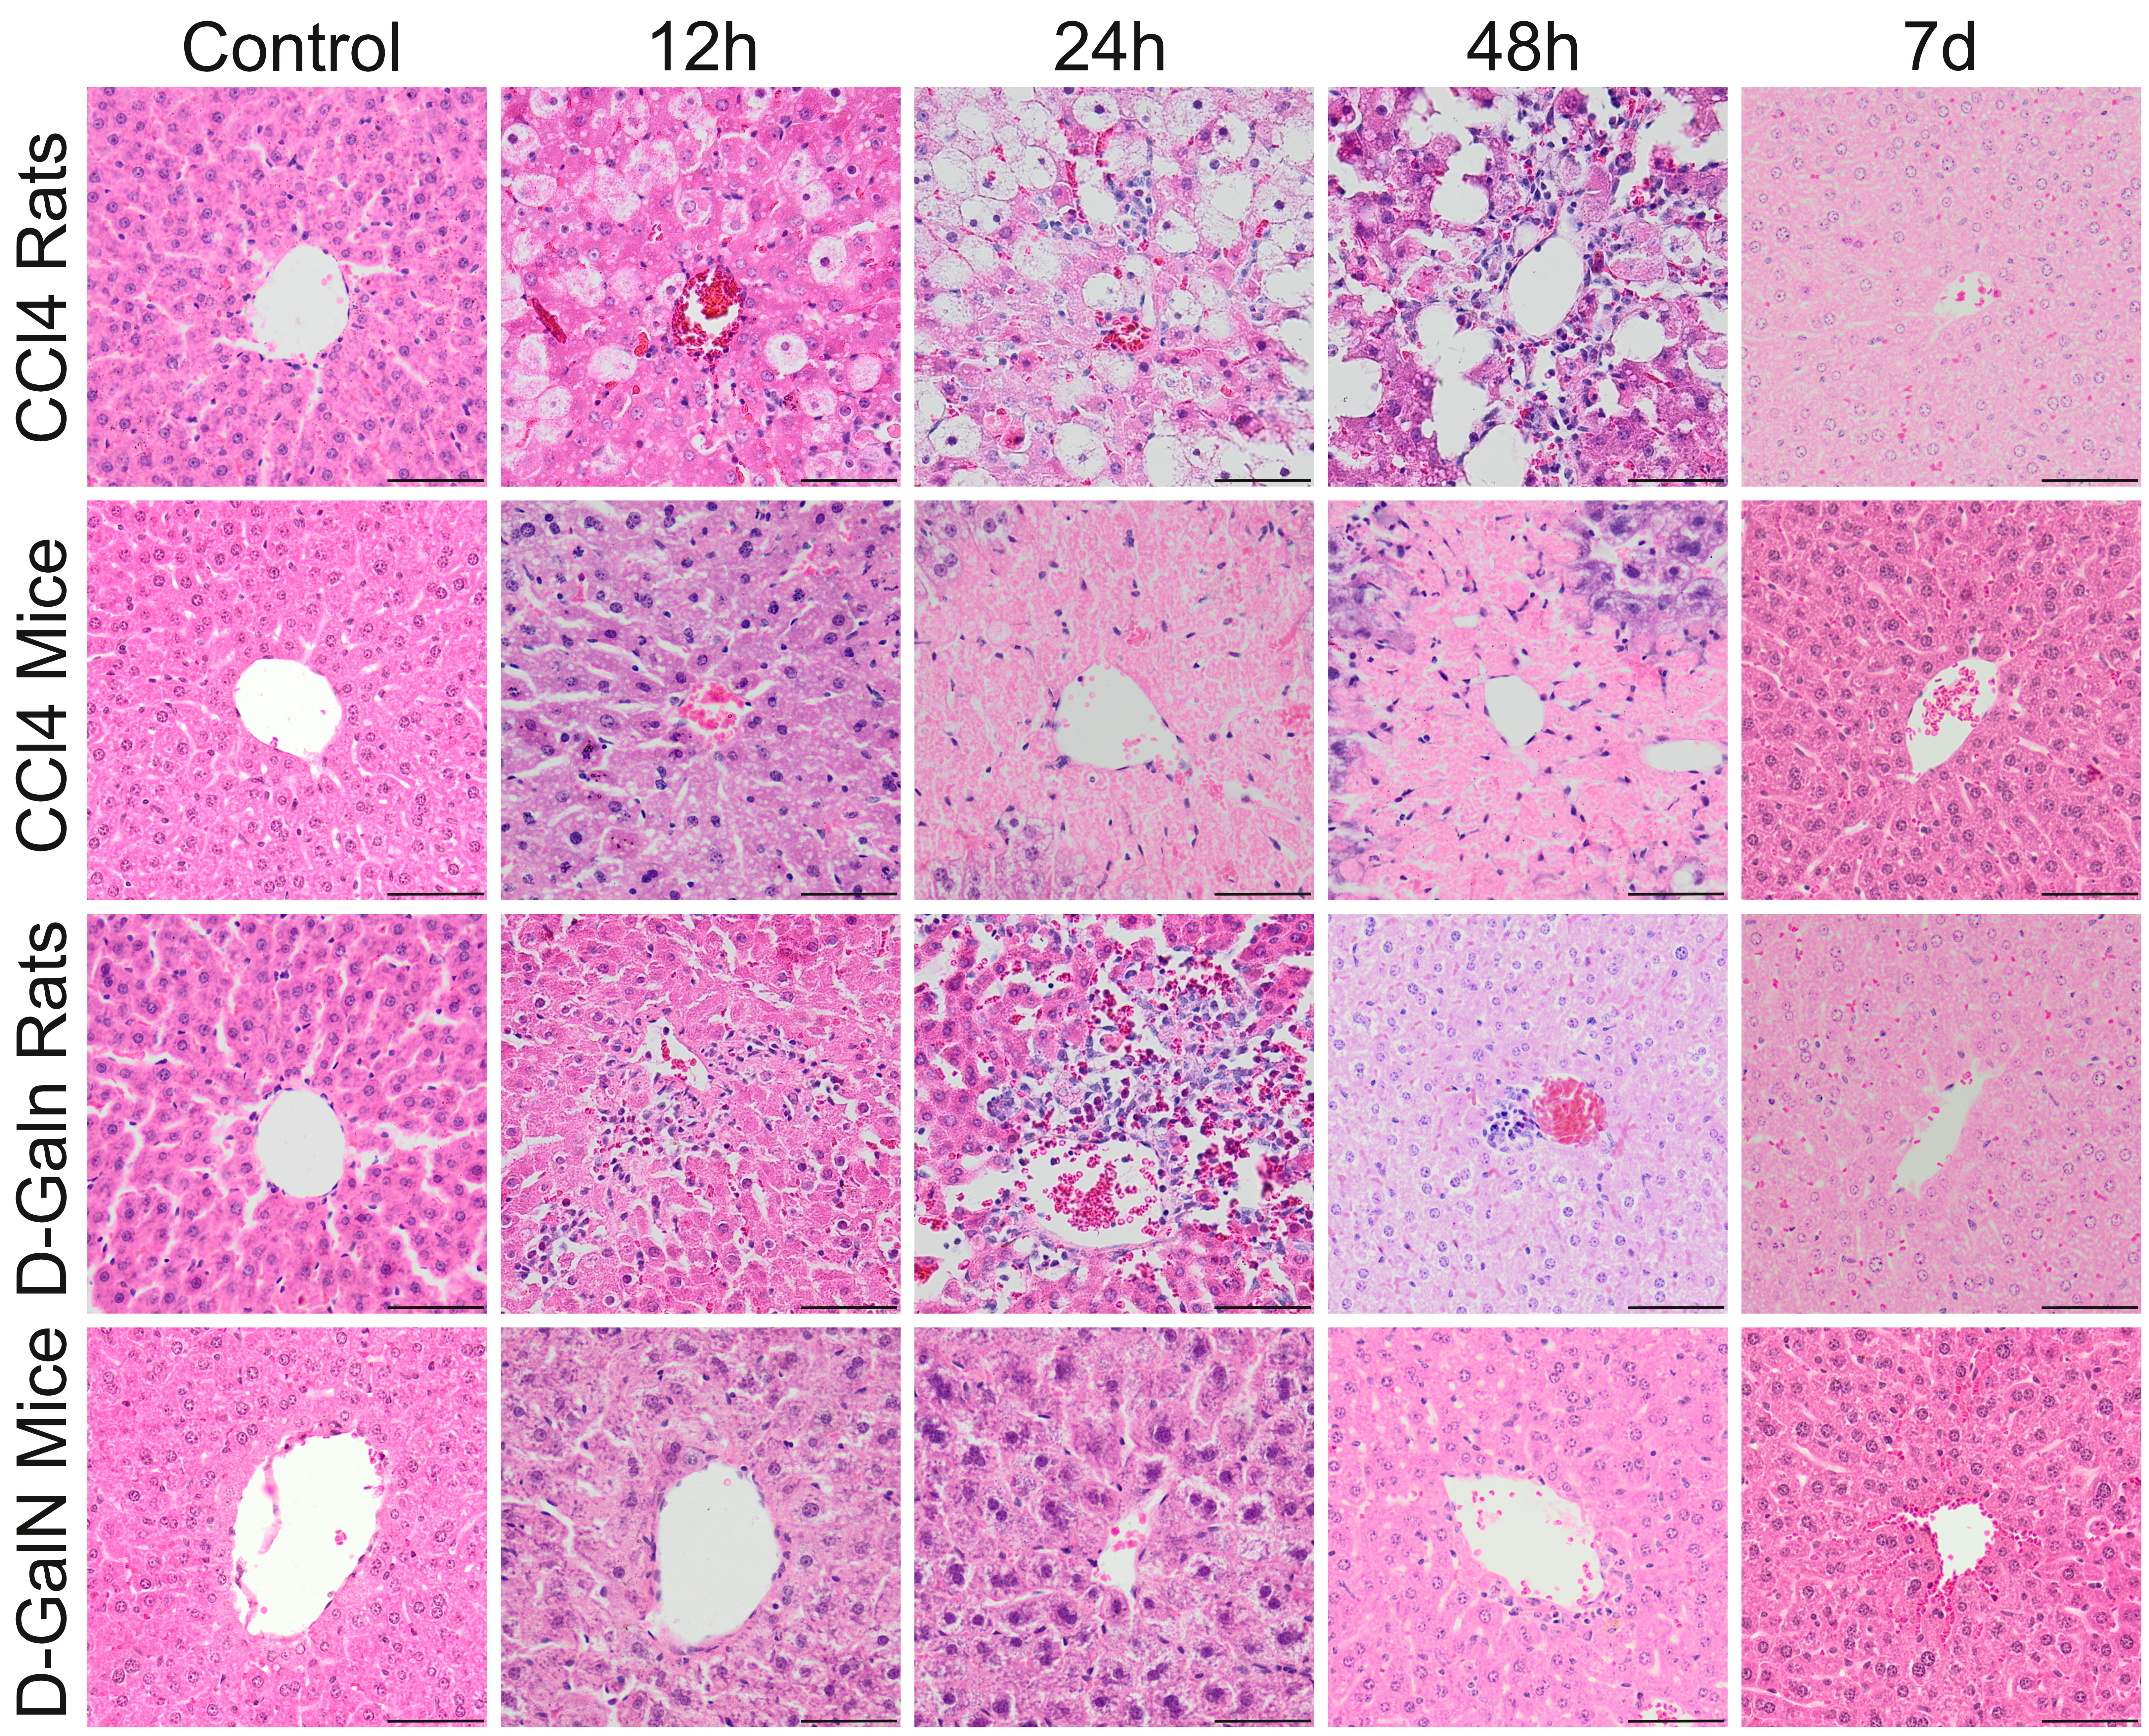 Fig. 2.
Histopathological changes in zone 3 of the liver acinus in rats
and mice after a single CClor D-GalN injection. In CCl treated
rats, pericentral necrosis (pinkish mass) surrounded by foci of ballooning cell
degeneration developed around central veins between 12 h and 48 h. In CCl
injected mice, massive pericentral necrosis occupying the zone 3, and partially
also zone 2 of the liver acici were visible at 24 h and 48 h. In D-GalN
administered rats, inflammatory infiltrate around central veins was observed from
12 h, to 48 h. In D-GalN intoxicated mice: only minor pathological changes were
observed at 12 h and 24 h around central veins. At the end of observation (7 day)
pathological changes were considerably reduced in CCl treated mice and no
pathological changes were observed in other groups. Mag. 200, the scale
bar represents 40 m; H&E staining.
Table 5.Histopathological assessment, cell proliferation activity, and
Cas-3 immunoreactivity in the livers of rats and mice intoxicated with CCl
and D-GalN.
| Time points |
Histopathological grading (0–4) |
Proliferation activity (positive cells per field) |
Cas-3 (0–4) |
| Rats |
Mice |
Rats |
Mice |
Rats |
Mice |
|
Carbon Tetrachloride |
| Control |
0 |
0 |
43.5 (22.8–48.8) |
43.8 (9.4–45) |
0 |
0 |
| 12 h |
2 |
4 |
94.3 (68.6–341.3) |
146.2 (126–148.9)* |
1 |
3 |
| 24 h |
2 |
4 |
181.9 (128.7–235)* |
109.2 (84.2–178.4)* |
1 |
0 |
| 48 h |
4 |
4 |
487.8 (395.3–580.2)** |
397.8 (270.4–401.9)** |
1 |
1 |
| 7 d |
0 |
1 |
127.5 (33.7–133.7)# |
38.6 (29.9–55.2)## |
0 |
2 |
|
D-Galactosamine |
| Control |
0 |
0 |
35.9 (21.3–65.1) |
23 (21.6–28.1) |
0 |
0 |
| 12 h |
2 |
0 |
148.1 (147.1–239.4)* |
42 (32.2–49.8)* |
1 |
1 |
| 24 h |
3 |
0 |
200.7 (130.2–203.4)** |
47.8 (40.4–74)* |
2 |
1 |
| 48 h |
2 |
1 |
477.9 (250.1–579)* |
82 (72.3–118.3)** |
4 |
2 |
| 7 d |
0 |
0 |
95.7 (90.8–100.7)# |
31.1 (26.3–78.5) |
0 |
0 |
| Histopathological grading and Cas-3 expressions are the median of three animals.
Cell proliferation is expressed as the mean number of positive cells per field
(min-max). *p 0.05, **p 0.01, ***p
0.001—statistically significant as compared to controls; #p 0.05,
##p 0.01—statistically significant as compared to 48 h. |
After a single CCl injection, mouse livers showed moderate inflammatory
infiltration and massive pericentral necrosis occupying the area of zone 3, and
partially also zone 2, of each hepatic acinus (in total about 60% of the area of
the entire acinus), at 12 h, 24 h, and 48 h. At the end of experiment, most of
the relevant signs of acute liver injury receded. There were only a few clusters
of lymphocytes around central veins and in periportal areas as well as signs of
cholestasis (Fig. 2, Table 5).
In the livers of rats treated with D-GalN, we observed single hepatocyte death,
acidophilic bodies, and minor and moderate lymphocytic inflammatory infiltration
around central veins after 12 h, 24 h and 48 h. A few lymphocyte and macrophage
clusters containing hemosiderin were visible on day 7 (Fig. 2, Table 5).
In D-GalN intoxicated mice, the first histopathological signs of liver injury
appeared at 24 h and included small diffuse ballooning degeneration and minor
granulocyte infiltration. No pathological changes were observed 7 days after
intoxication (Fig. 2, Table 5).
Fibrous expansion corresponding to Ishak stage 1 was observed only in
CCl–treated mice 7 days after injection (Fig. 3) but not in other
experimental groups.
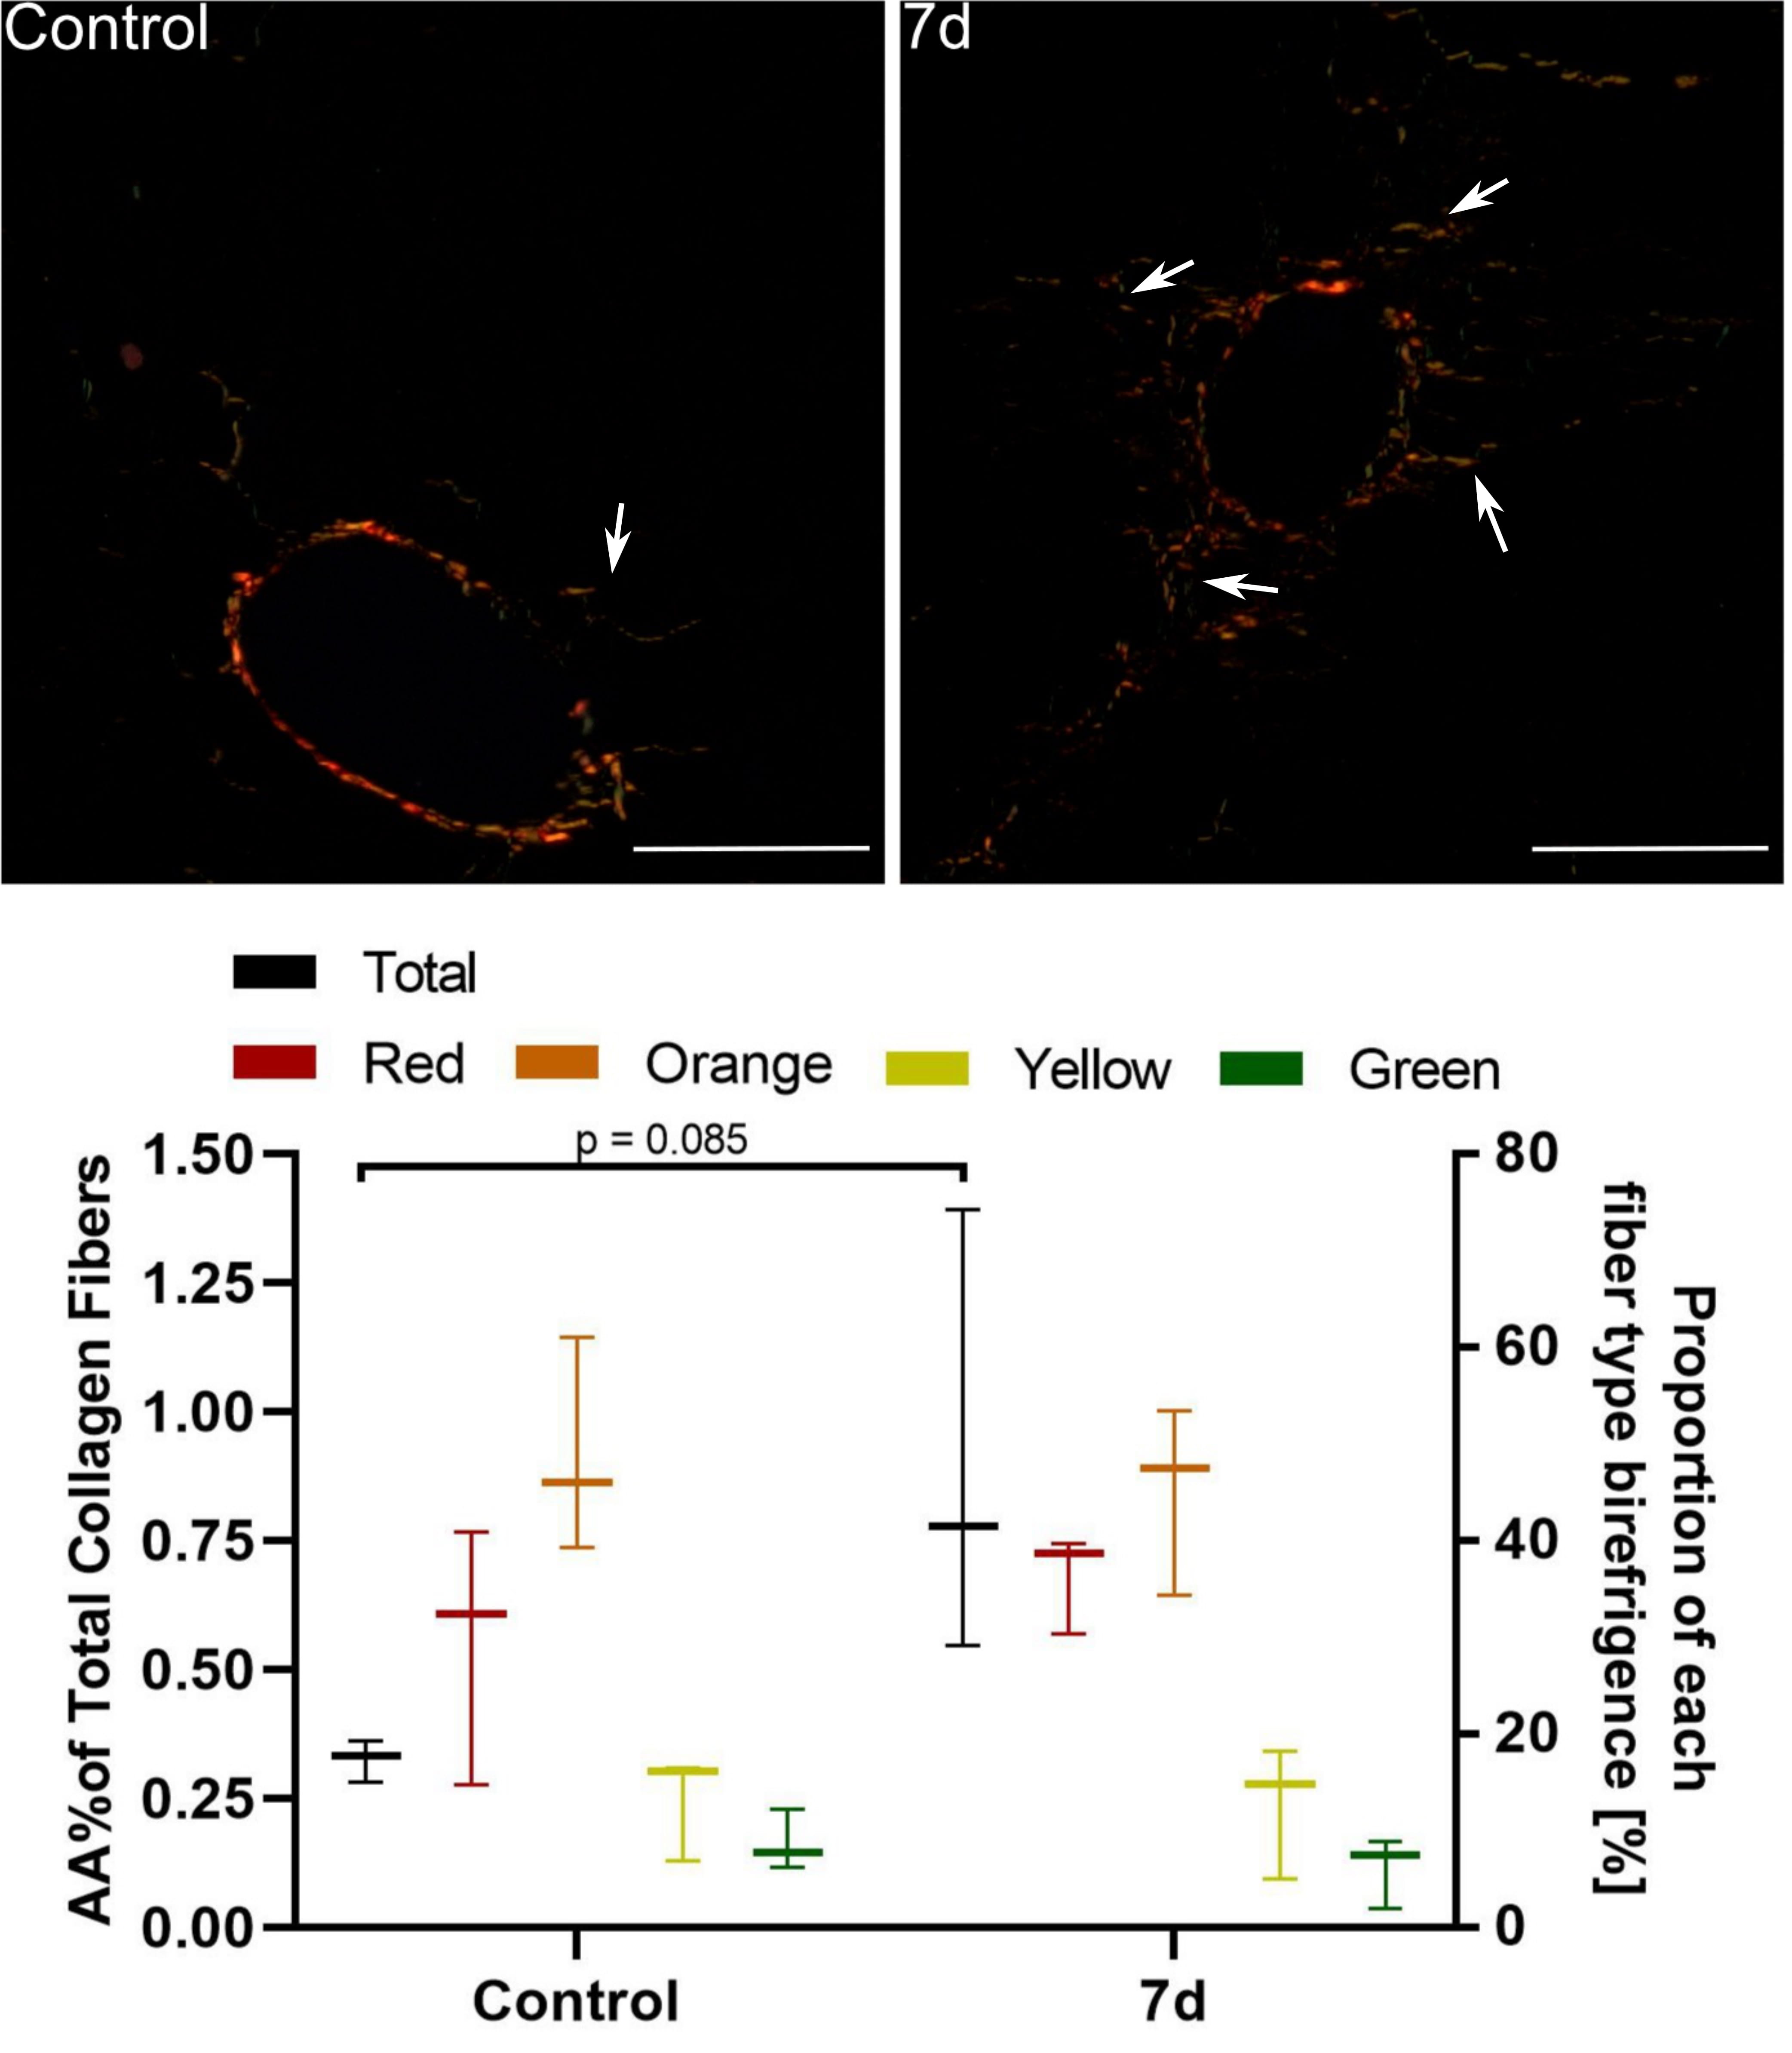 Fig. 3.
Assessment of periportal fibrosis in mice 7 d after a single
CCl injection. Upper images: Sirius red staining under polarised light. In
control mice only thin, individual collagen fibers were observed around portal
spaces. 7 d after CCl injection we noted fibrous expansion from portal (and
pericentral; not shown) areas visible as numerous short-growing fibrous septa
(white arrows) corresponding to Ishak stage 1. Mag. 200; the scale bar
represents 40 m. Lower graph: Collagen fibre hues under polarized
light. Red, orange, yellow, and green indicate their decreasing thickness. The
percentage area of collagen fibres increased 2-fold, but it was statistically
insignificant; n = 3.
3.3 Proliferation Activity
In CCl intoxicated groups, there was a 4-fold increase in the number of
Ki-67+ cells around central veins at 24 h as well as a massive expansion of
proliferating parenchymal cells around the portal triads in rats (11-fold) and
mice (9-fold) at 48 h (Fig. 4, Table 5).
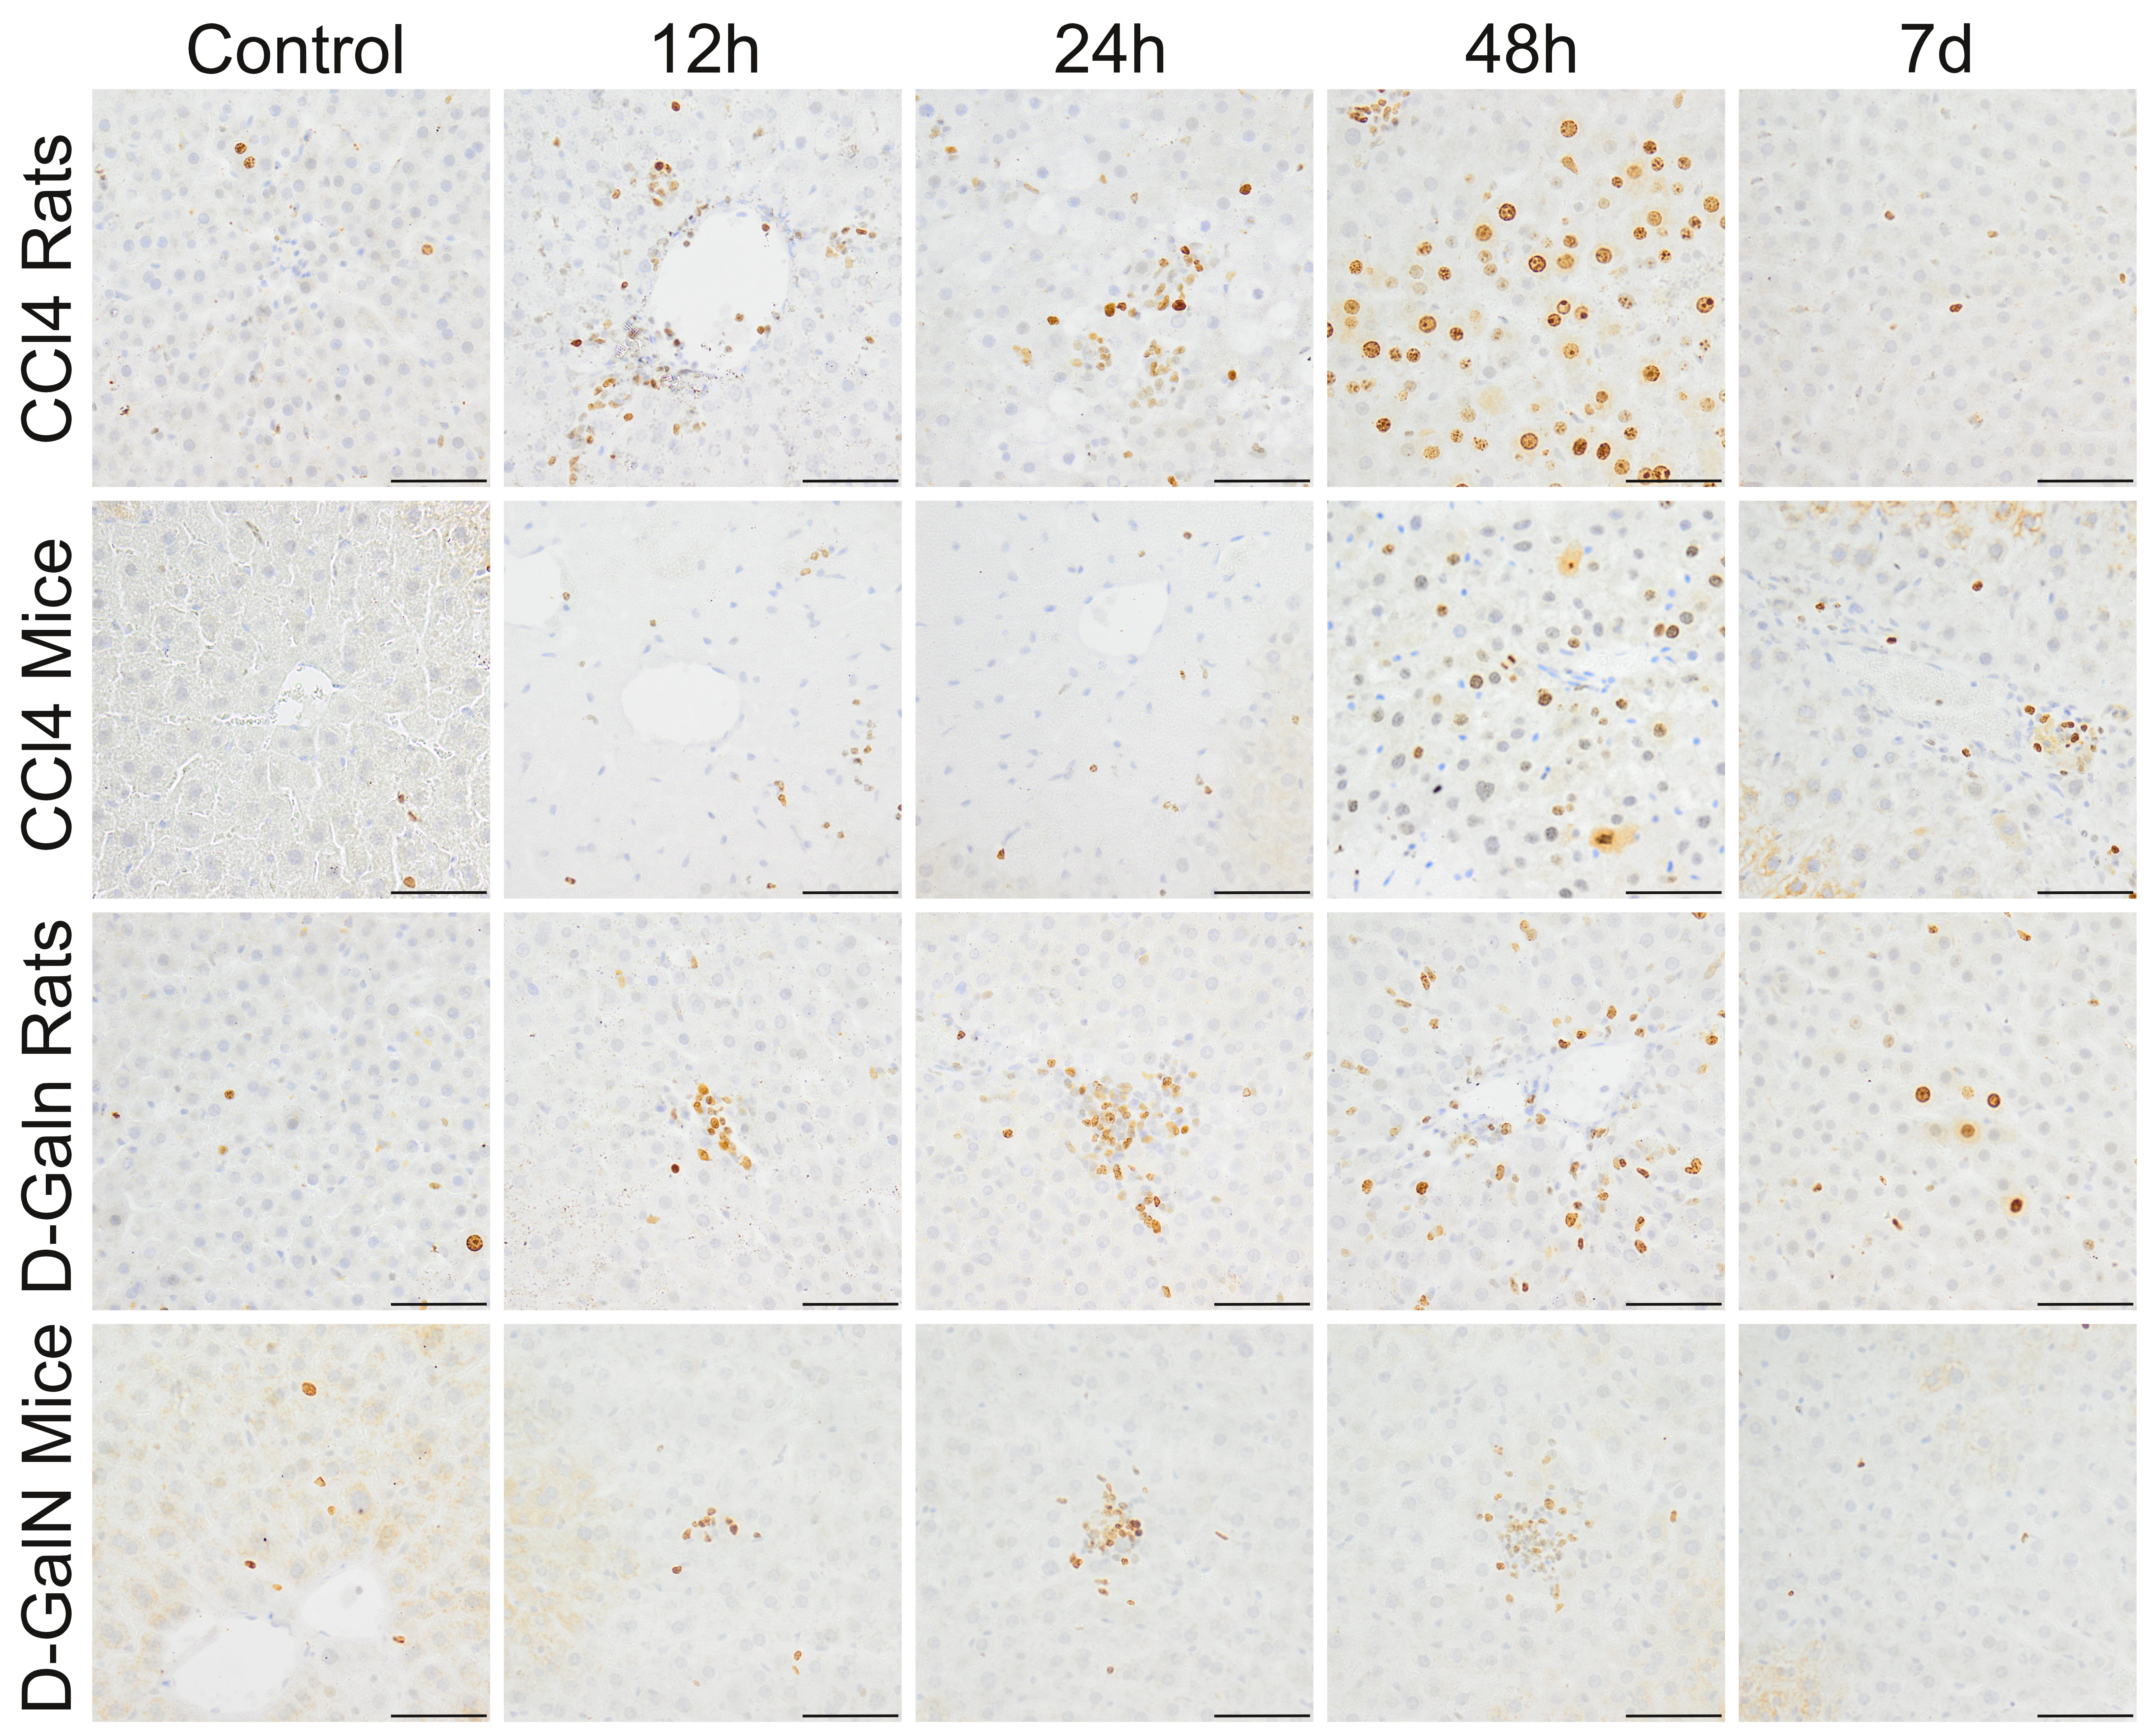 Fig. 4.
Ki67+ cells in the livers of rats and mice treated with
CCl and D-GalN. Mag. 200; the scale bar represents 40
m.
In D-GalN intoxicated groups, significant increases were observed in the number
of Ki-67+ cells around central veins at 12 h and 24 h in rats (4–5-fold) and
mice (2-fold). Statistically significant increases were observed in the number of
proliferating cells distributed in the hepatic acini at 48 h in rats (13-fold)
and mice (3-fold) (Fig. 4, Table 5).
3.4 Cleaved Caspase-3 Expression
In the livers of rats treated with CCl injection, a few Cas-3+ cells were
observed at 12 h and 24 h. In mice, 25–50 Cas-3+ cells were localized mainly
around the central veins at 12 h, and the number of these cells decreased with
time (Fig. 5, Table 5).
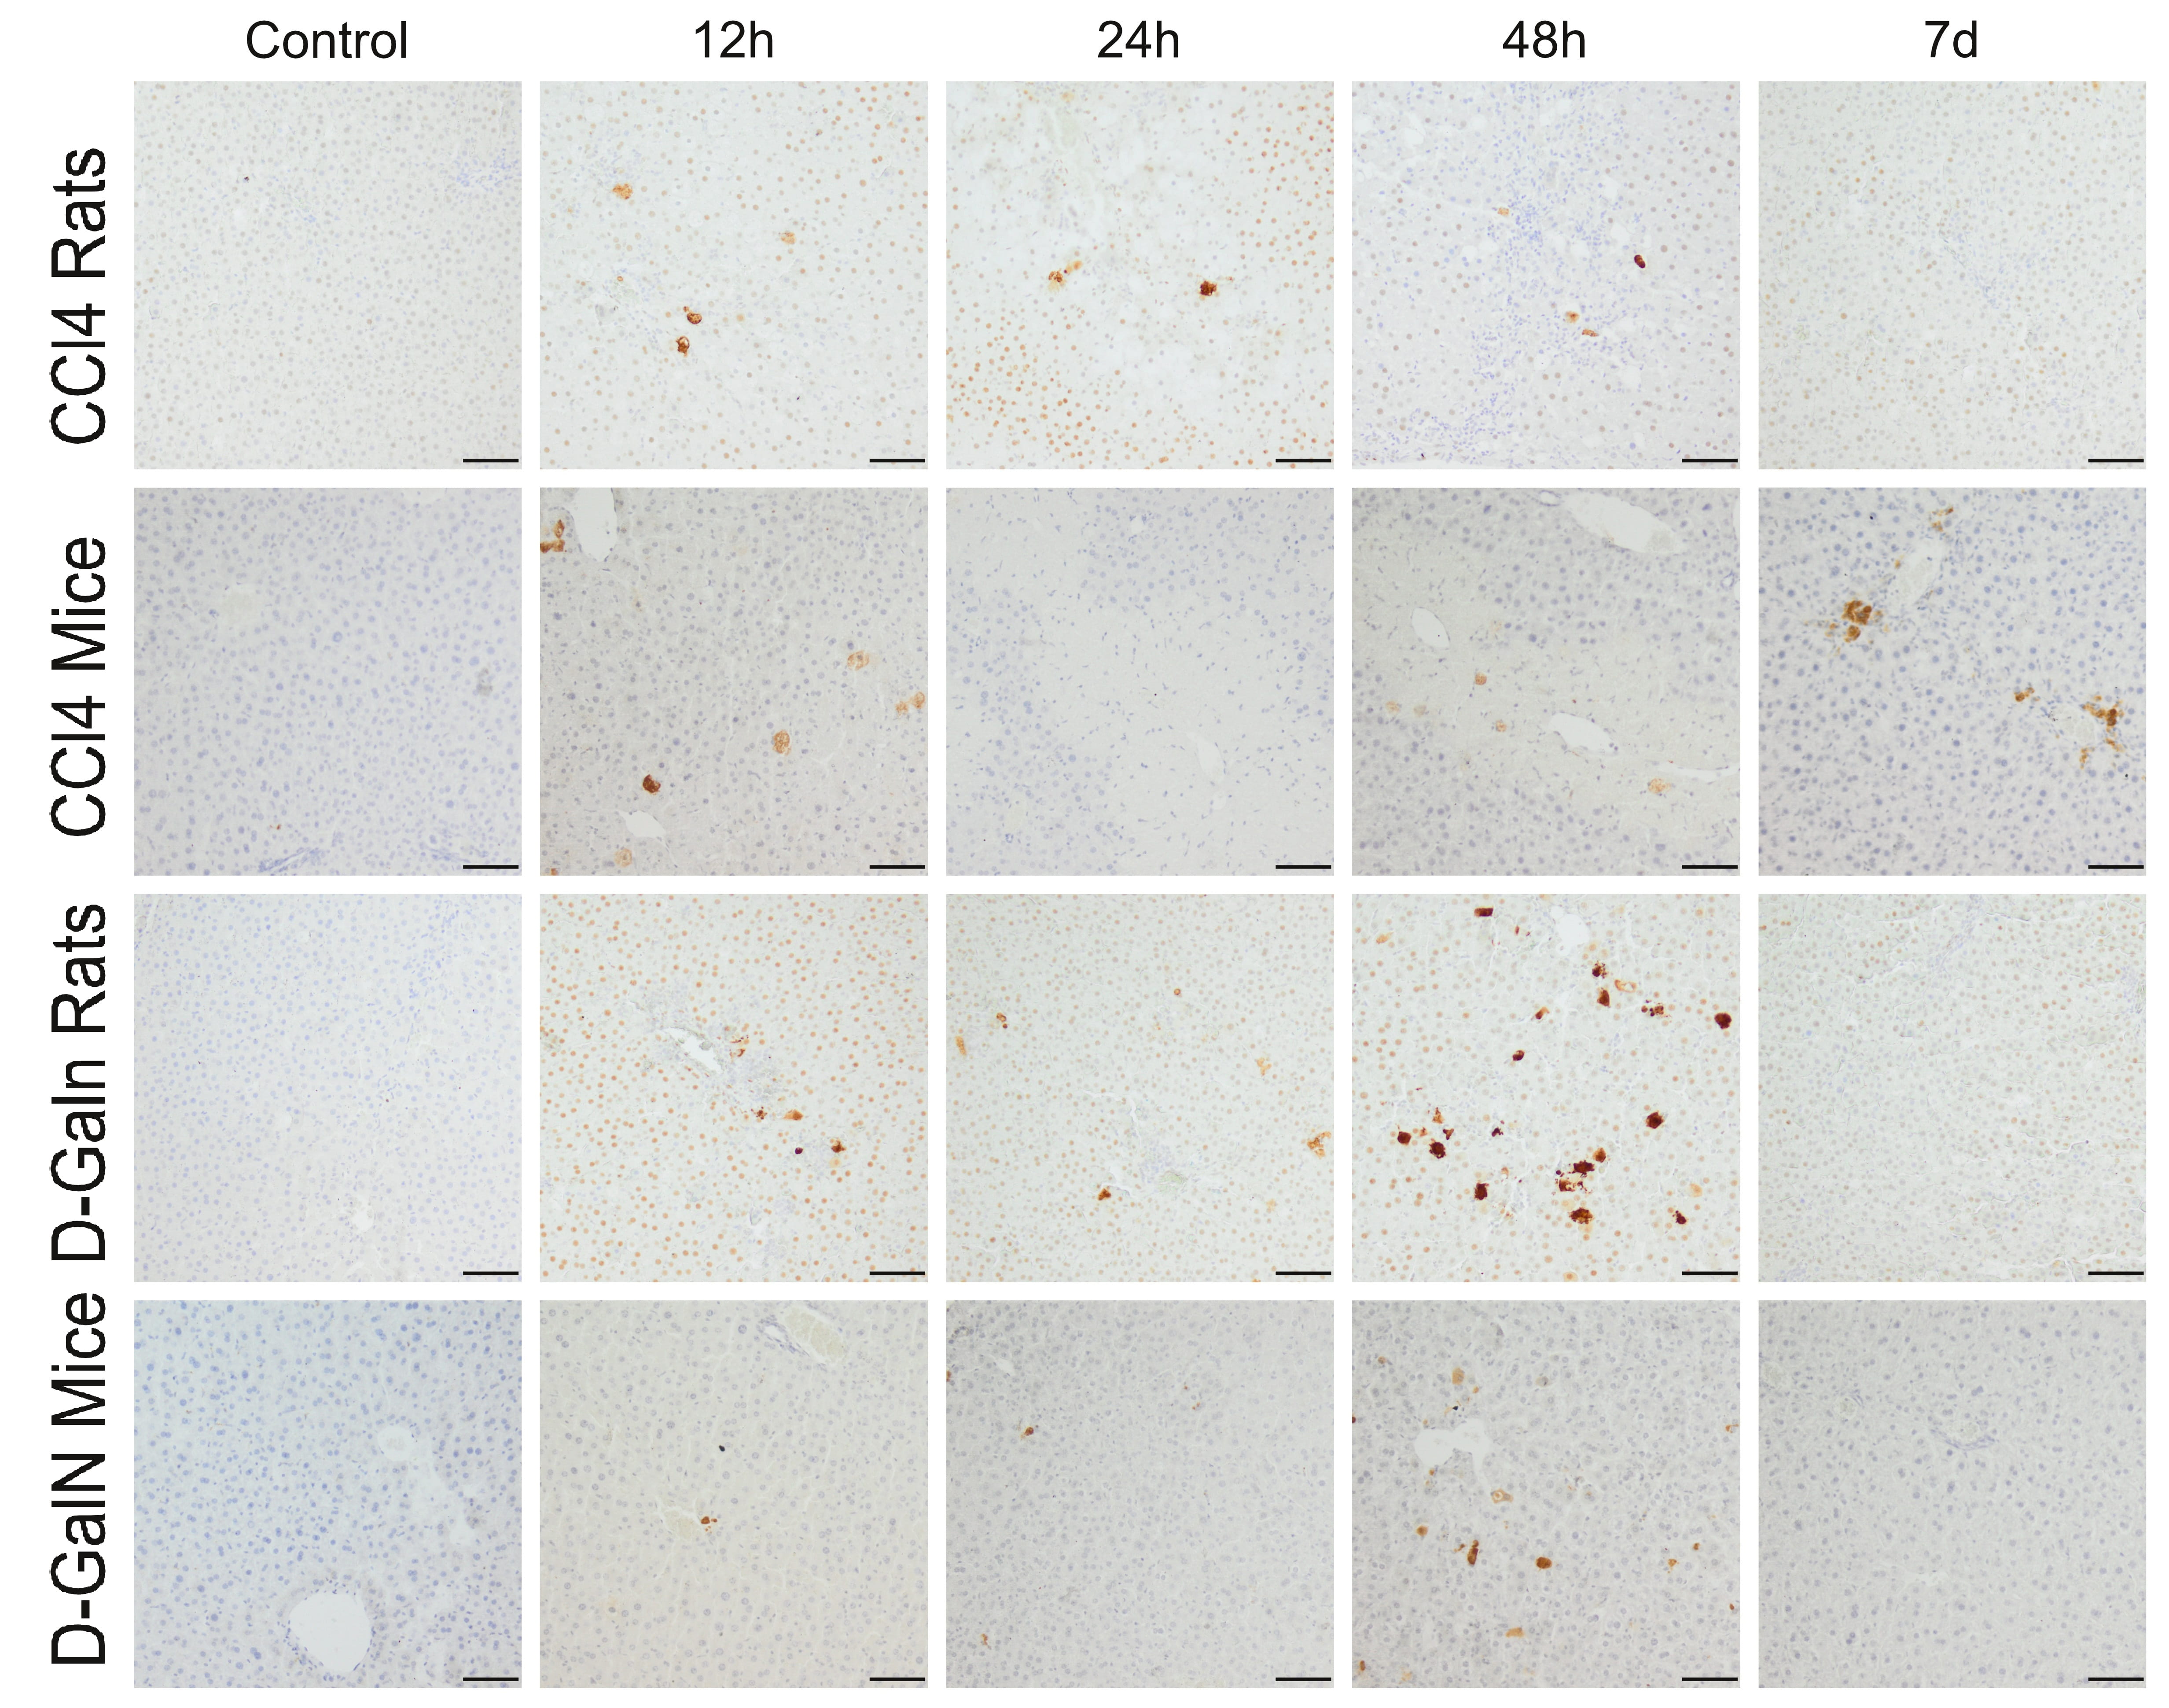 Fig. 5.
Immunodetection of apoptotic cells in the liver of rats and mice
treated with CCl and D-GalN. Mag. 100; the scale bar represents
50 m.
In D-GalN-intoxicated animals, a few apoptotic cells were observed at 12 h and
24 h, and their number in the hepatic acini increased significantly at 48 h,
especially in rats, and then decreased significantly on day 7 (Fig. 5, Table 5).
3.5 Gene Expression
We observed a similar pattern of COL3A1 expression in rats and mice treated with
CCl. The expression of COL3A1 showed an upward trend between 12 h and day
7, but the differences were not statistically significant. There were no
differences in COL3A1 mRNA expression between time points in rats treated with
D-GalN. In D-GalN-treated mice, we observed two peaks: an upregulation at 12 h
(p 0.05) and an increase between 24 h and day 7 (p
0.05) (Fig. 6).
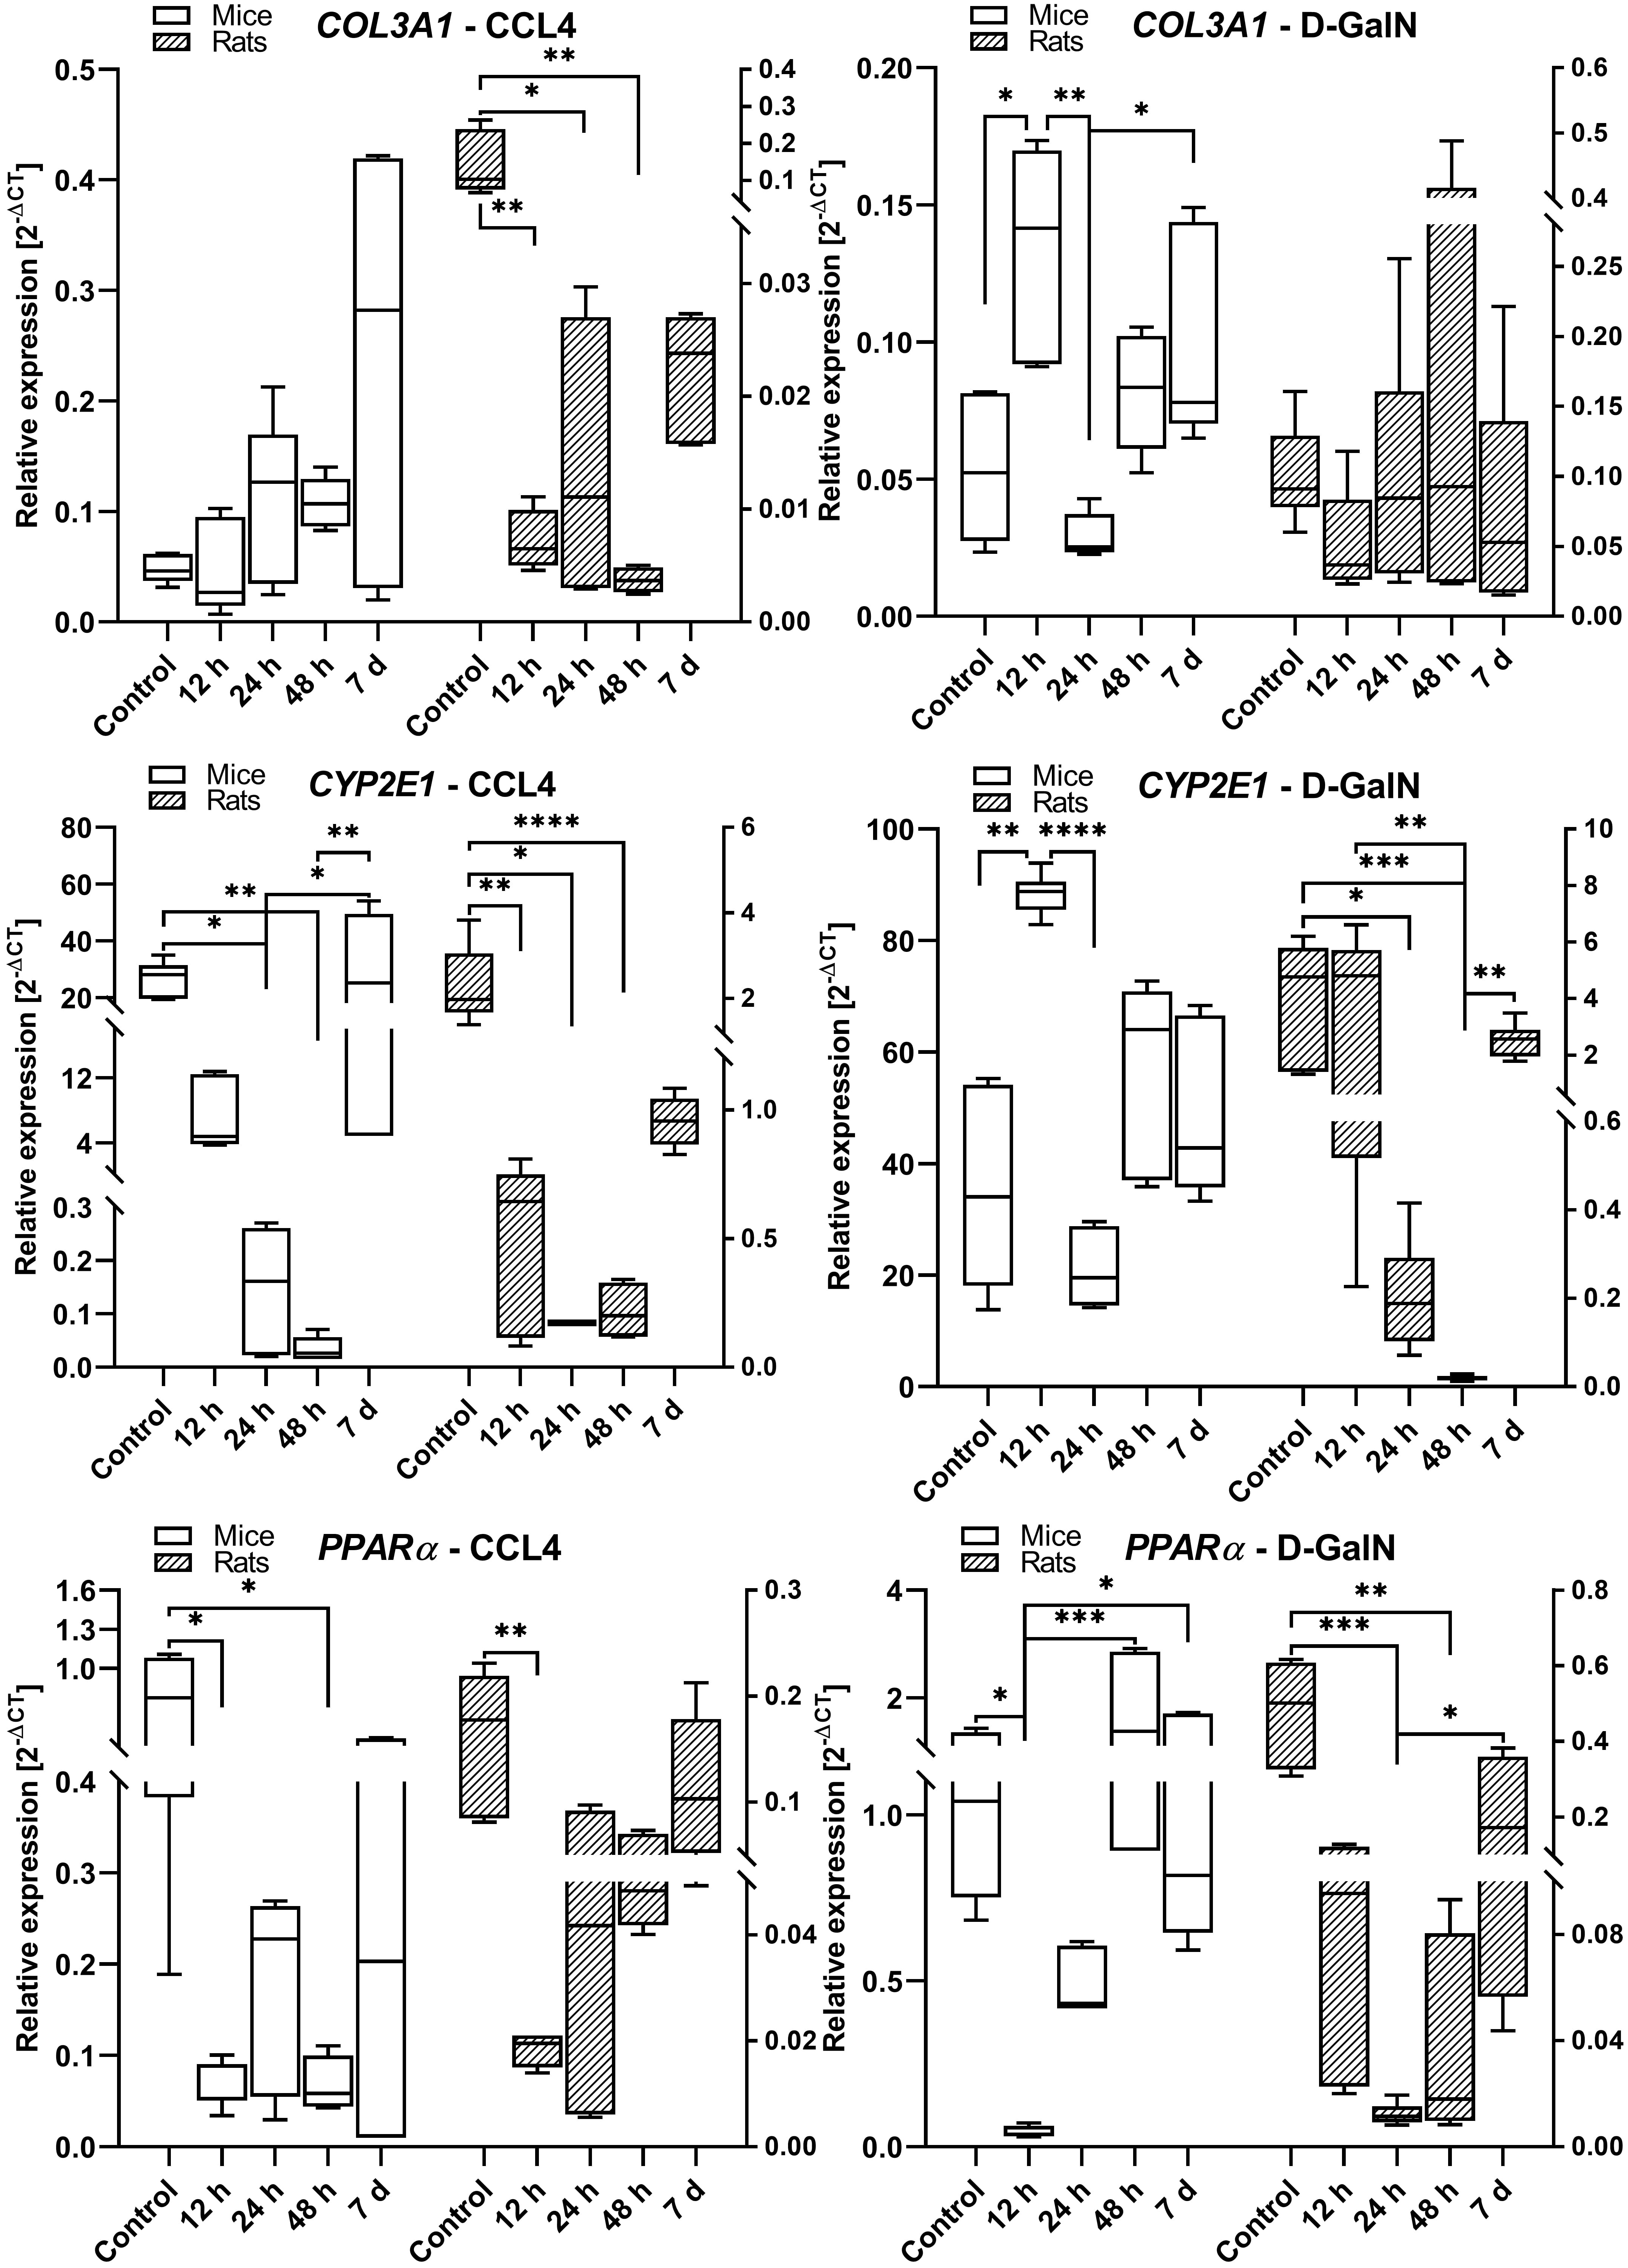 Fig. 6.
COL3A1, CYP2E1, and PPAR gene expression in the livers
of rats and mice intoxicated with CCl and D-GalN in the ALF model. We
observed very low expression of Gadd45a, COL1A1, IL-6, and TNF in mouse
and rat liver samples (data not shown); n = 3.
In CCl-treated rats and mice, we observed significantly lower expression
of CYP2E1/Cyp2e1 at 12 h (p 0.01), 24 h (p 0.05), and
48 h (p 0.0001) as compared to the control groups and 7-day time
point. We also observed a similar pattern of CYP2E1mRNA expression in
GalN-intoxicated rats and mice, characterized by decreased levels at 24 h in mice
and at 24 h/48 h in rats, and comparable levels between the control and day 7
groups in both species (Fig. 6).
In both rats and mice treated with CCl, we observed a significant lowering
in PPAR expression at 12 h (p 0.01) in rats and between 12
h and 48 h (p 0.05) in mice. In D-GalN intoxicated rats,
PPAR was downregulated at 24 h (p 0.001) and 48 h
(p 0.01), whereas in mice it was downregulated at 12 h (p 0.05). In both rats and mice intoxicated with CCl and D-GalN, there
were no differences in PPAR expression between the high control and day
7 groups (Fig. 6).
In rats treated with CCl, cMET expression showed a downward trend at 12 h,
24 h (p 0.05), and 48 h (p 0.01) as compared with the
control group. There was a similar trend in the group of CCl-treated mice,
but the differences were statistically insignificant. In rats treated with
D-GalN, the cMET mRNA expression remained unchanged during the observation with
an upward trend at 7 days. However, in mice intoxicated with D-GalN, the cMET
expression was upregulated at 48 h (p 0.01) and 7 days (p 0.05) as compared to the control and earlier time points (Fig. 7).
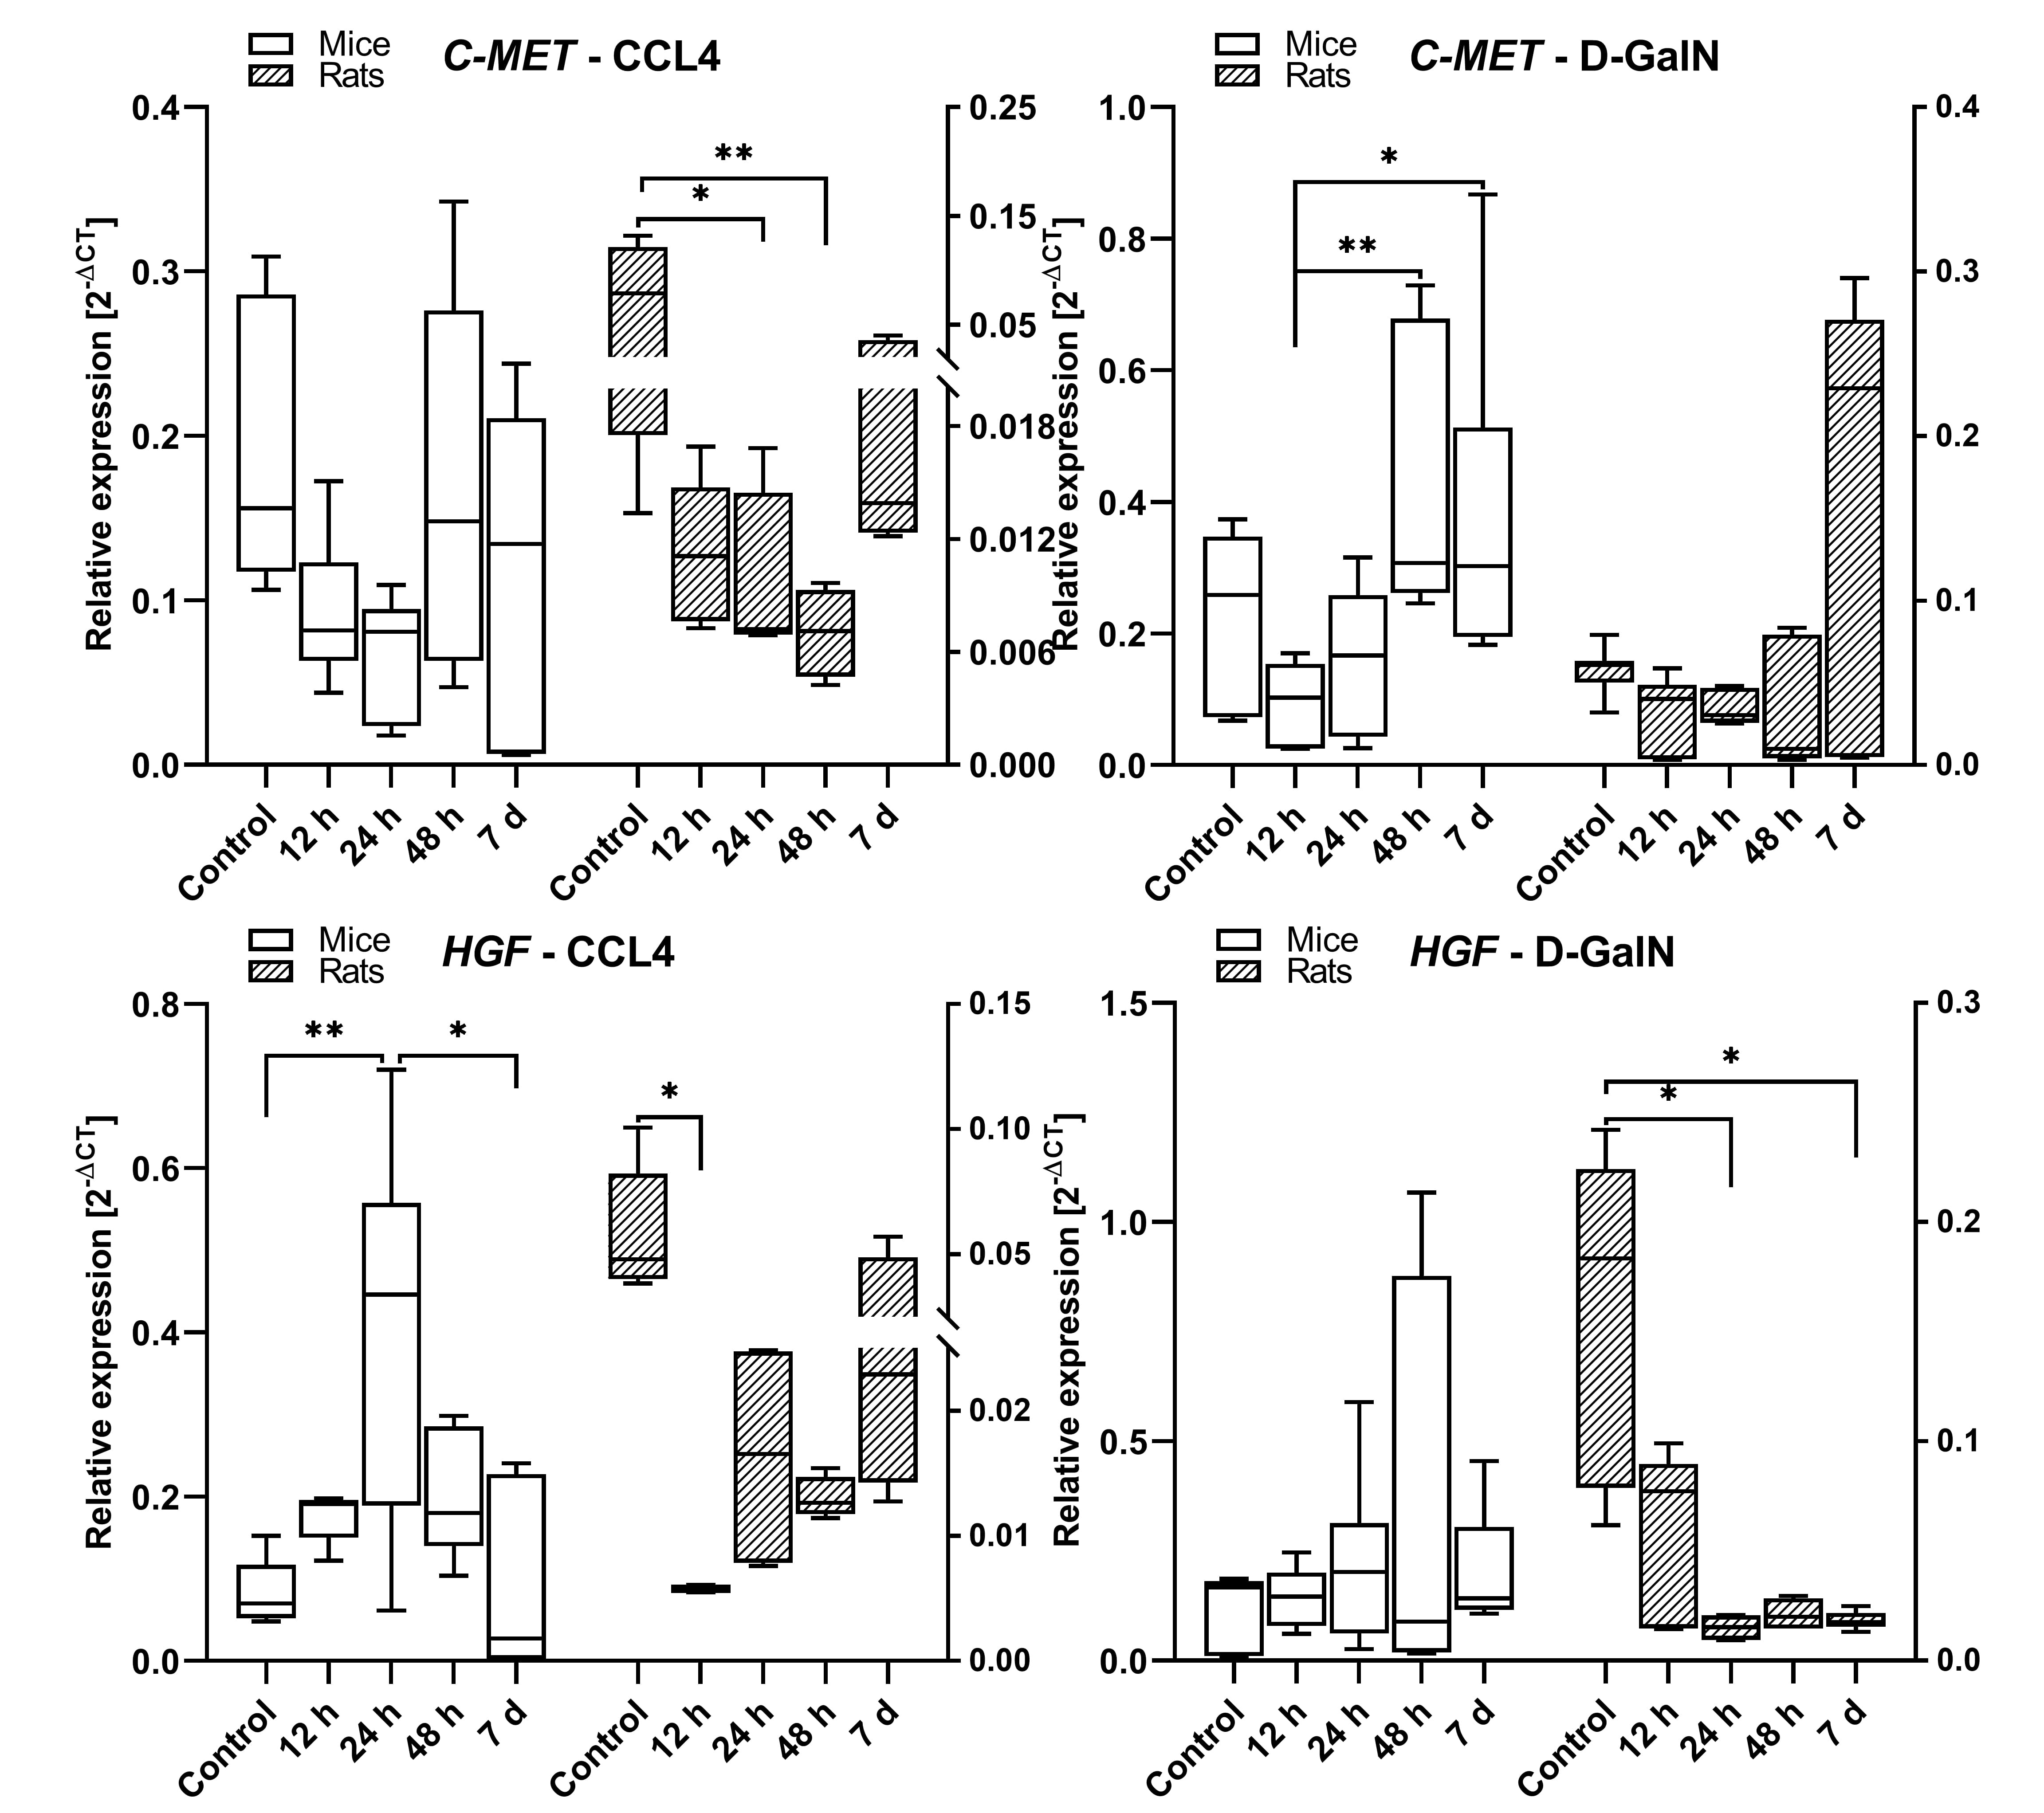 Fig. 7.
cMET and HGF gene expression in the livers of rats and mice
intoxicated with CCl and D-GalN in the ALF model. n = 3.
In rats treated with CCl, the expression of HGF decreased at 12 h
(p 0.05), and then showed a statistically insignificant upward trend
between 12 h and 7 days. In the corresponding group of mice, the HGF mRNA
expression increased at 12 h and 24 h (p 0.01) in comparison to the
control and then decreased at 48 h and 7 days (p 0.05). In
D-GalN-intoxicated rats, we observed lowered expression of HGF mRNA at 12 h, 24
h, 48 h and 7 days (p 0.05) as compared to the control. In mice
intoxicated with D-GalN, the expression of HGF remained unchanged during the
observation (Fig. 7).
4. Discussion
There is little information available in the literature describing the toxic
effects, including histopathology and gene expression, induced by the classical
hepatotoxins CCl and D-GalN in rat and mouse experimental models of
hepatotoxicity at early time points in the context of potential cell therapy. In
our study we focused on earlier time-points when the process of liver injury
develops, and is not affected by spontaneous recovery of liver acini architecture
and function. We wanted to determine experimental time cut-off points for an
effective stem cell therapeutic intervention, that should be introduced before
pathological changes become advanced or irreversible. Therefore, we analysed the
dynamics of ALF development during 48 hours after intoxication with xenobiotic
doses described as effective [38, 39, 40] or modified by us due to excessive
mortality.
In rats treated with a single dose of 200 L/100g CCl, we
observed early stages of hepatitis after 12 h, namely ballooning degeneration of
hepatocytes, necrosis around central veins, and increased blood parameters. These
microscopic observations were similar to those made by Janakat and Al-Merie [40].
The highest activity of aminotransferases and ALP was observed at 48 h after
intoxication.
In mice, a dose of CCl that is effective in producing hepatotoxicity can
be several times lower than in rats. Doses up to 750 CClL/100 g b.w. were described in the literature [29].
High doses were verified by us in preliminary experiments due to mice excessive
mortality (about 66%; not published). Finally, in mice treated intraperitoneally
with a single injection of 50 L/100 g CCl, we observed rapid
development of severe hepatitis with massive parenchymal necrosis in zone 3 of
acinus and interface hepatitis, accompanied by highly elevated aminotransferase
activities at 12 h. In mice injected with 50 L/100 g CCl,
there was a massive liver necrosis observed up to 96 h [29]. At an even higher
dose of CCl (100 L/100g), Yang et al. [53] observed
parenchyma necrosis as early as 6 h after intoxication and found the largest area
of necrosis at 24 h.
A common characteristic of the changes occurring in rats and mice administered
with CCl was the rapid progression of histopathological changes in the
liver, concentrated mostly in pericentral zone of the liver acini, and signs of
toxicity observed in the blood (12 h–24 h). Some of these changes as well as the
proliferative activity of the liver cells continued an upward trend in the
subsequent period up to 48 h after intoxication. On the other hand, it should be
considered that the toxic effect of a single dose of CCl is not permanent
in rats and mice and decreases with time after injection [29]. In animals treated
with CCl, 7 days after intoxication, we did not observe any
significant pathological changes except of minor inflammatory infiltrate in mice,
which indicates achieving spontaneous recovery in CCl model. Previous data
indicated that liver regeneration in this model starts between 72 h and 120 h.
Bizzaro et al. [29] observed up to 2-fold deacrese in necrotic area at
5th day in comparison to 3rd day of intoxication.
We observed similar trends both in mice and rats in the expression of some
important liver genes, i.e., CYP2E1 and PPAR, after a single CCl
injection. It is known that a strong inhibitory effect of CCl on cytochrome
P450E1 begins from a few minutes [54] to 5–9 h after administration [55].
Inactivation of CYP2E1 during intoxication can be explained by the interaction
between cytochrome P450E1 and its substrate - CCl. The latter acts as a
‘suicide substrate’ that causes cytochrome degeneration and the formation of
ubiquitin-conjugated microsomal protein [55, 56]. We observed this effect of the
CCl action as a decrease in CYP2E1 gene expression from 12 h. Furthermore,
we observed decreasing PPAR gene expression at the same time. These
changes are representative of liver cell injury because both CYP2E1 and
PPAR are important components of the hepatic metabolism of drugs and
lipids, respectively [57]. Downregulation of PPAR causes more severe
steatohepatitis due to impaired lipid metabolism [58]. The changes in gene
expression correlated with advanced histopathological changes in the pericentral
areas of the liver acini, observed from 12 h to 48 h. Both CYP2E1 and
PPAR expression achieved control values on day 7.
We observed a similar pattern of changes (a decrease between 12 h and 48 h/an
increase on day 7) induced by CCl in cMet and HGF gene expression in rats
and, to a lesser extent, in mice (cMet). HGF is a ligand for the cellular MET
(cMet) receptor and together they are responsible for proliferation, cell
migration, morphogenesis, angiogenesis, and liver regeneration [59, 60].
Overexpression of cMet and HGF can be observed in liver tumours [61]. Our
experiments only partially (increased HGF expression in CCl-treated mice)
corroborate previous results, where liver injury induced by CCl or D-GalN
was associated with overexpression of HGF and c-Met [62, 63]. Upregulation of HGF
gene expression was observed at the early stage of liver failure, and was
followed by a drop-off at the late stage [62].
In rats, a dose of D-GalN that can be effective in achieving hepatotoxicity is
relatively lower as compared to mice (50 vs 150 mg/100 g). We observed gradually
progressing liver injury in rats after a single 50 mg/100 g D-GalN injection.
Aminotransferase activity in the blood and apoptosis of liver cells increased
gradually between 12 h and 48 h. Our findings on blood parameters are consistent
with some other studies confirming that hepatocyte apoptosis is one of the
earliest signs of liver injury in the D-GalN model [39]. Apoptotic cells were
more numerous than in CCl model. In rats, this was observed in numerous
hepatic cells as early as 6 h after 50 mg/100 g GalN injection [39].
In contrast to rat D-GalN model and the rat and mouse CCl model, in mice
administered with 150 mg/100 g D-GalN, the first signs of liver injury, such as
patches of ballooning degeneration and minor lymphocytic inflammatory infiltrates
were visible only at 48 h, but not earlier. Another difference between the D-GalN
mouse model and other tested models was that in mice the increases in
aminotransferase activities were insignificant, which may indicate a considerably
weaker hepatotoxic impact of the administered D-GalN on mice as compared to rats.
Different aminotransferase activities observed after 150 mg/100 g D-GalN
injection in our study and in some studies by other researches may be due to
species-specific sensitivity [38, 64, 65]. In rats and mice treated with D-GalN,
apoptotic activity of hepatocytes intensified gradualy between 24 h and 48 h.
Although D-galactosamine is well known to induce apoptosis/necrosis by forming
toxic metabolites, also other authors observed rather late apoptotic activity
between 48 h and 72 h [64]. These results, together with spontaneous recovery at
7 day, strongly suggest that regeneration phase in this model is shifted to the
later time points. Some authors indicate that after D-GalN injection regeneration
phase starts at 72 h [66].
In addition to the delayed histopathological signs of liver injury induced in
rats and mice by D-GalN, the expression pattern of CYP2E1 and PPAR
genes was partially (excluding PPAR genes in rats) shifted to later
time points. However, in general this pattern was similar to the corresponding
CCl models and was characterized by decreasing expressions at 24 h and/or
48 h, reaching control values after 7 days. Our results are consistent with
previous reports, showing that CYP2E1 expression levels decrease 36 h after
intoxication and return to normal 1 week after intoxication [67]. Moreover, HGF
gene expression was stable in rats and mice between 12 h and 7 days, whereas
c-Met expression tended to increase after 48 h, which may be related to the
regeneration of the injured liver in this model.
The duration of this short-term experiment was probably not long enough to
observe advanced fibrotic changes in the livers of acutely intoxicated rats and
mice. The time needed to induce fibrosis in CCl models usually varies from
4–12 weeks, therefore fibrosis-related gene expression and fibrosis-related
histopathological changes at early time points after single hepatotoxin injection
are not well described in the literature [68, 69]. The absence of fibrosis was
expected and generally confirmed in this study by histopathological observations
and molecular analysis. Nevertheless, as early as day 7, we observed a slight
progression in liver fibrosis in histopathological sections, supported by
increasing expression of the COL3A1 gene in mice intoxicated with CCl.
These data are consistent with some previous studies, where after a single or
several injections of CCl, the researchers obtained a self-limiting
fibrosis model characterized by activation of HSCs and upregulation of fibrotic
genes [70, 71].
The knowledge of ALF dynamics in animal models seems to be crucial in answering
the question of when is the best time to intervene with cell therapy and which
time cut-off points are most appropriate. Since liver damage progresses rapidly
after CCl intoxication, there are basically two approaches to the timing of
cell therapy intervention. Based on our findings and the results of some other
studies, early intervention to 6 h–12 h seems to be optimal for preventive
application of cell therapy [14, 72]. Therapeutic intervention during this time
seems to be most effective due to the likely mechanism of suppression of the
inflammatory process at its early stage. However, cell implantation shortly after
intoxication may expose these cells to the toxic effects of the administrated
xenobiotic. Due to the ability of CCl to create free radicals, the risk of
interaction between CCl and stem cells is high, especially if the routes of
cells and hepatotoxin administration are the same [73]. Unlike CCl, D-GalN
does not directly damage cells other than hepatocytes, so the risk of a negative
interaction between D-GalN and the injected cells is lower.
It is very common for researchers to perform cell therapy 24 h or 48 h after
CCl administration [74, 75, 76, 77]. However, after this period, we observed severe
histopathological changes in mice and rats, corresponding to the acute phase of
full-blown liver failure. Cell implantation at the above-mentioned time points
could potentially increase the regenerative potential of the liver and shorten
the recovery period. Cell administration between 24 h and 48 h seems to be more
related to clinical practice, where therapeutic intervention coincides with the
diagnosis of full-blown liver failure.
The D-GalN liver injury model is characterized by a longer time (especially in
mice—up to 48 h) between toxin injection and the phase of full-blown hepatitis.
This provides a wide therapeutic window for cell therapy intervention. In this
model, cell therapy is usually conducted prior to development of full-blown liver
failure, 24 h after intoxication [13, 78, 79].
5. Conclusions
In conclusion, we propose the following potential experimental time points
appropriate for cell therapy intervention in animal models of CCl and
D-GalN-dependent acute liver failure: rat and mouse CCl model—12 h, rat
D-GalN model—24 h, and mouse D-GalN model—48 h. In the presented models, cell
administration seems to be ineffective after 48 h due to the self-limiting
properties of liver injury and spontaneous liver parenchyma regeneration after
this time point.
Abbreviations
CCl, Carbon tetrachloride; D-GalN, D-galactosamine; ALF, acute liver
failure; i.p., intraperitoneal; ALT, alanine transaminase; AST, aspartate
transaminase; ALP, alkaline phosphatase; TP, total protein; Cas-3, Cleaved
Caspase 3; TNF-, Tumor necrosis factor alpha; IL-6, Interleukin 6;
COL1A1, Type I collagen; COL3A1, Type III collagen; TGF-, Transforming
growth factor beta; C-met, Tyrosine-protein kinase Met; HGF, Hepatocyte growth
factor; CYP2E1, Cytochrome P450 2E1; PPAR-, Peroxisome
proliferator-activated receptor alpha.
Author Contributions
PC and MK designed the research study. PC supported the studies financially
(grands), provided help and advice. MK, ŁL, EK, AS-S, EB, MH, MM, BS, AP, AG,
JP performed the research. PC, MK, ŁL, AS-S, BS analyzed the data. PC, MK,
AS-S wrote the manuscript. All authors contributed to editorial changes in the
manuscript. All authors read and approved the final manuscript.
Ethics Approval and Consent to Participate
Animal experiments were approved by the Animal Experiments Ethical Committee of
Medical University of Silesia, Katowice, Poland (decision no. 18/2018).
Acknowledgment
We thank the Silesian Analytical Laboratory (Katowice; Poland) for performing
serum biochemistry analysis and blood morphology assessment. We thank Katarzyna
Lorek from Students Scientific Society SUM Katowice for her participation in
administration of xenobiotics to laboratory animals.
Funding
The studies were supported by institutional grands (SUM Katowice) no:
KNW-1-103/N/8/0 and KNW-1-100/K/9/0.
Conflict of Interest
The authors declare no conflict of interest.


 , Mateusz Król 1,†, Łukasz Limanówka 2, Aleksandra Skubis-Sikora 1, Emanuel Kolanko 1, Edyta Bogunia 1, Mateusz Hermyt 1, Marcin Michalik 1, Bartosz Sikora 1, Agnieszka Prusek 1, Aniela Grajoszek 3, Jacek Pająk 4