


1 Tougenkai Dermatology, Osaka-city, 540-8511 Osaka, Japan
2 Department of Dermatology, Self-Defense Forces Central Hospital, Setagaya-ward, 154-8532 Tokyo, Japan
3 Department of Human Genetics, Graduate School of Medicine, The University of Tokyo, Bunkyo-ward, 113-0033 Tokyo, Japan
4 Kosho Clinic, Nishinomiya-city, 662-0051 Hyogo, Japan
5 Department of Pharmacology, Kindai University School of Medicine, Osaka-Sayama-city, 589-8511 Osaka, Japan
6 Department of Social and Environmental Medicine, Faculty of Medicine, Saga University, Saga-city, 849-8501 Saga, Japan
Academic Editor: José Luis Pérez-Castrillón
Abstract
Background: Although the mesenteric artery plays a key role in regulating peripheral blood pressure, the molecular mechanisms that underlie the development of essential hypertension are not yet fully understood. Materials and Methods: We explored candidate genes for hypertension using three related strains of spontaneously hypertensive rats (SHRs) that mimic human essential hypertension. In this study we used DNA microarrays, a powerful tool for studying genetic diseases, to compare gene expression in the mesenteric artery of three SHR substrains: SHR, stroke-prone SHR (SHRSP), and malignant SHRSP (M-SHRSP). Results: Compared to normotensive 6-week old Wistar Kyoto rats (WKY), higher blood pressure correlated with overexpression of 31 genes and with down regulation of 24 genes. Adam23, which negatively regulates potassium current, and the potassium channel genes, Kcnc2 and Kcnq5, were associated with the onset of hypertension. In addition, Spock2 and Agtrap were identified as strengtheners of hypertension by analyzing up and down regulated genes at 9-weeks of age. Conclusions: Adam23, Kcnc2 and Kcnq5 appear to be factors for the onset of hypertension, while Spock2 and Agtrap are as factors that strengthen hypertension. These findings contribute to our understanding of the pathophysiology of hypertension and to the development of treatment for this condition.
Keywords
- hypertension
- stroke
- DNA microarray
- gene expression analyses
- genomics
- mesenteric artery
- spontaneously hypertensive rat (SHR)
- stroke-prone spontaneously hypertensive rat (SHRSP)
- malignant stroke-prone spontaneously hypertensive rat (M-SHRSP)
- potassium voltage-gated chanell subfamilies
Hypertension is a serious disorder that shows no symptoms even when blood pressure (BP) is elevated. If left untreated, it can lead to life-threatening diseases with atherosclerosis in humans. In rats, arteriosclerosis rather than atherosclerosis is the predominant change associated with hypertension and leads to myocardial infarction, renal failure and stroke [1, 2, 3]. Even in Japan where there is sufficient general medical care to treat hypertension, more than 300,000 patients die each year from diseases related to this condition [4, 5]. To confront this life-threatening problem, multidisciplinary knowledge of hypertension is required. Together with more effective treatments to avoid serious consequences, elucidation of the genetic background of hypertension is urgently required. Although a number of methods are available for investigating the genetic nature of hypertension, the polygenic nature of human hypertension makes it difficult to identify the responsible genes via meta-analysis of genome-wide studies [6]. The aim of this study was therefore to identify genes related to hypertension by studying rat models of human essential hypertension, namely spontaneously hypertensive rats (SHR) [7], stroke-prone SHR (SHRSP) [8] and malignant SHRSP (M-SHRSP) [9]. The two latter substrains develop stroke at high rates of 77% in SHRSP [8] and more than 96% in M-SHRSP [9].
DNA microarrays are potentially powerful tool for studying the genetics of diseases as they allow simultaneous measurement of the expression level of thousands of genes in experimental studies [10, 11, 12]. In this study, we compared gene expression in the mesenteric artery of the three SHR substrains mentioned above [7, 8, 9]. SHR was developed as an animal model for research into essential hypertension as part of a breeding program based solely on the selection of elevated BP in normotensive Wistar Kyoto (WKY) rats [7]. SHRSP were derived from SHR following selective inbreeding for susceptibility to stroke [8]. M-SHRSP were selected and established through brother–sister mating of selected SHRSP animals that showed higher BP and higher incidence rates of stroke [9]. An inbred strain of M-SHRSP has a BP of 250 mm Hg or higher before 14-weeks of age, causing brain stroke in almost all animals [9]. We previously bred three SHR substrains and families in our facility. Using these SHR substrains, we found several blood pressure-regulating genes such as Rgs2, Gja1, Uts2, Ephx2 in the adrenal glands [13], and Mapk14, Ephx2, Kcnc3 in the kidneys that could be related to hypertension [14]. The Kcnq1, Kcnh1, Ache and Chrm2 genes were identified following study of the mesenteric artery of SHRs, SHRSPs and renovascular hypertensive 2K1C (two kidneys and one clip induced hyper-renin) and 1K1C (one kidney and one clip induced hypervolemic) rats, but not M-SHRSP [15]. Other genes related to hypertension have also been reported [16], and the identify of true candidate genes for hypertension remains controversial.
The mRNA expression profile of different tissues depends on their biochemical and physiological roles and on the states of disease. Hence, it is very important to select mRNA samples from tissues that are responsive to hypertension. Resistance arteries such as the mesenteric and femoral arteries in the rats appear to be the most relevant tissues when analyzing the cause of hypertension [17]. In the present study we therefore chose the mesenteric artery to analyze mRNA in rat hereditary hypertensive models. Genes associated with hypertension were identified in the mesenteric artery of three related substrains of SHR using DNA microarray technology.
The experiments were performed using 6- and 9-week old rats. Wistar Kyoto (WKY)/Izm was used as the control strain, and SHR/Kpo, SHRSP/Kpo and M-SHRSP/Kpo as the hypertensive models [7, 8, 9]. Male rats with high blood pressure and frequent strokes as compared to female rats were used. Based on the analyses for genetic polymorphisms, the three rat substrains used here had identical genetic backgrounds (personal communication with Prof. Ota, Department of Pathology, Kindai University Nara Hospital; National Bioresource Project ‘Rat’ in Kyoto University (http://www.anim.med.kyoto-u.ac.jp/nbr/phylo_jp.aspx#SHR)). In total, three rats from each experimental group were used for the DNA microarray experiments. WKY/Izm rats were purchased from SLC Co. (Shizuoka, Japan), while the three substrains were obtained from the Animal Center, Kindai University School of Medicine. All animals used in this study were handled with due care according to the guidelines established by the Japanese Association for Laboratory Animal Science, which complied with international rules and policies. This study was performed following approval (KAME-19-078 on April 1, 2007) from the Animal Care and Use Committee of the Kindai University. Handling during experiments was performed to minimize the pain and discomfort of the rats.
Systolic BP (SBP) was measured every week in 6 rats including three rats per
group for the DNA microarray experiments, using the tail-cuff method with a
UR-5000 instrument (Ueda, Tokyo, Japan). Briefly, three consecutive SBP readings
were taken weekly between 09:00 AM and 11:00 AM after warming the body to 35
°C for 5 min in a heater box. SBP values are expressed as the mean
The mesenteric arteries, 2nd to 3rd branches because of existences of almost all receptors, ion channels and vascular smooth muscle regulating the blood flow, were harvested under sodium pentobarbital anesthesia (50 mg/kg i.p.), cut with scissors and homogenized twice at a pitch speed of 22 strokes/s for 2 min in a 2 mL plastic tube with 5 mm diameter glass beads using a Qiagen Tissue Lyser (Retsch GmbH & Co., Haan, Germany). Total RNA was extracted with an RNeasy Mini kit (Qiagen GmbH, Hilden, Germany) according to the manufacturer’s protocol. RNA quality was evaluated with RNA Nano Chips (Agilent Technologies, Waldbornn, Germany) using an Agilent 2100 Bioanalyzer prior to use in the microarray experiments. Tissues obtained from 3 rats per group of hypertensive and normotensive strains were used for microarray analysis.
To examine the gene expression profiles of rat mesenteric arteries, cRNA labeled
with cyanine 3-CTP (PerkinElmer, Boston, MA, USA) was synthesized from 1
A BLASTN search of the NCBI RefSeq database using corresponding 60-nucleotide probes (NCBI, GEO accession: GPL7294) was performed to identify homologous genes with functional annotations [19]. After running a BLASTN search (ratus norvegicus), clones showing a gene expression score that was at least 4-fold higher or 4-fold lower (0.25-fold) than that of WKY were defined as annotated clones. The remaining clones were defined as non-annotated clones (refer to the Results and Discussion sections). The annotated gene and protein symbols are shown in italics and regular font, respectively. The logical basis for establishing this threshold was as follows. When only the genes up regulated more than 4-fold were sought, we identified 566, 669 and 813 genes at 6-weeks of age, and 36, 131 and 9 at 9-weeks of age in SHR, SHRSP and M-SHRSP rats, respectively. For down regulated genes at a threshold of 0.5-fold, we identified 1053, 1401 and 1846 genes at 6-weeks of age, and 121, 591 and 27 at 9-weeks of age in SHR, SHRSP and M-SHRSP rats, respectively. Using a threshold of 0.25-fold down regulation compared to WKY rats, 320, 387 and 576 genes were identified at 6-weeks of age, and 34, 7 and 11 genes at 9-weeks of age in SHR, SHRSP and M-SHRSP rats, respectively.
The following analyses were carried out to identify candidate genes related to or causing hypertension, as described above. First, data from the comparison of the SHR substrains to WKY was used to survey candidate genes among the SHR, SHRSP and M-SHRSP substrains in ascending order of blood pressure. Second, data from the comparison between the 6- and 9-week old rats from each SHR substrain at similar blood pressures was used to survey the candidate genes in the order of up or down regulated expression.
Analyses of the roles of genes expressed in biochemical pathways was performed using Skypainter from REACTOME, a free and open-source database (http://www.reactome.org/) available at the Cold Spring Harbor Laboratory website, The European Bioinformatics Institute and The Gene Ontology Consortium. Gene biochemical information was mainly obtained from the GenBank database (the NIH genetic sequence database, https://ncbi.nlm.nih.gov). The possibility of the epigenetic modification of candidate genes was explored using the Genome Browser Gateway (University of California Santa Cruz Genomic Institute, http://genome-asia.ucsc.edu/cgi-bin/).
Comparisons between the means of the data in each group were performed using
one-way analysis of variance (ANOVA) and Scheffe’s multiple comparison tests.
Differences were considered significant at p
Systolic blood pressure (SBP) was measured for the WKY, SHR, SHRSP and M-SHRSP strains was measured every week between 6- to 9-weeks of age (Fig. 1a). SBP levels were significantly higher (or tended higher) at both 6- and 9-weeks in all SHR substrains compared with the age-matched WKY controls. The SBP of control rats was 110 to 140 mm Hg, while in hypertensive rats including SHR the SBP was considered to be hypertensive at 150 mm Hg or more. The SBP of SHRSPs increased from 142 mm Hg at 6-weeks to 179 mm Hg at 9-weeks. In the same period, the SBP of M-SHRSPs increased from 163 to 224 mm Hg. Moreover, the SBP values of SHRSPs and M-SHRSPs at 12-weeks of age increased further to 235 and 265 mm Hg, respectively (Fig. 1b). The SBP of 9-week old SHRs (165 mm Hg) was similar to that of M-SHRSP (163 mm Hg) at 6-weeks of age. These results show that the SBP of SHR and M-SHRSP at 9- and 6-weeks, respectively, was almost the same, and at 9-weeks it was significantly higher in both SHRSPs and M-SHRSPs. In light of these observations, we hypothesized that genes associated with the onset of hypertension are preferentially expressed in the former comparisons (SHR vs M-SHRSP) at 6-weeks of age, while those involved in the maintenance/strengthening of hypertension are predominant in the latter comparison (SHRSP vs M-SHRSP). This hypothesis was evaluated further by additional analysis of the data.
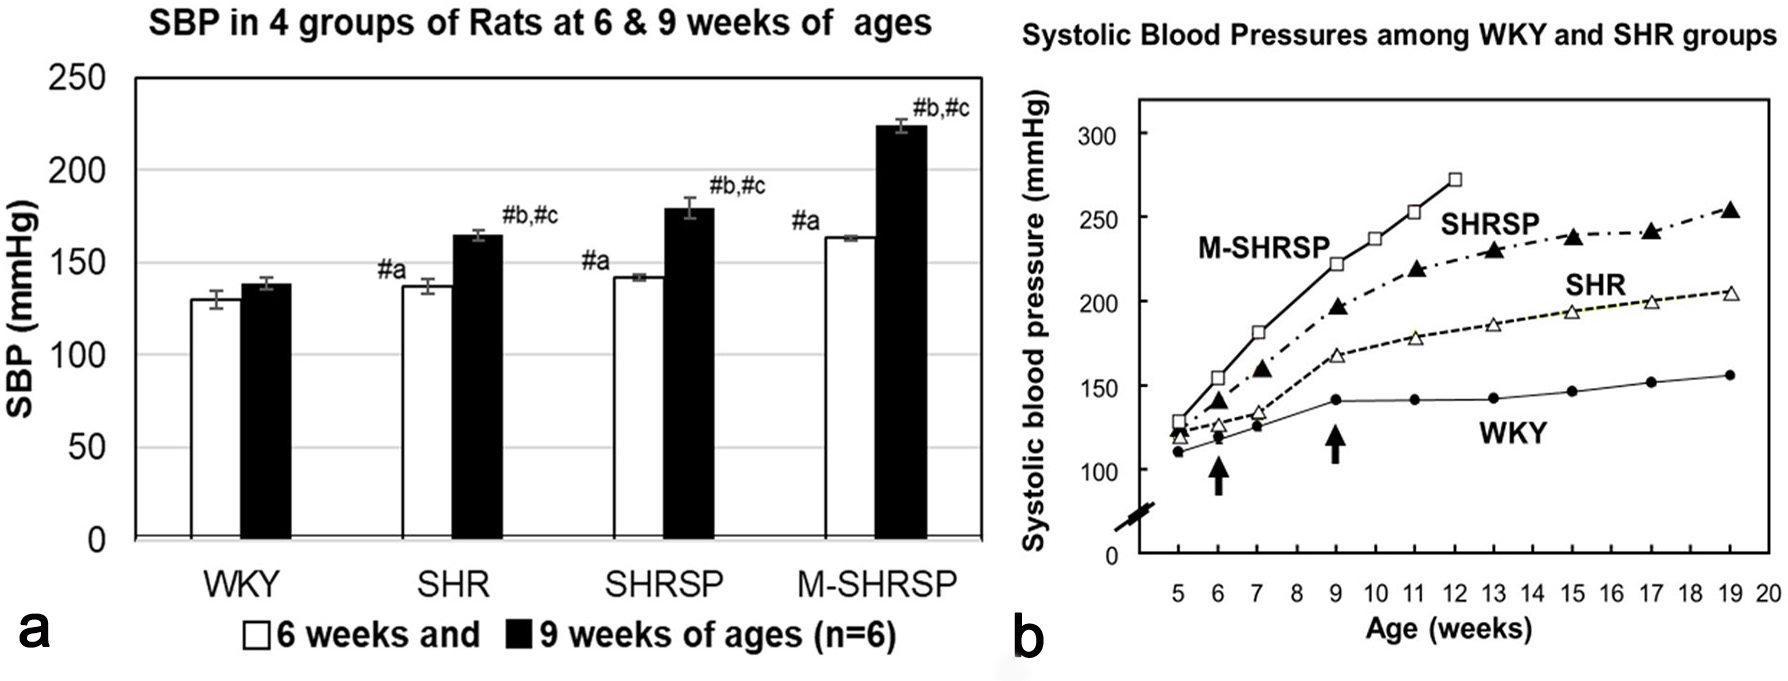 Fig. 1.
Systolic blood pressure (SBP) was measured using the tail-cuff
method. Three consecutive SBP readings were taken in the morning after warming
the body to 35 °C for 5 min in a heater box. SBP values are expressed as the
mean
Genes whose expressions were up regulated more than 4-fold in all three SHR substrains compared to WKY rats at 6-weeks of age are shown in Fig. 2a. In total, 31 genes were identified, of which 24 were known and 7 unknown.
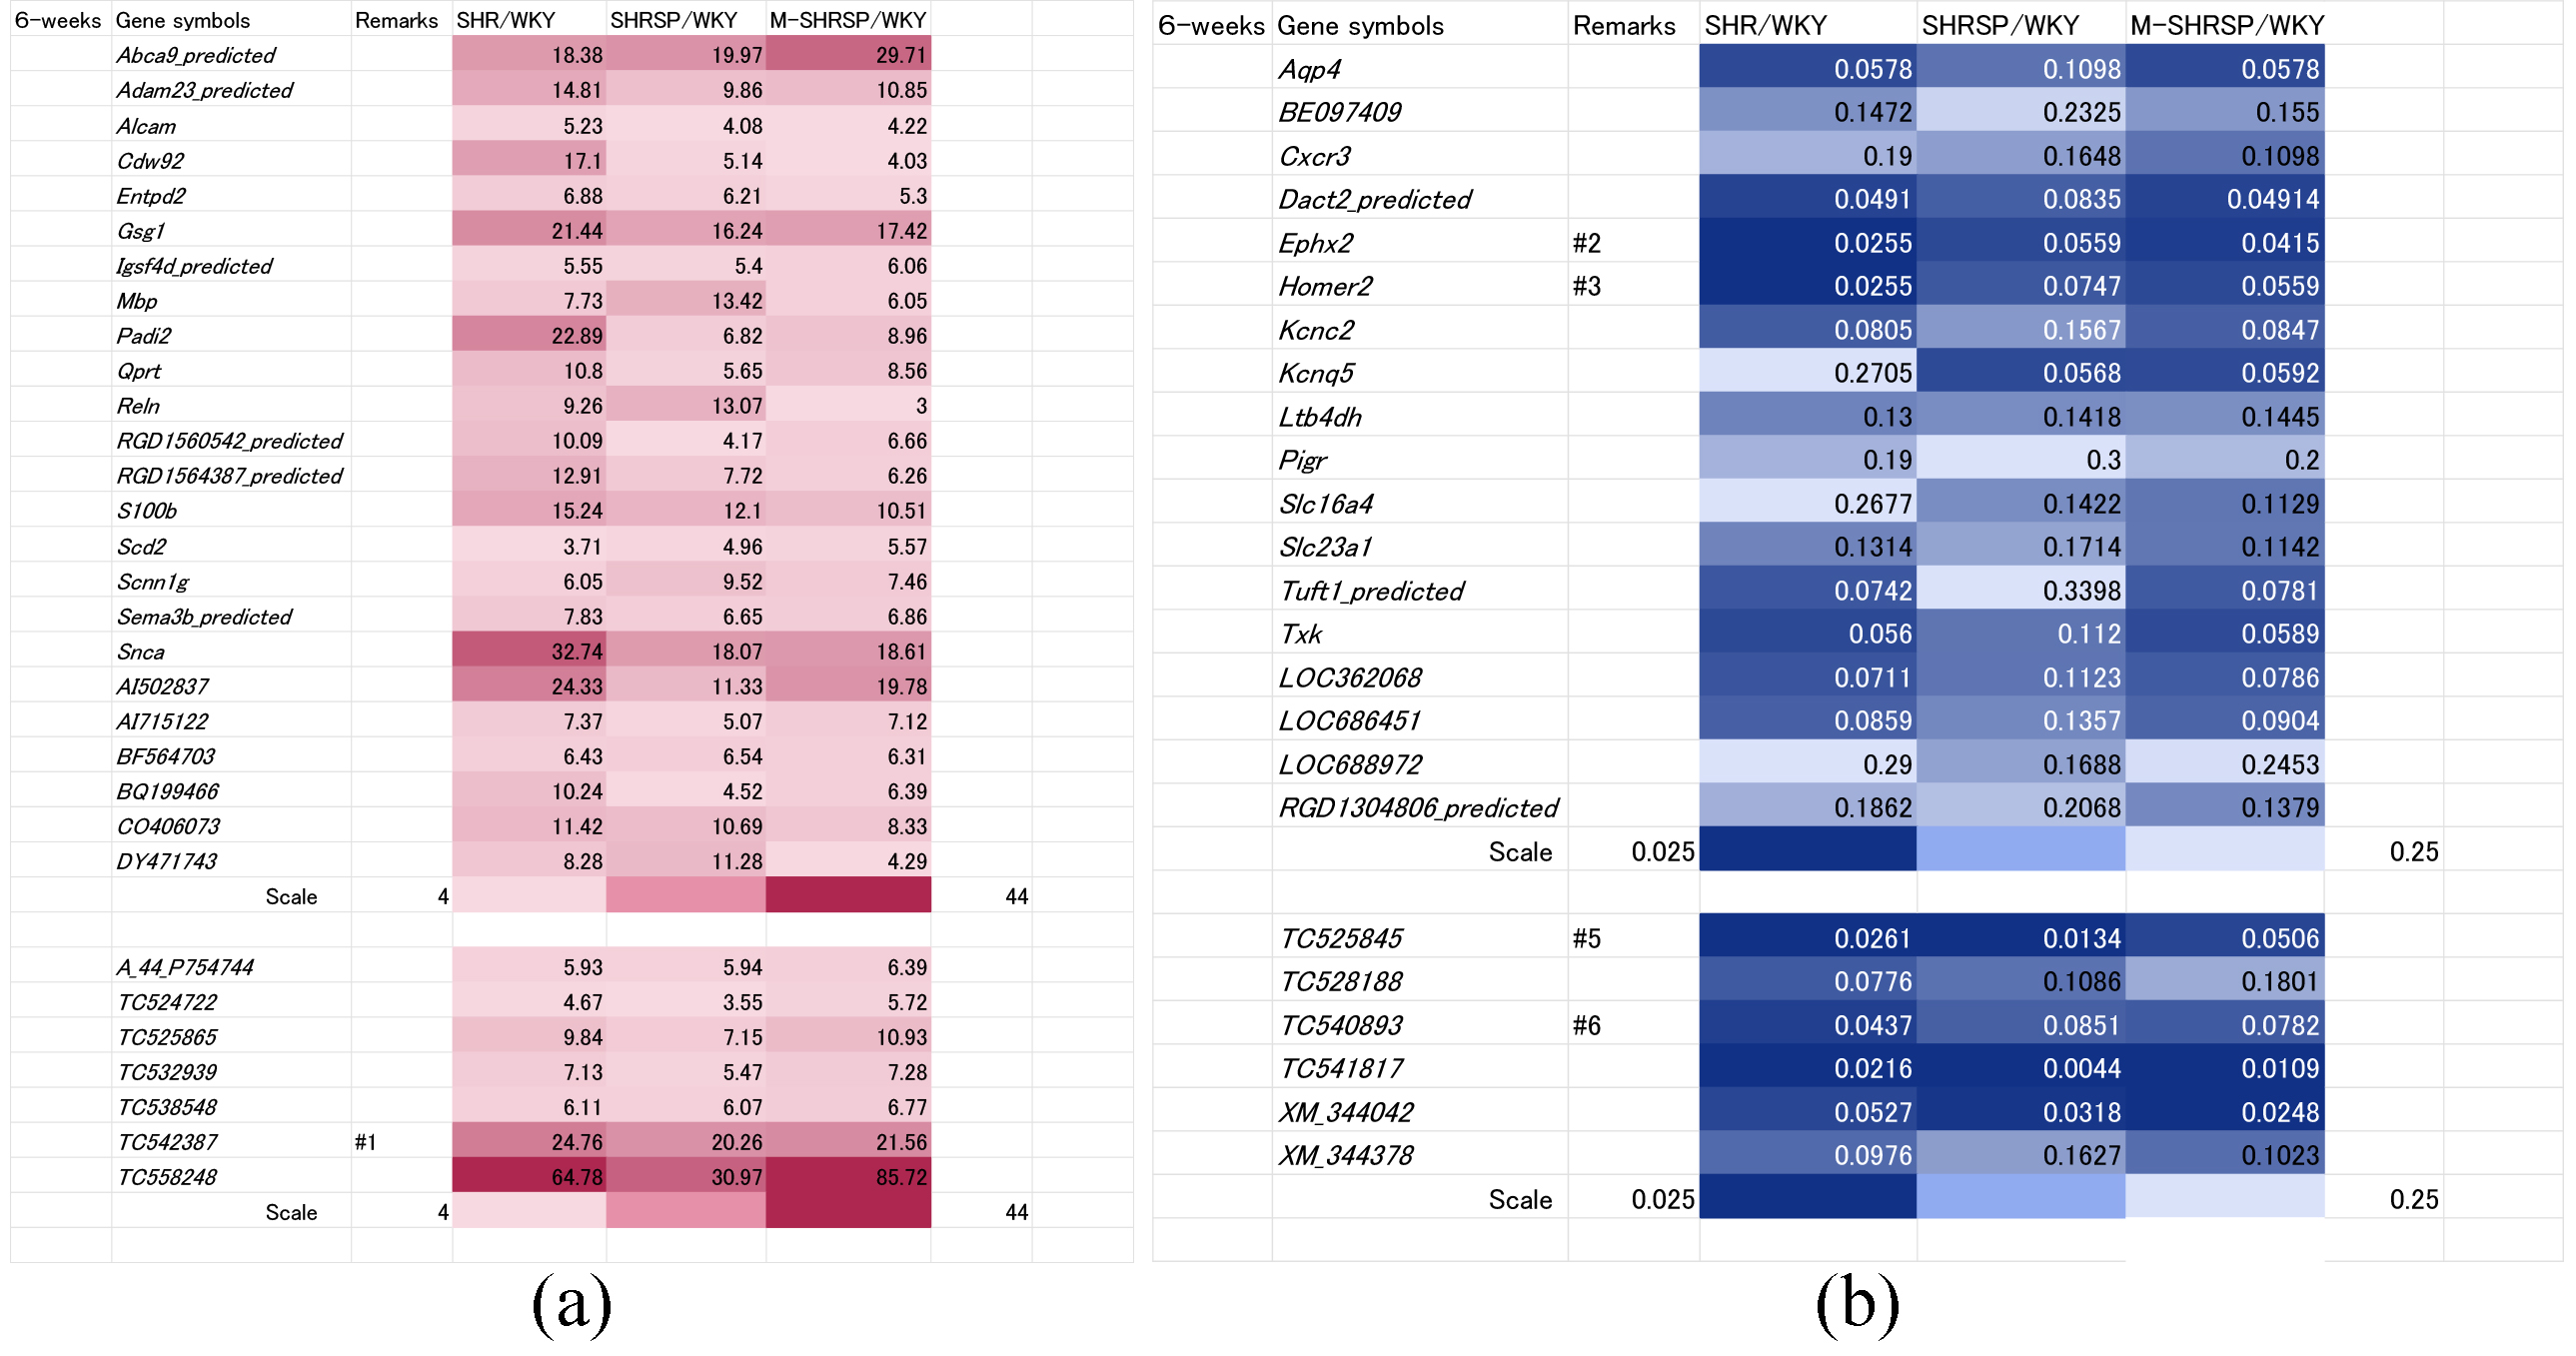 Fig. 2.
Genes significantly up or down regulated in all three SHR substrains at 6-weeks of age vs age-matched WKY controls. Genes either up regulated more than 4-fold (a) or down regulated less than 0.25-fold (b) in all three SHR substrains (SHR, SHRSP or M-SHRSP) compared to age-matched WKY are expressed in heat maps. The color grading corresponds to fold-changes in gene expression, as illustrated by the scale shown in the final row. Numbers shown in the remarks column refer to the duplication of gene data from other figures. WKY, Wistar Kyoto rats; SHR, spontaneously hypertensive rats; SHRSP, stroke-prone SHR; M-SHRSP, malignant SHRSP.
The use of heat maps allows the comprehensive comparison of gene expression between different SHR strains and WKY. Expression of 13 of the 31 genes was significantly elevated compared with WKY, indicating a strong correlation between higher gene expression and high blood pressure at 6-weeks of age. The known genes were Abca9_predicted, Adam23_predicted, Gsg1, Padi2, Qprt, S100b, Snca, AI502837, AI715122, and CO406073, while the unknown genes were TC525865, TC542387 and TC558248. Conversely, the expression of 24 genes (18 known and 6 unknown) was down regulated more than 0.25-fold in all 3 substrains compared to WKY (Fig. 2b). Amongst these, 9 showed a strong correlation between low expression levels and higher blood pressure in the SHR substrains (known genes: Aqp4, Cxcr3, Ephx2, Homer2, Kcnc2, Kcnq5, Ltb4dh; unknown genes: XM_344042 and XM_344378).
As shown above, the SBP of 9-week old SHRs was comparable to that of 6-week old M-SHRSPs (Fig. 1), suggesting the involved genes are associated with the onset and/or strengthening of hypertension. Comparison using heat maps identified 8 up regulated genes (known: AW143870, Bcas1, BG664685, BI292956, Pou3f1, and LOC679668; unknown: TC539990, and TC542387) (Fig. 3a). Conversely, 7 genes were down regulated in this period (Fig. 3b), including Cmah, Ephx2, Homer2, Ltb4dh, and Ptprj (known genes), and TC525845 and TC540893 (unknown genes).
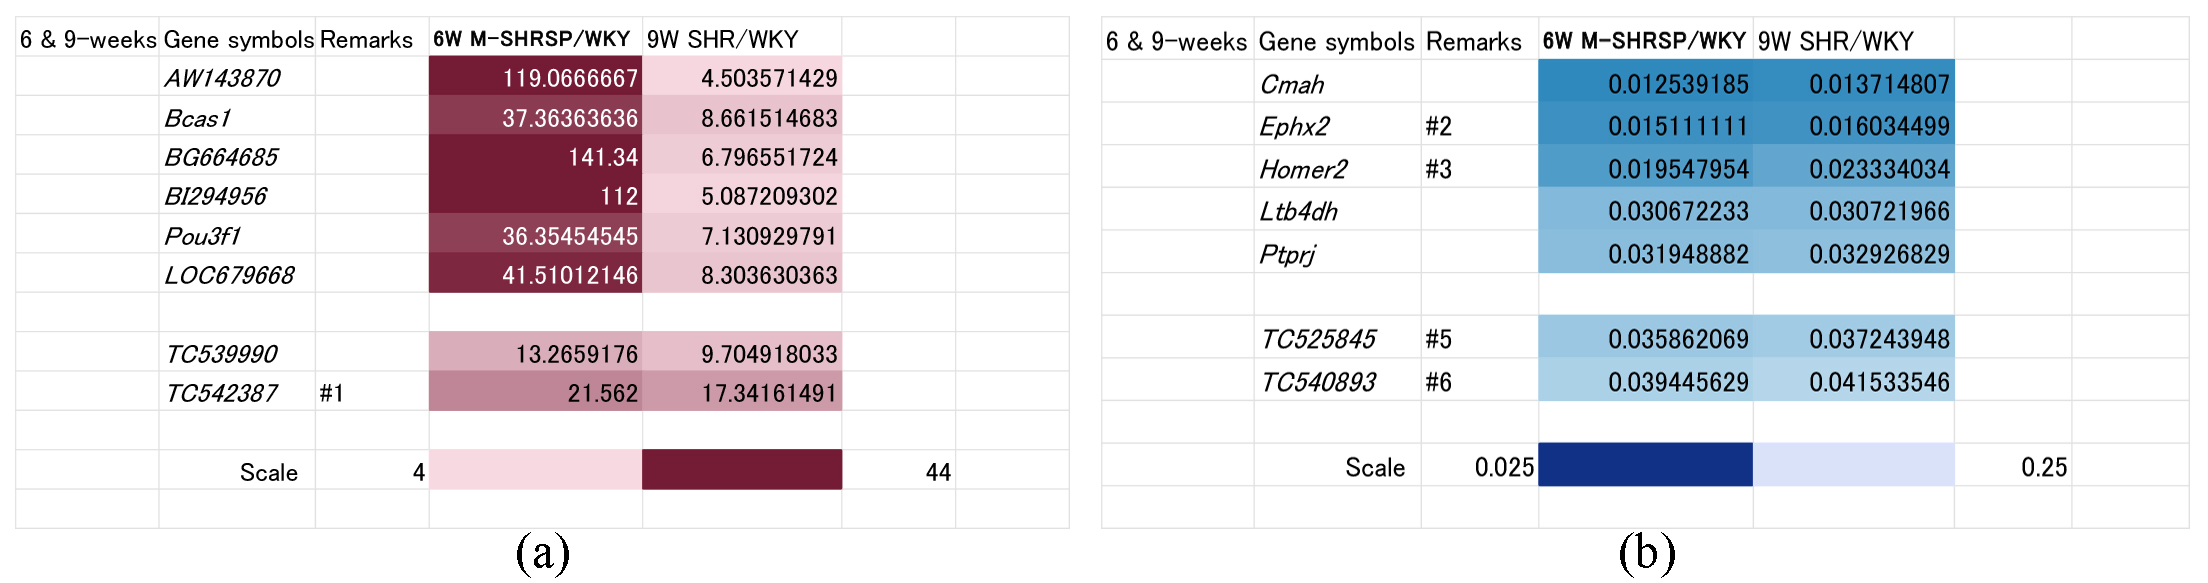 Fig. 3.
Genes significantly up or down regulated both in 9-week old SHRs and in 6-week old M-SHRSPs compared with age-matched WKYs. Heart maps of genes up regulated more than 4-fold (a), or down regulated more than 0.25-fold (b), in both 9-week old SHRs and in 6-week old M-SHRSPs vs age-matched WKY. Numbers shown in the remarks column refer to the duplication of gene data from other figures. WKY, Wistar Kyoto rats; SHR, spontaneously hypertensive rats; M-SHRSP, malignant SHRSP.
As shown in Fig. 1, SBP was already significantly elevated at 9-weeks of age in both SHRSPs and M-SHRSPs, suggesting the likely dominance of genes involved in the maintenance and/or strengthening of hypertension rather than its onset. The SBP of SHRSPs and M-SHRSPs was 179 and 224 mm Hg, respectively, compared to 164 mm Hg for age-matched SHRs. Accordingly, 8 genes were up regulated (known: BF545795, LOC502684, Myo5a, RGD1309362, and Spock2_predicted; unknown: TC542387, TC558814, and TC567935; Fig. 4a) and three were down regulated (known: Agtrap and Shc3; unknown: TC525845; Fig. 4b).
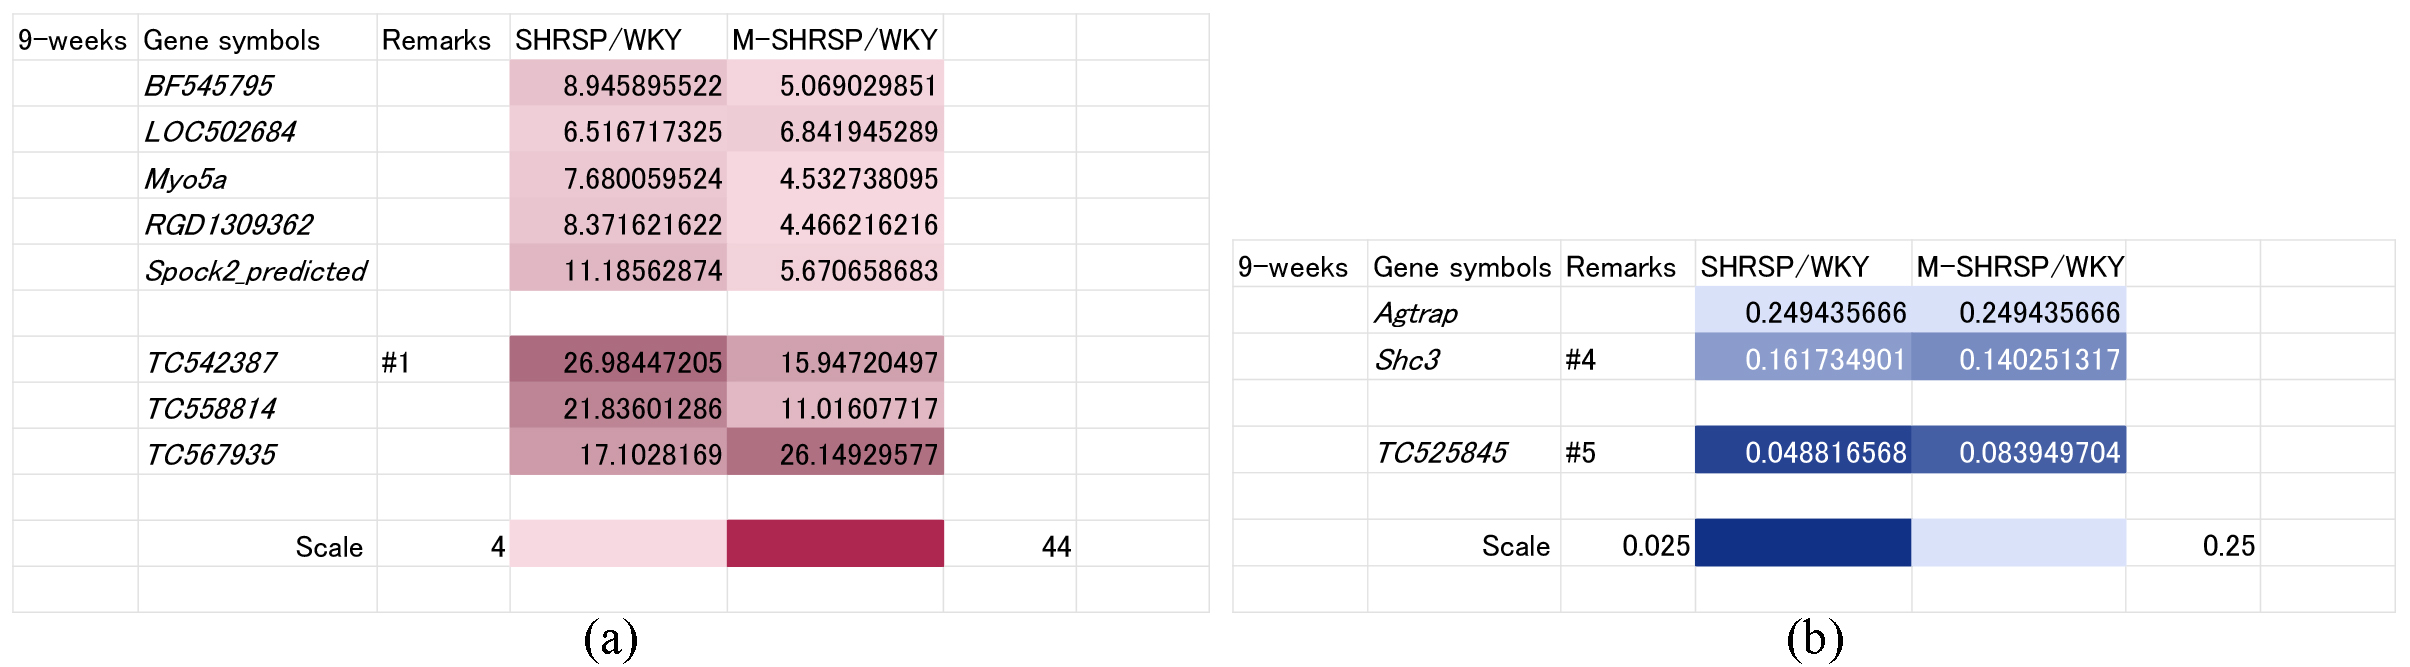 Fig. 4.
Genes significantly up or down regulated both in SHRSPs and in M-SHRSPs at 9-weeks of age compared with age-matched WKY. Heat maps show genes either up regulated more than 4-fold (a) or down regulated more than 0.25-fold (b) in both 9-week old SHRSPs and in M-SHRSPs vs age-matched WKY. Numbers shown in the remarks column refer to the duplication of gene data from other figures. WKY, Wistar Kyoto rats; SHRSP, stroke-prone spontaneously hypertensive rats; M-SHRSP, malignant SHRSP.
In this study, we identified hypertensive-related genes that were either up or down regulated in SHR, SHRSP and/or M-SHRSP rats compared to WKY rats. These genes were classified into four categories according to their postulated association with hypertension: (1) genes primarily pathogenic for the onset of hypertension (Group-1); (2) genes whose expression does not appear to be related to the onset of hypertension, but which may strengthen hypertensive conditions (Group-2); (3) genes whose involvement in hypertension is presently unknown, but which could in future be linked to the onset or the strengthening of hypertension after further investigation (Group-3), and (4) genes whose involvement in hypertension is less likely, but which may be associated with physiological characteristics of SHRs other than hypertension (Group-4).
Through careful measurement, we found that the increase in SBP of SHRs at 9-weeks of age was similar to that of M-SHRSPs as young as 6-weeks old (Fig. 1a). Furthermore, the SBP was significantly higher in 9-week old SHRSP and M-SHRSP, even when compared with that of 20-week old SHR from other experiments (Fig. 1b). Based on these observations, we hypothesize that most upstream genetic alterations relevant to the onset of hypertension occur in the early period, while the expressions of genes in the latter period may instead act to maintain or strengthen hypertensive conditions. Moreover, we postulate that the expression level of candidate genes would be altered in different substrains of SHRs, but not in WKY. To investigate this we employed DNA microarray technology as described previously by our group [15]. We identified several genes that may be associated with spontaneous hypertension in SHRs. At the age of 6-weeks, 13 mostly up regulated genes were selected from 31 genes listed in the upper part of Table 1. These genes were associated with increases in the SBP of SHR substrains: Abca9_predicted, Adam23_predicted, Gsg1, Padi2, Qprt, S100b, Snca, AI502837, AI715122, CO406073, TC525865, TC542387 (#1) and TC558248.
| Gene symbols | Remarks | Protein names | Postulated associated with hypertension |
| Abca9_predicted | ATP binding cassette subfamily A member 9 | Group-4 | |
| Adam23_predicted | ADAM metallopeptidase domain 23 | Group-1 | |
| Gsg1 | germ cell associated 1 | Group-3 | |
| Padi2 | peptidyl arginine deiminase 2 | Group-3 | |
| Qprt | quinolinate phosphoribosyltransferase | Group-3 | |
| S100b | S100 calcium binding protein B | Group-4 | |
| Snca | synuclein alpha | Group-3 | |
| AI502837 | cDNA clone UI-R-BT0-pl-e-03-0-UI 3’ | Group-3 | |
| AI715122 | cDNA clone UI-R-Y0-abl-d-08-0-UI 3’ | Group-3 | |
| CO406073 | cDNA clone IMAGE:7319013 5’ | Group-3 | |
| TC525865 | Unknown gene | Group-3 | |
| TC542387 | #1 | Unknown gene | Group-3 |
| TC558248 | Unknown gene | Group-3 | |
| Aqp4 | aquaporin 4 | Group-4 | |
| Cxcr3 | C-X-C motif chemokine receptor 3 | Group-3 | |
| Ephx2 | #2 | epoxide hydrolase 2 | Group-4 |
| Homer2 | #3 | homer scaffold protein 2 | Group-3 |
| Kcnc2 | potassium voltage-gated channel subfamily C member 2 | Group-1 | |
| Kcnq5 | potassium voltage-gated channel subfamily Q member 5 | Group-1 | |
| Ltb4dh | #4 | leukotriene B4 protein | Group-4 |
| XM_344042 | Unknown gene | Group-3 | |
| XM_344378 | Unknown gene | Group-3 | |
| Based on physiological and biochemical information, each gene was classified into one of four groups as follows: Group-1: gene primarily pathogenic for the
onset of hypertension; Group-2: gene whose expression does not appear to be
related to the onset of hypertension, but which might strengthen hypertensive
conditions; Group-3: gene whose involvement in hypertension is presently unknown,
but which may in future be associated with the onset or strengthening
hypertension after further investigation; Group-4: gene whose involvement in
hypertension is less likely but which might be associated with physiological
characteristics of SHRs other than hypertension.
Numbers shown in the remarks column refer to the duplication of gene data from
other figures.
WKY, Wistar Kyoto rats; SHRSP, stroke-prone spontaneously hypertensive rats; M-SHRSP, malignant SHRSP. | |||
Various hypertension-related genes identified in previous reports will now be
considered one by one. The functional involvement of Abca9_predicted
gene [20] in hypertension has so far been uncertain, but it may be causal for
hypermetabolism in SHRs through ABC-mediated proteins transport of various
molecules across extra- and intracellular membranes. We, therefore, categorized
Abca9_predicted as Group-4. Adam23 was originally reported to be
involved in cancer and neuronal differentiation [21, 22]. More recently, Adam23
was reported to be a negative regulator of K
Nine of the 24 genes that were down regulated by more than 0.25-fold in all
three SHR substrains at 6-weeks of age are shown in the lower part of Table 1.
Known genes were Aqp4, Cxcr3, Ephx2 (#2),
Homer2 (#3), Kcnc2, Kcnq5, and Ltb4dh (#4),
while the unknown genes were XM_344042 and XM_344378.
Aqp4 (aquaporin 4) is expressed by astrocytes in the CNS
(central nervous system) [28], and is involved in water movement, cell migration
and neuroexcitation [29]. It was classified into Group-4, since down regulation
of this gene may cause hydrocephaly in SHRs. Previously, it was reported that
mice lacking the Cxcr3 chemokine receptor suffer from hypertension [30]. Mice
deficient in Cxcr3 exhibit up regulation of angiotensin II type I
receptor (ATIR) in VSMC, suggesting the importance of this gene in vascular
contractility and hypertension through up regulation of AT1R expression.
However, since the mechanistic relationship between down regulation of
Cxcr3 and up regulation of AT1R is not yet clear, this gene was
classified as Group-3. Due to the potent vasodilatory effects of
epoxyeicosatrienoic acids (EETs) on VSMC, the metabolizer of EETs on the
overproduction of Ephx2 leads to reduced vasorelaxation and hence to subsequent
hypertension [31]. However, down regulation of Ephx2 (#2) in the
mesenteric artery does not appear to be actively involved in the pathogenesis of
hypertension. Based on our observations, the down regulation of Ephx2
may be compensatory for increased blood pressure and was therefore classified as
Group-4. Homer2 is widely expressed in many tissue types including
muscles (NCBI Gene Databank, Gene ID: 29547). Although the long form Homer 1c
plays a role in synaptic changes during long-term potentiation, the biological
role of Homer 2 in the circulatory system is not yet clear. Thus,
Homer2 was categorized as Group-3. The Kcnc2 and Kcnq5
genes are likely to be involved in the development of hypertension. Bearing in
mind the role of K
Particular attention was also paid in this study to genes that were up or down regulated in M-SHRSP and SHR at 6- and 9-weeks of age, respectively. As shown in Fig. 3, 8 genes were up regulated and 7 genes were down regulated. The known up regulated genes were AW143870, Bcas1, BG664685, BI292956, Pou3f1, and LOC679668, while the unknown genes were TC539990, and TC542387 (upper part in Table 2).
| Gene symbols | Remarks | Protein names | Postulated association with hypertension |
| (Up and down regulated genes in 6-week old M-SHRSP/WKY and in 9-week old SHR/WKY) | |||
| AW143870 | cDNA clone RGICB87 5’ end | Group-3 | |
| Bcas1 | brain enriched myelin associated protein 1 | Group-3 | |
| BG664685 | cDNA clone DRABHF03 5’ | Group-3 | |
| BI294956 | cDNA clone UI-R-DK0-cee-a-12-0-UI 3’ | Group-3 | |
| Pou3f1 | POU class 3 homeobox 1 | Group-3 | |
| LOC679668 | LRRTM1:leucine rich repeat transmembrane neuronal 1 | Group-3 | |
| TC539990 | unknown gene | Group-3 | |
| TC542387 | #1 | unknown gene | Group-3 |
| Cmah | cytidine monophospho-N-acetylneuraminic acid hydroxylase | Group-3 | |
| Ephx2 | #2 | epoxide hydrolase 2 | Group-4 |
| Homer2 | #3 | homer scaffold protein 2 | Group-3 |
| Ltb4dh | #4 | leukotriene B4 protein | Group-4 |
| Ptprj | protein tyrosine phosphatase receptor type J | Group-4 | |
| TC525845 | #5 | unknown gene | Group-3 |
| TC540893 | unknown gene | Group-3 | |
| (Up and down regulated genes in 9-week of old SHRSP/WKY and M-SHRSP/WKY ) | |||
| BF545795 | cDNA clone UI-R-BT0-qc-d-07-0-UI 5’ | Group-3 | |
| LOC502684 | hypothetical protein LOC502684 | Group-3 | |
| Myo5a | myosin VA | Group-3 | |
| RGD1309362 | similar to interferon-inducible GTPase | Group-3 | |
| Spock2_predicted | osteonectin, cwcv and kazal like domains proteoglycan 2 | Group-2 | |
| TC542387 | #1 | unknown gene | Group-3 |
| TC558814 | unknown gene | Group-3 | |
| TC567935 | unknown gene | Group-3 | |
| Agtrap | angiotensin II receptor associated protein | Group-2 | |
| Shc3 | SHC adaptor protein 3 | Group-4 | |
| TC525845 | #5 | unknown gene | Group-3 |
| Based on physiological and biochemical information, each gene was classified into one of the four groups described in Table 1 above. Numbers shown in the remarks column refer to the duplication of gene data from other figures. WKY, Wistar Kyoto rats; SHRSP, stroke-prone spontaneously hypertensive rats; M-SHRSP, malignant SHRSP. | |||
Since there is little information on AW143870, this gene was categorized as Group-3. Bcas1 is known to reside in a region of 20q13 that is amplified in several tumor types [35]. However, there is no information with regard to hypertension and hence this gene was categorized as Group-3. There is also little biochemical information available for BG664685 and BI294956. Pou3f1 is thought to be involved in early embryogenesis and neurogenesis [36]. LOC679668 encodes a leucine-rich repeat transmembrane protein that interacts with neurexins and neuroligins to modulate synaptic cell adhesion. TC539990 and TC542387 are unknown genes. Hence, these 6 genes were also classified as Group-3.
Cmah is expressed in the brain and neuronal cells and produces N-glycolylneuraminic acid [37]. However, there is no information available in relation to hypertension and therefore it was categorized as Group-3. Ephx2, Homer2 and Ltb4dh were categorized as Group-4, Group-3 and Group-4, respectively, as mentioned above. Ptprj is a member of the protein tyrosine phosphatase family and regulates a variety of cellular processes including cell growth. Since the down regulation of Ptprj might act as compensatory factor for hypermetabolism in SHRs, this gene was classified as Group-4. TC525845 and TC540893 are unknown genes and were therefore classified as Group-3.
Lastly, we focused on genes that were up regulated in both SHRSPs and M-SHRSPs at 9-weeks of age (Fig. 4). These were categorized as shown in below of Table 2. Since there is little information on BF545795, LOC502684 and RGD1309362 in relation to hypertension [38], these genes were classified as Group-3. Myo5a belongs to the Myosin V heavy-chain class of genes [39] that code for actin-based motor protein involved in cytoplasmic vesicle transport and mRNA translocation. Since this could relate to hyperactivation in hypertension, Myo5a was classified as Group-4 because there is still little information on the circulatory system. Spock2 is an extracellular heparan/chondroitin sulfate proteoglycan [40]. Vascular stiffness is an important factor for vascular resistance and is regulated by ECM [41]. Increased vascular stiffness in SHRs caused by the overproduction of Spock2 may strengthen hypertension, hence this gene was categorized as Group 2. There is little information on the biochemical pathways for TC542387 (#1), TC558814, and TC567935 and hence these were classified as Group-3.
Agtrap, Shc3 and TC525845 were markedly down regulated at 9-weeks of age. Agtrap interacts with AT1R to promote its constitutive internalization, thus inhibiting the hyperactivation of downstream signaling and augmenting the effects of angiotensin II (Ang II) [42]. Using an ex vivo system, Zhang et al. [43] recently reported that treatment of the mesenteric artery with Ang II led to the attenuation of acetylcholine (Ach)-induced vascular relaxation, thus demonstrating a direct effects of Ang II on the mesenteric artery. Agtrap is likely to counteract vasoconstriction of the mesenteric artery via the constitutive internalization of AT1R, thus inhibiting the activation of Ang II signaling. Down regulation of Agtrap in SHRs may therefore lead to increased activation of Ang II signaling in the mesenteric artery. This is at least partly causative of hypertension and Agtrap was therefore classified as Group-2. Shc3 is predicted to be involved in glutamatergic synaptic transmission and epidermal growth factor/neuregulin signaling in the tyrosine kinase-signaling pathway. Thus, Shc3 reduces hypertension and was classified as Group-4. No information was available for the down regulated gene TC525845 (#5, unknown gene) and therefore it was categorized as Group-3.
To summarize the above findings, the genes thought to be involved in the onset of hypertension (Group-1) or to promote, maintain or strengthen hypertension (Group-2) were identified as follows.
Group-1: Adam23_predicted, Kcnc2, and Kcnq5
Group-2: Spock_predicted, and Agtrap
The down regulation of K
Two genes thought to be directly involved in the onset of hypertension were Kcnc2, and Kcnq5. Fig. 5 shows the proposed action of these genes in more detail.
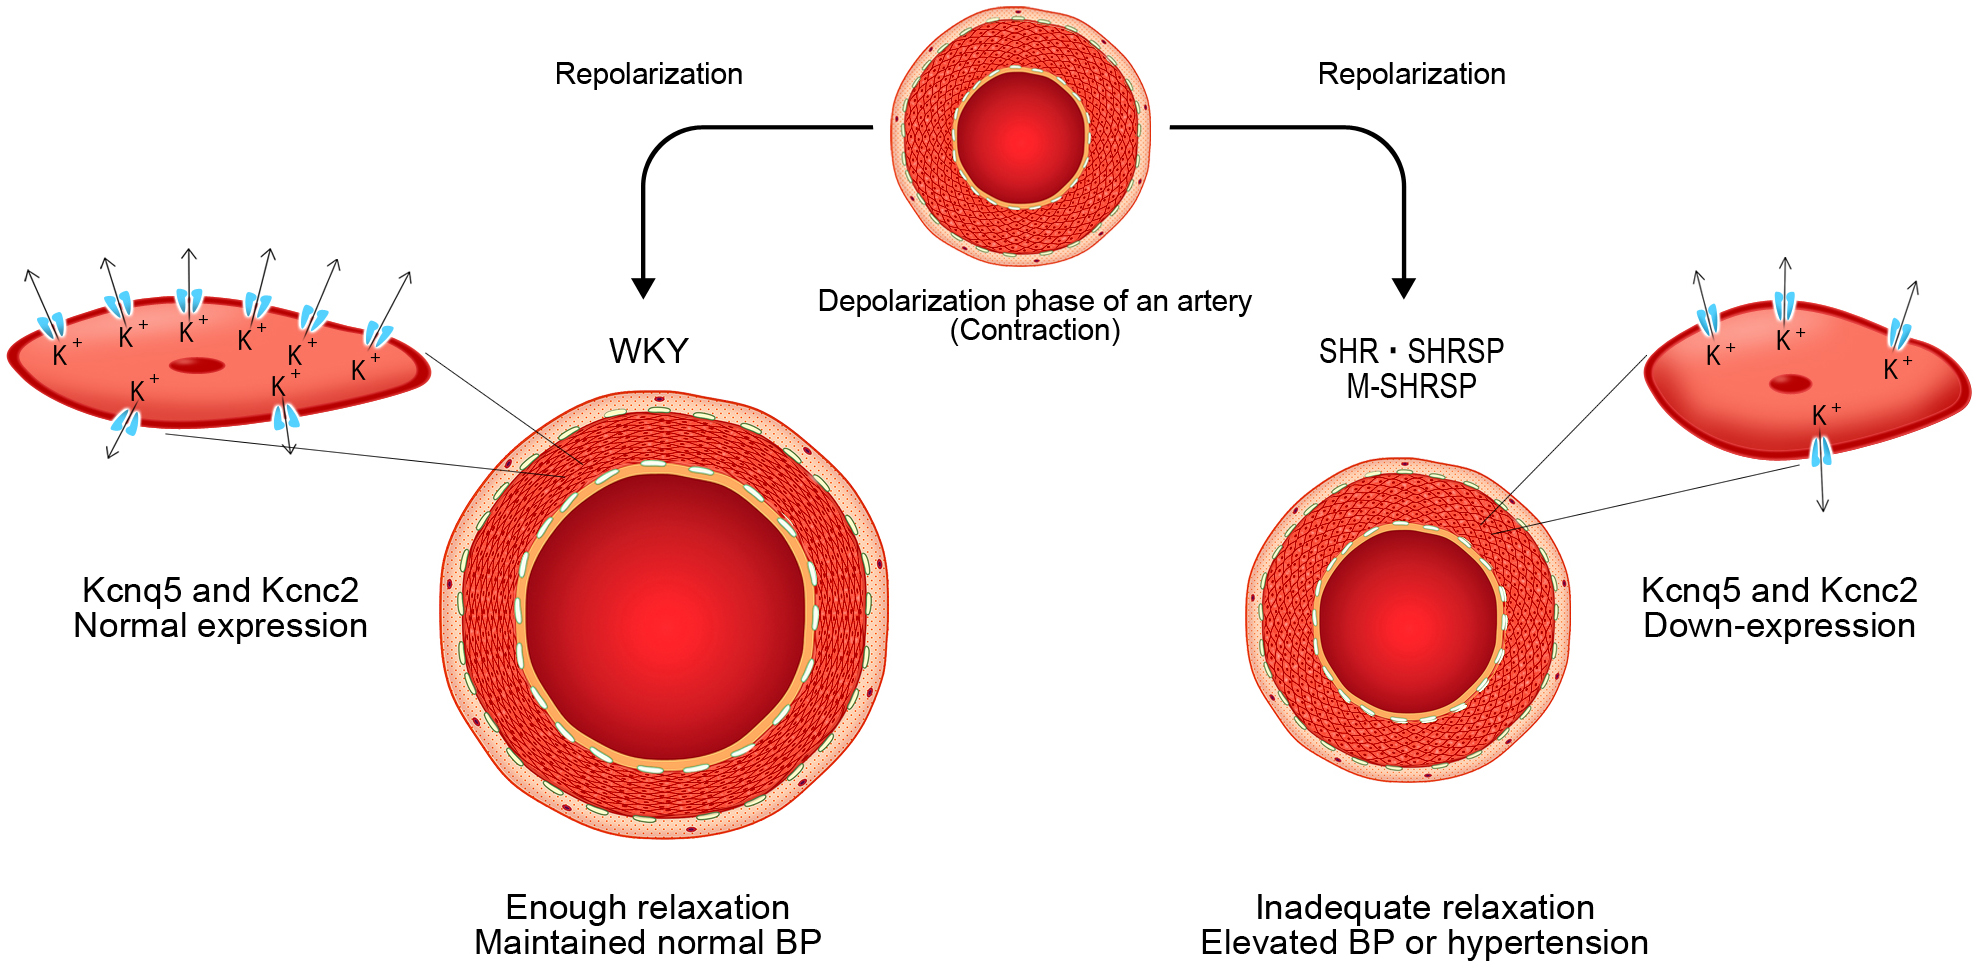 Fig. 5.
Schematic representation of the initial changes that occur
during the onset of spontaneous hypertension. In WKY, the mesenteric-resistant
artery recovers from contraction following the depolarization of the E
Conceptualization—YA and HH; methodology—MSA and HH; software—TH and KK; validation—TH and KK; investigation—MSA and HH; data curation—YA and HH; writing—YA and HH; and supervision—HH.
Not applicable.
We kindly acknowledge Kozo Okamoto, who generated the SHRs and worked for a long time as the dean of Kindai University School of Medicine. We are indebted to Yuji Misaki for the design of Fig. 5.
This research received no external funding.
The authors declare no conflict of interest.