


 , Bofeng Zhu 1,5,6,*
1 Guangzhou Key Laboratory of Forensic Multi-Omics for Precision Identification, School of Forensic Medicine, Southern Medical University, 510515 Guangzhou, Guangdong, China
2 Department of Ophthalmology, The Six Affiliated Hospital of Guangzhou Medical University, Qingyuan People’s Hospital, 511500 Guangzhou, Guangdong, China
3 Zhujiang Hospital, Southern Medical University, 510282 Guangzhou, Guangdong, China
4 Institute of Brain and Behavioral Sciences, College of Life Sciences, Shaanxi Normal University, 710062 Xi’an, Shaanxi, China
5 Key Laboratory of Shaanxi Province for Craniofacial Precision Medicine Research, College of Stomatology, Xi’an Jiaotong University, 710000 Xi’an, Shaanxi, China
6 Clinical Research Center of Shaanxi Province for Dental and Maxillofacial Diseases, College of Stomatology, Xi’an Jiaotong University, 710000 Xi’an, Shaanxi, China
Academic Editor: Graham Pawelec
Abstract
Background: InDel polymorphisms show great potential for use with challenging DNA samples in forensic practice due to having similar advantages to STRs and SNPs. Large-scale InDel genotype data are becoming available world wide populations, thus providing an alternative for investigating genetic architectures in rarely studied populations from a genome perspective. Methods: Here, we genotyped 47 highly polymorphic InDel variations in 157 Mongolian and 100 Ewenki individuals from the Inner Mongolia Autonomous Region of China in order to evaluate their utility for forensic purposes. Results: The CDPs of the 47 InDels for these groups were calculated to be 0.999999999999999999874 and 0.999999999999999999677, respectively, while the CPEs were 0.99981 and 0.99975, respectively. The 47 InDel variations were therefore an efficient tool for forensic personal identification in the Mongolian and Ewenki ethnic groups. Comparison of results from the present study with datasets from previously published literatures and from the 1000 Genomes Project revealed a prominent East Asian ancestry component in the gene pool of both ethnic groups, hinting at the close genetic relationships between Mongolian, Ewenki and most East Asian populations. Furthermore, Han populations from northern China showed even closer genetic affinities with the Mongolian and Ewenki groups. Conclusions: The data presented here would facilitate the forensic application of InDels for Mongolian and Ewenki ethnic minorities and expand our knowledge regarding the genetic diversities of these populations.
Keywords
- InDel
- Mongolian
- Ewenki
- forensic efficiency
- genetic structure
The efficiency of novel molecular genetic markers for forensic genetic applications has been widely investigated in recent years. A new era started with the first application of DNA fingerprinting in a paternity test case [1]. Subsequently, short tandem repeats (STRs) became the most common genetic markers used in human identification and parentage testing because of their high polymorphisms and genotyping convenience [2]. STR-based genetic profiling has become the gold standard in forensic DNA analysis due to the generalized establishment of STR databases in worldwide populations [3, 4]. However, the poor resolution of degraded or low-template DNA samples caused by adverse environmental conditions remains very challenging for forensic DNA laboratories, despite the substantial progress made in STR genotyping technology. Apart from the stutter peaks, forensic case samples sometimes also show genotyping failures of large amplicons in STR profiling. This has led to a search for more suitable molecular genetic markers. Whole genome sequencing technology can identify many novel variants and offer tremendous potential for uncovering better genetic markers for more challenging forensic samples [5, 6]. The superior feasibility of single nucleotide polymorphisms (SNPs) has already been documented for the individual identification, biogeographic ancestry inference, external visible trait prediction, and genealogical inference [7, 8, 9, 10]. However, the complex experimental procedure of the SNaPshot assay make it time-consuming and susceptible to contamination, thus hampering the widespread use of SNPs in routine forensic DNA laboratories.
The di-allelic insertion/deletion (InDel) genetic marker is a length-based polymorphism that can overcome some of the drawbacks of STRs and SNPs [11, 12]. The characteristics of genome abundance, relatively low mutation rate, small amplicon size and compatibility with current capillary electrophoresis (CE) platform favor the use of InDels as a supplementary tool for STRs. Besides, it is recently reported that InDels are useful for individual identification, mixed DNA identification and deconvolution, as well as for population genetic analyses such as biogeographic ancestry inference in forensic DNA analysis [13, 14, 15, 16]. The first commercially available InDel-based panel is developed by QIAGEN for the multiplex amplification of 30 InDels plus a sex-determining marker (Amelogenin) [17]. By taking advantage of smaller amplicon size and CE platform compatibility, the Investigator DIPplex kit provides better resolution for degraded DNA, while having similar sensitivity to STR- and SNP-based approaches for human identification [13, 18, 19]. To further establish the application of InDels as an acceptable supplementary tool for STRs, additional InDel-based genotyping systems must be developed and validated in different populations. A newly released amplification system that incorporates 47 autosomal InDels, 2 Y-chromosomal InDels and Amelogenin have recently been used to obtain genotype data for different populations within China [20]. However, this amplification system is still in its infancy and more population data are needed before it can be widely used.
So far, genetic variations in the ethnic minorities of northern China have not been systematically studied. The Inner Mongolia Autonomous Region (IMAR), located in northern China, is a centuries-old settlement area for the Han population and many other ethnic minorities. Geographically speaking, IMAR is adjacent to more than 10 provinces from the northeast and southwest parts of China, while bordering Russia and Mongolia to the north. This unique biogeographic location provides an important scenario for the study of gene interactions among different ethnic minorities in the region, with great potential to conduct population genetics-related research. The Mongolian group is the most centralized ethnic minority in IMAR, with a population of 4.8 million according to the 2010 census. The Mongolians are well known in the world for the Mongol Empire, founded by Genghis Khan in the 13th century. As documented in historical records, the Mongolians played a significant role in guiding the genetic drift of populations they came into contact with, especially after construction of the Mongol Empire and conquering of the Eurasian continent under Genghis Khan. The territorial expansion of the Mongol Empire facilitated gene interactions between Mongols and Europeans, leaving notable effects on the genetic structure of Eurasians [21, 22]. Genome-wide analysis has revealed that the largest ancestral component in the genome of Mongolians matches that of East Asian genetic components [23]. Mongolians display a closer genetic relationship with East Asians than South Asians. The genetic exploration of Mongolians may shed light on the background of the Mongolian group and its neighboring populations.
The Ewenki group is one of the ethnic minorities in northern China with rich cultural forms. The size of the Ewenki population is 30,875 according to the 2010 census. Ewenkis live mainly in the Hulun Buir area of IMAR and in the Great Khingan Mountains in Heilongjiang Province, China. The mixed residence of Ewenkis with neighboring ethnic minorities means that gene interactions are inevitable during their populations’ history. It is therefore essential to reveal these relations from a genetic perspective. Moreover, the Ewenki group faces a crisis of cultural ablation and marginalization due to their small population and the influence of cultural globalization. Scholars from diverse research fields have made considerable efforts to study the customs of Ewenki and to strengthen the protection and passage of traditional Ewenki culture and genetic resources. There is also considerable interest in determining the genetic affinities between the Ewenki group and its neighboring populations.
Currently, the genetic characteristics of ethnic minorities in IMAR are not well described in existing historical documentation and in population genetic data. InDel-based methods may provide an alternative approach for analyzing degraded biological samples when conventional STR analysis fails to produce reliable DNA profiling in forensic practice. Genetic exploration of InDel variations in different populations is therefore highly desirable for both anthropological and forensic research. In the present study, we explored the feasibility of 47 InDel loci for forensic purposes in two ethnic minorities, the Mongolian and Ewenki groups. By incorporating previously published population data and the population genetic dataset from the 1000 Genomes Project phase 3, we made genetic comparisons among these two ethnic minorities and the reference populations in order to obtain a more comprehensive genetic structure of the Mongolian and Ewenki groups.
Volunteers were recruited to the study if they complied with the following
conditions: (1) self-reported healthy condition; (2) no biological kinship
related to anteriorly recruited participants within at least three generations;
(3) no immigration or inter-marriage events in their family histories. In total,
257 blood samples were collected from two ethnic minorities (Mongolian and
Ewenki) of IMAR, China. The sample sizes were 157 Mongolian and 100 Ewenki
volunteers, respectively. Blood samples were stored at –20
PCR amplification of the overall loci was carried out in a single PCR system
using the reagents and reaction conditions as described in the manufacturer’s
protocol for the AGCU InDel 50 kit (AGCU, Wuxi, China) and performed in a GeneAmp
PCR 9700 Thermal Cycler (Applied Biosystem, Foster City, CA, USA). The 25
Genotype data for the 47 autosomal InDel variations in 26 reference populations from the 1000 Genomes Project Phase 3 were downloaded from the online website Ensemble Genome Browser (http://grch37.ensembl.org/index.html) in order to conduct inter-population genetic analyses. Previously published datasets describing genetic diversities in the 47 polymorphic InDel loci from different geographic regions in China were also integrated. These included data for the 47 InDels from the Hainan Han (HAH), Hainan Li (HNL), Zunyi Gelao (ZGL), Beijing Han (BJH), Henan Han (HNH), Heilongjiang Han (HLJH), Shandong Han (SDH), Shanxi Han (SXH), Tibetan, Chengdu Han (CDH), Yi, and Guangdong Han (GDH) populations [20, 24, 25, 26]. We then integrated the genotype data for CHB from the 1000 Genomes Project Phase 3 and BJH from previous research to create a combined dataset of 256 Han individuals from Beijing city, referred to as BJH in this study. Finally, a combined dataset was generated for the subsequent analyses by combining Mongolian, Ewenki and other individuals from 37 reference populations. Detailed information for the 26 continental reference populations derived from the 1000 Genomes Project Phase 3 is shown in Supplementary Table 1.
Forensic statistical parameters for the 47 InDel variations in the Mongolian and
Ewenki ethnic minorities were calculated using the browser-based STRAF
application (http://cmpg.unibe.ch/shiny/STRAF/) [27]. These included match
probability (MP) [28], discrimination power (DP), probability of exclusion (PE),
polymorphism information content (PIC) [29] and observed heterozygosity (Hob).
Linkage disequilibrium (LD) analyses of pairwise InDel loci in
each group were carried out using SNPAnalyzer version 2.0
(Istech, Goyang, South Korea) Software [30]. An r
The Dispan program was used to calculate Nei’s D
To investigate in more detail the substructure patterns for the two ethnic
minorities from IMAR and to infer the proportions of different ancestral genetic
components, STRUCTURE software (version 2.3.4, Pritchard & Stephens & Donnelly,
United Kingdom) was used to perform unsupervised ancestral component prediction
of the populations [37]. The length of burn-in period was 100,000 times followed
by 100,000 MCMC repetitions. Initial runs were performed without any prior
information about the sample origin and were based on the admixture model and
correlated allele frequencies pattern. The number of hypothetical ancestry
clusters (K) was set from 2 to 5, with 15 independent runs performed for each of
the tested K values. The optimal K was identified using the online web Harvester
program (http://taylor0.biology.ucla.edu/structureHarvester/) [38]. The average
permutated individual and population Q-matrices for 15 replicates of each K were
assessed by CLUMPP software (version 1.1.2, Jakobsson & Rosenberg, USA) [39].
Subsequent plotting (bar plot) was conducted using DISTRUCT software (version
1.1, Jakobsson & Rosenberg, USA) [40] with the input of CLUMPP results.
Phylogenetic construction of the two ethnic groups and of the reference
populations was generated based on D
To better visualize the parameter distributions and gain a comprehensive view of
the differences, Rstudio software
(https://www.rstudio.com/products/rstudio/download/) was used to draw the boxplot
of the forensic statistical parameters for the two ethnic minorities, the heat
map of the insertion allelic frequencies in five continental populations, and the
heat map of F
HWE exact tests for the 47 InDel loci in the Mongolian and Ewenki groups were
performed to confirm the validity of sample collection. After Bonferroni’s
correction, p value of
Before using the product law in the CDP and CPE calculations, LD tests of
pairwise InDel loci were performed to assess the independence of each InDel
locus. The results of LD analyses were mirrored by data matrix of inverted
triangles. As shown in Supplementary Fig. 1, none of the small block was
covered in crimson and no area was encircled by the thick black line with the
r
Allelic frequencies for the 47 InDel loci in the two ethnic minorities were calculated and the results were presented in Table 1. In the Mongolian group, the insertion allele frequencies ranged from 0.2803 at rs67939200 to 0.7548 at rs3834231, while in the Ewenki group they ranged from 0.2750 at rs67264216 and rs1127697 to 0.8050 at rs3834231. Overall, 89.36% and 82.98% of insertion allele frequencies were within the range of 0.3 to 0.7 in the Mongolian and Ewenki groups, respectively. PD values ranged from 0.5299 at rs3834231 to 0.6494 at rs66739142 in the Mongolian group, and from 0.4778 at rs3834231 to 0.6526 at rs5787309 in the Ewenki group. Hob values ranged from 0.3694 at rs67700747 to 0.5478 at rs5787309 in the Mongolian group, and from 0.2900 at rs3834231 to 0.6300 at rs151335218 in the Ewenki group. PE values ranged from 0.0964 at rs67700747 to 0.2328 at rs5787309 in the Mongolian group, and from 0.0595 at rs3834231 to 0.3284 at rs151335218 in the Ewenki group. Subsequently, boxplots were constructed to show the distribution of forensic parameters and to make comparison in the two ethnic groups. As depicted in Fig. 1, red and green boxes show the general data dispersion of forensic parameters in the two groups. The left side of the figure shows that most parameters (GD, Hobs, PM) were concentrated between 0.4 and 0.5, but not PDs and PEs. The median value of GD, Hobs, PD, PE and PM exceeded 0.4, 0.4, 0.6, 0.15 and 0.4, respectively, in both the Mongolian and Ewenki groups. Larger variations in the GD, Hob, PD, PE and PM values were observed in the Ewenki group. Forensic statistical parameters were then calculated to investigate the efficiencies of the 47 InDel loci for applications in individual identification and parentage testing. The CDP and CPE values were calculated to be 0.999999999999999999874 and 0.99981 respectively in the Mongolian group, and 0.999999999999999999677 and 0.99975 respectively in the Ewenki group. These results strongly support the 47 InDels as suitable tool for personal identification in the two ethnic groups. Supplementary Tables 2 and 3 summarize the detailed information regarding forensic parameters for the 47 InDel loci.
| ID | rs | Allele frequencies | I |
I |
I | ||||
| ESN | CHB | FIN | Ewenki | Mongolian | |||||
| 1 | rs72085595 | 0.8939 | 0.3033 | 0.6717 | 0.2950 | 0.3376 | 0.1742 | 0.1362 | 0.1103 |
| 2 | rs34287950 | 0.8535 | 0.4147 | 0.9444 | 0.4850 | 0.4108 | 0.1415 | 0.1155 | 0.0925 |
| 3 | rs71852971 | 0.8586 | 0.3341 | 0.3182 | 0.3100 | 0.3694 | 0.1324 | 0.1168 | 0.0949 |
| 4 | rs66477007 | 0.8333 | 0.6185 | 0.2879 | 0.6750 | 0.5573 | 0.1118 | 0.0963 | 0.0983 |
| 5 | rs79225518 | 0.9646 | 0.4810 | 0.7323 | 0.6400 | 0.5732 | 0.1071 | 0.0805 | 0.0648 |
| 6 | rs5897566 | 0.9192 | 0.6588 | 0.4545 | 0.5950 | 0.5955 | 0.1031 | 0.1026 | 0.0839 |
| 7 | rs538690481 | 0.0000 | 0.4100 | 0.1970 | 0.5200 | 0.4172 | 0.1029 | 0.0831 | 0.0678 |
| 8 | rs3067397 | 0.7778 | 0.3104 | 0.4293 | 0.3800 | 0.3248 | 0.0994 | 0.0943 | 0.0818 |
| 9 | rs66739142 | 0.9444 | 0.4882 | 0.8485 | 0.5350 | 0.5127 | 0.0869 | 0.0662 | 0.0575 |
| 10 | rs3029189 | 1.0000 | 0.6517 | 0.8485 | 0.6250 | 0.6242 | 0.0868 | 0.0658 | 0.0529 |
| 11 | rs67426579 | 0.1717 | 0.4408 | 0.6667 | 0.3850 | 0.3981 | 0.0857 | 0.0906 | 0.0737 |
| 12 | rs66595817 | 0.9242 | 0.6351 | 0.4747 | 0.7250 | 0.6815 | 0.0700 | 0.0556 | 0.0445 |
| 13 | rs3076465 | 0.8939 | 0.5095 | 0.3889 | 0.4900 | 0.4618 | 0.0678 | 0.0527 | 0.0530 |
| 14 | rs60575667 | 0.8535 | 0.4313 | 0.6414 | 0.4100 | 0.4618 | 0.0640 | 0.0622 | 0.0503 |
| 15 | rs35453727 | 0.8535 | 0.4408 | 0.8586 | 0.3900 | 0.4713 | 0.0633 | 0.0480 | 0.0456 |
| 16 | rs67100350 | 0.4798 | 0.5924 | 0.1919 | 0.5700 | 0.6210 | 0.0601 | 0.0678 | 0.0590 |
| 17 | rs34419736 | 0.7374 | 0.4265 | 0.4747 | 0.4150 | 0.3439 | 0.0572 | 0.0512 | 0.0451 |
| 18 | rs67365630 | 0.8283 | 0.4834 | 0.5556 | 0.5200 | 0.5478 | 0.0496 | 0.0381 | 0.0306 |
| 19 | rs67487831 | 0.9040 | 0.5640 | 0.6162 | 0.6950 | 0.6210 | 0.0495 | 0.0410 | 0.0330 |
| 20 | rs10558392 | 0.3889 | 0.6540 | 0.4394 | 0.5100 | 0.6146 | 0.0494 | 0.0446 | 0.0416 |
| 21 | rs67405073 | 0.8081 | 0.4384 | 0.6414 | 0.3950 | 0.4140 | 0.0492 | 0.0520 | 0.0417 |
| 22 | rs3217112 | 0.8636 | 0.5853 | 0.8182 | 0.6050 | 0.6019 | 0.0451 | 0.0340 | 0.0279 |
| 23 | rs35309403 | 0.4798 | 0.6280 | 0.2576 | 0.6900 | 0.6592 | 0.0418 | 0.0357 | 0.0303 |
| 24 | rs142221201 | 0.7727 | 0.7038 | 0.9495 | 0.6800 | 0.7038 | 0.0376 | 0.0286 | 0.0232 |
| 25 | rs35267904 | 0.3485 | 0.7038 | 0.5152 | 0.6650 | 0.6019 | 0.0353 | 0.0268 | 0.0221 |
| 26 | rs5787309 | 0.4192 | 0.4929 | 0.2828 | 0.4950 | 0.5223 | 0.0317 | 0.0412 | 0.0364 |
| 27 | rs145577149 | 0.6768 | 0.3886 | 0.5657 | 0.4150 | 0.3981 | 0.0314 | 0.0267 | 0.0232 |
| 28 | rs35065898 | 0.7727 | 0.5474 | 0.8232 | 0.5200 | 0.5764 | 0.0295 | 0.0243 | 0.0200 |
| 29 | rs11277697 | 0.4040 | 0.3863 | 0.6162 | 0.2750 | 0.4045 | 0.0290 | 0.0224 | 0.0191 |
| 30 | rs67939200 | 0.2677 | 0.3507 | 0.1717 | 0.2900 | 0.2803 | 0.0272 | 0.0207 | 0.0209 |
| 31 | rs1160980 | 0.6162 | 0.3957 | 0.5051 | 0.4250 | 0.4172 | 0.0272 | 0.0204 | 0.0179 |
| 32 | rs34421865 | 0.8889 | 0.6280 | 0.7929 | 0.5550 | 0.5669 | 0.0232 | 0.0175 | 0.0240 |
| 33 | rs139934789 | 0.7929 | 0.6682 | 0.5253 | 0.6450 | 0.6242 | 0.0213 | 0.0283 | 0.0254 |
| 34 | rs34529638 | 0.4848 | 0.6730 | 0.6869 | 0.6650 | 0.6752 | 0.0178 | 0.0165 | 0.0137 |
| 35 | rs34209360 | 0.8485 | 0.6896 | 0.7323 | 0.6950 | 0.6274 | 0.0139 | 0.0123 | 0.0132 |
| 36 | rs769299 | 0.4394 | 0.6280 | 0.4343 | 0.5700 | 0.5350 | 0.0136 | 0.0102 | 0.0148 |
| 37 | rs67700747 | 0.7222 | 0.7820 | 0.5556 | 0.7300 | 0.7389 | 0.0123 | 0.0265 | 0.0214 |
| 38 | rs145941537 | 0.3737 | 0.6327 | 0.6162 | 0.6550 | 0.6433 | 0.0121 | 0.0092 | 0.0086 |
| 39 | rs67264216 | 0.4646 | 0.3436 | 0.5253 | 0.2750 | 0.3248 | 0.0106 | 0.0087 | 0.0117 |
| 40 | rs35464887 | 0.5859 | 0.5071 | 0.4343 | 0.4400 | 0.4777 | 0.0098 | 0.0175 | 0.0156 |
| 41 | rs151335218 | 0.4192 | 0.5450 | 0.5455 | 0.5250 | 0.4968 | 0.0089 | 0.0182 | 0.0161 |
| 42 | rs140683187 | 0.5758 | 0.4052 | 0.5101 | 0.5400 | 0.5191 | 0.0086 | 0.0088 | 0.0080 |
| 43 | rs140323077 | 0.9141 | 0.7133 | 0.7879 | 0.7600 | 0.7102 | 0.0065 | 0.0146 | 0.0119 |
| 44 | rs10607699 | 0.7222 | 0.7038 | 0.5303 | 0.6400 | 0.6783 | 0.0063 | 0.0047 | 0.0044 |
| 45 | rs3834231 | 0.5556 | 0.6801 | 0.6111 | 0.8050 | 0.7548 | 0.0052 | 0.0039 | 0.0035 |
| 46 | rs33971783 | 0.4091 | 0.3839 | 0.5455 | 0.3200 | 0.3471 | 0.0025 | 0.0019 | 0.0039 |
| 47 | rs61490765 | 0.4242 | 0.5237 | 0.3283 | 0.4900 | 0.5287 | 0.0010 | 0.0023 | 0.0020 |
| Note: I | |||||||||
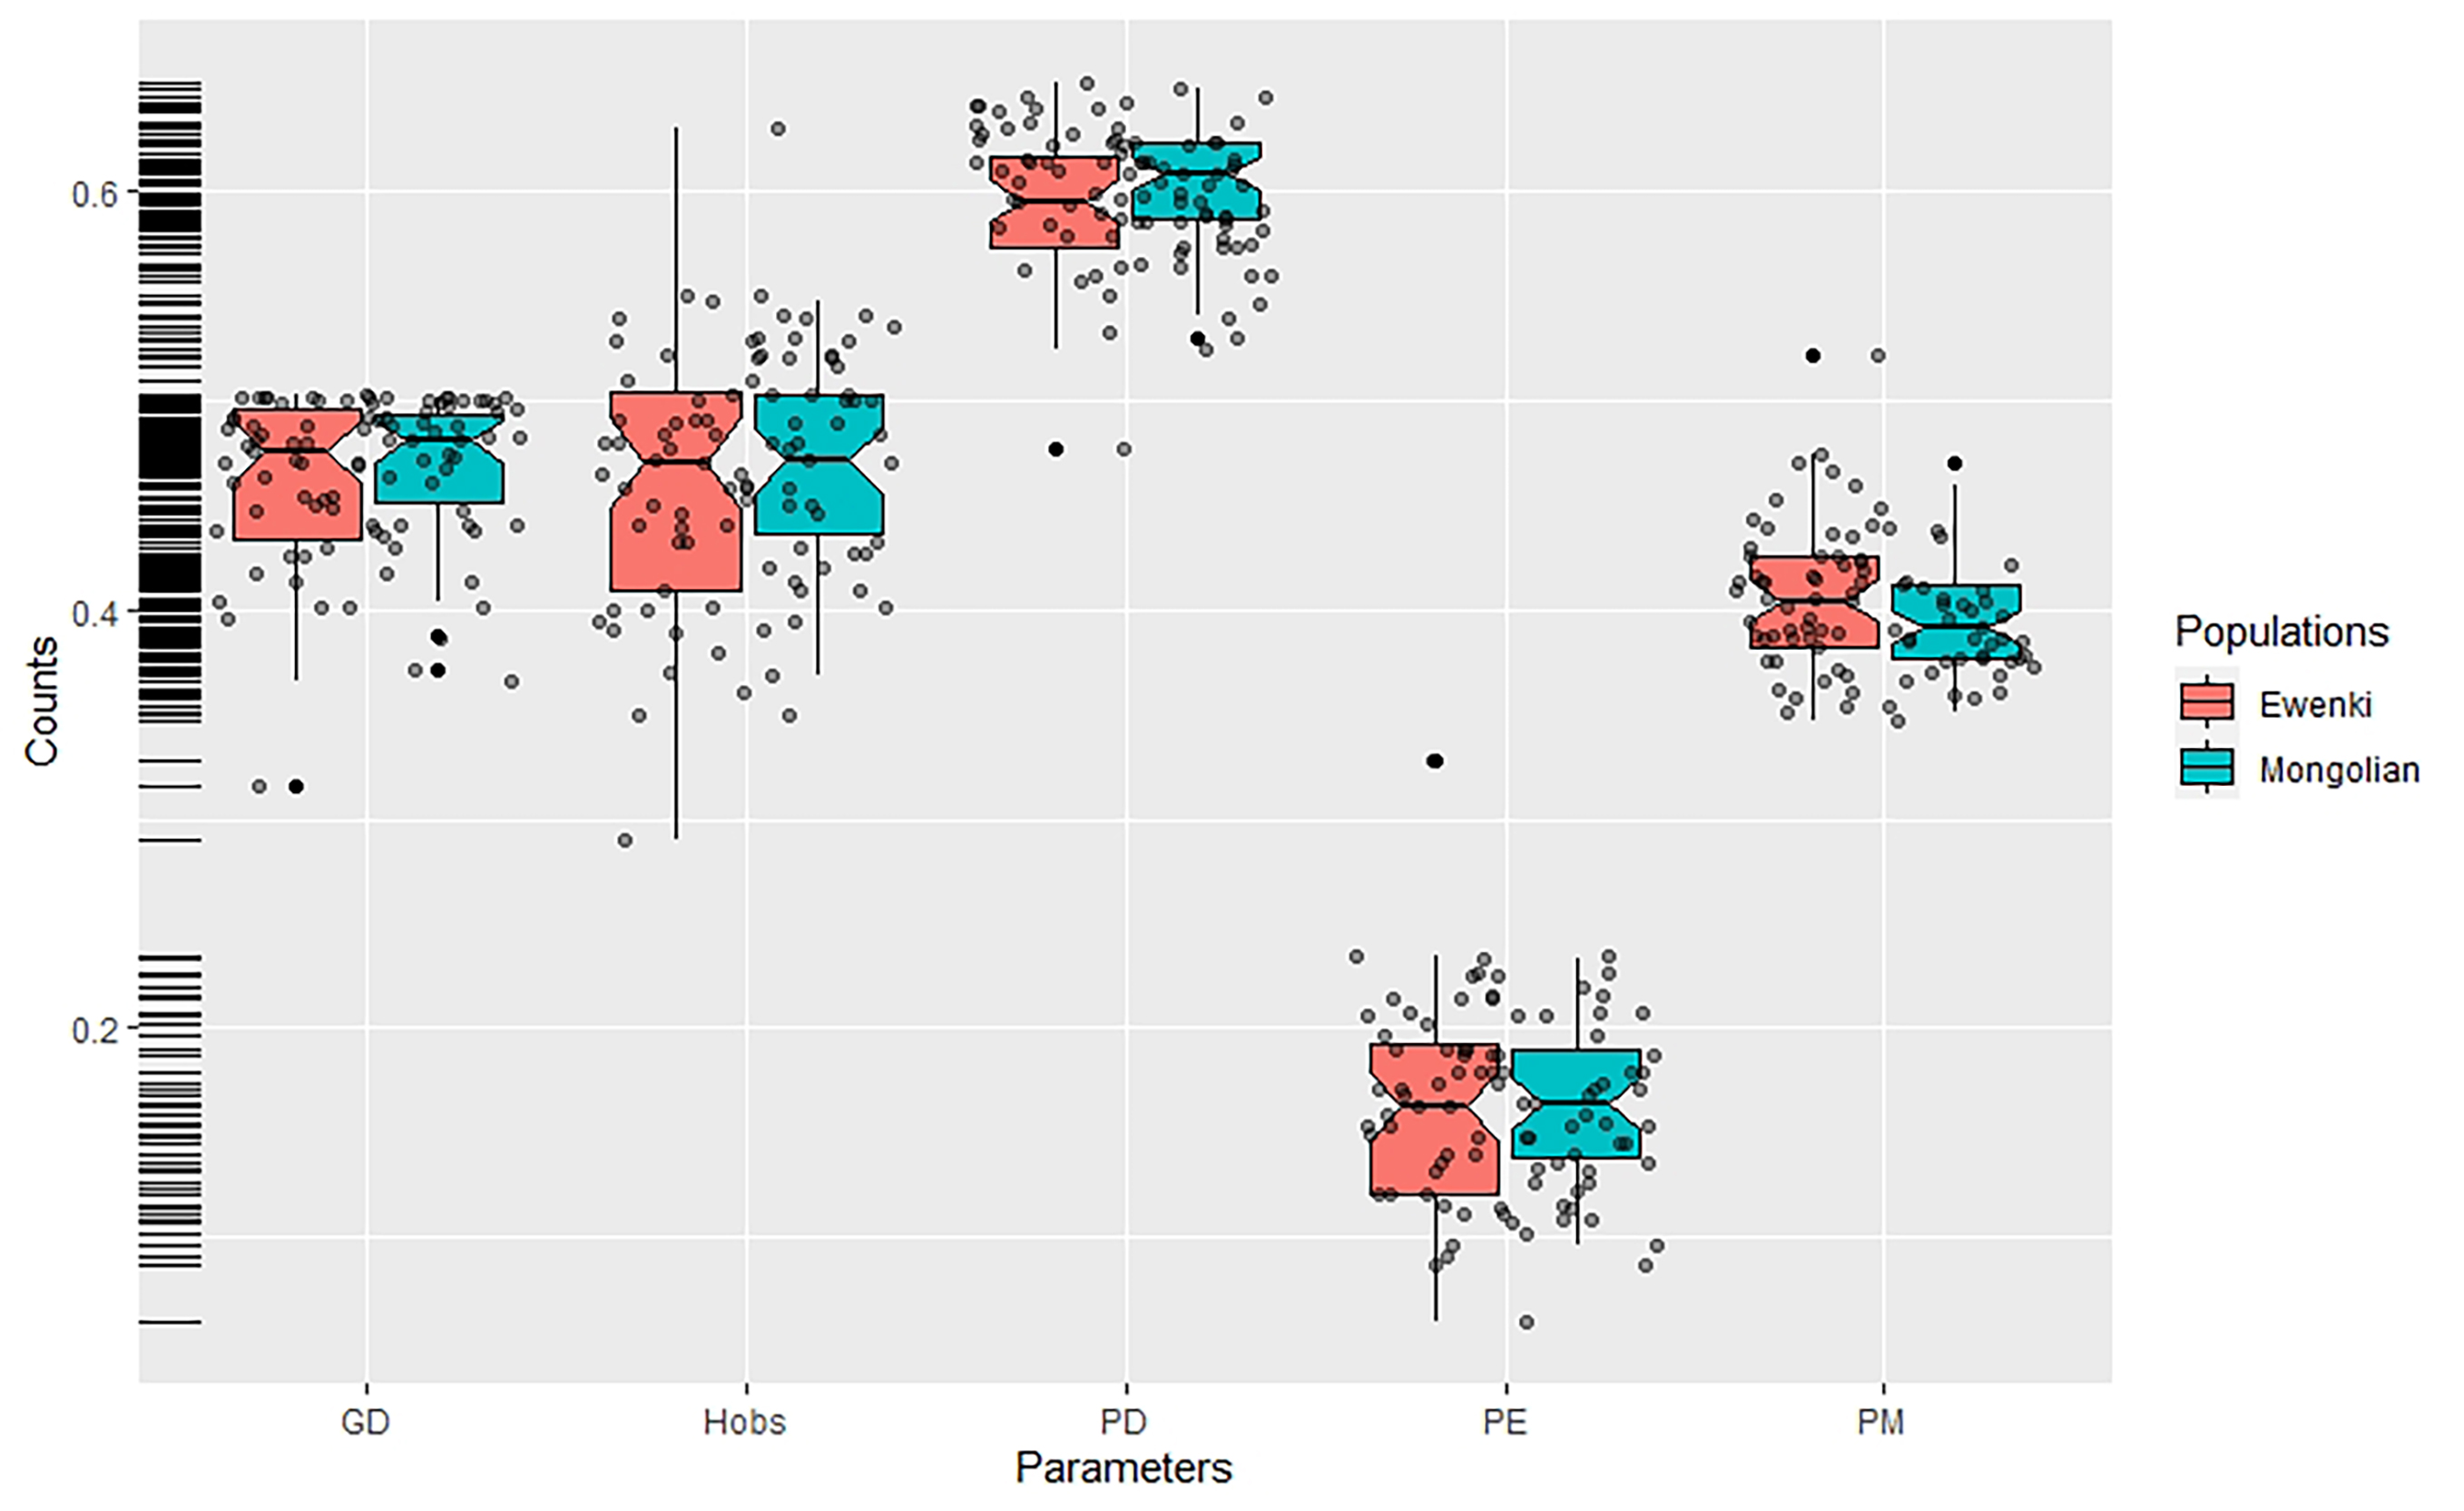 Fig. 1.
Box plot of the forensic statistical parameters (GD, Hobs, PD, PE and PM) in the two ethnic minorities. Vertical lines in the boxplot denote the range, middle lines denote the median, while the bottom and top of each box corresponds to the first and third quartiles, respectively. Individual data are represented by dark red dots.
Gene interactions are prone to occur among different populations living in the same biogeographic region. To examine how historical events shaped the genetic diversities of the two ethnic minorities in IMAR, genotype data for the 47 InDel loci in the overall 39 populations were assembled to determine population structures and genetic affinities. Firstly, a heat map of the insertion allele frequency matrix for the 47 InDel variations was generated to reflect population genetic diversities (Fig. 2). Insertion allele frequencies were represented by different colors, varying from light blue (0) to red (1). On the left and top of the figure, population clusters and locus clusters were generated based on the allele frequency distributions of the 47 InDel loci. In general, populations with similar allele frequency distributions shared the same sub-branch on the left clustering tree, with five clusters easily distinguished. The exceptions were CLM and PUR populations from America positioned in the European cluster. The Mongolian and Ewenki groups clustered with East Asian populations and located on the same sub-branch of the tree. InDel variants that exhibited similar insertion allelic frequencies in different populations were assembled at the top of the heat map and were in the same sub-branch as the other clustering tree.
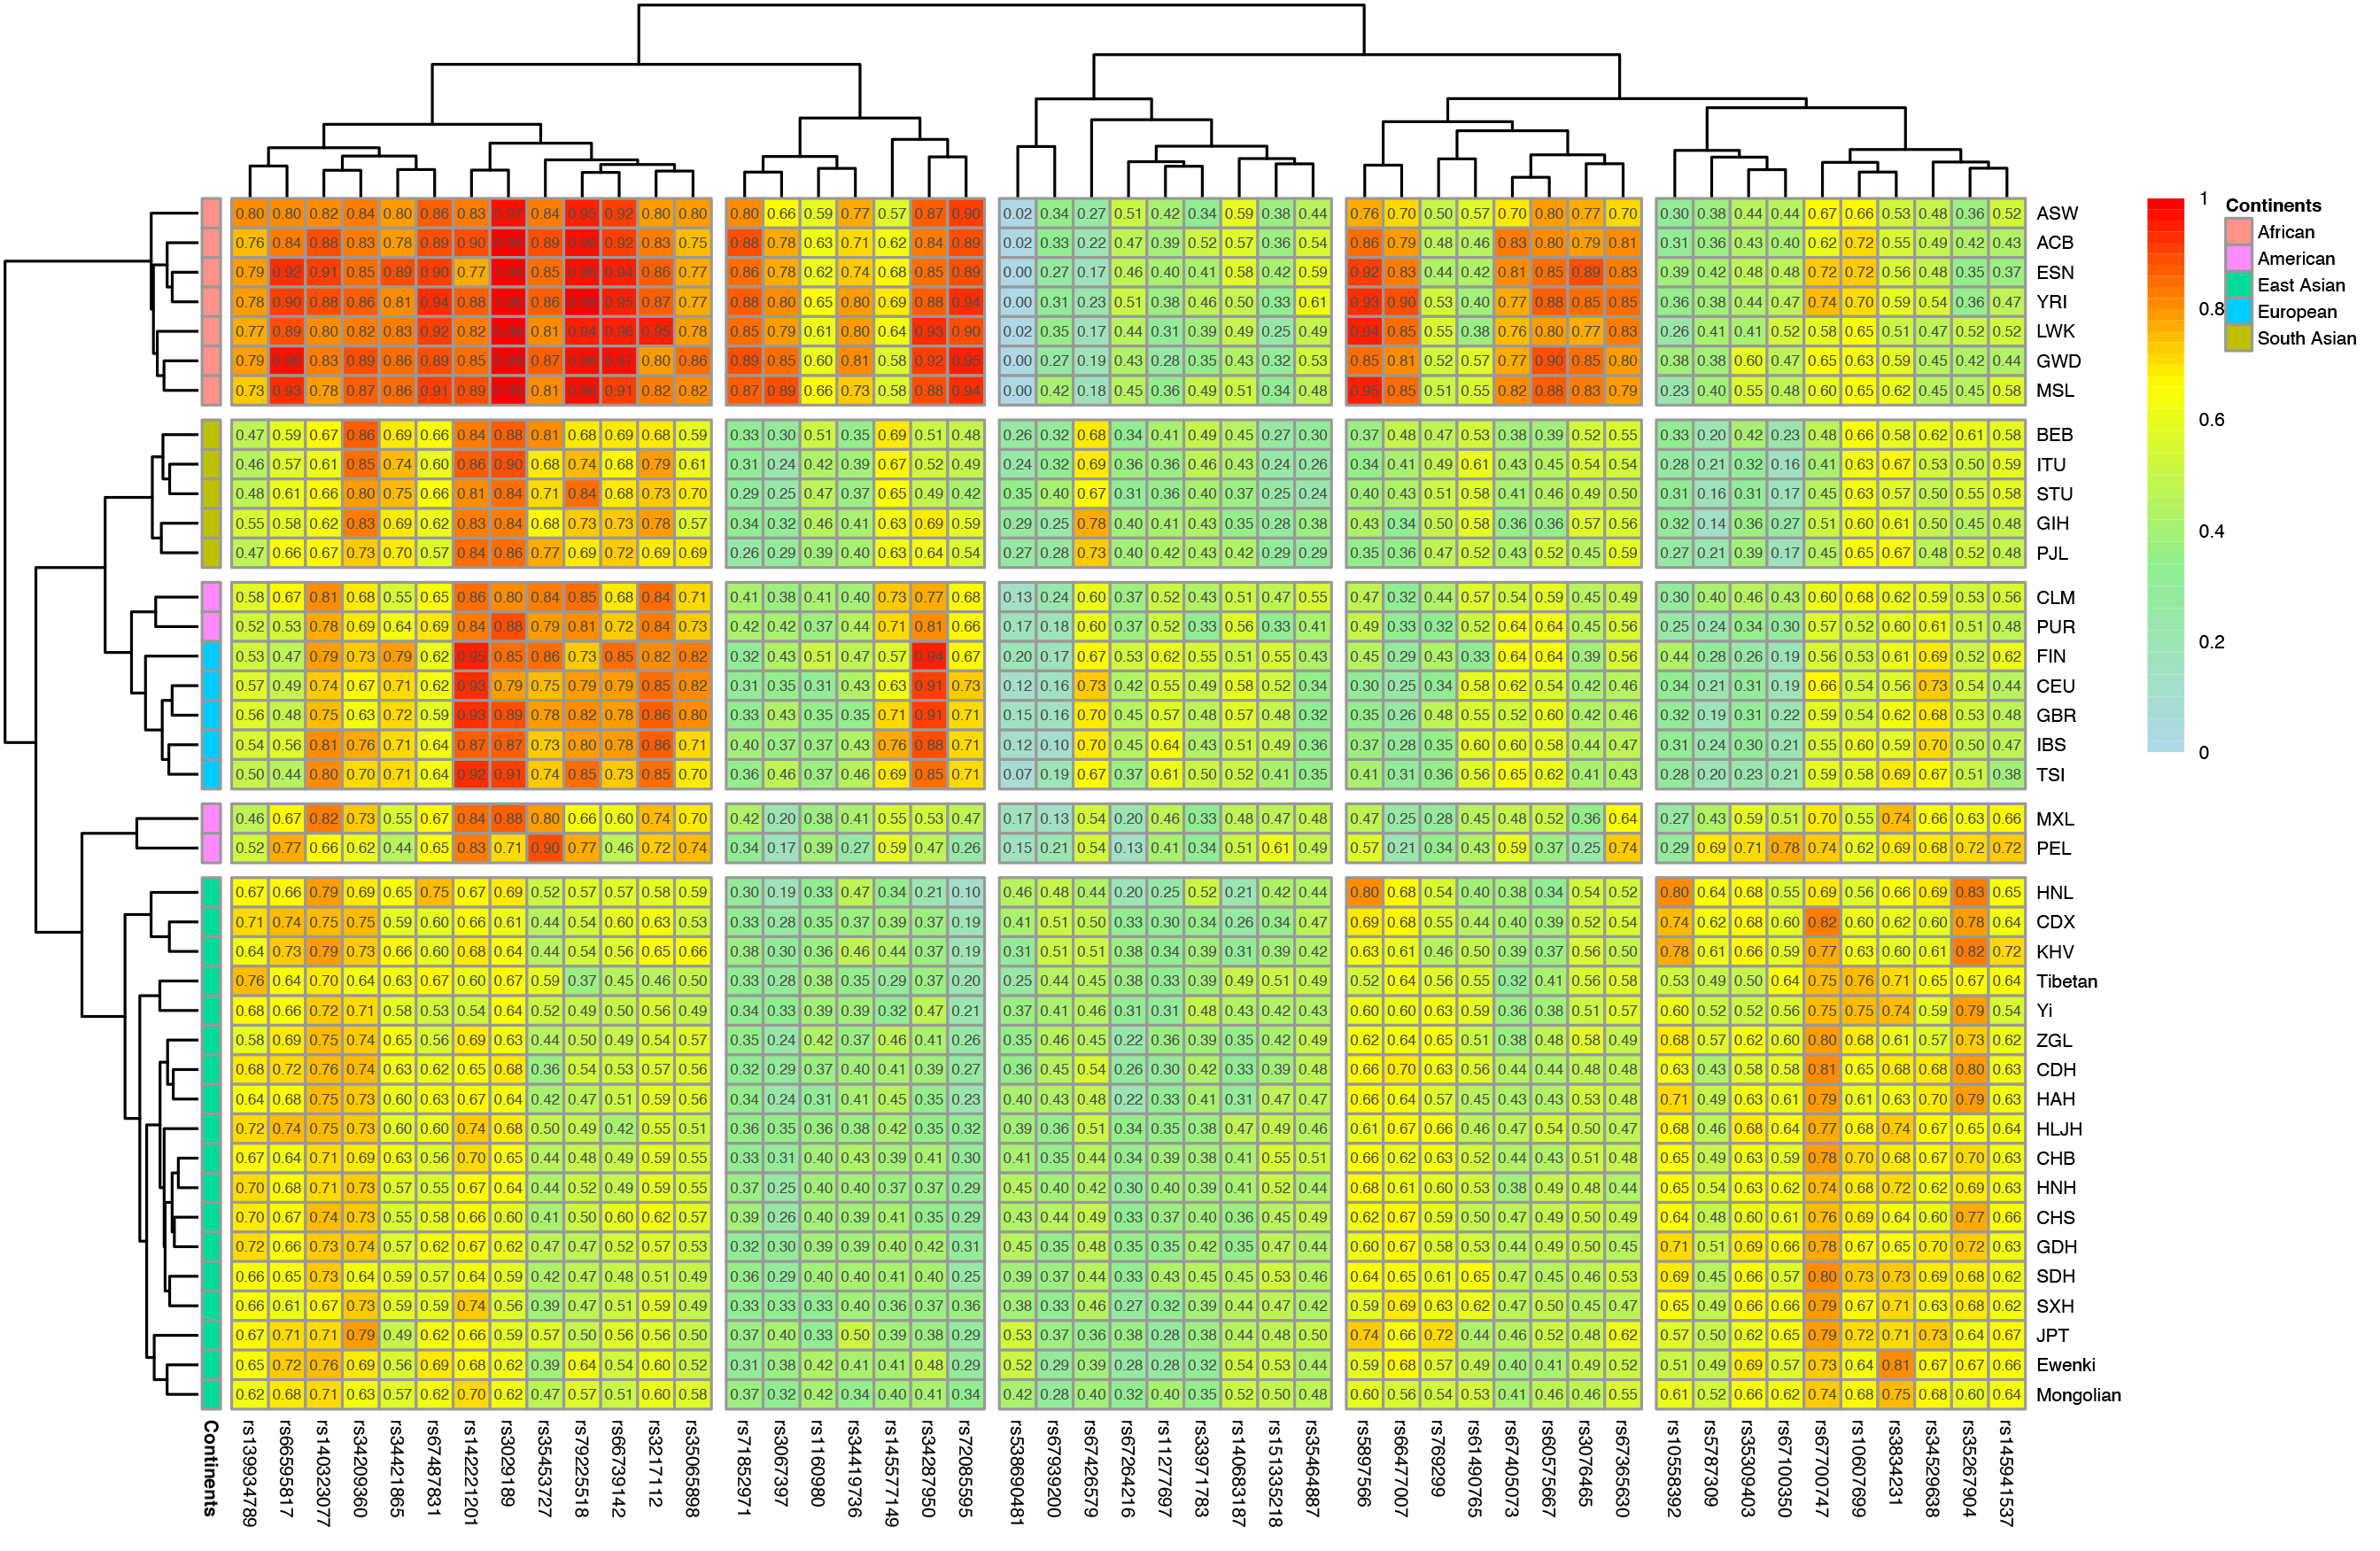 Fig. 2.
Heat map of insertion allelic frequencies for the 47 InDel variations in the two ethnic groups and 37 reference populations. The color gradient for the insertion allele frequency distribution ranges from light blue to red. At the top and left sides of the heat map, clustering trees are generated based on the corresponding insertion allele frequency distributions in different populations and at different loci, respectively.
The heat map revealed relatively obvious discrepancies in allele frequencies
between different populations. As proposed by Shriver [43, 44], the genetic
distance between populations for any single molecular marker can be estimated
from the
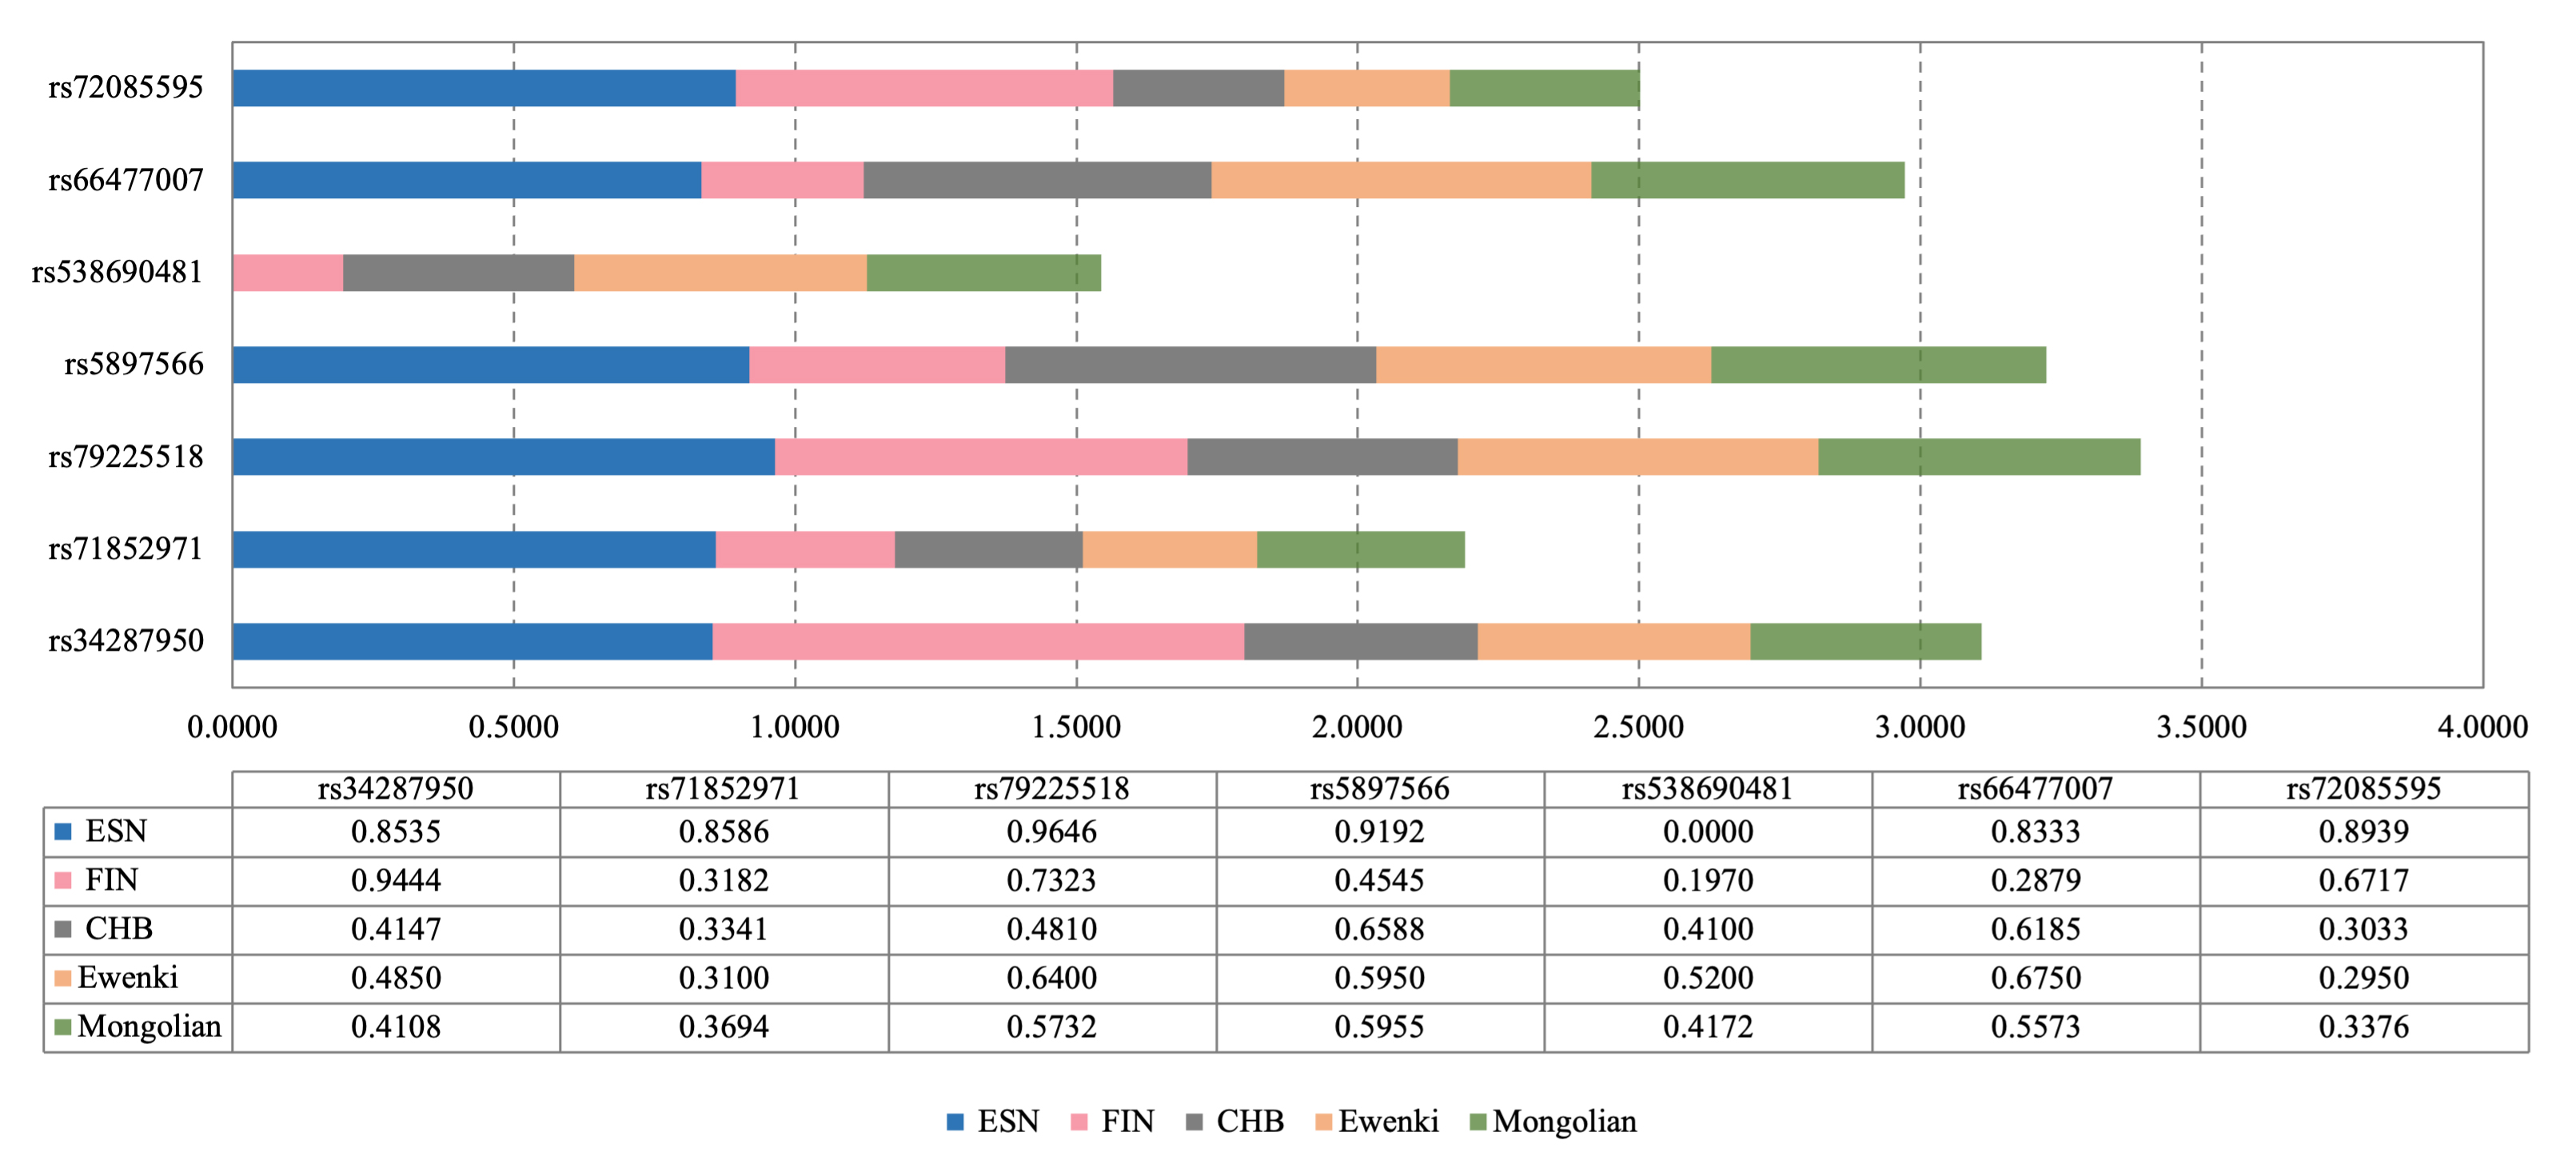 Fig. 3.
The seven most informative InDel variations (I
Next, PCA at the individual level was performed to reveal the sample
distributions from Mongolian, Ewenki and reference populations. As shown in Fig. 4A, individuals from the two ethnic groups and the reference populations from
five continents (Africa, Europe, East Asia, South Asia and America) were
represented by dots labeled with different colors. PCA showed that individuals
were scattered in the middle of the plot, with the first two PCs accounting for
12.5% of the total variance. Population distinctions at the five continent level
were not clearly obvious in this analysis. We next drew the PCA plot at the four
continent population level (Africa, Europe, East Asia and South Asia) to reveal
the distribution of recruited individuals, with the two topmost PCs making up
12.71% of the total variance (Fig. 4B). Previous studies reported that each PC
captured only a portion of the total variability, but here the first PC captured
the largest portion followed by the second PC. The combined PCs define a sample’s
eigenvector, and usually the 2D PC1–PC2 plots contain the most information in
the simplest space [45, 46]. Based on the PCA plots generated from clustering
patterns of different continental populations, we concluded the genetic
structures of populations from five continents and four continents could not be
ideally dissected by the 47 InDel variations. However, the tendency indicated
that populations from Africa, Europe and East Asia could be distinguished by the
set of 47 InDel loci. Hence, we next generated the clustering pattern of
individuals from the two ethnic study groups and the reference populations from
Africa, Europe and East Asia. This allowed us to evaluate the potential of the 47
InDels in correctly assigning individuals to their corresponding biogeographic
clusters (Fig. 4C). Compared to the results shown in Fig. 4B, more distinct
boundaries were seen in Fig. 4C between the African, European and East Asian
populations. Populations from the same continents assembled together to form
relatively distinguishable clusters. The two ethnic minorities from IMAR
assembled with the East Asian populations, thus indicating their close genetic
affinities. An additional PCA plot (Fig. 4D) was generated to confirm the
efficiency of the seven most informative InDel variations (I
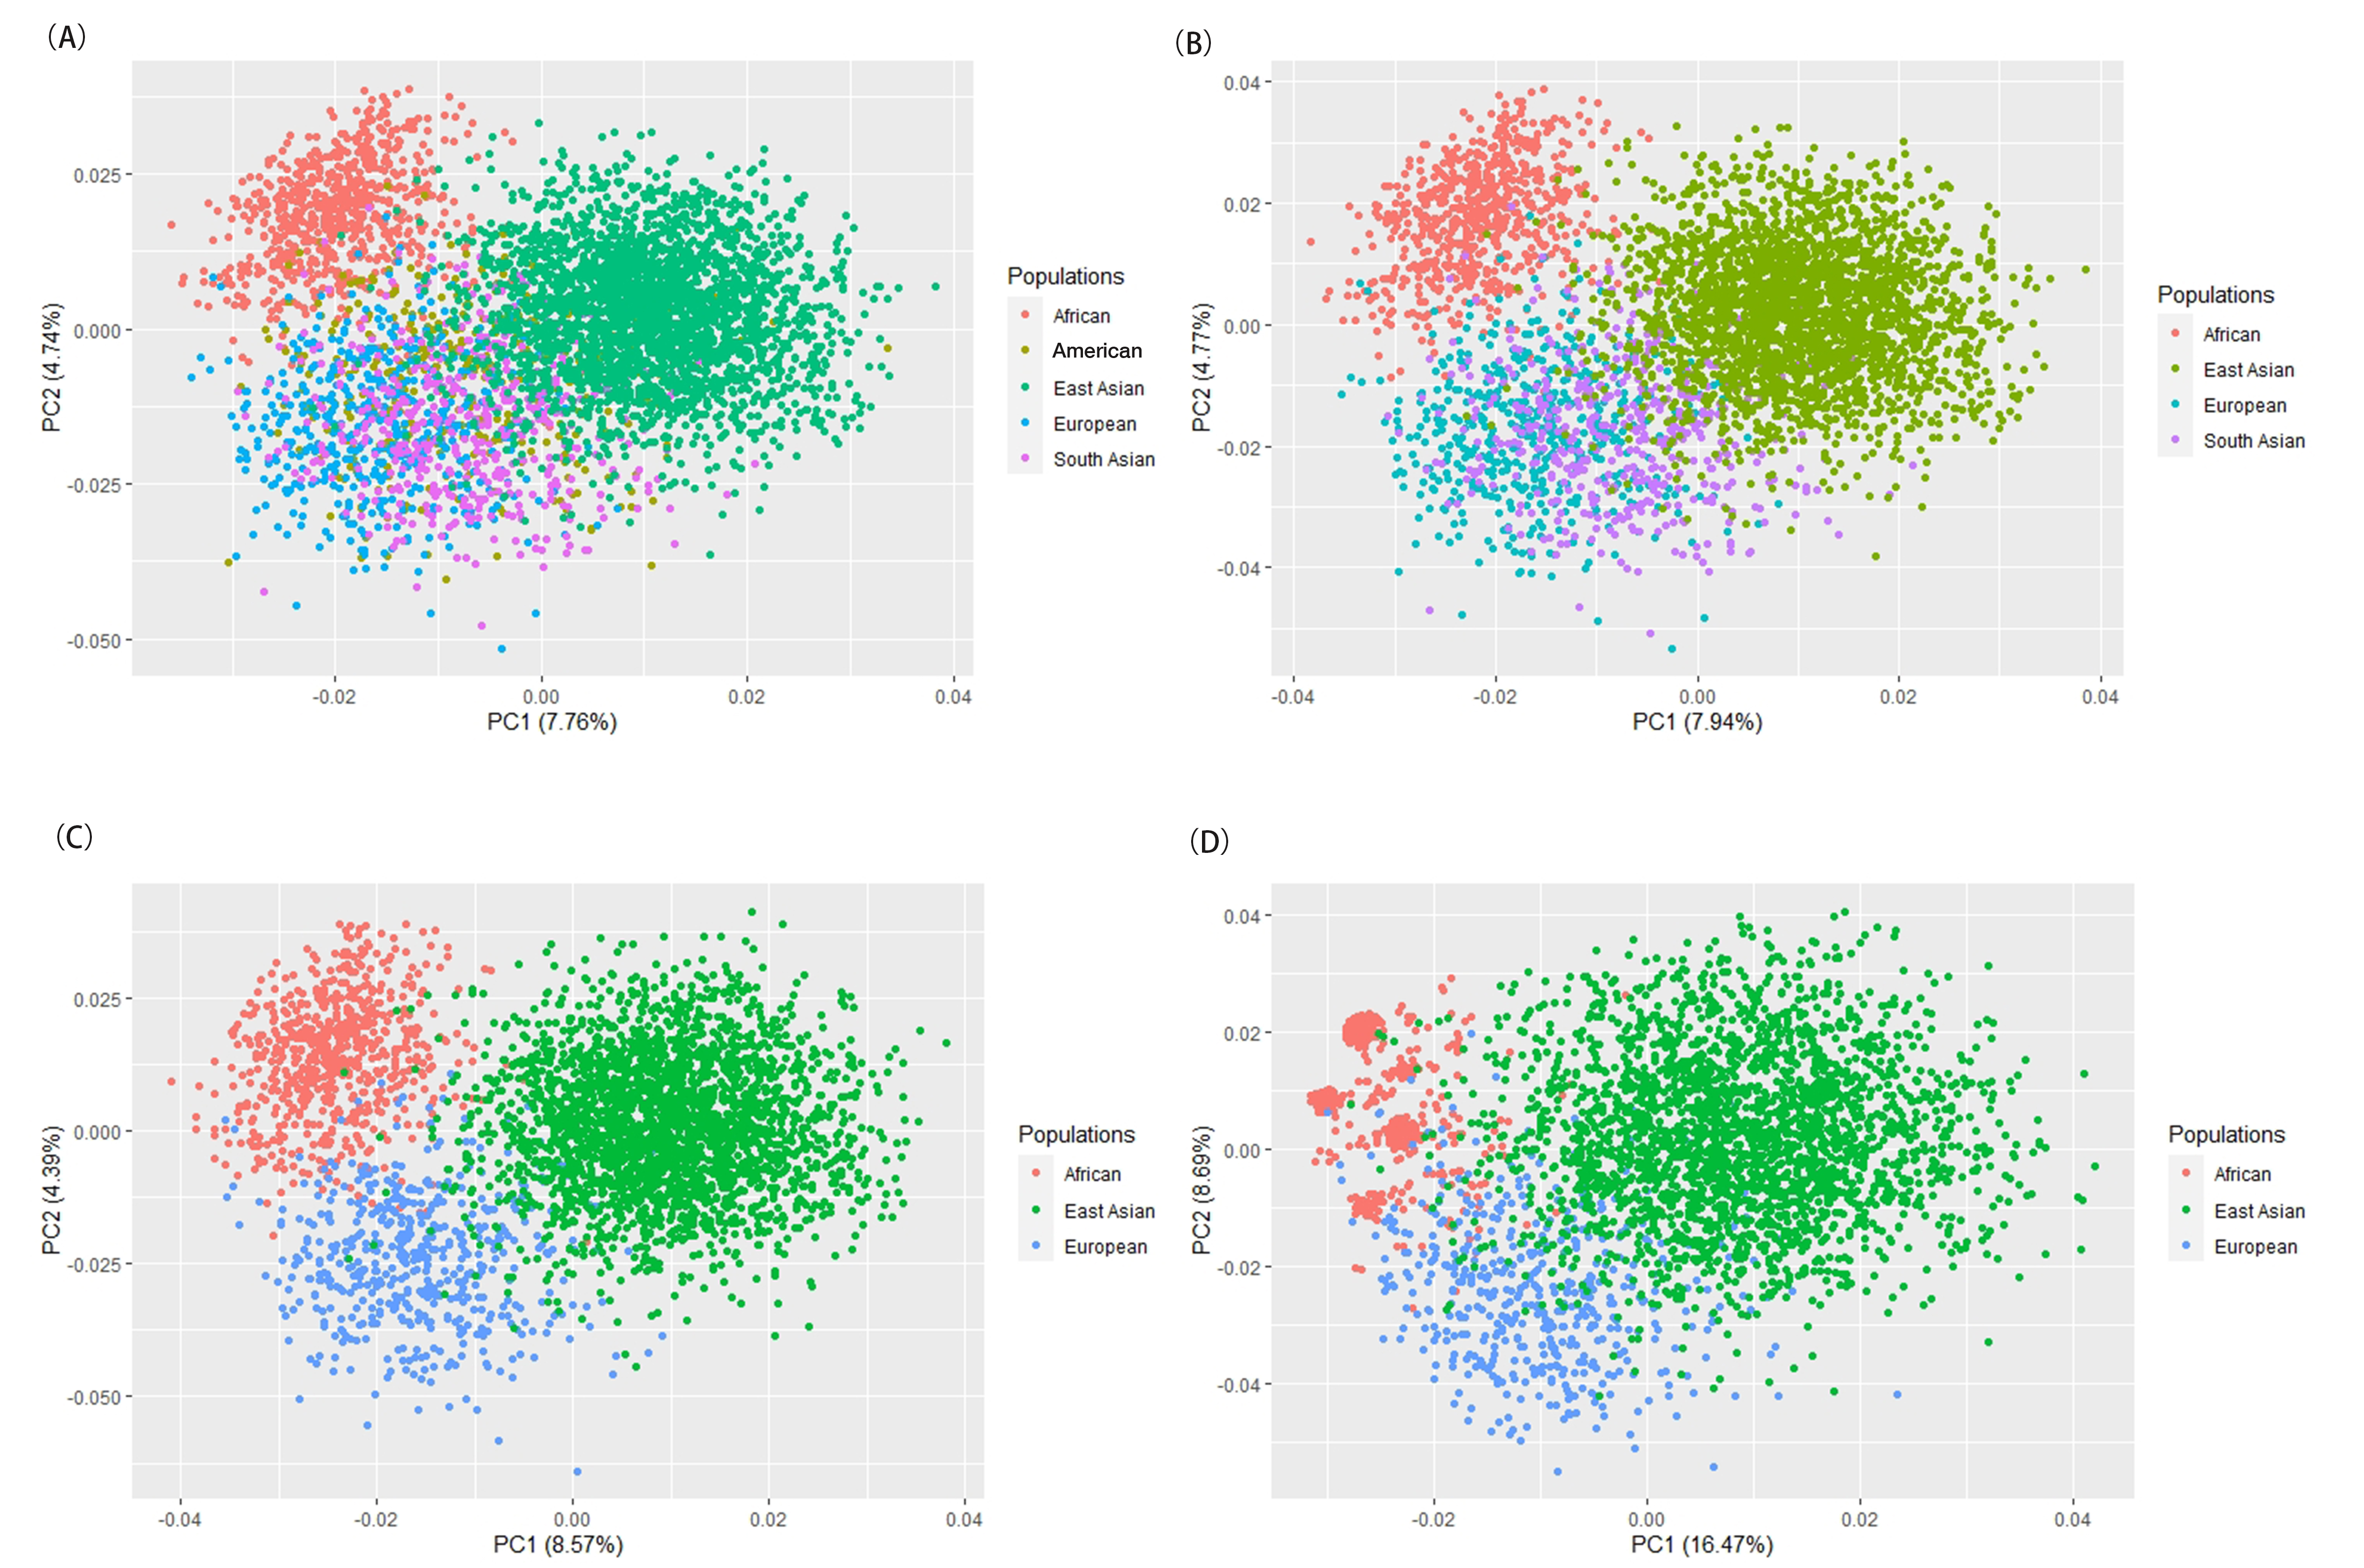 Fig. 4.
PCA plots based on the two ethnic groups and the corresponding
reference populations. (A) PCA of the two ethnic groups and reference
populations from five continents (Africa, Europe, America, South Asia and East
Asia). (B) PCA of the two ethnic groups and reference populations from four
continents (Africa, Europe, South Asia and East Asia). (C) PCA of the two ethnic
groups and reference populations from three continents (Africa, Europe and East
Asia). (D) PCA of the two ethnic groups and reference populations from three
continents (Africa, Europe and East Asia) based upon the seven most informative
InDels with I
Based on the maximum-likelihood algorithm, STRUCTURE software [47] was used to further characterize the substructure patterns of the two ethnic minorities and to infer the proportion of ancestral components using the reference continental populations. Using the online Harvest program (http://taylor0.biology.ucla.edu/structureHarvester/) [38], the optimal K was determined to be 3 (Supplementary Fig. 2). At the best-fit model of K = 3 (Fig. 5A), highly specific genetic components were observed in populations from the same continent. Accordingly, the genetic ancestries of African, European and East Asian populations are represented by green, pink and blue-green lines, respectively. A large fraction of East Asian ancestral genetic component was detected in the Mongolian and Ewenki groups. We also investigated ancestry component discrepancies for the overall populations when the genetic ancestry was pre-assumed to be 2–5. No extra discrepancies in ancestry component compositions were detected among the studied and reference populations with the increased K. Thus, together with the population genetic patterns inferred from K = 3, the present results corroborated the unambiguous differentiation of African, European and East Asian individuals by STRUCTURE genetic ancestry prediction analyses using these 47 InDels. The triangle plot (Fig. 5B) also revealed that individuals from the same continent assembled into independent clusters and reflected the pattern of genetic similarity of the studied and reference populations. Furthermore, the bar plot was used to represent the estimated ancestry composition of the populations by STRUCTURE (Fig. 5C), with the results showing that Mongolian and Ewenki groups possess a large fraction of East Asian ancestry. The estimated East Asian ancestry components for the Mongolian and Ewenki groups were 88.6% and 88.2%, respectively. However, the average East Asian ancestry component of the Chinese populations investigated in this study was 92.8%, indicating slightly less East Asian ancestry in the Mongolians and Ewenkis compared to other Chinese populations.
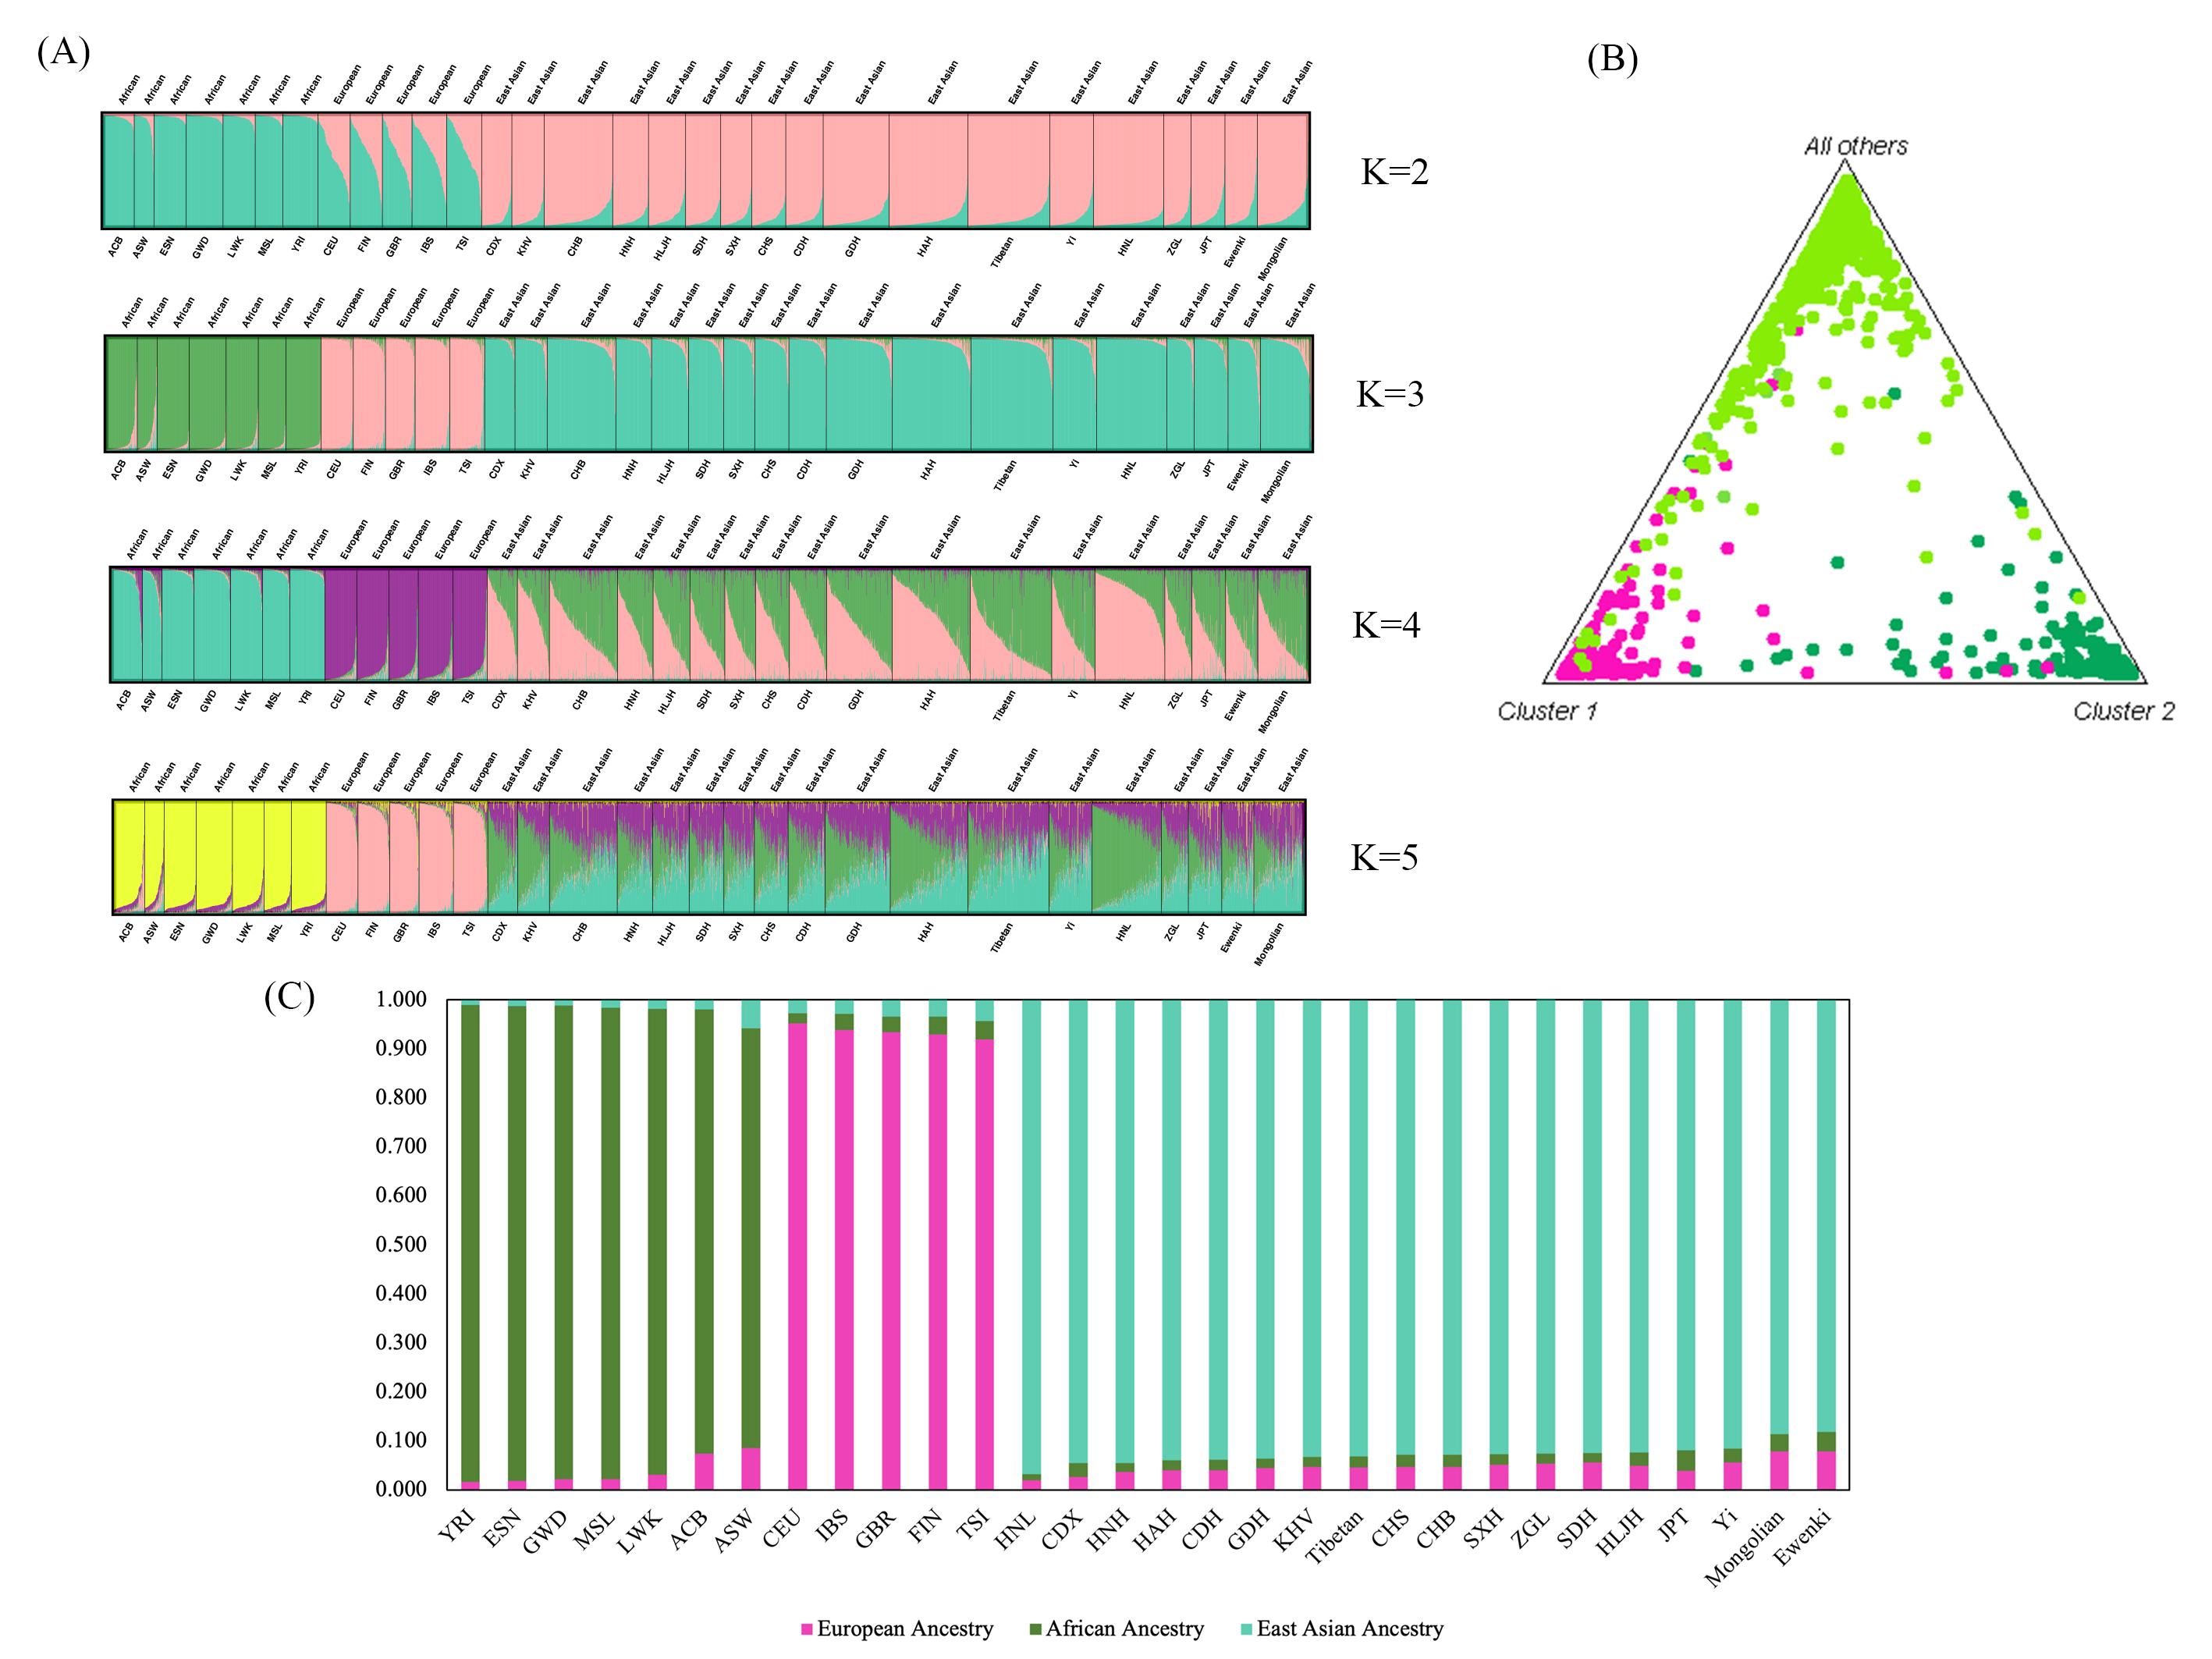 Fig. 5.
STRUCTURE analyses of the two ethnic groups and the corresponding reference populations. (A) Bar plot of the estimated genetic ancestral components at the individual level in Mongolian, Ewenki and reference populations from Africa, Europe and East Asia. Individuals are represented by a vertical line divided into K colored segments, with the length of each segment being proportional to the estimated membership. (B) Triangle plot of Mongolian and Ewenki groups and the reference populations from three continents. (C) The bar plot represents the corresponding ancestry composition of reference populations from Africa, Europe and East Asia. The African ancestry is labeled in green, the European ancestry in pink, and the East Asian ancestry in blue-green.
F
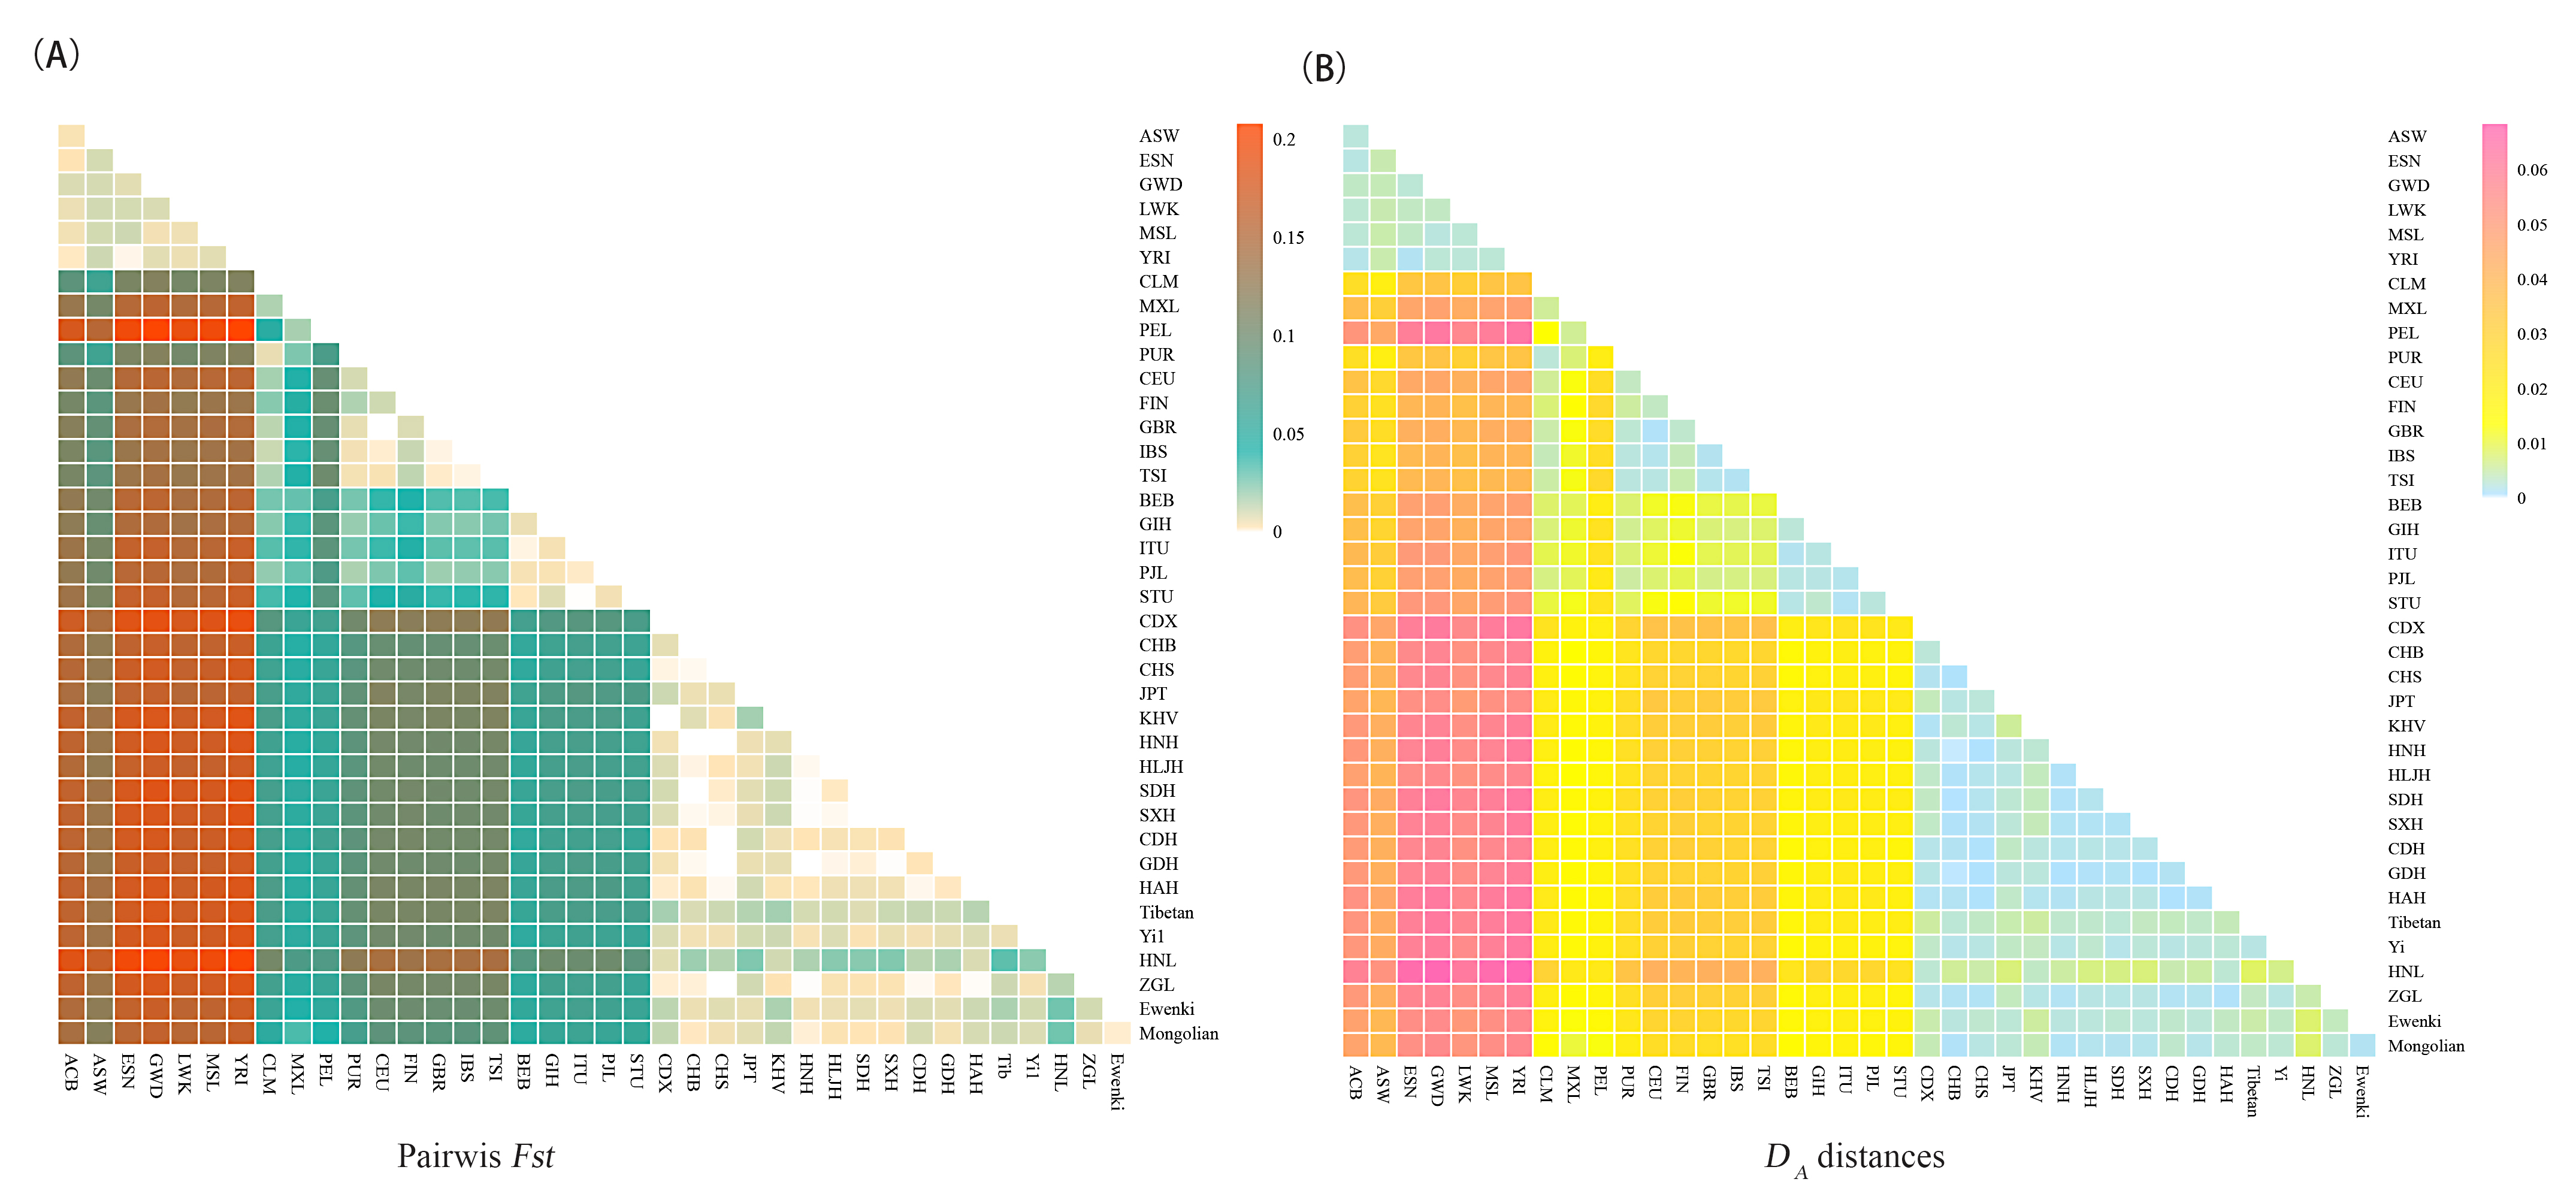 Fig. 6.
Heat maps of pairwise F
Phylogenetic reconstruction of the overall 39 populations was also generated
based on D
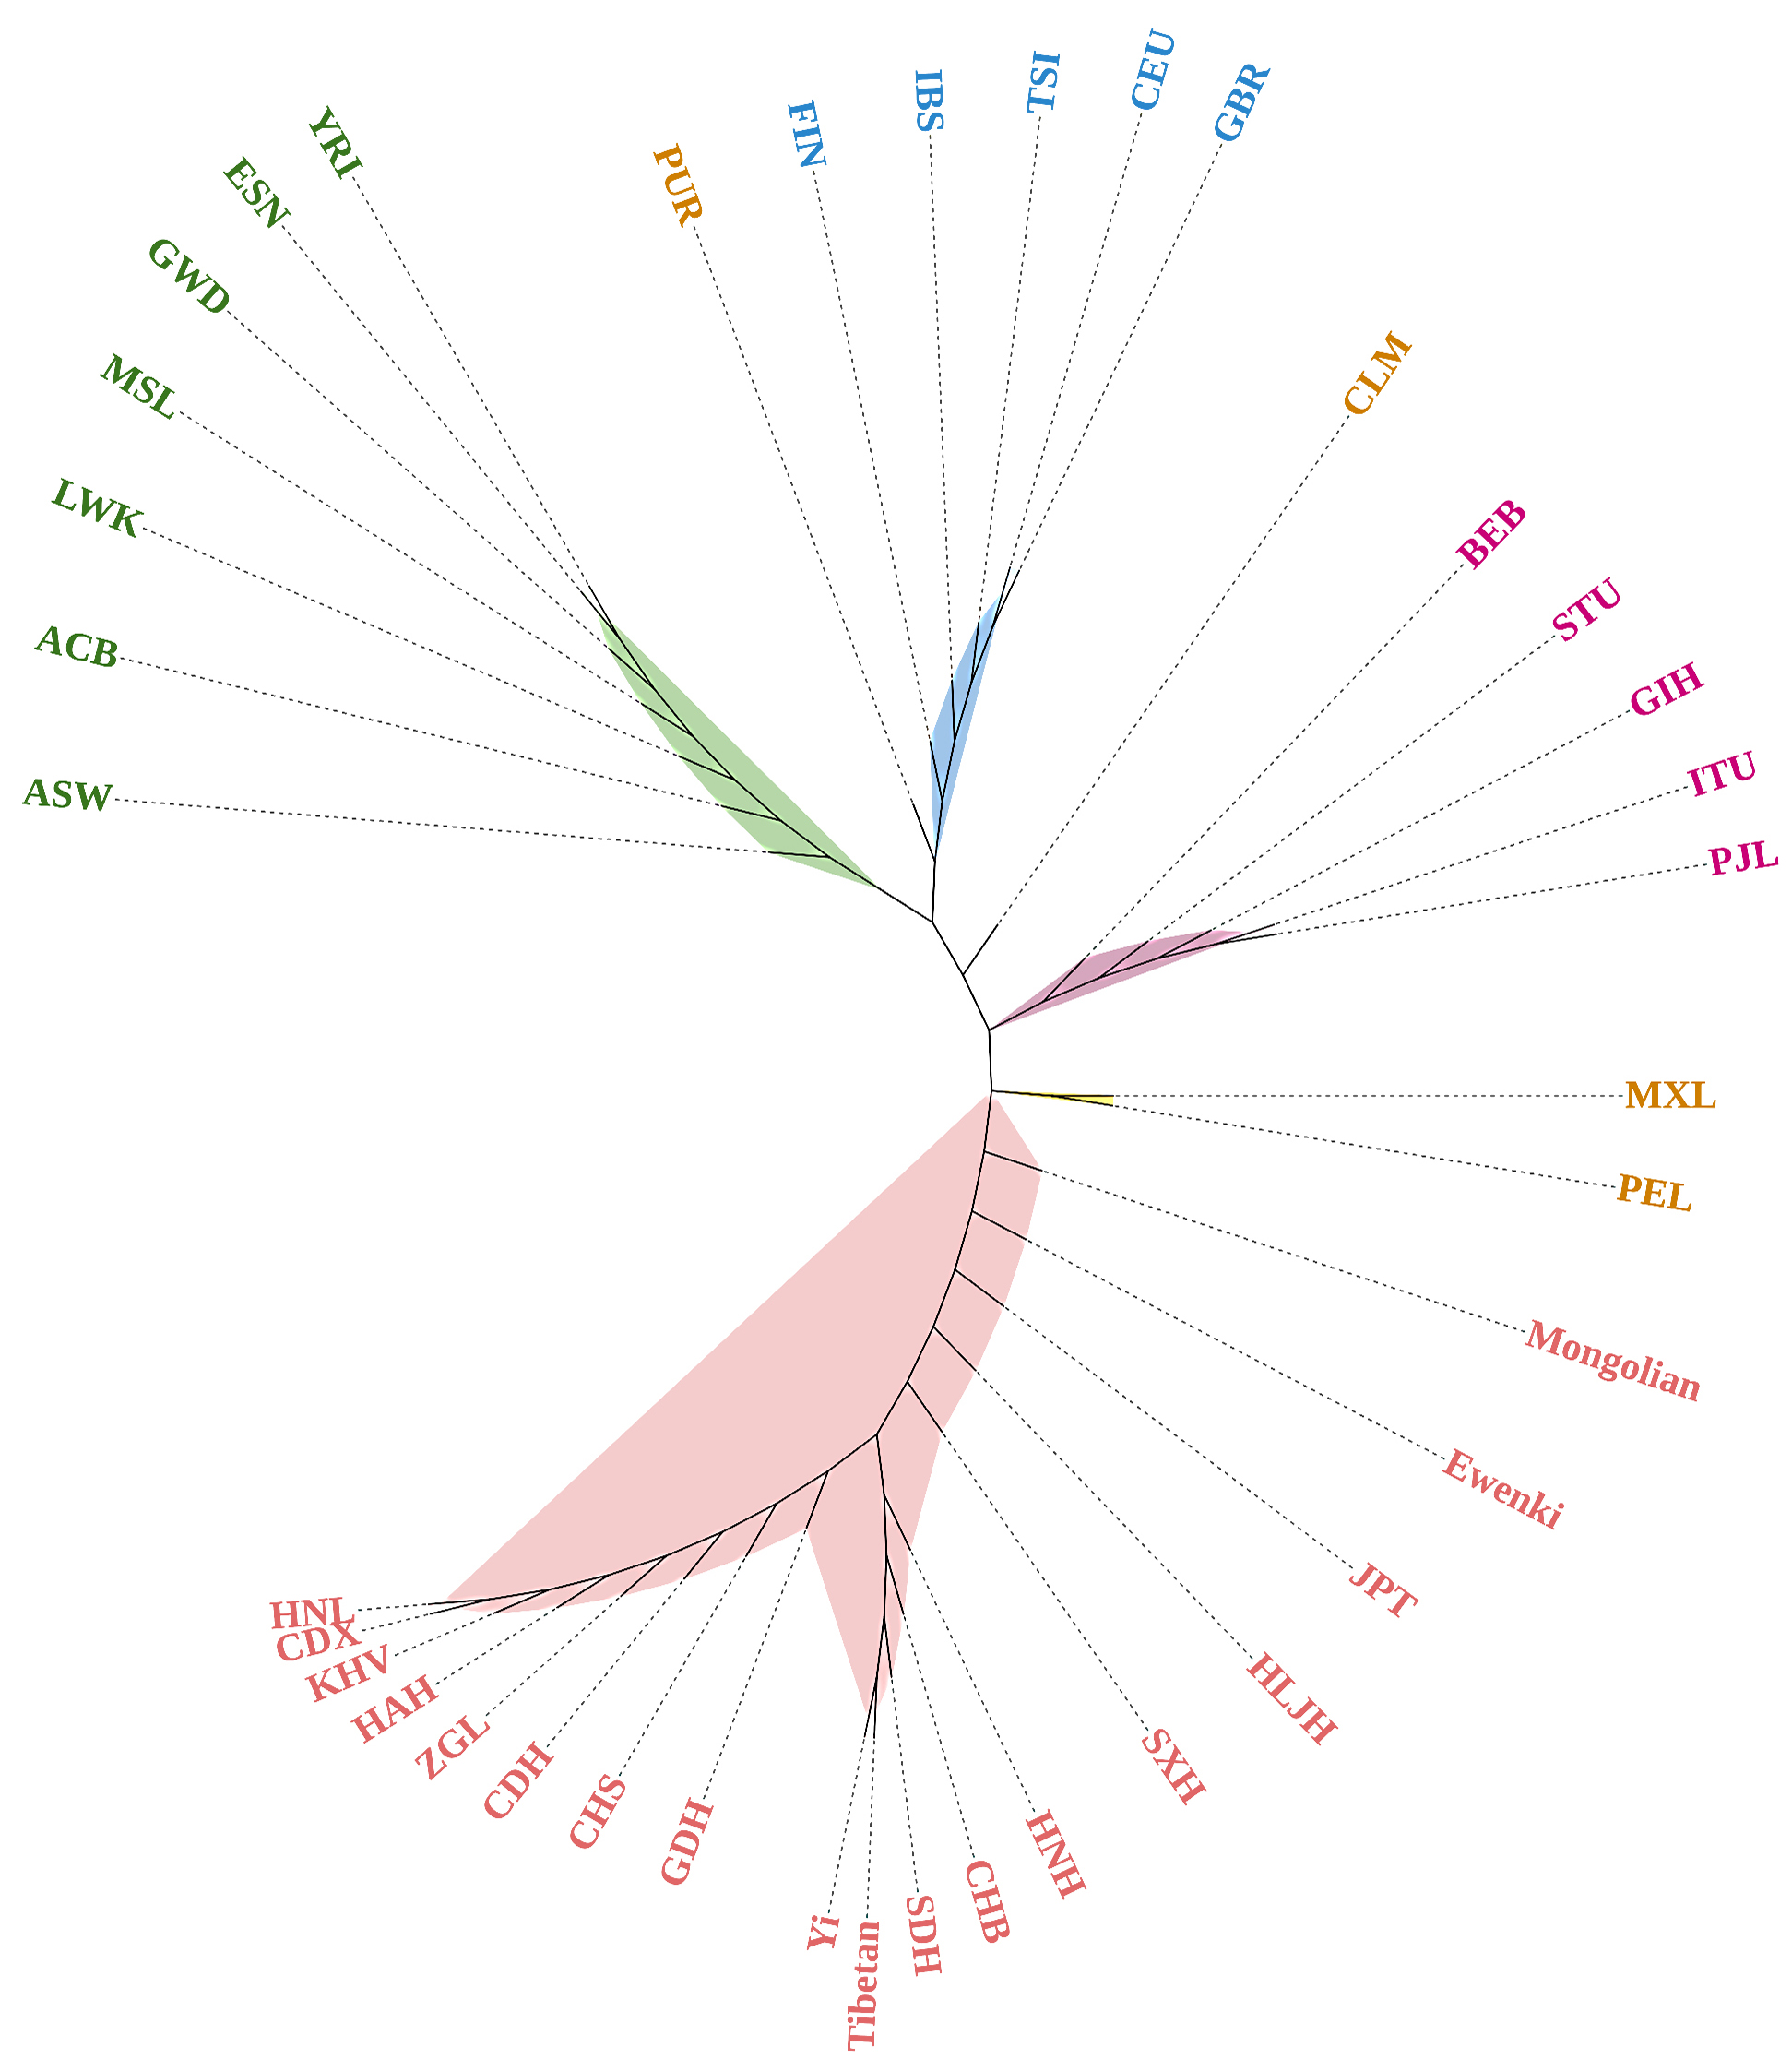 Fig. 7.
Phylogenetic reconstruction of the Mongolian group, Ewenki group and the 37 reference populations. Five primary clusters can be easily distinguished from the phylogenetic tree, i.e., the African cluster (ASW, ACB, LWK, MSL, GWD, ESN and YRI) labeled in green, the European cluster (FIN, IBS, TSI, CEU and GBR) labeled in blue, the East Asian cluster (CDX, KHV, CHS, JPT, CHB, HNL, HAH, CDH, GDH, CDH, HNH, SXH, HLJH, Yi, ZGL, Tibetan, Ewenki and Mongolian) in red, the American cluster (MXL and PEL) in brown and the South Asian cluster (BEB, STU, GIH, ITU and PJL) in purple. The other two American populations, PUR and CLM, are scattered among the European and South Asian populations.
To better understand the genetic relatedness of East Asian populations, locus-by-locus p values of intra-population genetic differences between Mongolian and Ewenki groups and the 16 reference populations were evaluated based on genotype data for the 47 InDels. The significance threshold level for p was adjusted to 0.0011 (p = 0.05/47 = 0.0011) according to the Bonferroni correction. As shown in Supplementary Table 6, significant differences were observed between Ewenki and CHS at two loci, with SDH, CDH and Yi at three loci, with CHB, GDH and ZGL at four loci, with CDX and Tibetan at five loci, with KHV at six loci, and with HAH at eight loci. None of the InDel loci showed significant differences between the Ewenki and HNH or SXH populations using the adjusted threshold of locus-by-locus p value. In contrast, significant differences were seen between Ewenki and HNL at ten loci. No significant differences were observed between the Mongolian group and the HNH, HLJH and SDH reference populations (Supplementary Table 7). The Tibetan and HNL groups were significantly different to the Mongolian group at eight and 17 loci, respectively. With regard to single locus diversity, the top three loci showing the greatest diversity between the two ethnic groups and the reference populations were rs140683187, rs10558392, rs3834231, rs79225518 and rs67939200 at nine, nine, seven, six and six loci, respectively, in the Ewenki group, and rs67939200, rs35267904 and rs140683187 at ten, nine, and eight loci, respectively, in the Mongolian group.
The accumulated genotype data for InDel variations in different populations
provides the necessary foundation to use these polymorphisms as an alternative
for resolving difficult samples in forensic DNA analysis. This has been
extensively described in a series of recent studies [13, 48, 49, 50, 51, 52]. In the present
work, 47 highly polymorphic InDel loci were analyzed in Ewenki and Mongolian
groups from IMAR in order to determine their suitability for forensic
applications. The CDP values obtained in these two ethnic groups were
sufficiently accurate to enable the identification of unknown individuals in
forensic personal identification. Thousands of polymorphic InDel loci have so far
been characterized in the human genome and a series of multiplex amplification
systems have been developed over the past decade based on InDel analysis. For
example, the 38-plex InDel assay was efficient for InDel profiling of degraded
samples, whereas the commonly used STRs sometimes failed to generate complete DNA
profiles [53]. The above-mentioned Investigator DIPplex ® Kit has
been widely tested in worldwide populations to confirm its suitability for
forensic applications. Compared with the 38-plex and 30-plex amplification
systems, the newly launched 50-plex marker system was shown to be more specific
for Chinese populations. Results obtained with the 50-plex InDel system for
forensic purposes were more convincing, since the CPEs and CDPs were calculated
in different populations [17, 53, 54]. Therefore, we believe the 50-plex InDel
assay can be readily implemented in forensic laboratories and serve as an
efficient supplementary tool for STRs. However, the drawbacks of this system
should also be highlighted. Firstly, the PICs of some InDel loci (e.g., rs3834231
and rs140323077) were less informative than other InDels included in the InDel
system. Secondly, the maximum amplicon size for the InDel loci in this new system
should be further shortened to
According to a previous validation study, the 50-plex assay has been confirmed
to be reliable and robust for forensic purposes and human genetic research [20].
In the current study, we explored the attributes of the 47 InDel variations (not
including the two Y-chromosomal InDels and the Amelogenin locus) for forensic
analysis in the Mongolian and Ewenki ethnic groups, as well as conducting further
population genetic analyses. To shed light on the genetic backgrounds of these
two ethnic groups, we assembled genotype data for the 47 InDels in
continent-specific populations from the 1000 Genomes Project, as well as
previously published data on Chinese populations. This was used to create a
reference population dataset and to perform further phylogenetic analyses. We
first created a heat map to show the insertion allelic frequency distributions of
the 47 InDels in the overall 39 populations. The heat map showed that closely
related biogeographical populations tended to have similar insertion allele
frequency distributions with less marked differences in allele frequencies,
suggesting close genetic affinities amongst these populations. It was also
discovered that some InDel variations (e.g., rs71852971, rs72085595 and
rs34287950) had relatively well differentiated allelic frequency distributions in
different continental populations. Therefore, we hypothesized that the
above-mentioned InDel variations could potentially infer population ancestries
and dissect population genetic backgrounds. Subsequently, we used various
statistical methods to explore the inter-population patterns of genetic diversity
and the intra-population genetic relatedness between the two ethnic groups and
the reference populations. Based on genotype data for the 47 InDel variations, we
also found that the overall populations tended to form five distinct clusters
using pairwise F
As discussed above, the genetic relationships amongst populations were broadly
consistent with their geographic locations at a local scale from the population
level. PCA using unsupervised classification method revealed that the 47 InDel
genetic variants were sufficiently informative to assign individuals from
African, European and East Asian populations to three distinct clusters. However,
they were not so directional as to distinguish individuals from American and
South Asian populations from those in African, European and East Asian
populations (Fig. 4A–C). Admixture events for Americans and South Asians could
partially explain these PCA results. Nevertheless, the present findings showed
the panel was able to reveal the genetic diversity patterns of populations from
three continents (Africa, East Asia, Europe). We further performed a more refined
PCA (Fig. 4D) based on genotype data for the seven most informative InDel
variations in order to infer ancestries in the African, European and East Asian
populations. The plot predicted three markedly differentiated population clusters
(African, European and East Asian clusters), with better discrimination power
amongst the African populations where several tightly assembled clusters were
observed. The I
Analyses of intra-population genetic relatedness within East Asia using the AMOVA method further confirmed that the two ethnic minorities studied here displayed less differentiation with populations from northern China and more genetic differences with populations from the south and southwest of China. In particular, the HNL group was found to be most differentiated from Mongolian and Ewenki groups. This may be explained by the genetic architecture of HNL having been characterized as a somewhat isolated group [58]. Results from the intra-population comparison analyses were consistent with the conclusions reached from phylogenetic reconstruction and STRUCTURE analysis.
The general genetic characteristics of different populations can be revealed by inter-population comparison studies. To date, genetic insights into the Mongolian group has frequently been conducted by scholars working in diverse research fields. However, studies on the genetic structure of the Ewenki group have so far been rare. A mtDNA-based study reported that Ewenkis shared mtDNA haplogroups with individuals from northern populations of China, similar to the Mongolian group [59] and suggesting a close genetic relationship between the Ewenki and Mongolian groups. Some other ethnic minorities such as the Daur group also exhibit a degree of genetic affinity with the Ewenki group. In general, exploration of the genetic structures and genetic relationships of ethnic minorities is a long and complicated process. In the present study we first analyzed genotype data on 47 InDel variations in the Mongolian and Ewenki ethnic minorities from IMAR. Simultaneously, we made additional comparisons with reference populations in order to dissect the genetic architecture of these minority groups. The results of this study have revealed that the two ethnic groups were closely related to each other genetically. In agreement with previous studies, the two groups also shared genetic similarities with northern populations of China. The results obtained here would contribute to ongoing exploration of the genetic background of East Asian populations and enhance our understanding of the genetic background of populations who share Mongolian and Ewenki ancestry genetic components. However, we acknowledge that more highly polymorphic InDels should be incorporated into the panel in future. The maximum amplicon size of InDel loci in the present panel should also be shortened to better profile the degraded DNA which is usually encountered in forensic work.
To summarize, the 47 highly polymorphic InDel variations exhibited sufficient efficiencies for individual identification and could serve as a supplementary tool for STRs in Mongolian and Ewenki groups from the Inner Mongolia Autonomous Region of China. Genetic insights from the 47 InDel variations revealed a prominent East Asian ancestry component in the gene pools of Mongolian and Ewenki ethnic groups. Further speaking, northern populations of China showed closer genetic affinities with the above-mentioned two ethnic minorities. The present results could probably contribute to the ongoing exploration of East Asian population histories and enhance our understanding of genetic backgrounds of populations who share the ancestral genetic components of Mongolian and Ewenki groups.
BZ and CS designed this study. QL conceived the experiments and wrote the manuscript. CW collected the samples. CZ, and HX extracted DNA and helped to conduct the statistical analysis. BZ also revised the manuscript. All the authors authorized and performed the manuscript revision.
Written informed consents were obtained from the participants before experiments were started. The study was conducted with the approval of the Ethics Committees of Southern Medical University, Guangzhou, China and Xi’an Jiaotong University, Xi’an, China (No. XJTULAC201).
Thanks to all the peer reviewers for their opinions and suggestions.
This research was supported by the National Science Foundation of China (No. 82072122).
The authors declare no conflict of interest.
Supplementary material associated with this article can be found, in the online version, at https://www.imrpress.com/journal/FBL/27/2/10.31083/j.fbl2702067.