


1 Department of Gastroenterology, Affiliated Hospital of Jining Medical University, Jining Medical University, 272000 Jining, Shandong, China
2 Shandong University of Traditional Chinese Medicine, 250355 Jinan, Shandong, China
3 Department of Critical Liver Diseases, Liver Research Center, Beijing Friendship Hospital, Capital Medical University, 100015 Beijing, China
4 Department of Cardiology, Affiliated Hospital of Jining Medical University, Jining Medical University, 272000 Jining, Shandong, China
Academic Editor: Vesna Jacevic
Abstract
Background: Cholangiocytes are
primary targets in chronic cholestatic liver diseases. Myocyte enhancer factor 2A
(MEF2A) is a transcription factor with a crucial role in some fibrogenic
diseases. However, whether it contributes to cholestatic liver fibrosis is still
obscure. Methods: A bile duct–ligated (BDL) mouse model was established
to detect MEF2A expression during cholestatic liver fibrosis. In addition, human
intrahepatic biliary epithelial cells (HIBECs) were transfected with
lentivirus-expressing shMEF2A (LV-shMEF2A) to regulate the expression of MEF2A
in vitro. Biomarkers of epithelial to mesenchymal transition (EMT),
senescence, and fibrogenesis were evaluated using various assays: Quantitative real-time polymerase chain reaction (qRT-PCR),
western blotting, senescence-associated
Keywords
- MEF2A
- EMT
- senescence
- fibrosis
- cholangiocytes
Cholestatic liver diseases, such as primary biliary cholangitis (PBC) and primary sclerosing cholangitis (PSC), are characterized by an impairment of bile secretion or excretion, usually lead to liver fibrosis and cirrhosis, and even liver failure [1, 2]. The clinical management dilemma of these diseases are linked with poor understanding of their pathogenesis, late diagnosis and lack of effective cure except for liver transplant [2]. Liver fibrosis plays a crucial role in the disease’s progression and is closely related to clinical outcomes in cholestatic liver diseases [3]. Therefore, developing new strategies for ameliorating or reversing fibrogenesis is paramount to managing these diseases.
Cholangiocytes are the principal cells responsible for
cholestasis and liver fibrosis. They can activate hepatic stellate cells (HSCs)
and fibroblasts, causing overproduction of extracellular matrix and fibrotic
progression [4]. Cholangiocytes may also act as fibrogenic cells in the liver by
undergoing epithelial to mesenchymal transition (EMT) and enhanced senescence [5, 6]. Liver sections from patients with PBC contain cholangiocytes with enhanced
EMT markers, suggesting that preventing EMT may restrain or reverse liver
fibrosis [7]. Cholangiocyte senescence and its
senescence-associated secretory phenotype are hallmarks of PBC, contributing to
the paracrine activation of HSCs and increased liver fibrosis [8]. Evidence shows
transforming growth factor
Myocyte enhancer factor 2A (MEF2A) is a transcription factor from the MEF2 family within the MADS-box superfamily [11]. It participates in numerous cellular processes, including neuronal differentiation, muscular development, and cellular growth control [12]. The important roles of MEF2A in human cancers, cardiovascular diseases, and neurodegenerative diseases have been demonstrated by a great deal of evidence [13, 14, 15, 16, 17]. Further, it may also have a role in liver fibrosis. For example, MEF2A is involved in the activation of cultured rat HSCs [18]. Furthermore, high levels of MEF2A are present in human cirrhotic liver tissues and freshly isolated human HSCs [19]. By consulting the HUMAN PROTEIN ATLAS database (https://www.proteinatlas.org/), we found that MEF2A was not only expressed in HSCs, but also in cholangiocytes/bile duct epithelial cells. However, whether and how cholangiocyte-derived MEF2A participates in cholestatic liver fibrosis are still unclear.
In the present study, we quantified the levels of MEF2A in liver sections from
bile duct–ligated (BDL) mice and peripheral blood from patients with PBC to
explore its involvement in cholestatic liver fibrosis. We also assessed the
function of MEF2A in TGF-
Eight- to ten-week-old specific pathogen-free C57BL/6 male mice were maintained under specific pathogen-free conditions, and offered free access to sterile water and food. Their weight ranged between 20 and 25 g. Animal experiments were approved by the Institutional Animal Care and Use Committee of Jining Medical University.
After a week of adaptive feeding, the mice were randomly assigned to a sham (n = 10) or BDL group (n = 20). BDL was performed as previously described [20]. Briefly, the mice were anesthetized with 2% pentobarbital sodium (40 mg/kg) (Sigma-Aldrich, St. Louis, USA). We first isolated the common bile duct and the left and right hepatic ducts, and then ligated the left and right hepatic ducts and the hepatic portal and duodenal portions of the common bile duct, respectively. At last, the abdomen was closed. The sham group was used as a control and underwent laparotomy without ligation. After 7 or 28 days, the mice were killed and their liver tissues were harvested. It was further manipulated for qRT-PCR, western blotting, histological, and immunohistochemical analyses.
Paraformaldehyde-fixed liver tissue samples were cut into 4-
Lentiviral vectors expressing an shRNA targeted against the murine MEF2A transcript (LV-shMEF2A) or negative control (LV-NC) were constructed by GenePharma (China). The shMEF2A targeting sequence was 5′-GCAGCCAGCTCAACGTTAACA-3′, and that of the negative control was 5′-TTCTCCGAACGTGTCACGT-3′.
Human intrahepatic biliary epithelial cells (HIBECs) were purchased from the
BeNa Culture Collection (China). They were cultured in RPMI 1640 medium
(Gibco-BRL) supplemented
with 10% FBS (Gibco-BRL) at 37 °C and 5% CO
Total RNA was isolated using TRIzol reagent (Invitrogen, Carlsbad, USA). Complementary DNA
(cDNA) was reverse transcribed with an All-In-One 5
| Gene | Species | DNA sequence (sense 5′–3′) | DNA sequence (anti-sense 5′-3′) |
|---|---|---|---|
| MEF2A | Human | TGCGACAGCCCAGACCCTG | GAGGTGGCAGACCAGGTGCG |
| MEF2A | Mouse | CAGGTGGTGGCAGTCTTGG | TGCTTATCCTTTGGGCATTCAA |
| Human | GGCTCT GGGCTCTGTAAGG | CTCTTGCTCTGG GCTTCATC | |
| E-cadherin | Human | TTCTGCTGCTCTTGCTGTTT | TGGCTCAAGTCAAAGTCCTG |
| N-cadherin | Human | GGTGGAGGAGAAGAAGACCAG | GGCATCAGG CTCCACAGT |
| vimentin | Human | GCCCTTAAAGGAACCAATGA | AGCTTCAACGGCAAAGTTCT |
| GAPDH | Human | CTGGGCTACACTGAGCACC | AAGTGGTCGTTGAGGGCAATG |
Cells were lysed using a RIPA lysis buffer containing 10% phosphatase and
proteinase inhibitor (Beyotime, Shanghai, China). An equal amount of protein was loaded and
separated on 10% sodium dodecyl sulphate-polyacrylamide gels. Proteins were
transferred to polyvinylidene fluoride membranes (Millipore, Bedford, MA, USA). They were blocked
with 5% non-fat milk for 2 h at room temperature and incubated overnight at 4 °C
with primary antibodies: anti-MEF2A (Abcam, 1:1000), anti-E-cadherin (Abcam,
1:1000), anti-N-cadherin (Abcam, 1:1000), anti-vimentin (Abcam, 1:1000),
anti-
The SA-
Cells were fixed with 4% paraformaldehyde for 15 min at room temperature. They
were permeabilized with 0.01% Triton X-100 (Solarbio, Beijing, China) for 5 min and
blocked in 10% fetal bovine serum for 1 h at room temperature. For the staining,
the cells were incubated with a primary rabbit anti-
Serum MEF2A levels of 15 patients with PBC and 15 healthy controls (HCs) was analyzed in this study. All participants were inpatients from the Department of Gastroenterology, Affiliated Hospital of Jining Medical University, China. All fulfilled the requirements for PBC diagnosis specified in the European Association for the Study of the Liver clinical practice guidelines [22]. The participants gave their written informed consent to partake in the study. The Institutional Review Board for Clinical Research of the Affiliated Hospital of Jining Medical University approved the study. Clinical characteristics of included patients are shown in Table 2.
| Parameters | Patients (n = 15) | |
|---|---|---|
| Age (years) | 56.5 | |
| Gender | ||
| Male | 3 | |
| Female | 12 | |
| Duration of PBC (years) | 5.9 | |
| Liver stiffness measurement (LSM, kPa) | 12.0 | |
Serum MEF2A levels were tested using a human MEF2A ELISA kit (FineTest, China).
Peripheral blood was collected in EDTA anti-coagulated tubes and centrifuged at
1000
All experiments were performed in triplicates, and data were expressed as the
mean
Bile duct-ligated mice are a widely used model to study cholestatic liver
fibrosis, including PBC. Therefore, we examined the expression of MEF2A in the
livers of BDL mice. They were sacrificed 7 or 28 days after BDL
surgery, and their liver tissues were harvested. Histological examination of
liver sections showed that BDL surgery induced liver fibrosis in mice (Fig. 1A),
confirming the successful establishment of the BDL model. Fluorescent
immunohistochemistry analysis localized MEF2A expression in the liver and
revealed that the percentage of MEF2A
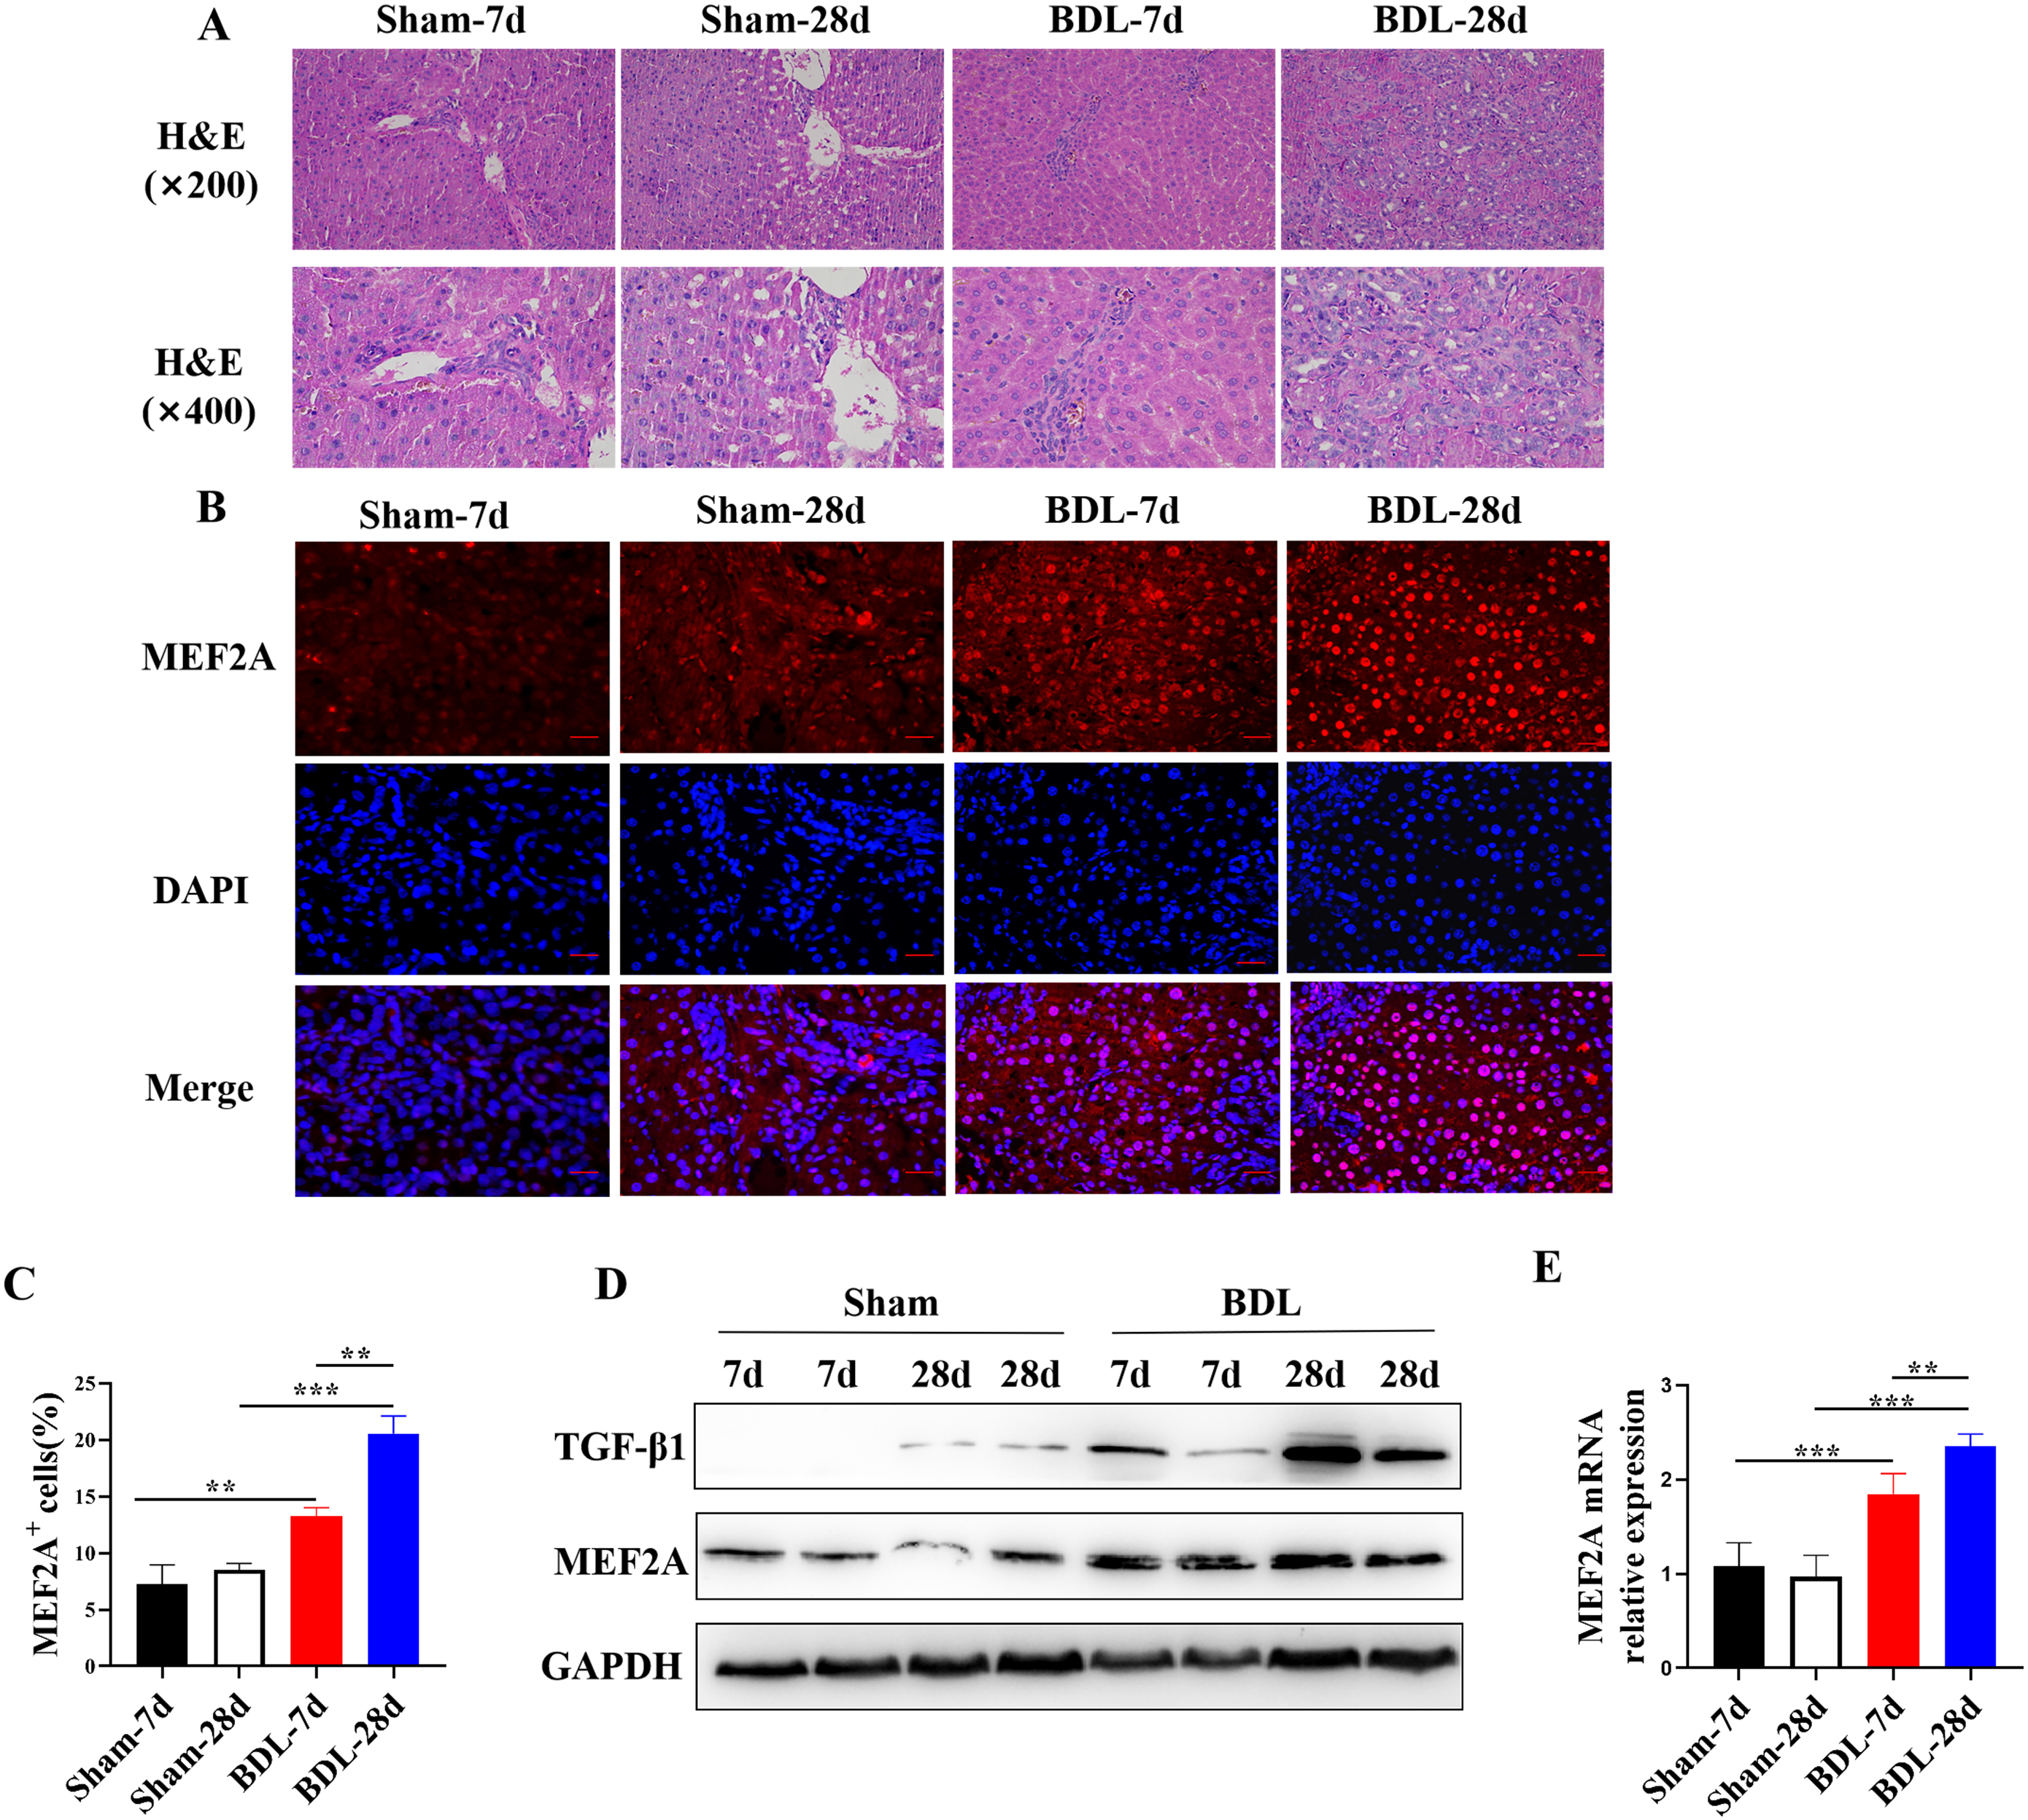 Fig. 1.
MEF2A is overexpressed in livers of BDL mice and positively
correlates with degree of fibrosis. Bile duct-ligated model was established
using C57BL/6 mice to induce liver fibrosis. Sham mice were used as control. Mice
were sacrificed 7 or 28 days after BDL surgery, and liver tissues were harvested.
(A) Histological examination of liver sections with H&E staining. Scale bar
represents 50
Evidence suggests that TGF-
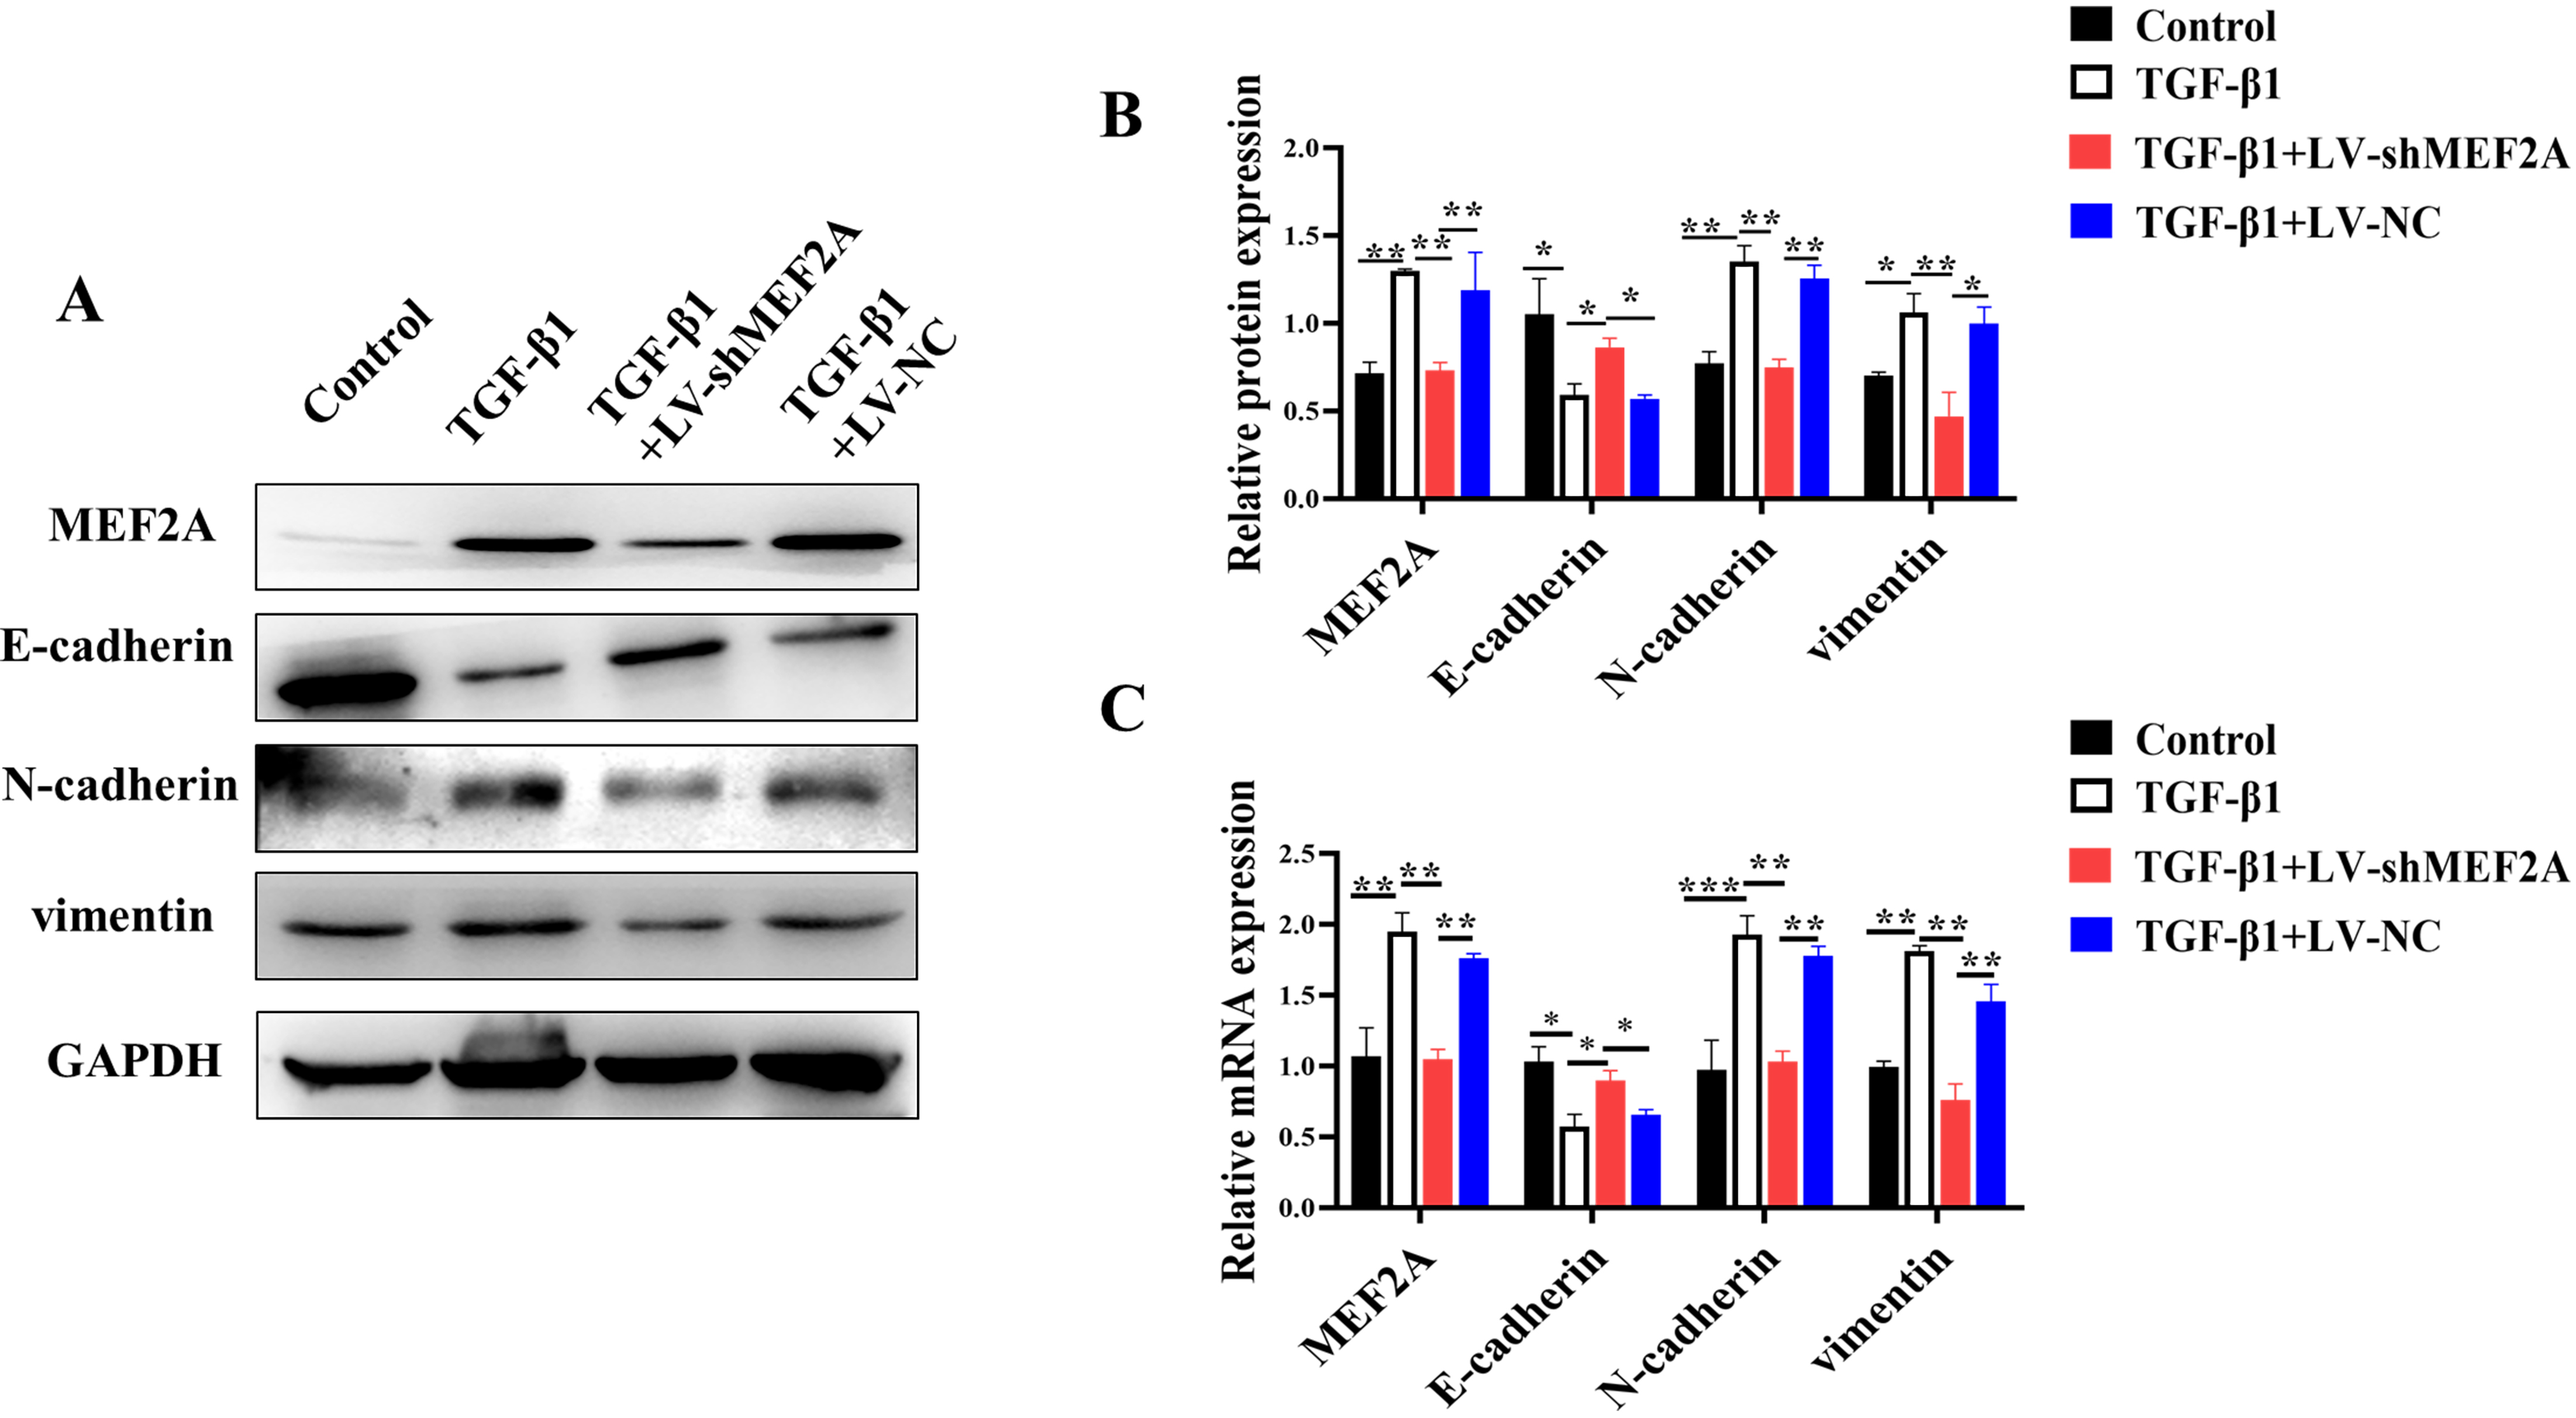 Fig. 2.
Silencing MEF2A inhibits TGF-
Cholangiocyte senescence contributes to
the pathogenesis of PBC and liver fibrosis [24]. HIBECs were transfected with
TGF-
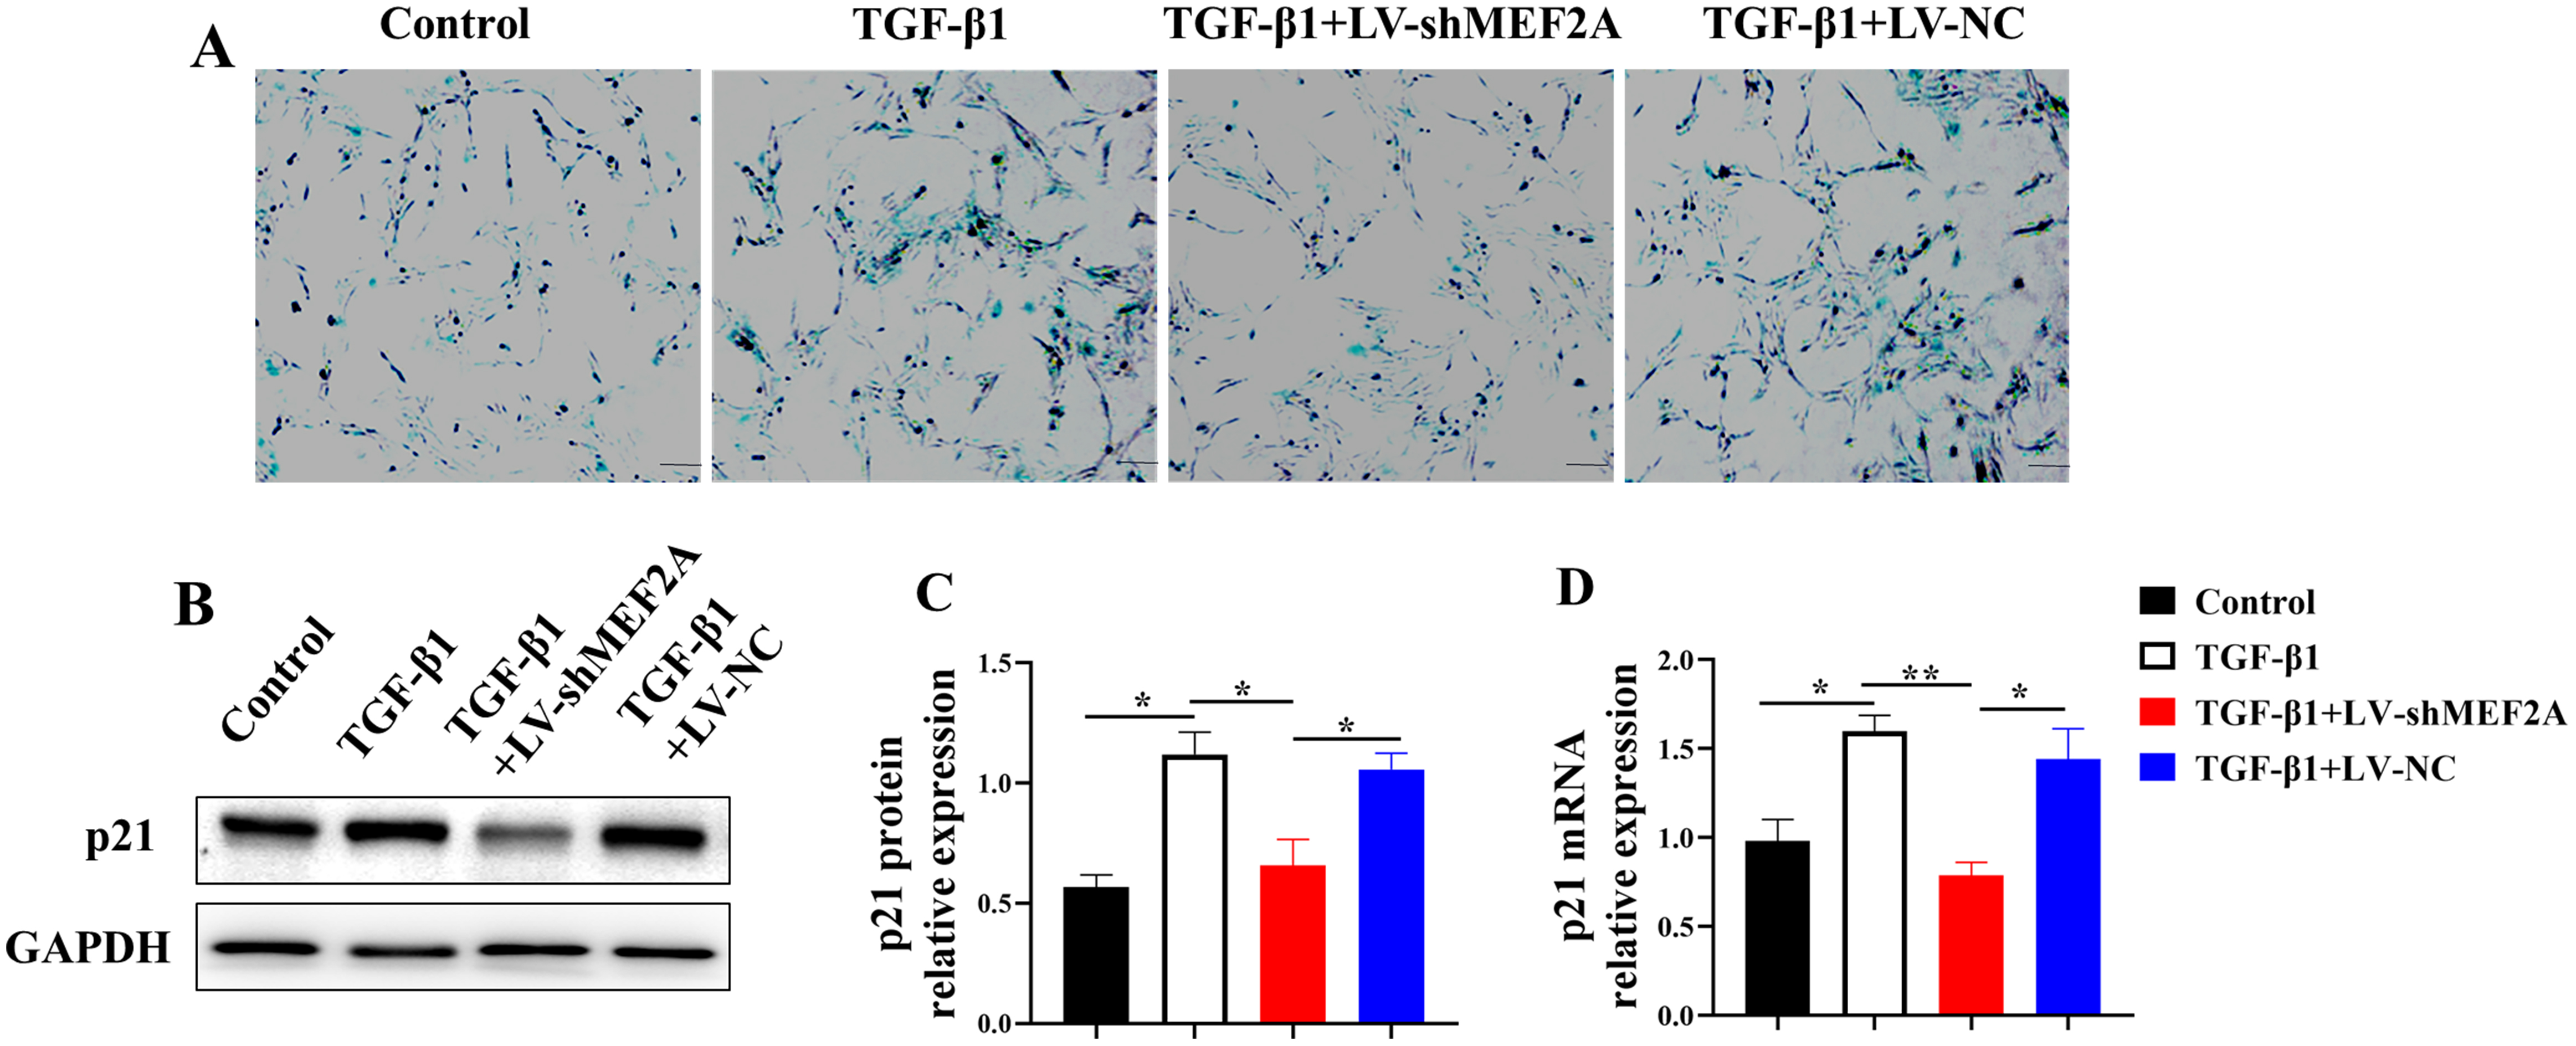 Fig. 3.
Silencing MEF2A decreases TGF-
TGF-
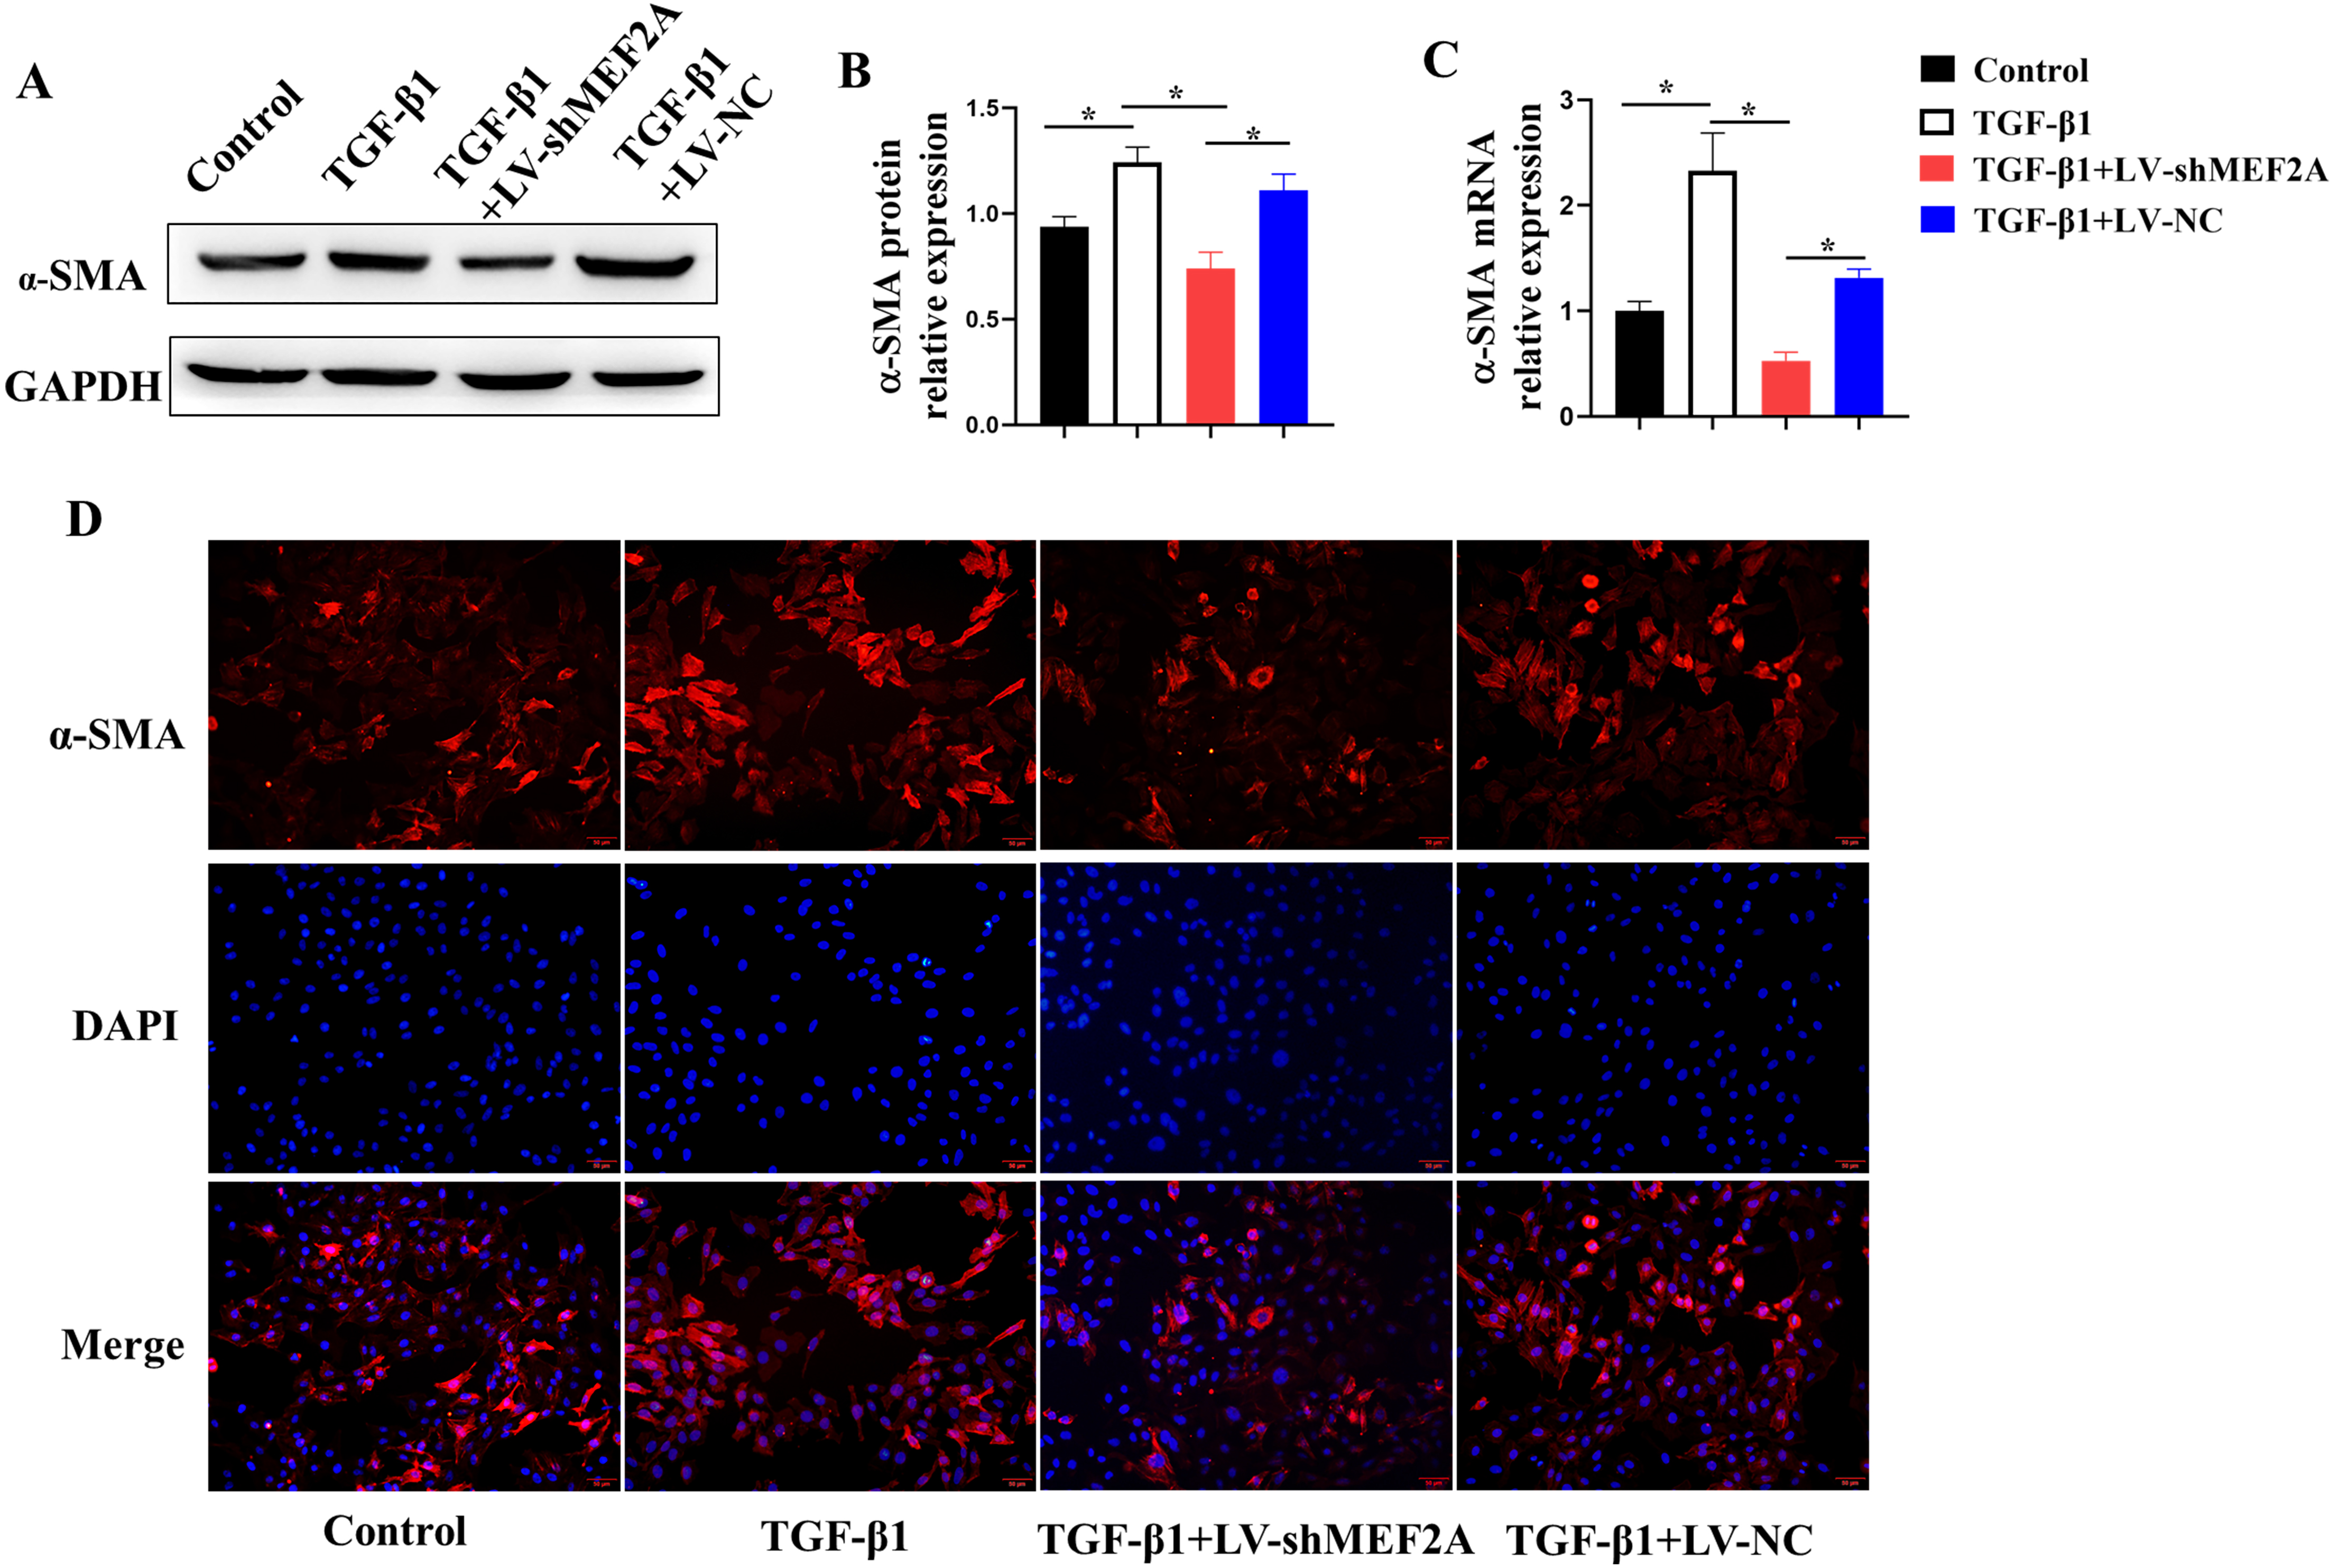 Fig. 4.
Silencing MEF2A alleviates fibrogenesis in HIBECs. HIBECs were
cultured and treated with TGF-
TGF-
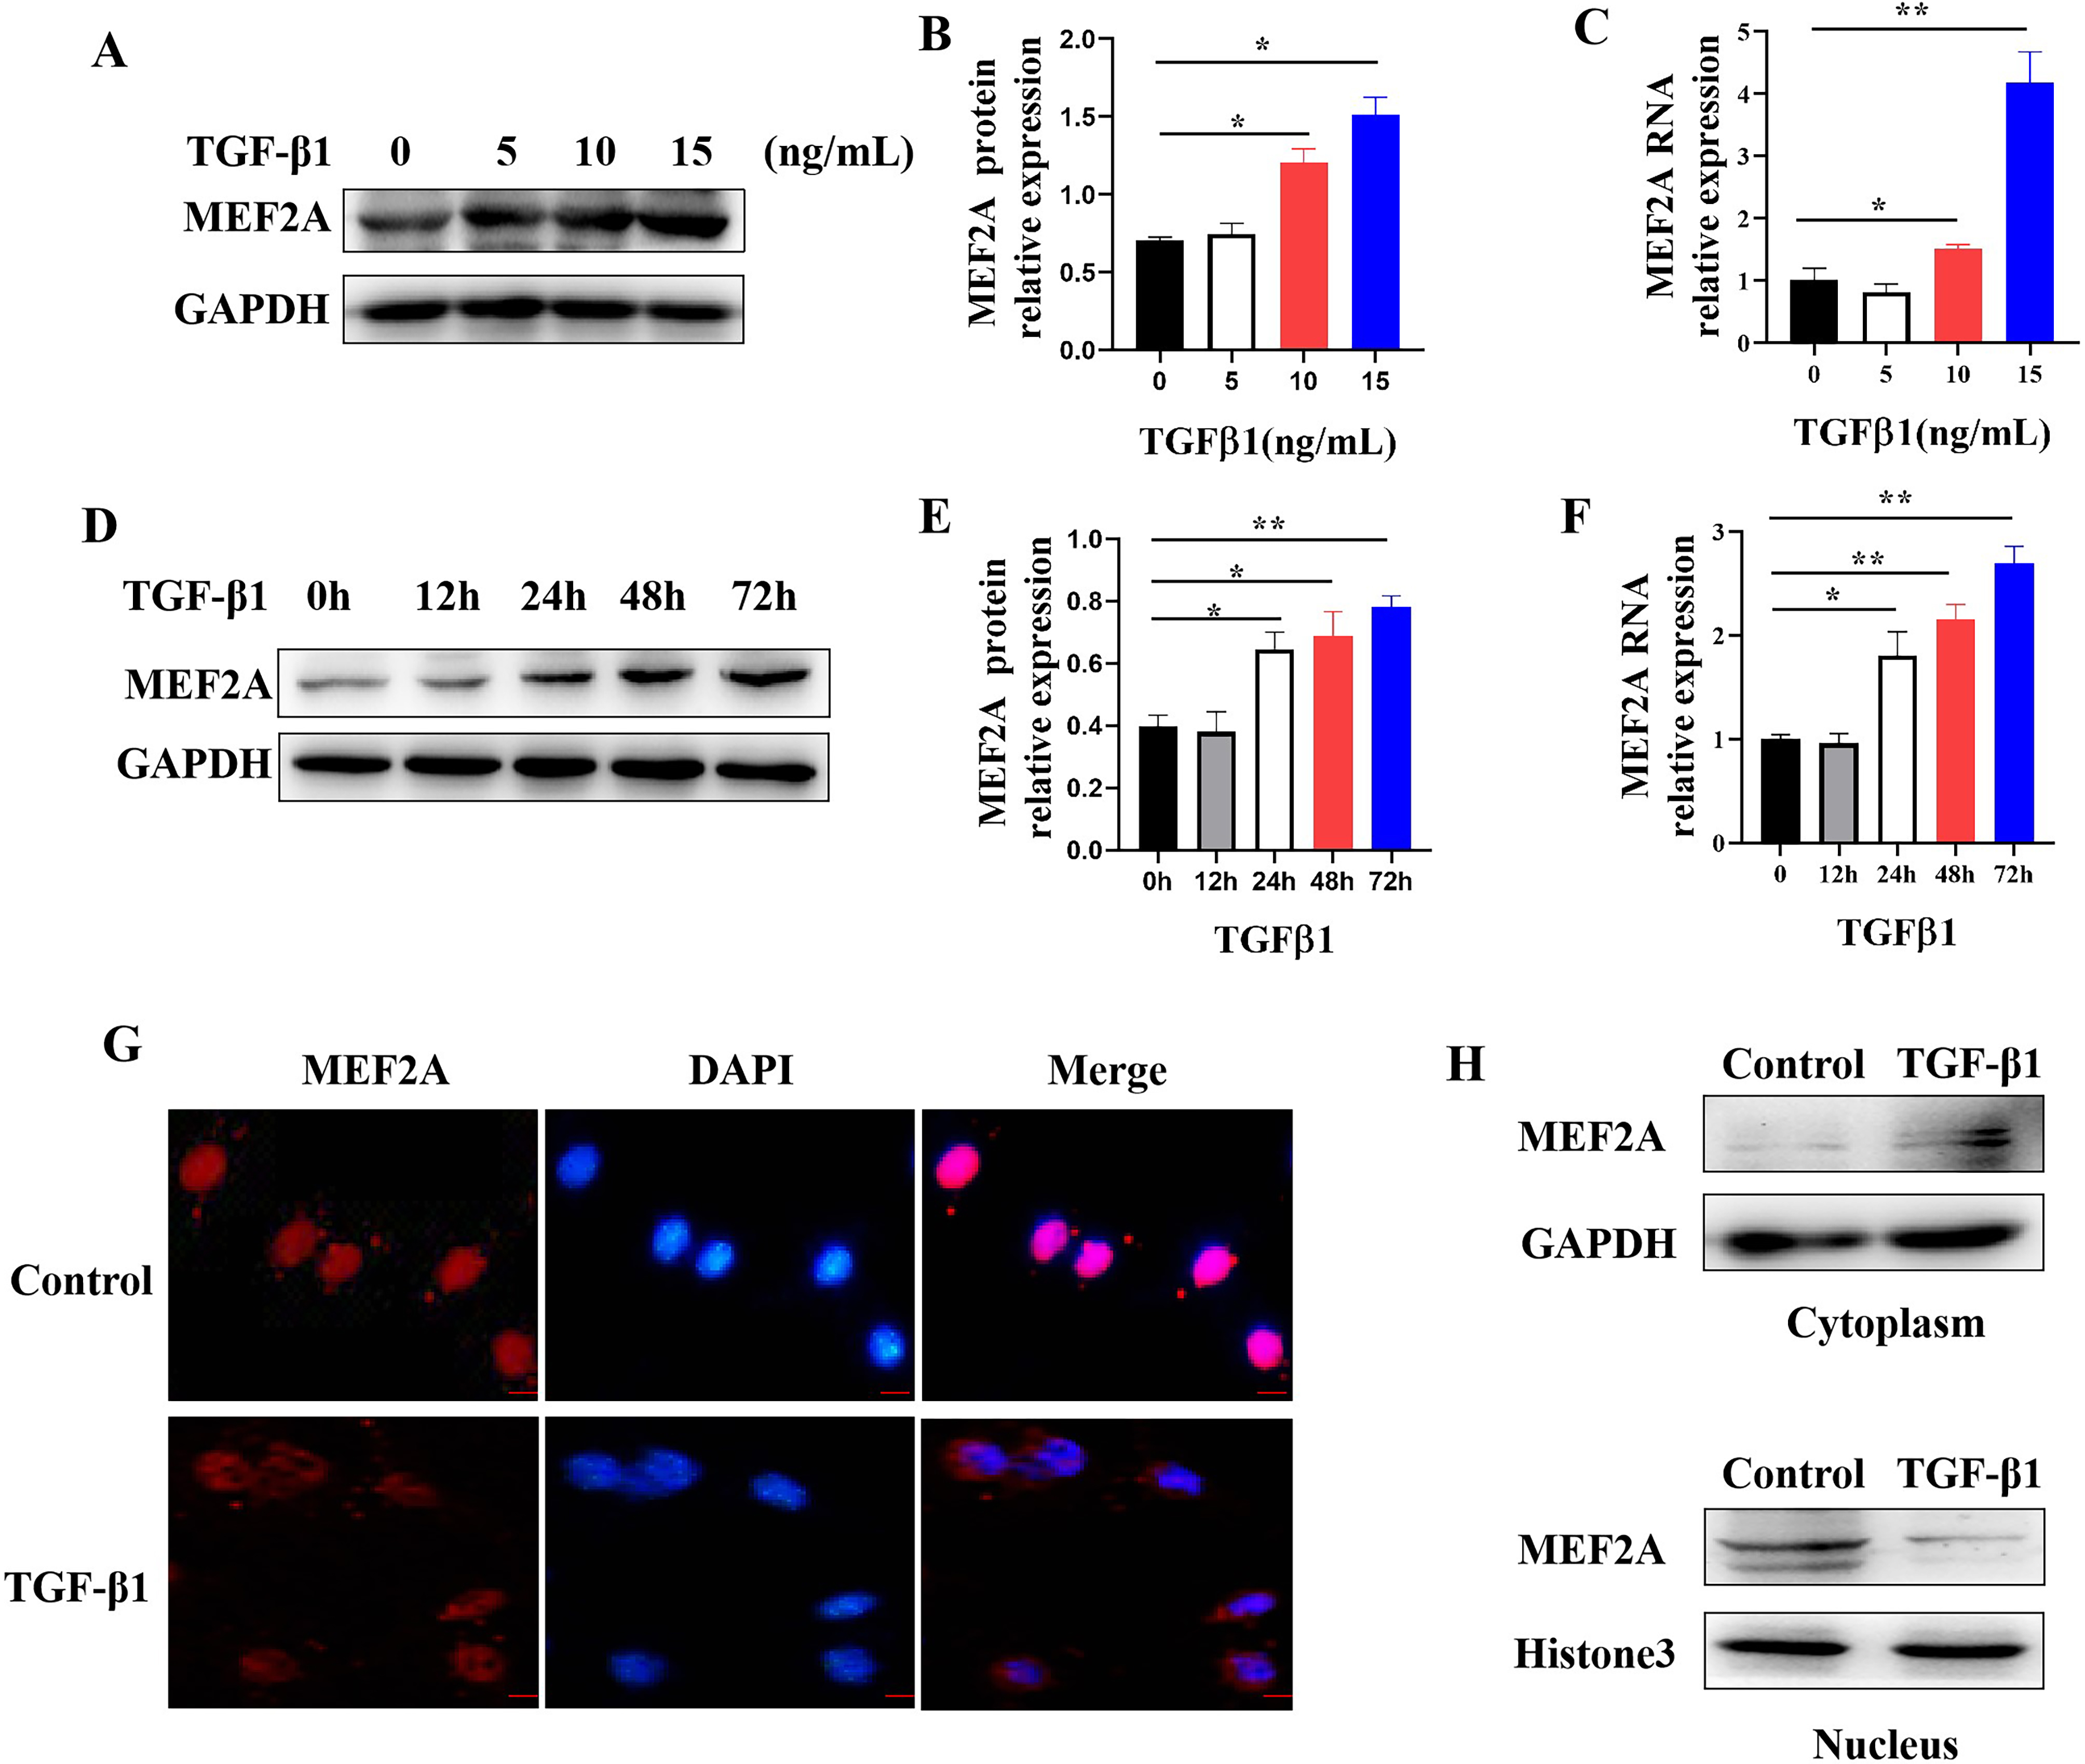 Fig. 5.
Regulating MEF2A expression and cytoplasm translocation by
TGF-
The MAPK pathway may play a role in the pathogenesis of tissue fibrosis, acting
downstream of TGF-
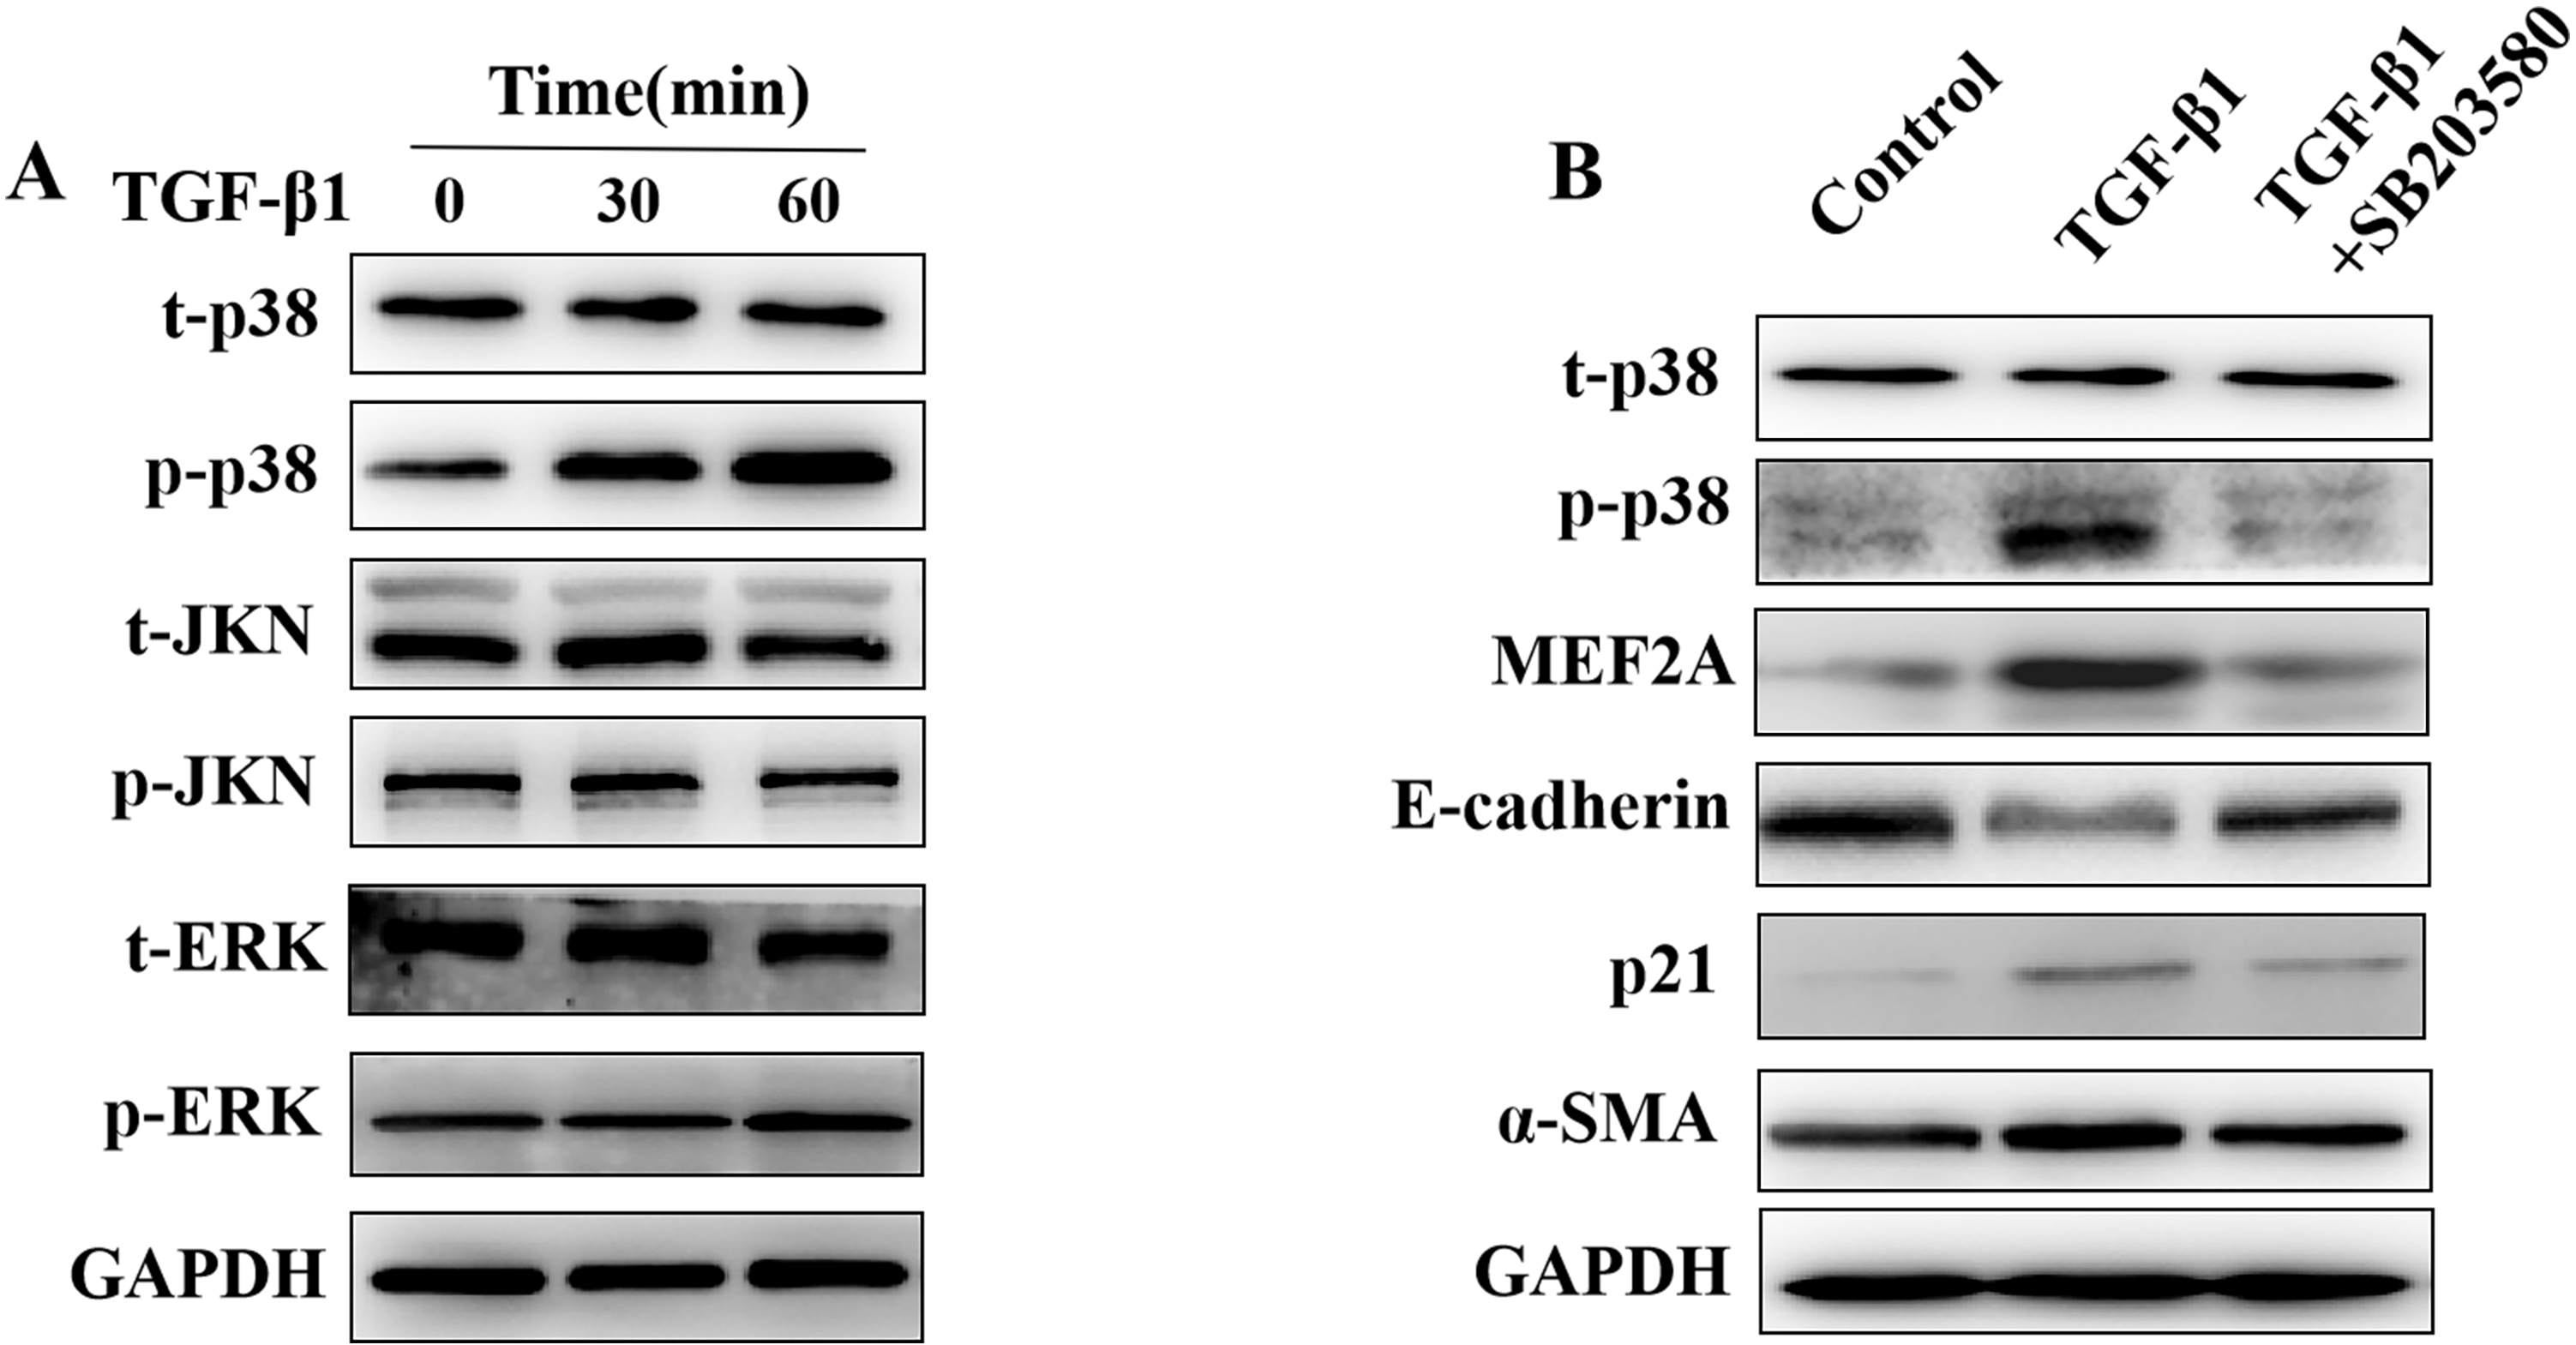 Fig. 6.
Regulation of the expression of MEF2A,
E-cadherin, p21, and
Since MEF2A plays a key role in the fibrogenic response, we aimed to answer whether it contributes to PBC fibrosis. We examined the expression of MEF2A in the serum of patients with PBC and found its levels were significantly high in the serum of patients versus HCs (Fig. 7A). To assess whether serum MEF2A levels were also associated with the extent of liver fibrosis, we determined the liver stiffness measurement (LSM). We used a transient elastographic instrument for the noninvasive evaluation of liver fibrosis called Fibroscan [28]. Next, we analyzed the correlation of serum MEF2A expression with LSM in patients with PBC. Interestingly, MEF2A expression in serum from PBC patients positively correlated with LSM (Fig. 7B). These data indicate that MEF2A expression in serum of patients with PBC positively correlates with the extent of liver fibrosis.
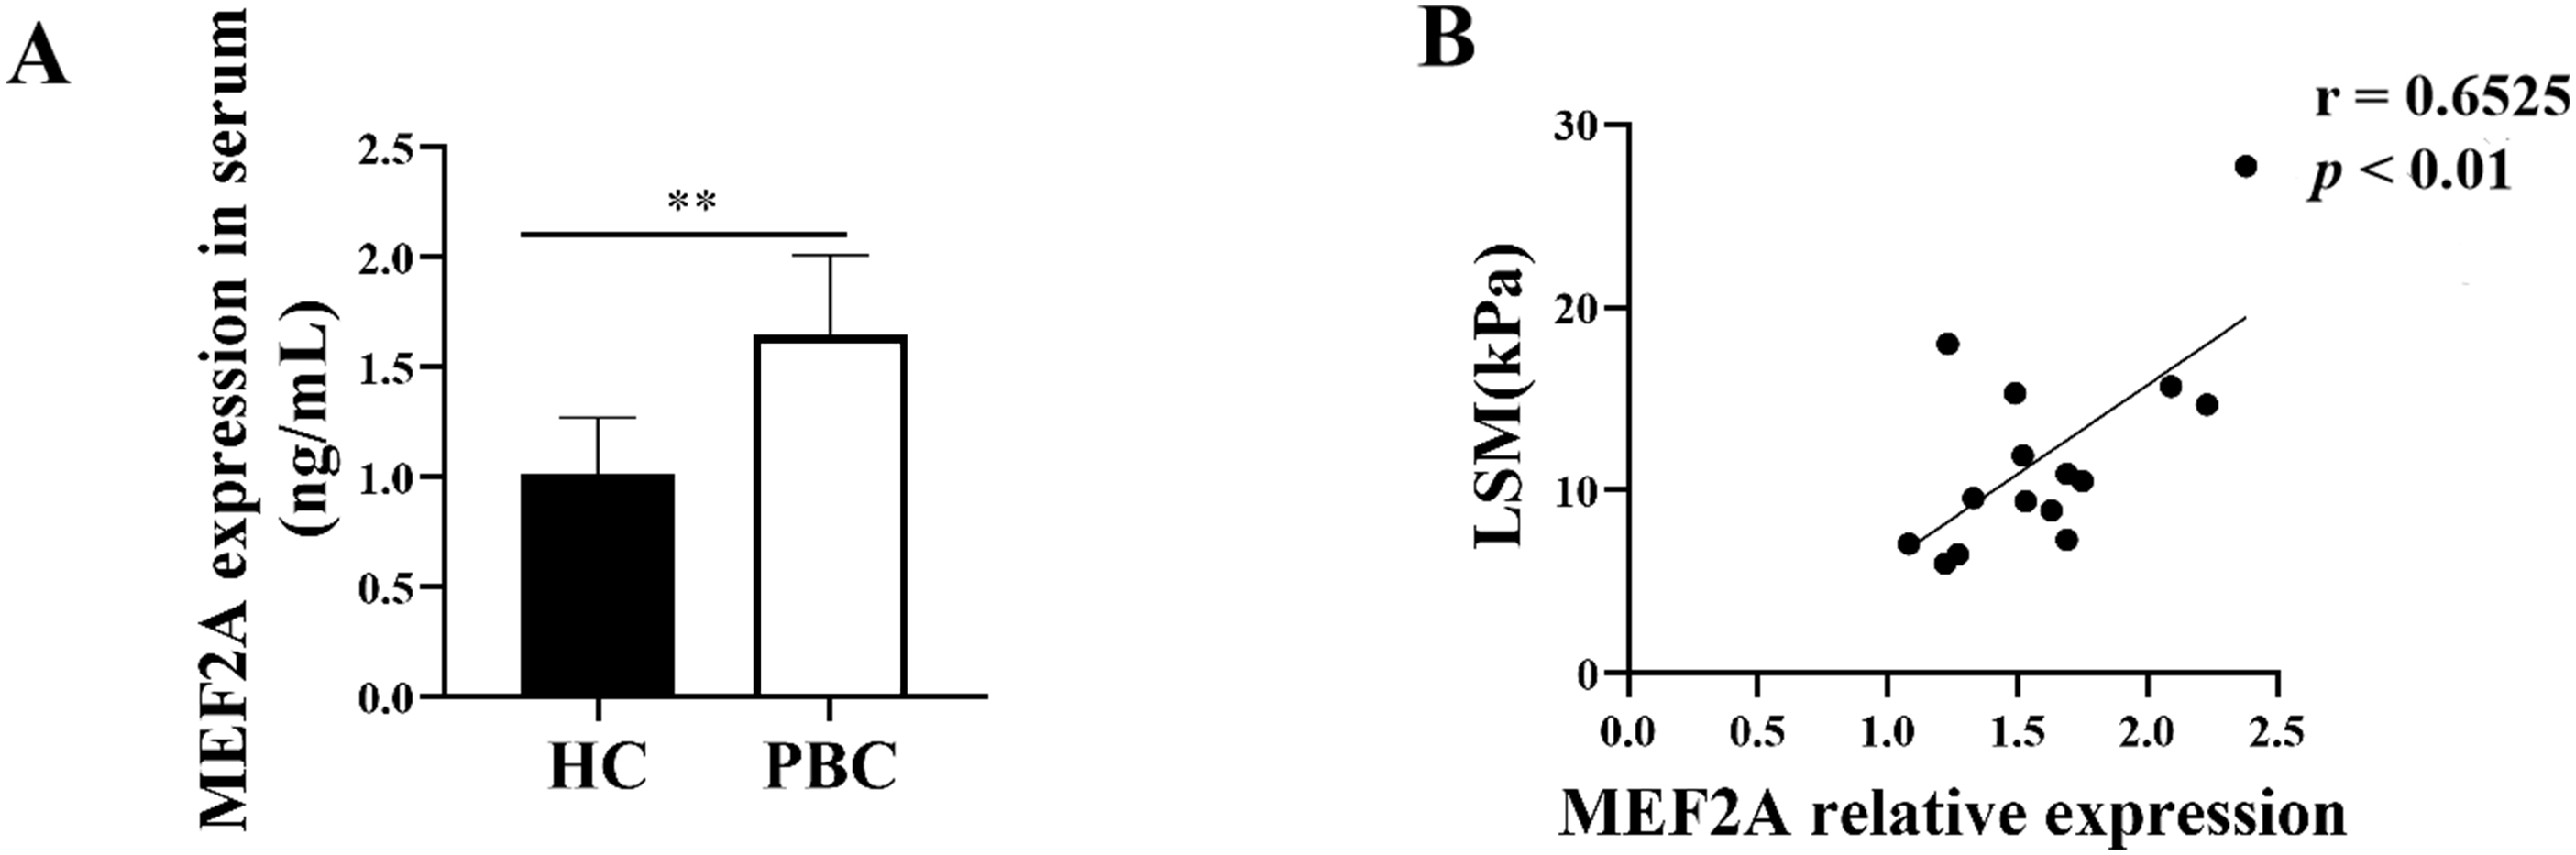 Fig. 7.
MEF2A expression increases in patients with PBC and correlates
with the extent of liver fibrosis. (A) Peripheral blood samples were collected
from patients with PBC (n = 15) and healthy controls (HCs) (n = 15). Expression
of serum MEF2A was detected by ELISA. **p
Chronic cholestatic liver diseases, including PSC and PBC,
mainly affecting intrahepatic bile ducts, usually lead to liver fibrosis,
cirrhosis, and failure. Cholangiocytes are primary targets
during the pathogenesis of cholestatic liver diseases [29]. It
is demonstrated that MEF2A implicated in liver fibrosis, but whether and how
cholangiocytes-derived MEF2A affect cholestatic liver fibrosis are still poorly
understood. This study revealed that MEF2A expression increases in BDL mice and
PBC patients, and positively correlates with the extent of liver fibrosis.
Silencing MEF2A in HIBECs suppresses TGF-
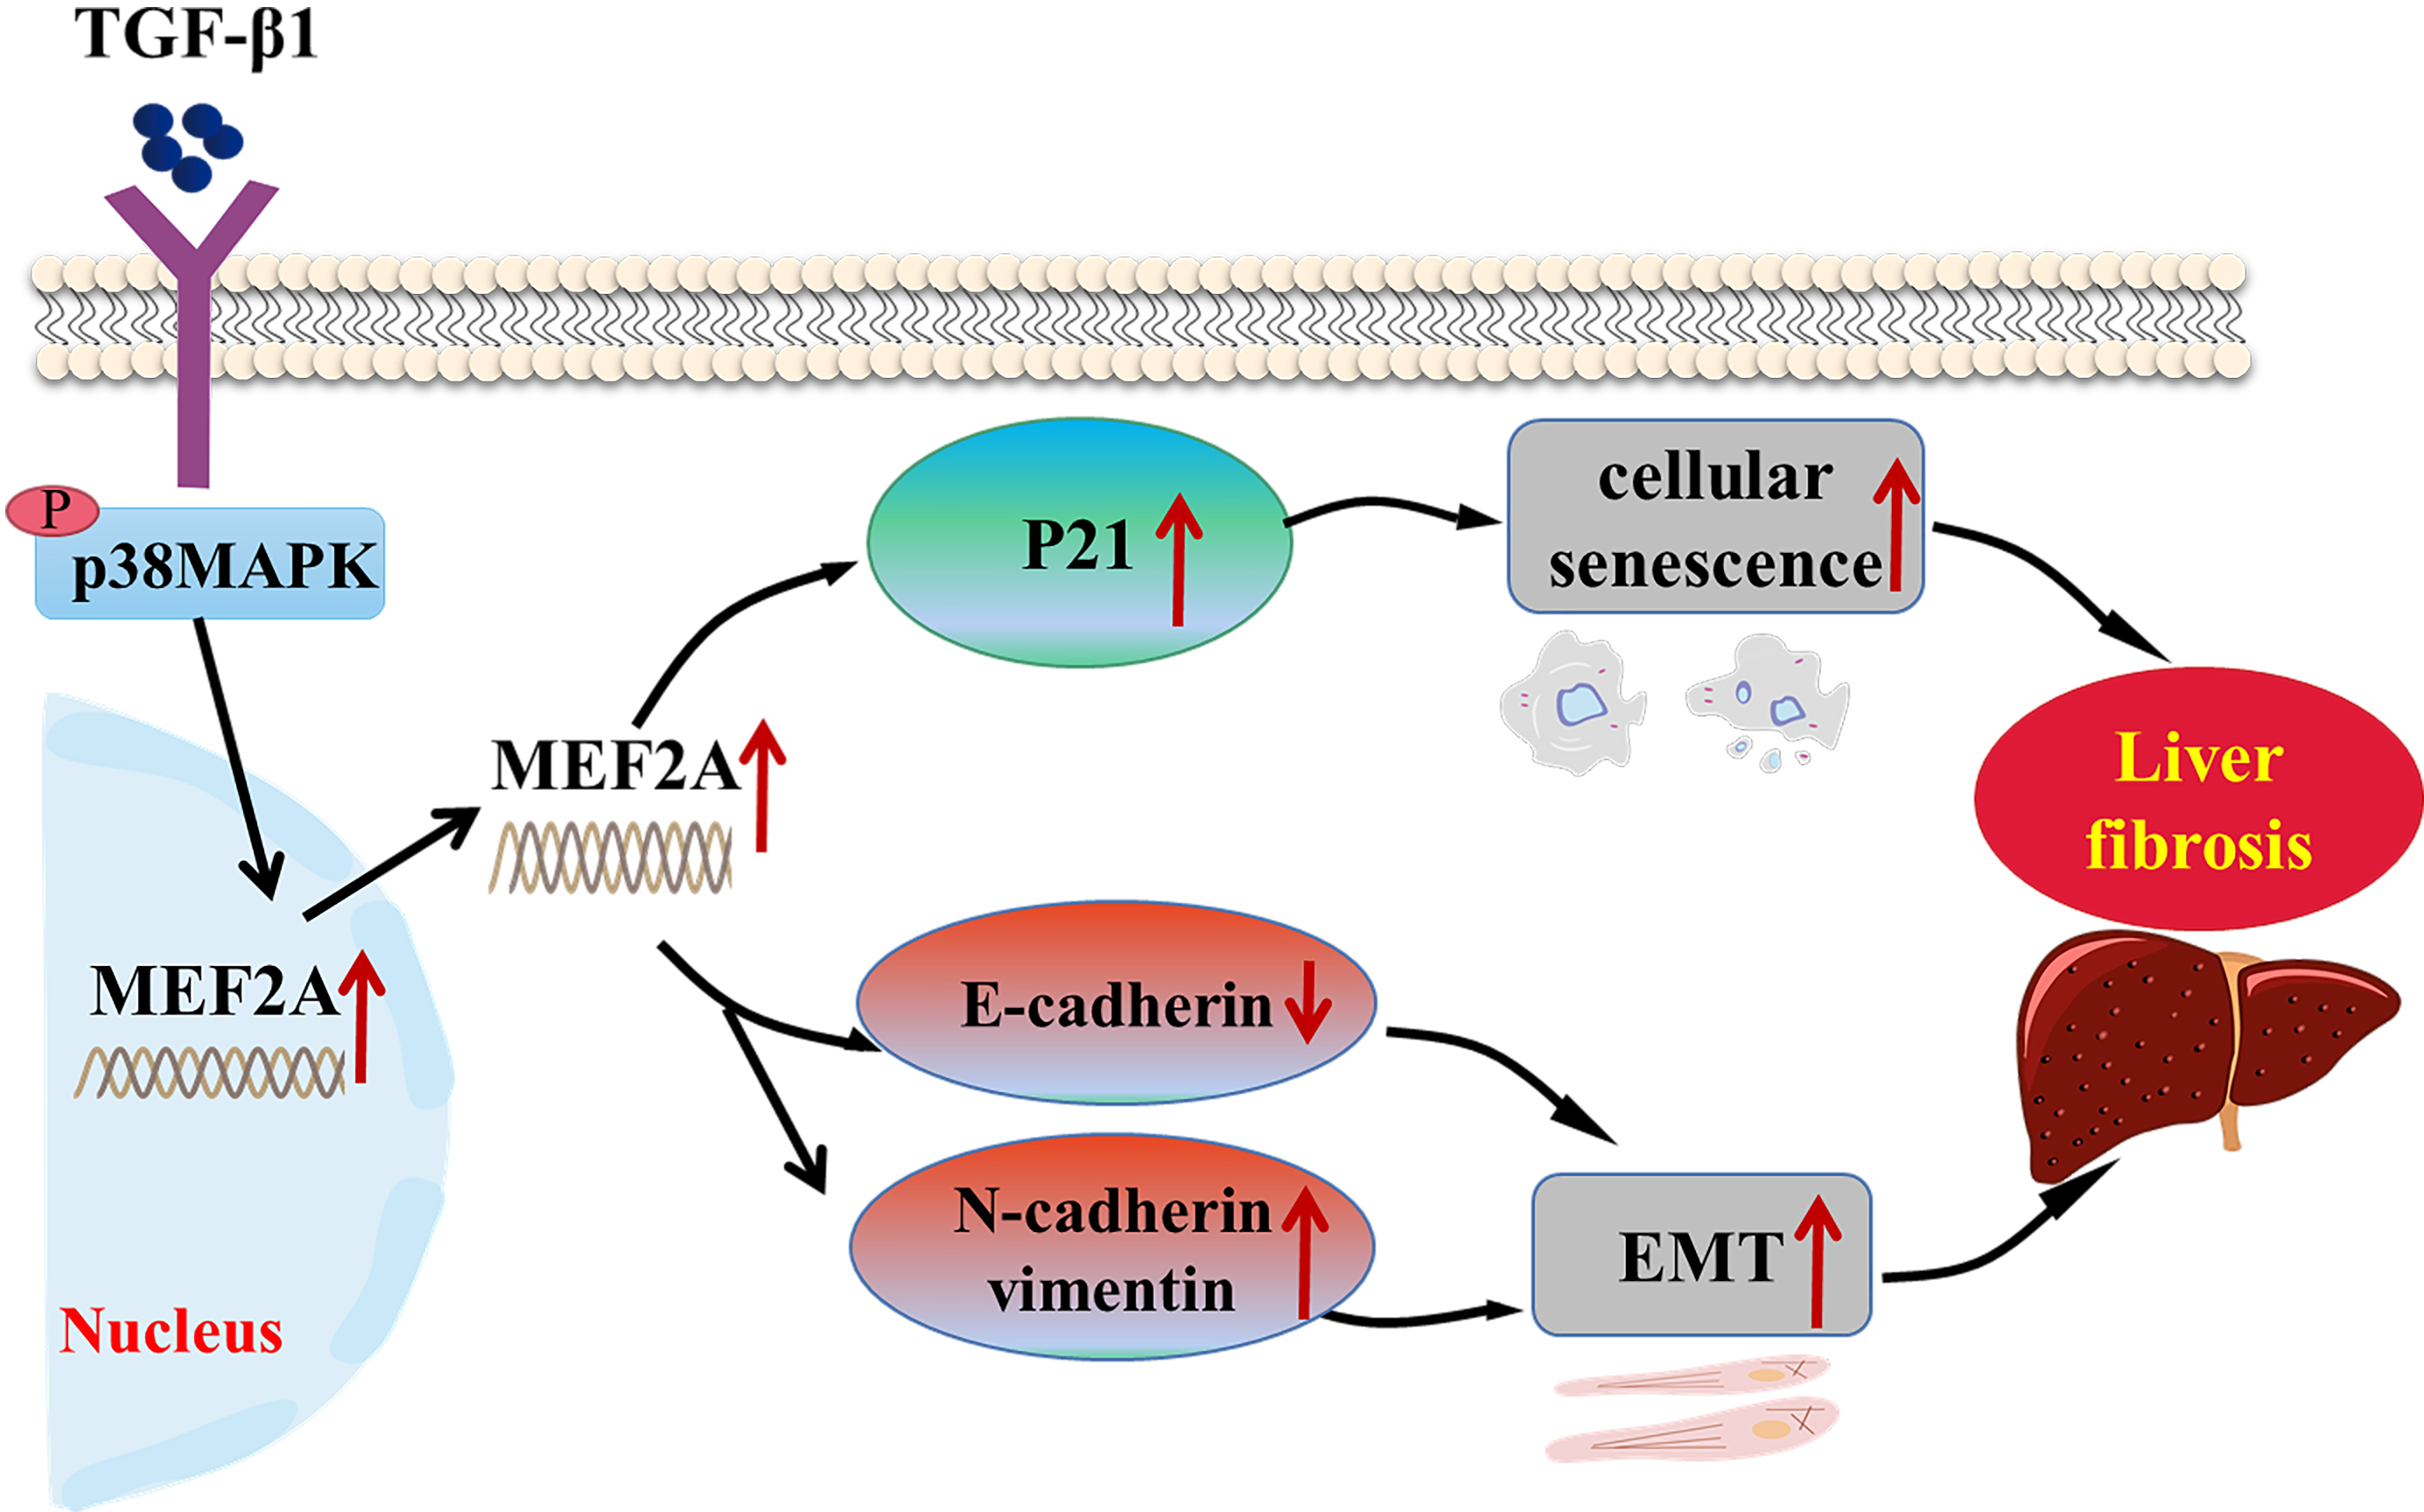 Fig. 8.
Schematic representation of the role of MEF2A in the
pathogenesis of cholestatic liver fibrosis. TGF-
MEF2A belongs to the myocyte enhancer factor 2 (MEF2) family. It is critical for
activating genetic programs that control cell differentiation, morphogenesis,
proliferation, and apoptosis of numerous cell types [30]. The implication of
MEF2A in diverse human cancers, such as prostate, breast, gastrointestinal, and
liver cancer, was discovered. In gastric cancer, the p38 MAPK pathway
phosphorylates MEF2A, promoting tumor proliferation and metastasis [31].
Furthermore, MEF2A promotes colorectal cancer proliferation and metastasis by
activating the Wnt pathway [32]. It also contributes to the apoptosis of HepG2
hepatocellular carcinoma cells [33]. In neurons, MEF2A defines oxytocin-induced
morphological effects and regulates mitochondrial functions [34].
In addition, it is a nonredundant regulator of the inflammatory
epigenome in macrophages [35]. However, only a few reports investigated its roles
in fibrotic diseases. For instance, blockade of MEF2A prevented
hyperglycemia-induced extracellular matrix accumulation via suppressing Akt and
TGF-
EMT has been implicated in several types of chronic fibrotic diseases. It is a
process where epithelial cells obtain mesenchymal features, contributing to the
fibrogenic process [37, 38]. It consists of two crucial steps. The first involves
the loss of epithelial cell adhesion and degradation of junction proteins,
including E-cadherin. The second includes the enhancement of cytoskeletal
proteins from the mesenchymal lineage, including N-cadherin and vimentin [39].
Knockdown of vimentin reduces EMT in cholangiocytes and leads to decreased liver
fibrosis in PSC [40]. MicroRNA-34a accelerates EMT in HIBECs and advances liver
fibrosis in PBC by regulating the TGF-
Cellular senescence is a cell cycle arrest occurring when cells under stress
stimulation, such as DNA damage, dysfunctional telomeres, and oncogenic mutations
[44]. Decreased cholangiocytes senescence may alleviate liver
fibrosis. For instance, remission of liver fibrosis in NK-1R
We also discovered that MEF2A is a central mediator linking EMT and senescence
in TGF-
We show that MEF2A silencing may protect against liver fibrosis by regulating
cholangiocyte EMT and senescence in cholangiopathies. The
underlying mechanism likely involves the expression regulation and cytoplasm
translocation of MEF2A via interactions with the p38 MAPK pathway. In summary,
our study sheds new light on the role of MEF2A in the
pathogenesis of cholestatic liver fibrosis. We believe that inhibiting MEF2A
could be a valuable strategy for managing liver fibrosis in cholestatic liver
diseases. Intriguingly, the positive correlation of serum level of MEF2A with
fibrosis degree of PBC patients suggests that MEF2A may also serve as a potential
biomarker for predicting the risk of fibrogenesis in cholestatic liver diseases.
However, further research should be done in PSC patients and using more animal
models for cholestatic liver fibrosis, for example Mdr2
In conclusion, we have shown here in an in vitro BDL mouse model, PBC
patients and human intrahepatic biliary epithelial cells that MEF2A may involve
in the pathogenesis of cholestatic liver fibrosis through regulating
TGF-
The data and material underlying this article are all available in the article.
FZ conceived and designed the experiments. GZ and FH performed the experiments. HH, YX and YW analyzed the data. GZ, XC and FZ wrote the manuscript. All authors discussed and revised the manuscript.
This study was approved by the Institutional Review Board for Clinical Research of the Affiliated Hospital of Jining Medical University. Written informed consent has been obtained from the patients to publish this paper (Ethic approval number: 2019-FY-066).
Not applicable.
This work was supported by grants from Tai Shan Young Scholar Foundation of Shandong Province (tsqn202103190), TCM Science and Technology Project of Shandong Province (Q-2022134), Key research and development plan of Jining City (2021YXNS045, 2021YXNS144), and Postdoctoral Fund of the Affiliated Hospital of Jining Medical University (JYFY303574).
The authors declare no conflict of interest.