


 , Wenjuan Ma 5,*, Wengui Xu 1,*
1 Department of Molecular Imaging and Nuclear Medicine, Tianjin Medical University Cancer Institute and Hospital, National Clinical Research Center for Cancer, Key Laboratory of Cancer Prevention and Therapy, Tianjin’s Clinical Research Center for Cancer, 300060 Tianjin, China
2 Department of Radiology, Tianjin Medical University Cancer Institute and Hospital, National Clinical Research Center for Cancer, Key Laboratory of Cancer Prevention and Therapy, Tianjin’s Clinical Research Center for Cancer, 300060 Tianjin, China
3 Department of Nuclear Medicine, Southwest Hospital, The First Affiliated Hospital to Army Medical University, 400038 Chongqing, China
4 Department of General Surgery, Tianjin Medical University General Hospital, 300060 Tianjin, China
5 Department of Breast Imaging, Tianjin Medical University Cancer Institute and Hospital, National Clinical Research Center for Cancer, Key Laboratory of Cancer Prevention and Therapy, Tianjin’s Clinical Research Center for Cancer, 300060 Tianjin, China
† These authors contributed equally.
Abstract
Backgrounds: To evaluate the predictive power of
Keywords
- Breast cancer
- Radiomics
- Molecular subtype classification
- Positron emission tomography/computed tomography (18F-FDG PET/CT)
As reported in cancer statistics in 2019, breast cancer (BC) is one of the most common malignancies in women worldwide, ranking first in prevalence and second in mortality [1]. Histological type and grade, proliferative activity and status of human epidermal growth factor receptor 2 (HER2) and hormone receptors expression are increasingly accepted as the most common characteristics influencing the choice of treatment options, the evaluation of therapy responses and the prediction of survival for patients with BC [2, 3]. Consistently, BC is categorized into four different molecular subtypes based on expression of hormonal receptors and HER2 status, including Luminal subtype: hormone receptor positive, HER2 negative; Luminal/HER2 positive subtype: hormone receptor positive, HER2 overexpression or amplified; HER2 positive non-luminal subtype: hormone receptor negative, HER2 overexpression or amplified; Triple-negative (TN) subtype: hormone receptor negative and HER2 negative [4]. However, this molecular subtype classification is mainly achieved through invasive procedures, such as biopsy-based immunohistochemical (IHC) staining or fluorescence in situ hybridization (FISH) method [5]. Moreover, heterogeneity existed in different BC lesions from individual BC patients, even in a same lesion from a single BC patient [6]. Therefore, the local biopsy could not represent the whole tumor lesion or the distant unexamined metastatic lesions due to the existed heterogeneity in BC lesions. A reliable and non-invasive imaging methodology is needed to identify these gene expression profiles to develop personalized treatment and improve early prognosis prediction for patients with BC [7, 8, 9, 10].
As a hybrid imaging allowing for simultaneous anatomic imaging
and molecular functional imaging,
It is now recognized that standard medical images may contain more useful information than that we can see by using our naked eyes. Radiomics is an emerging hot topic in medical imaging, which is actually a high-throughput extraction of quantitative metrics from medical images via computational post-processing techniques [4, 9, 10]. Indeed, radiomics is based on the assumption that the extracted heterogeneity descriptors from medical images are linked to genotypic and molecular characteristics of the tumor lesions, and is believed to be a promising model to guide patient management in personalized medicine [16]. To date, most studies about radiomics in relation to molecular characterization of BC are ultrasound [7], mammographic [17] and magnetic resonance imaging (MRI) radiomics [9, 10, 18, 19, 20]. Few data regarding to PET/CT radiomics for BC patients are available, especially for the performance of radiomics models based on PET/CT images in molecular subtype determination [4, 21, 22].
In the present investigation, the heterogeneity in
In this retrospective single center investigation, the following specific
inclusion/exclusion criteria were applied to select eligible patients from
Tianjin Medical University Cancer Institute and Hospital between 1st January 2010
and 31th May 2019: (1) age
| Characteristics | n (%) | |
| Sex | ||
| Female | 273 (100%) | |
| Male | 0 (0%) | |
| Age | 51.76 | |
| Histology | ||
| Invasive ductal carcinoma | 263 (96.34%) | |
| Invasive lobular carcinoma | 3 (1.10%) | |
| Others | 7 (2.56%) | |
| ER | ||
| Positive | 181 (66.30%) | |
| Negative | 92 (33.70%) | |
| PR | ||
| Positive | 156 (57.14%) | |
| Negative | 117 (42.86%) | |
| HER2 | ||
| Positive | 106 (38.83%) | |
| Negative | 167 (61.17%) | |
| Ki-67 | ||
| 34 (12.45%) | ||
| 239 (87.55%) | ||
| N staging | ||
| Positive | 222 (81.32%) | |
| Negative | 51 (18.68%) | |
| M staging | ||
| Positive | 55 (20.14%) | |
| Negative | 218 (79.86%) | |
| Staging | ||
| I | 19 (6.96%) | |
| II | 139 (50.92%) | |
| III | 60 (21.98%) | |
| IV | 55 (20.14%) | |
| Subtype | ||
| Luminal A | 20 (7.33%) | |
| Luminal B (HER2–) | 106 (38.83%) | |
| Luminal B (HER2+) | 61 (22.34%) | |
| HER2 Subtype | 45 (16.48%) | |
| Triple Negative | 41 (15.02%) | |
| ER, estrogen receptor; HER2, human epidermal growth factor receptor 2; n, number; N, node; M, metastasis; PR, progesterone receptor. | ||
After at least 6 h of fasting, BC patients with blood glucose
levels less than 140 mg/dL received an intravenous injection of 4 MBq/kg of
Molecular subtype classification of patients with BC in this study was based on the status of hormone receptors and HER2 expression as mentioned previously. Briefly, patients with positive immunohistochemical (IHC) expression of estrogen receptor (ER) and progesterone receptor (PR) regardless of the status of HER2 were defined as Luminal subtype; patients with overexpression or amplification of HER2 regardless of the status of ER or PR were divided into HER2 positive (HER2+) subtype; patients with negative IHC expression of hormone receptors and negative amplification of HER2 were determined as triple negative (TN) subtype. It was important to note that the status of HER2 were assessed by both IHC staining and FISH assay. Especially for patients with ambiguous results of IHC staining of HER2, FISH was used to finally determine the status of HER2.
To extract radiomic features from PET/CT images, the contour of the region of interest (ROI) on PET or CT images was firstly manually outlined by two experienced PET/CT imaging-specialized experts using ImageJ 1.50i software (National Institute of Health, Bethesda, MD, USA). Any disagreement about the delineation was resolved by consensus. Then, over the segmented tumor ROI, all radiomic features were calculated by applying an existing automated computer program (MATLAB, The MathWorks Inc., Natick, MA, USA). A total of 1710 quantitative radiomic features (855 PET-based and 855 CT-based radiomic features) were extracted and calculated from PET/CT images. Data augmentation was used to smooth the imbalance between groups. To assess their performances in molecular subtype determination of patients with BC, including Luminal vs. Non-Luminal, HER2 positive (HER2+) vs. HER2 negative (HER2–) and TN vs. Non-TN, multivariate radiomic signature models based on PET/CT radiomic features were developed in the present investigation.
For quantitative variables, results were expressed as mean
To evaluate the predictive power of
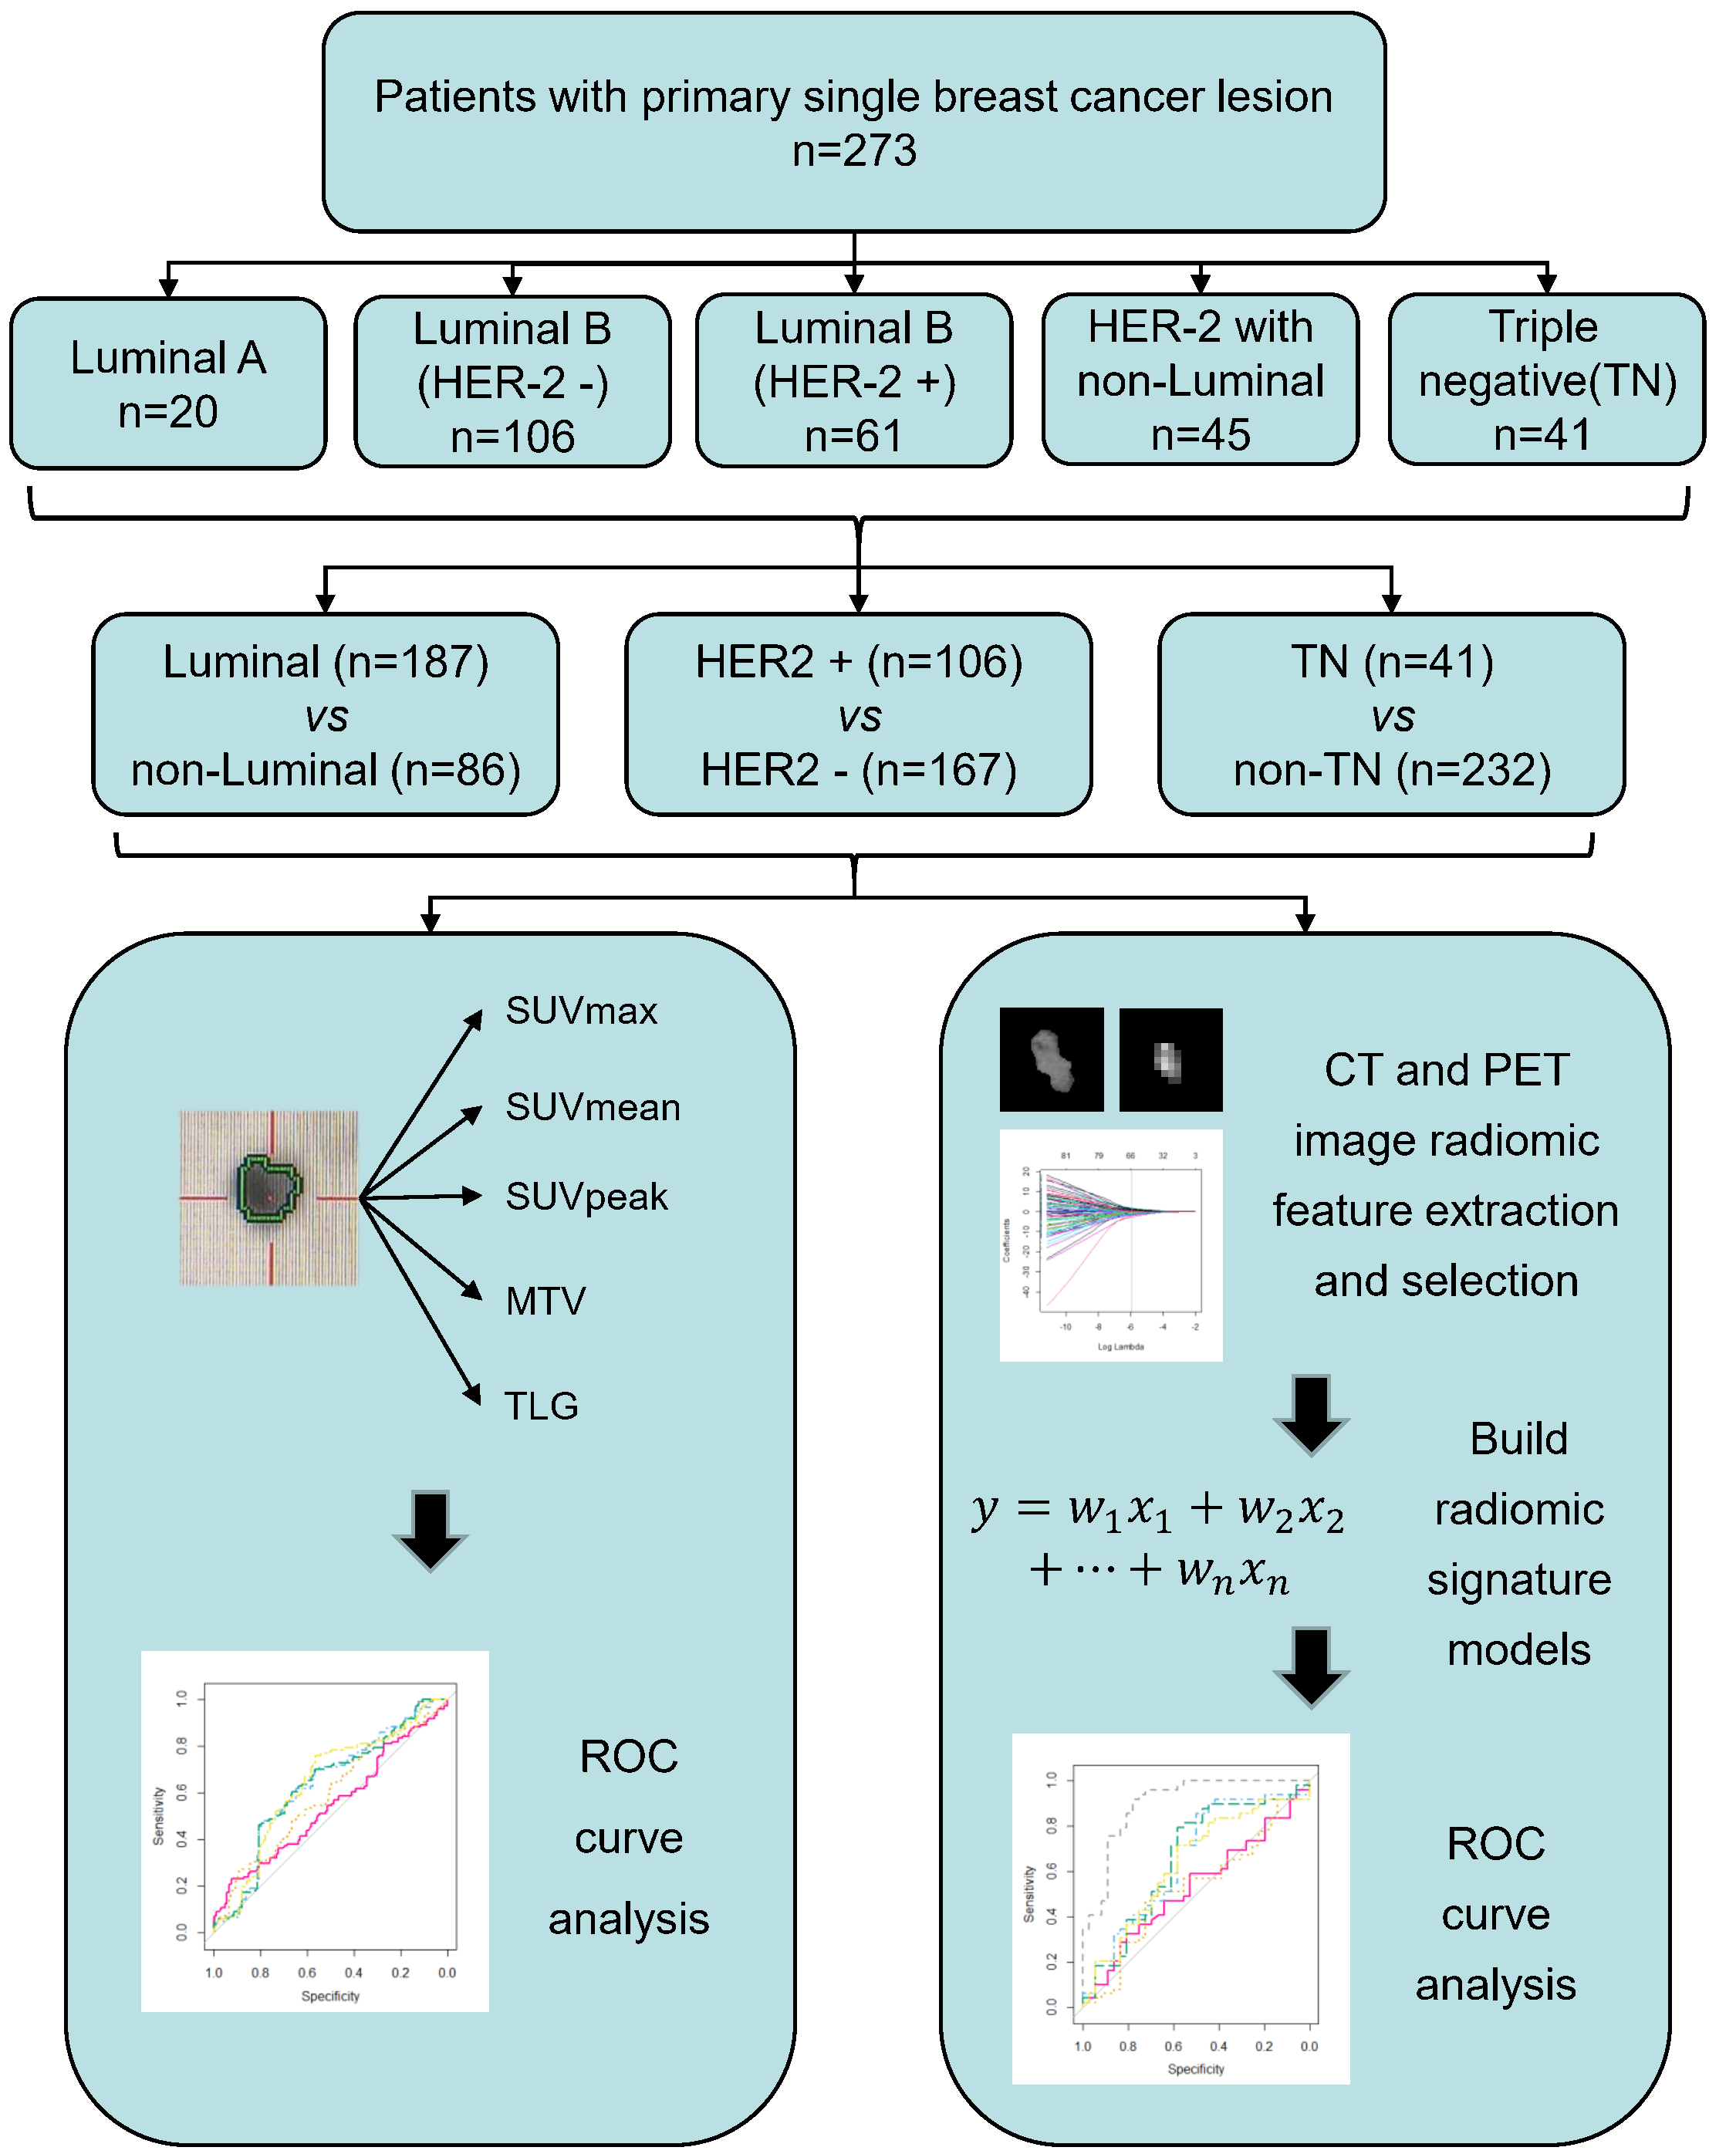 Fig. 1.
The workflow of this study. Briefly, a total of 273 eligible BC patients were enrolled in the radiomic analysis. Based on the molecular subtypes classification by IHC or FISH assay, BC patients were divided into different groups for comparison, including Luminal vs. Non-luminal, HER2+ vs. HER2– and TN vs. Non-TN. Radiomic analysis in the study mainly consist of lesion segmentation, radiomic features extraction and selection, multivariate radiomic signature model construction, and evaluation of the predictive performance of the developed radiomic signature model in molecular subtypes classification of BC by ROC analysis. Apart from radiomic analysis, a total of 5 conventional PET parameters (SUVmax, SUVmean, SUVpeak, MTV and TLG) were also calculated to compare their abilities to discriminate between different molecular subytypes of BC with that of established radiomic signature model. BC, breast cancer; CT, computed tomography; FISH, fluorescence in situ hybridization; HER2, human epidermal growth factor receptor 2; IHC, immunohistochemistry; MTV, metabolic tumor volume; PET, positron emission tomography; ROC, receiver operating curve; SUV, standardized uptake value; TLG, total lesion glycolysis; TN, non-triple.
Of the 273 BC patients with results for molecular subtype classification, 68.5% (187/273) of patients were defined as Luminal subtype and 38.8% (106/273) of patients were with a HER2 positive regardless of hormone receptors status (HER2+), whereas 15.0% (41/273) of patients were tested negatively for both hormone receptors and HER2, known as TN subtype. To assess the association between conventional PET parameters (SUVmax, SUVmean, SUVpeak, MTV and TLG) and molecular subtype classification, we first compared the conventional PET parameter values between groups with different molecular profiles (Table 2). For Luminal BC patients, the SUVmax, SUVmean and SUVpeak were found to be underrepresented in comparison with the Non-Luminal group, whereas no significant difference of MTV or TLG existed between Luminal vs. Non-Luminal. With respect to HER2+ vs. HER2–, no significant differences existed between HER2+ BC patients and HER2– patients for all the five conventional PET parameters. As expected, the TN subtype group demonstrated significantly higher values of SUVmax, SUVmean and SUVpeak, but not for MTV or TLG in contrast with Non-TN subtype BC patients.
| n | SUVmax | SUVmean | SUVpeak | MTV | TLG | |
| Luminal | 187 | 9.29 |
5.72 |
6.93 |
16.40 |
142.36 |
| Non-Luminal | 86 | 12.21 |
7.49 |
9.02 |
23.75 |
239.38 |
| p | 0.001 | 0.993 | 0.173 | |||
| HER2+ | 106 | 10.65 |
6.59 |
7.88 |
14.53 |
143.06 |
| HER2– | 167 | 9.94 |
6.08 |
7.40 |
21.37 |
191.89 |
| p | 0.132 | 0.113 | 0.121 | 0.509 | 0.949 | |
| TN | 41 | 12.70 |
7.68 |
9.44 |
33.86 |
316.61 |
| Non-TN | 232 | 9.78 |
6.03 |
7.26 |
16.04 |
147.53 |
| p | 0.015 | 0.019 | 0.031 | 0.566 | 0.567 | |
| HER2, human epidermal growth factor receptor 2; MTV, metabolic tumor volume; n, number; PET, positron emission tomography; SUV, standardized uptake value; TLG, total lesion glycolysis; TN, non-triple. | ||||||
A total of 1710 radiomic features (855 PET-based and 855 CT-based radiomic features) were extracted and computed based on PET/CT images. After LASSO regression (Fig. 2), the most predictive radiomic features based on PET/CT images were selected to establish radiomic signature models for molecular subtype classification of BC. As presented in Supplementary Fig. 1, three most predictive sets of radiomic features were included in each established multivariate radiomic signature models, including Luminal vs. Non-Luminal (Supplementary Fig. 1A), HER+ vs. HER2– (Supplementary Fig. 1B) and TN vs. Non-TN (Supplementary Fig. 1C). In addition, the formulas to compute the radiomics score (Rad-score) for each patient through a linear combination of selected features weighted by their respective coefficients in each established multivariate radiomic signature models were also listed in the Supplementary materials. To evaluate the performance of established radomic signature models in distinguishing molecular subtypes of BC, ROC analyses were conducted and AUCs were used as the main outcomes. As shown in Fig. 2, all the three established multivariate radiomic signature models significantly outperformed all the conventional PET parameters (SUVmax, SUVmean, SUVpeak, MTV and TLG) in molecular subtype classification of BC, with a AUC of 0.913 and 0.725, 0.912 and 0.820, 0.968 and 0.901 for Luminal vs. non-Luminal (Fig. 2a), HER+ vs. HER2– (Fig. 2b) and TN vs. non-TN (Fig. 2c) discrimination in the training set and the validation set, respectively. In consideration of a significant association between SUV parameters and molecular subtype classification of BC, several integrated models by taking into account not only PET/CT derived radiomic features but also SUV parameters were established to assess their performance in molecular subtype classification of BC. A comparable but not a superior performance of integrated models in molecular subtype classification compared to radiomic signature models was observed.
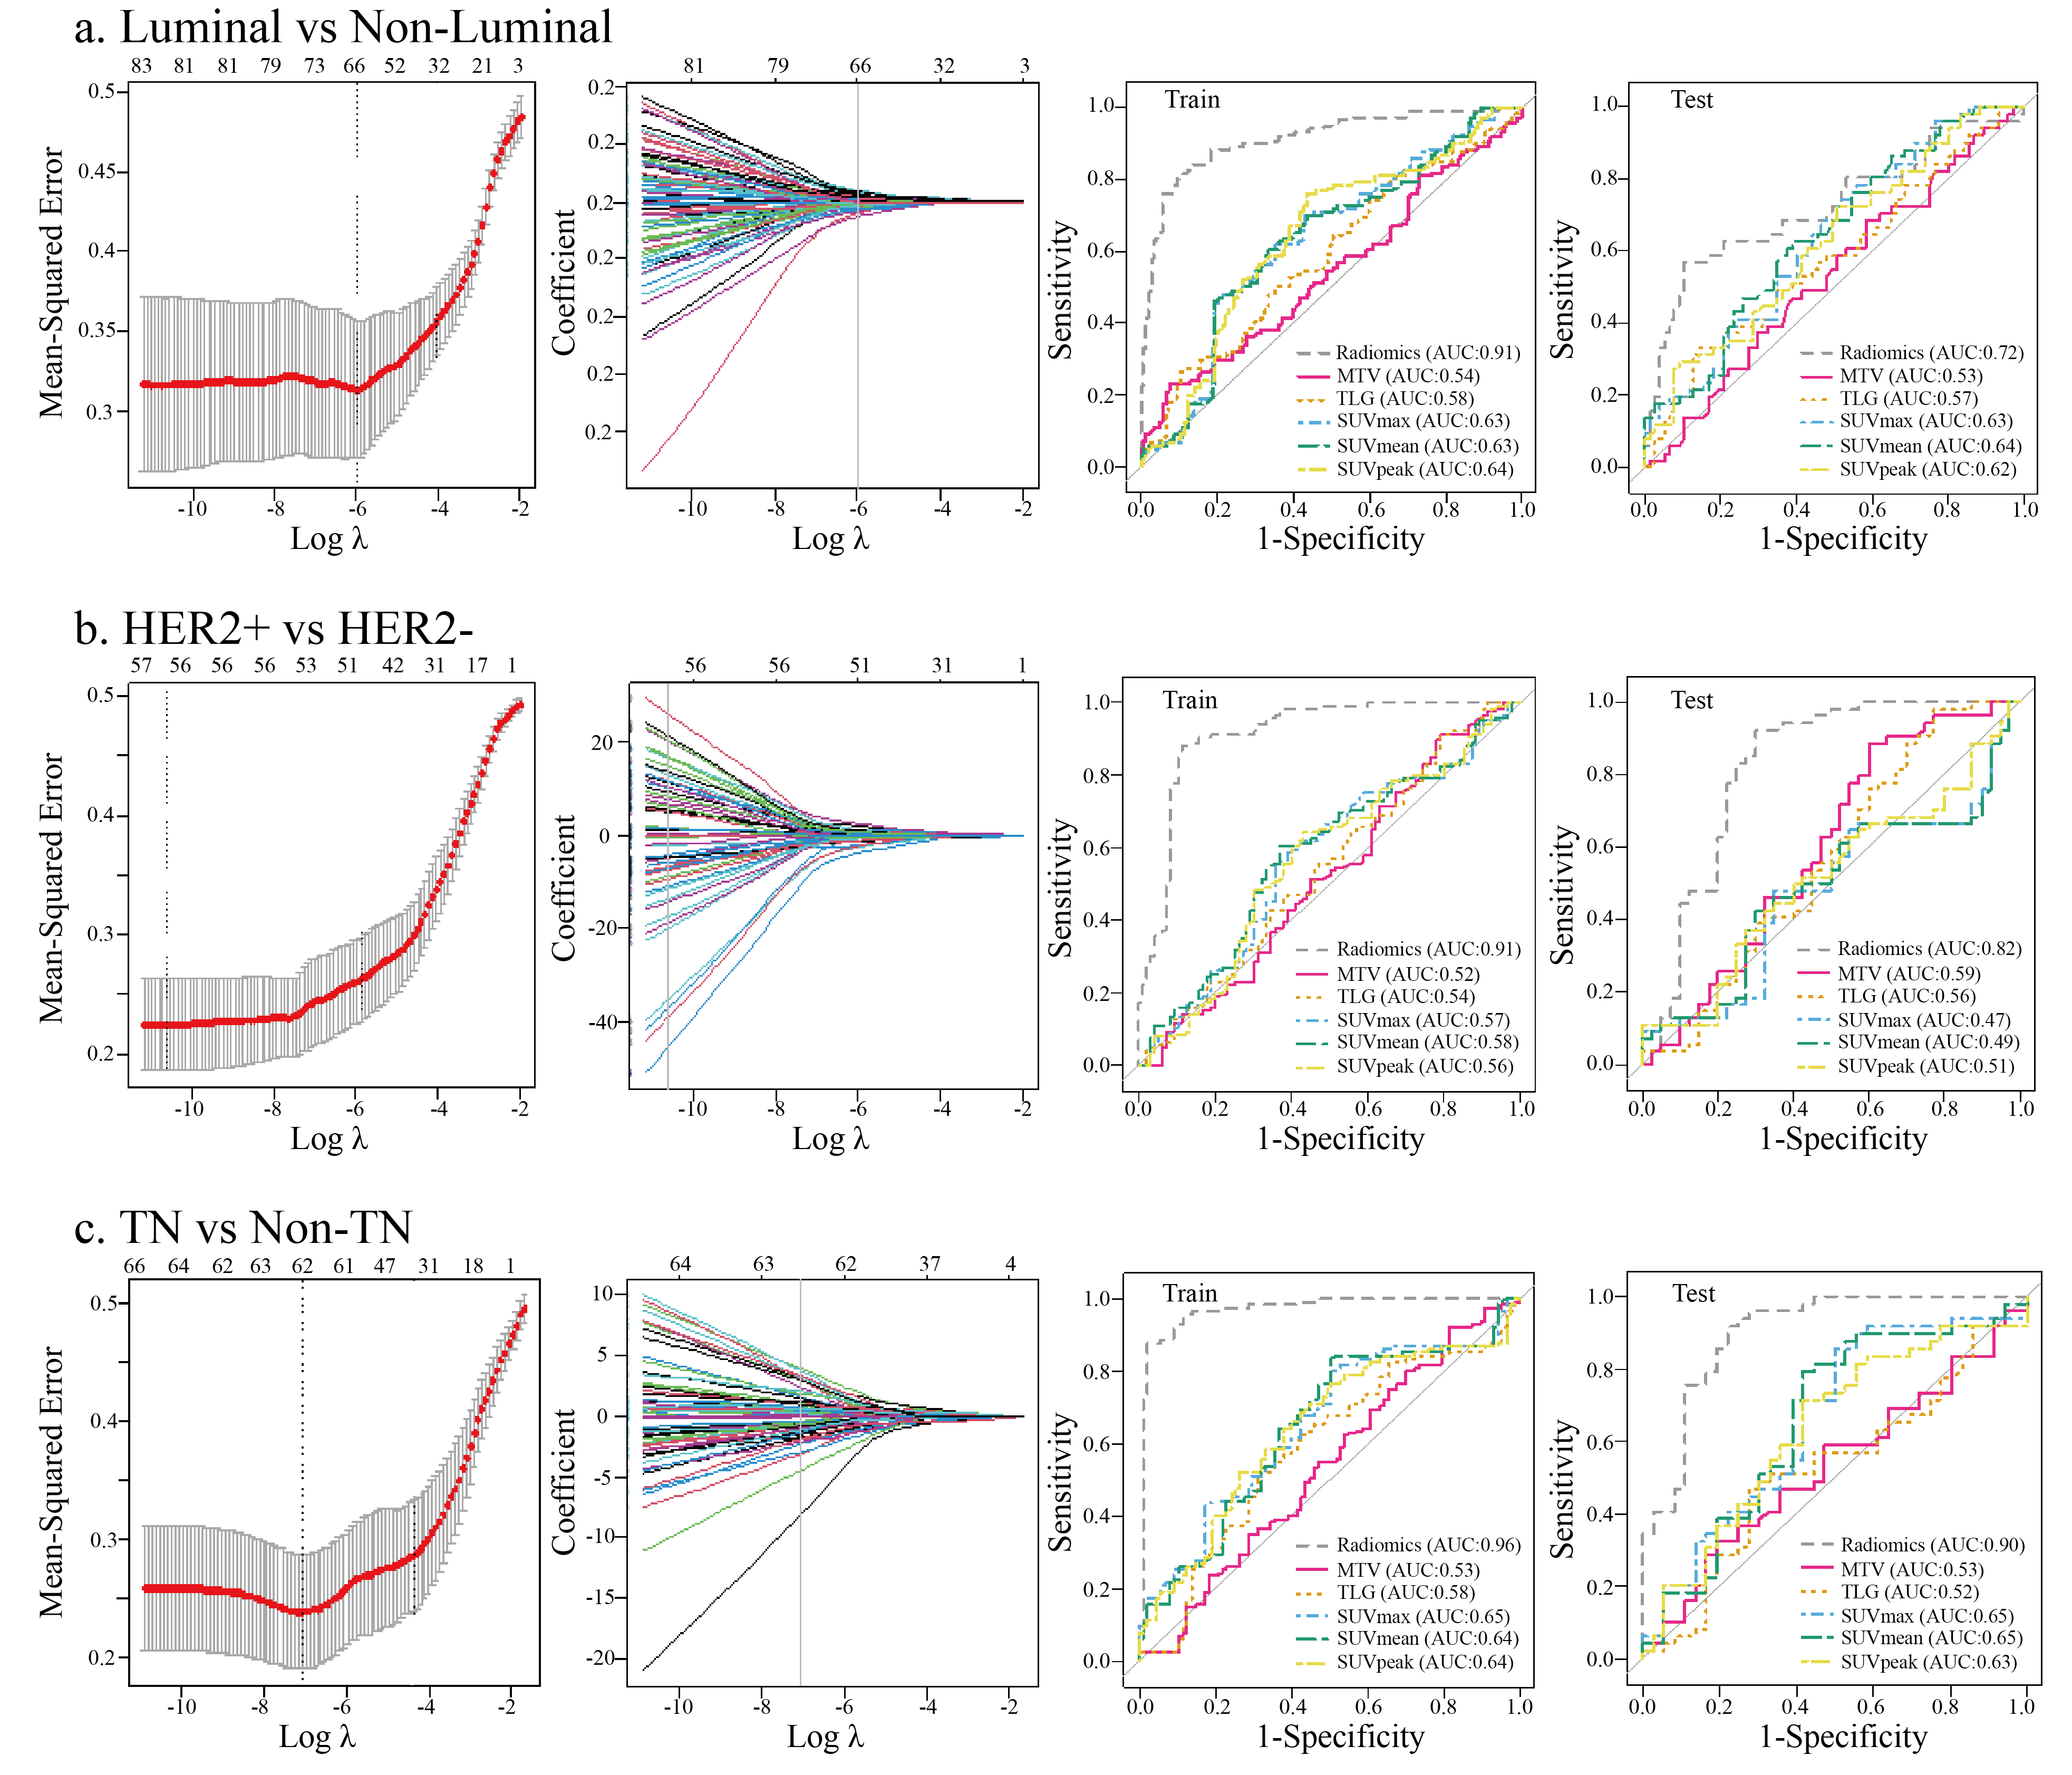 Fig. 2.
The predictive power of established PET/CT derived multivariate
radiomic signature models in molecular subtypes classification of BC. The LASSO
algorithm and 10-fold cross-validation were used to extract the optimal subsets
of PET/CT derived radiomic features for molecular subtypes classification of BC,
including Luminal vs. Non-luminal (a), HER2+ vs. HER2– (b), TN vs. Non-TN (c).
In the first column, the dash lines represented the optimal
In consideration of the aforementioned relatively small sample size in this investigation, a 10-fold cross validation with 10 times repetition was used to calculate the average performance of each of these three established radiomic signature models in each molecular subtypes classification, including Luminal vs. Non-Luminal, HER+ vs. HER2– and TN vs. Non-TN. As demonstrated in Fig. 3, each of these three developed radiomic signature models based on PET/CT images correspondingly exhibited a strong predictive power in each molecular subtype classification of BC, with a mean value of 0.856, 0.818 and 0.888 for AUC, a mean value of 0.864, 0.847 and 0.893 for accuracy, a mean value of 0.801, 0.908 and 0.933 for sensitivity and a mean value of 0.905, 0.764 and 0.839 for specificity. These results described above significantly suggest the stability of the outperformance of established radiomic signature models in molecular subtype classification of BC.
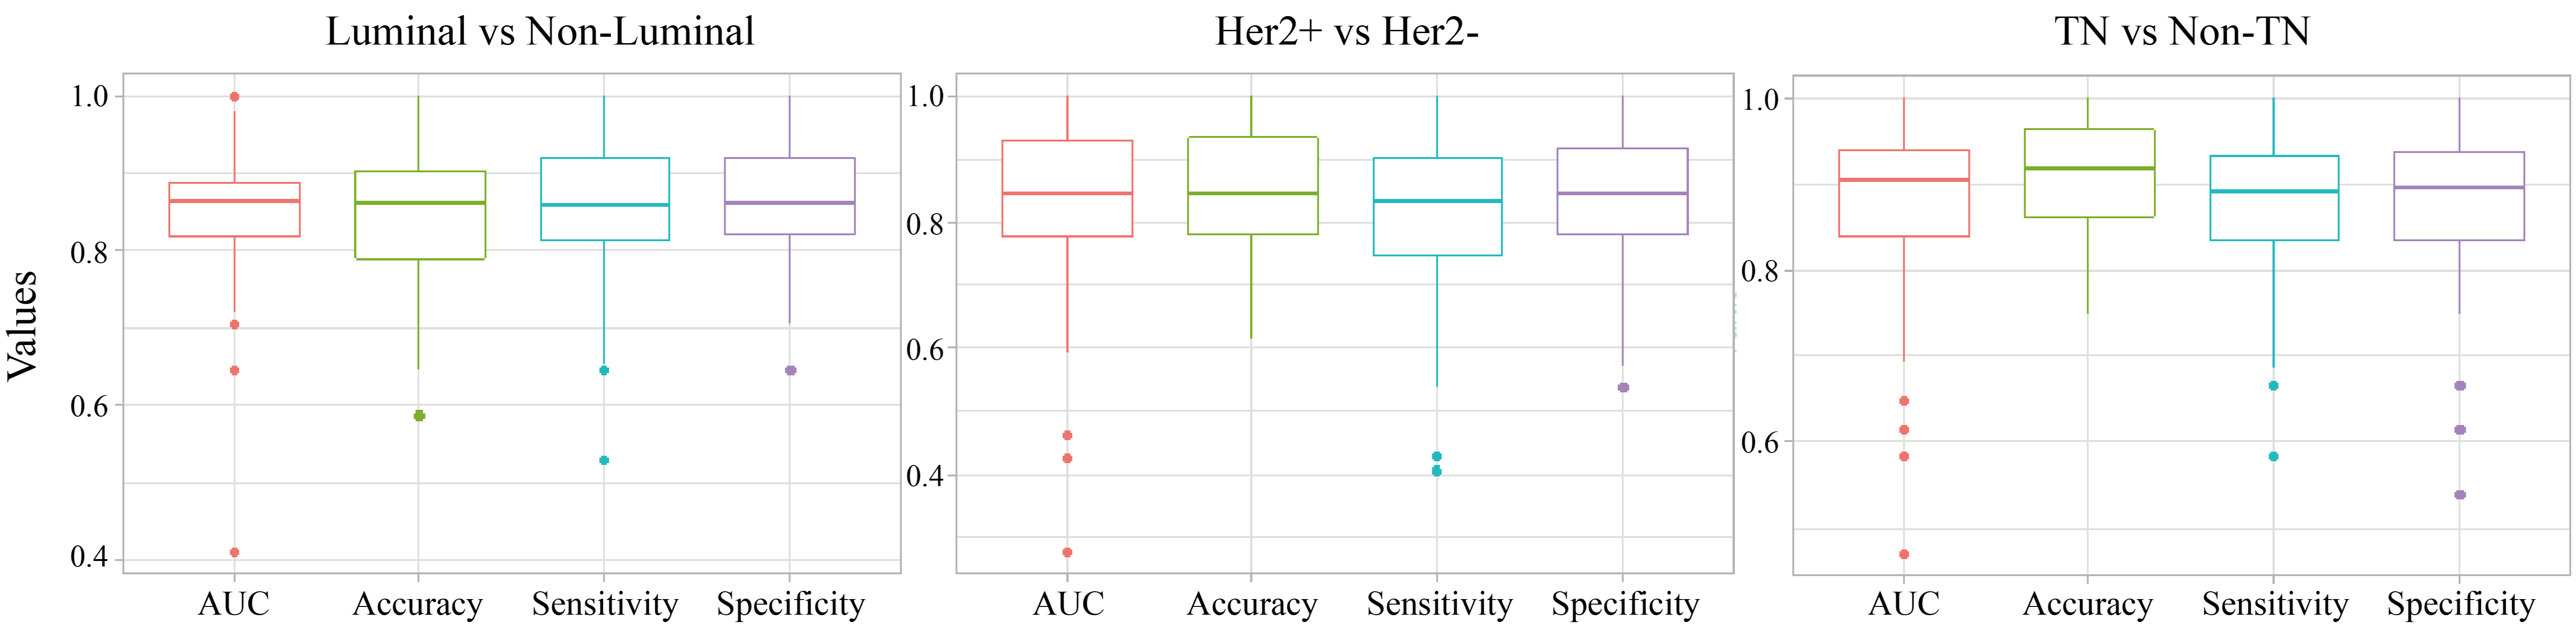 Fig. 3.
The distribution of AUC, accuracy, sensitivity and specificity of the established radiomic signature models in molecular subtypes classification of BC in the 10-fold cross validation. The thick lines represent the median of performance indicators. The median AUC, accuracy, sensitivity and specificity were used to describe the predictive power of each established radiomic models in each molecular subtype classification of BC, including including Luminal vs. Non-Luminal (left), HER2 + vs. HER2 - (middle), TN vs. Non-TN (right).
Results with respect to correlation between molecular subtypes of BC and
imaging-derived parameters had been published previously [12, 13, 14, 15].
Especially, texture feature quantification and analyses based on medical images
are of increasing interest to a large number of investigators addressing the
interaction between quantitative imaging radiomic features and tumor molecular
profiling [4, 16]. Moreover, considering breast cancer is a heterogeneous class of
tumor, radiomic analyses aiming at elucidating the tumor heterogeneity reflected
in medical images would enable an accurate prediction of tumor biological
characteristics and genetic profiling. The primary objective of this current
study was to evaluate the potential of
Expectedly, established multivariate radiomic signature models as shown in Supplementary Fig. 1 remarkably outperformed all the significant SUV parameters in discrimination between different molecular subtypes of BC. In comparison with previous literature with regard to the association between radiomic features based on PET images alone and molecular subtypes of BC [4, 21, 22], our current investigation had a larger sample size and performed a comprehensive radiomic analysis involving both PET-based and CT based radiomic features. Particularly in contrast with results from ZY Yang et al. [21], which only focused on the discrimination between ER+ and ER–, our study consist of analysis with regard to Luminal vs. Non-Luminal, HER2+ vs. HER2– and TN vs. non-TN. In this context, the results listed in our investigation would provide an essentially complementary information about PET/CT derived radiomic analyses in molecular characterization of BC. Moreover, because selecting individual radiographic parameters which were not remarkably correlated to each other could provide added information but not overlapping messages with respect to various aspects of tumor lesion heterogeneity, multivariate radiomic signature model as presented in Supplementary Fig. 1 but not individual radiomic feature was used in our study to directly evaluate the performance of PET/CT derived radiomics in molecular subtype classification of BC, which was lacking in previous relevant investigations. To some extent, molecular subtype classification is a brilliant method to reflect the heterogeneity in BC and is helpful for personalized medicine of BC patients [2, 3]. For BC patients with HER2 enrichment, a sophisticated intracellular signaling initiated by HER2 activation on the membrane of breast cancer cells leads to an enhanced metabolism and a subsequently aggressive behavior of HER2-enriched breast cancer in contrast with breast cancer without HER2 accumulation [23]. Considering the tumor-promoting action of HER2 in breast cancer, targeted therapies against HER2 were developed and applied to clinical management, namely trastuzumab (Trade name: Herceptin) treatment [24]. To improve the performance of HER2-targeted therapy for BC in clinic and make a dramatic progress in precision medicine, a precise assessment of the target HER2 prior to treatment is essential. As known, HER2 status was most commonly tested via IHC examination, and cases with ambiguous results usually refer to FISH assay. A subgroup radiomic analysis focusing on a cohort of BC patients who underwent a FISH assay to finally identify HER2 status because of their equivocal IHC results of HER2 status is planed in our future study. The abilities of PET/CT derived radiomic signature models to discriminate molecular subtypes of BC suggest an underlined molecular profile-involving mechanism for heterogeneity reflected by PET/CT derived radiomic features [6]. Even though BC patients could benefit from current molecular subtype classification to guide their clinical management, such as treatment options, outcome prediction and survival prognosis, more and more investigation have discovered heterogeneity existed in the same molecular subtype of BC within individuals and between individuals. The existed heterogeneity in sensitivities to some targeted therapies and neoadjuvant treatment for BC patients with the same molecular subtype and the development of acquired treatment resistance prompt us to further determine the performance of radiomic signature model based on PET/CT images in these concerning issues, which is what we strive to do in near future.
The ultimate goal of accurate molecular subtype classification for BC patients is to individualise therapy and achieve precision medicine. Multidisciplinary therapeutic approaches, including hormone therapy, HER2-targeted therapy, chemotherapy and radiotherapy are precisely chosen for BC patients based on molecular profile determination. Radiomics and artificial intelligence development have not only shed light on molecular subtype profiling, but also for other various aspect of clinical practice for BC patients, such as diagnosis, treatment response prediction and survival prognosis [25]. Especially for neoadjuvant radiotherapy or chemoradiotherapy, radiomics and artificial intelligence have exhibited a potential for clinical translation in tailed treatment prediction [26, 27, 28]. With respect to BC patients, radiological image derived artificial intelligence-based decision supporting system for radiotherapy would be beneficial to patient consultation, target volume delineation, automated treatment planning, treatment delivery and response evaluation and prediction [29]. Furthermore, an enhanced prediction of neoadjuvant chemoradiotherapy response by using PET/CT radiomic models with an addition of HER2 information suggested that accurate HER2 status determination based on radiomics would be remarkably helpful to comprehensive treatment strategy involving radiotherapy and targeted therapy [28].
Despite those encouraging results depicted in this study, several limitations existed in this current work. First, given the relatively small sample size in this radiomic analysis, further investigation involving a larger number of cases is warranted to confirm the results obtained in the study. Second, the varieties in acquisition, reconstruction and delineation settings maybe affect the repeatability of radiomic analyses due to the retrospective nature of this study. A prospective, multicenter research with a standardization and optimization for these settings is needed to overcome these drawbacks. Then, a relatively limited spatial resolution of PET may result in an unsatisfactory performance of PET related radiomics in breast cancer, in particular for patients with small lesion. In addition, this study only focused on primary breast cancer lesions but not on metastatic lesions, therefore a further investigation involving both primary and metastatic lesions is required to complete this study [30]. Last but not least, to comprehensively determine the phenotype-genotype interaction, radiomic analyses based on not only a binary-classification but also on a multi-classification for molecular subtype clustering of BC should be included, which is exactly what we aim to do in future.
Taken together, distinct imaging phenotypes driven by different molecular
profiling of BC may be captured in
JL, HB and YZ contributed equally and are co-first authors; JL and HB designed experiments; JL, HB and YZ performed experiments; JL, HB, YZ and XL wrote the manuscript; GY, YG and ZW analyzed data; YG synthesized and interpreted the results. XL, WM and WX supervised the study and made manuscript revisions. All authors gave final approval of the version to be published and have agreed on the submitted journal. And all authors agreed to be accountable for all aspects of the work.
All procedures performed in studies involving human participants were in accordance with the declaration of Helsinki and relevant approved guidelines and approved by the Ethical Review Committee of Tianjin Medical University Cancer Institute and Hospital, and the ethical approval code is Ek2018125. Written informed consent from all patients was waived in the present investigation.
We would like to thank all the study participants, research staff, and students who participated in this work. In addition, we are really appreciated for the invaluable comments on this study from all the reviewers.
This work was supported by grants from the National Natural Science Foundation of China (grant nos. 81801781, 82072004, 2018ZX09201015), the Tianjin Science and Technology Committee Fund (grant nos. 18PTZWHZ00100 and H2018206600), the Science & Technology Development Fund of Tianjin Education Commission for Higher Education (grant nos. 2018KJ057 and 2018KJ061).
The authors declare no conflict of interest.
Supplementary material associated with this article can be found, in the online version, at https://www.fbscience.com/Landmark/articles/10.52586/4960.
AUC, area under the curve; BC, breast cancer;