


 , Jianping Jiang 1,*
1 Chengdu Institute of Biology, Chinese Academy of Sciences, 610041 Chengdu, Sichuan, China
2 Section on Molecular Morphogenesis, Eunice Kennedy Shriver National Institute of Child Health and Human Development (NICHD), National Institutes of Health (NIH), Bethesda, Maryland, MD 20892, USA
Abstract
Introduction: Tadpole tail develops from the tailbud, an apparently
homogenous mass of cells at the posterior of the embryo. While much progress has
been made in understanding the origin and the induction of the tailbud, the
subsequent outgrowth and differentiation have received much less attention,
particularly with regard to global gene expression changes. Methods: By
using RNA-seq with SMRT and further analyses, we report the transcriptome
profiles at four key stages of tail development, from a small tailbud to the
onset of feeding (S18, S19, S21 and S28) in Microhyla fissipes, an
anuran with a number of advantages for developmental and genetic studies.
Results: We obtained 48,826
transcripts and discovered 8807 differentially expressed transcripts (DETs, q
Keywords
- SMRT sequencing
- RNA-Seq
- Regeneration
- Tail development
- Microhyla fissipes
The tadpole tail is a larva-specific organ, which is twice as long as the body. It forms at the early embryonic stages and is lost at the climax of metamorphosis in anurans [1, 2]. The tail is anatomically defined by its position from posterior to the anal opening, a continuation of the structures of the main body axis, which is well patterned and contains many axial and paraxial tissues, including epidermis, connective tissue (dermis), spinal cord, notochord, dorsal aorta, and skeletal muscle [3, 4]. It has a number of functions at larval stages, such as swimming, balance, fat storage, and predator escape via autotomy [3].
There are two phases in tail development, tailbud determination and tailbud outgrowth. Studies in Xenopus laevis have shown that the tailbud is first formed at the end of gastrulation, and then commences to outgrowth at the tailbud stage [4, 5]. The molecular NMC model (N, the neural plate to anterior to M; M, tail somite; C, caudal notochord) has been proposed to explain tailbud induction [6]. In addition, various genes, such as Xlim1, Xbro, Xcad3, Xpo, BMP4, Tbx6 and Gdf11, and signaling pathways including the Wnt, BMP, and Notch pathways, have been analyzed and shown to be regulated and/or involved in tailbud induction [3, 6]. However, no studies have employed systematic, high-throughput sequencing technologies, such as RNA-Seq and single molecule long-read sequencing (SMRT sequencing), for global analyses of gene expression changes and tail development.
In an earlier study [7], we took advantages of SMRT sequencing and RNA-Seq methods to generate a full length and high-quality reference transcriptome and analyzed the global gene expression changes associated with tail resorption during the metamorphosis of Microhyla fissipes, an anuran with a number of advantages for developmental and genetic studies, such as transparent tadpoles and fast development [8, 9]. Here, we have used the same approach to investigate the global gene regulation profiles involved in the initial formation of the tail during embryogenesis in Microhyla fissipes. We have obtained 48,826 transcripts and identified 8807 differentially expressed transcripts (DETs). These DETs are further analyzed with regard to enriched Gene Ontology (GO) and Kyoto Encyclopedia of Genes and Genomes (KEGG) pathways, revealing 110 significantly enriched GO categories and 6 significantly enriched KEGG pathways that are highly correlated with the developmental changes in the tail. Our results provide a global overview of gene expression patterns and new insights into the possible mechanism involved in tail development of frogs.
Microhyla fissipes breeding adults were collected from Shuangliu,
Chengdu, China (30.5825
Tadpoles at stage 18 (S18), S19, S21, and S28 were randomly collected and
anesthetized in 0.01% MS222 for tail morphology observation. For gene expression
analysis, three biological replicates, each containing 10–30 animal tails, were
used for RNA-seq at each developmental stage. To maximize the discovery of
M. fissipes gene pools, heart, liver, spleen, lung, kidney, skin, ovary,
testis from adult M. fissipes, tails (at S38, S40, S41, S43) and dorsal
muscle (at S36, S40, S43, S45) were dissected for SMRT sequencing. All dissected
tissue samples were immediately frozen in liquid nitrogen and stored at –80
The detailed method for RNA-Seq and SMRT sequencing, and functional annotation of transcripts were described previously [7]. All raw data from Illumina sequencing have been deposited in the NCBI Short Read Archive (SRA) database with the accession number PRJNA504611.
To compare the transcript levels in the tail among the four developmental stages, FPKM (fragments per kilobase of exon model per million mapped reads) was used to evaluate the transcript levels among the four stages. Then, we used DESeq R package (1.10.1) which is available at https://www.huber.embl.de/users/anders/DESeq/ to identify DETs. The resulting DETs were subjected to GO and KEGG pathway enrichment analyses. The details for these analyses were as reported before [7].
We studied two phases of tail development: tailbud determination and tailbud outgrowth, in M. fissipes (Fig. 1, Ref. [9]). Tailbud determination from S18 (neural tube) to S19 (elongated tailbud) is defined by tailbud elongation while tailbud outgrowth refers to stages from S19 to S28, when a functional tail is formed [5]. At S21, tail fin and medial cloacal tail piece were distinct and the tail starts to outgrow. S28 is the end of embryogenesis, when the tadpole swims freely and start to feed, while at S18–S21, the tadpoles hardly move. Tail development is a fast process in M. fissipes, needing only 15 hours from fertilization to neural tube (tail determination) and 3.5 days to the end of embryogenesis (S28). At each sampling stage, the tailbud was cut from posterior to cloaca as indicated by the red dash line in Fig. 1 and used for RNA isolation.
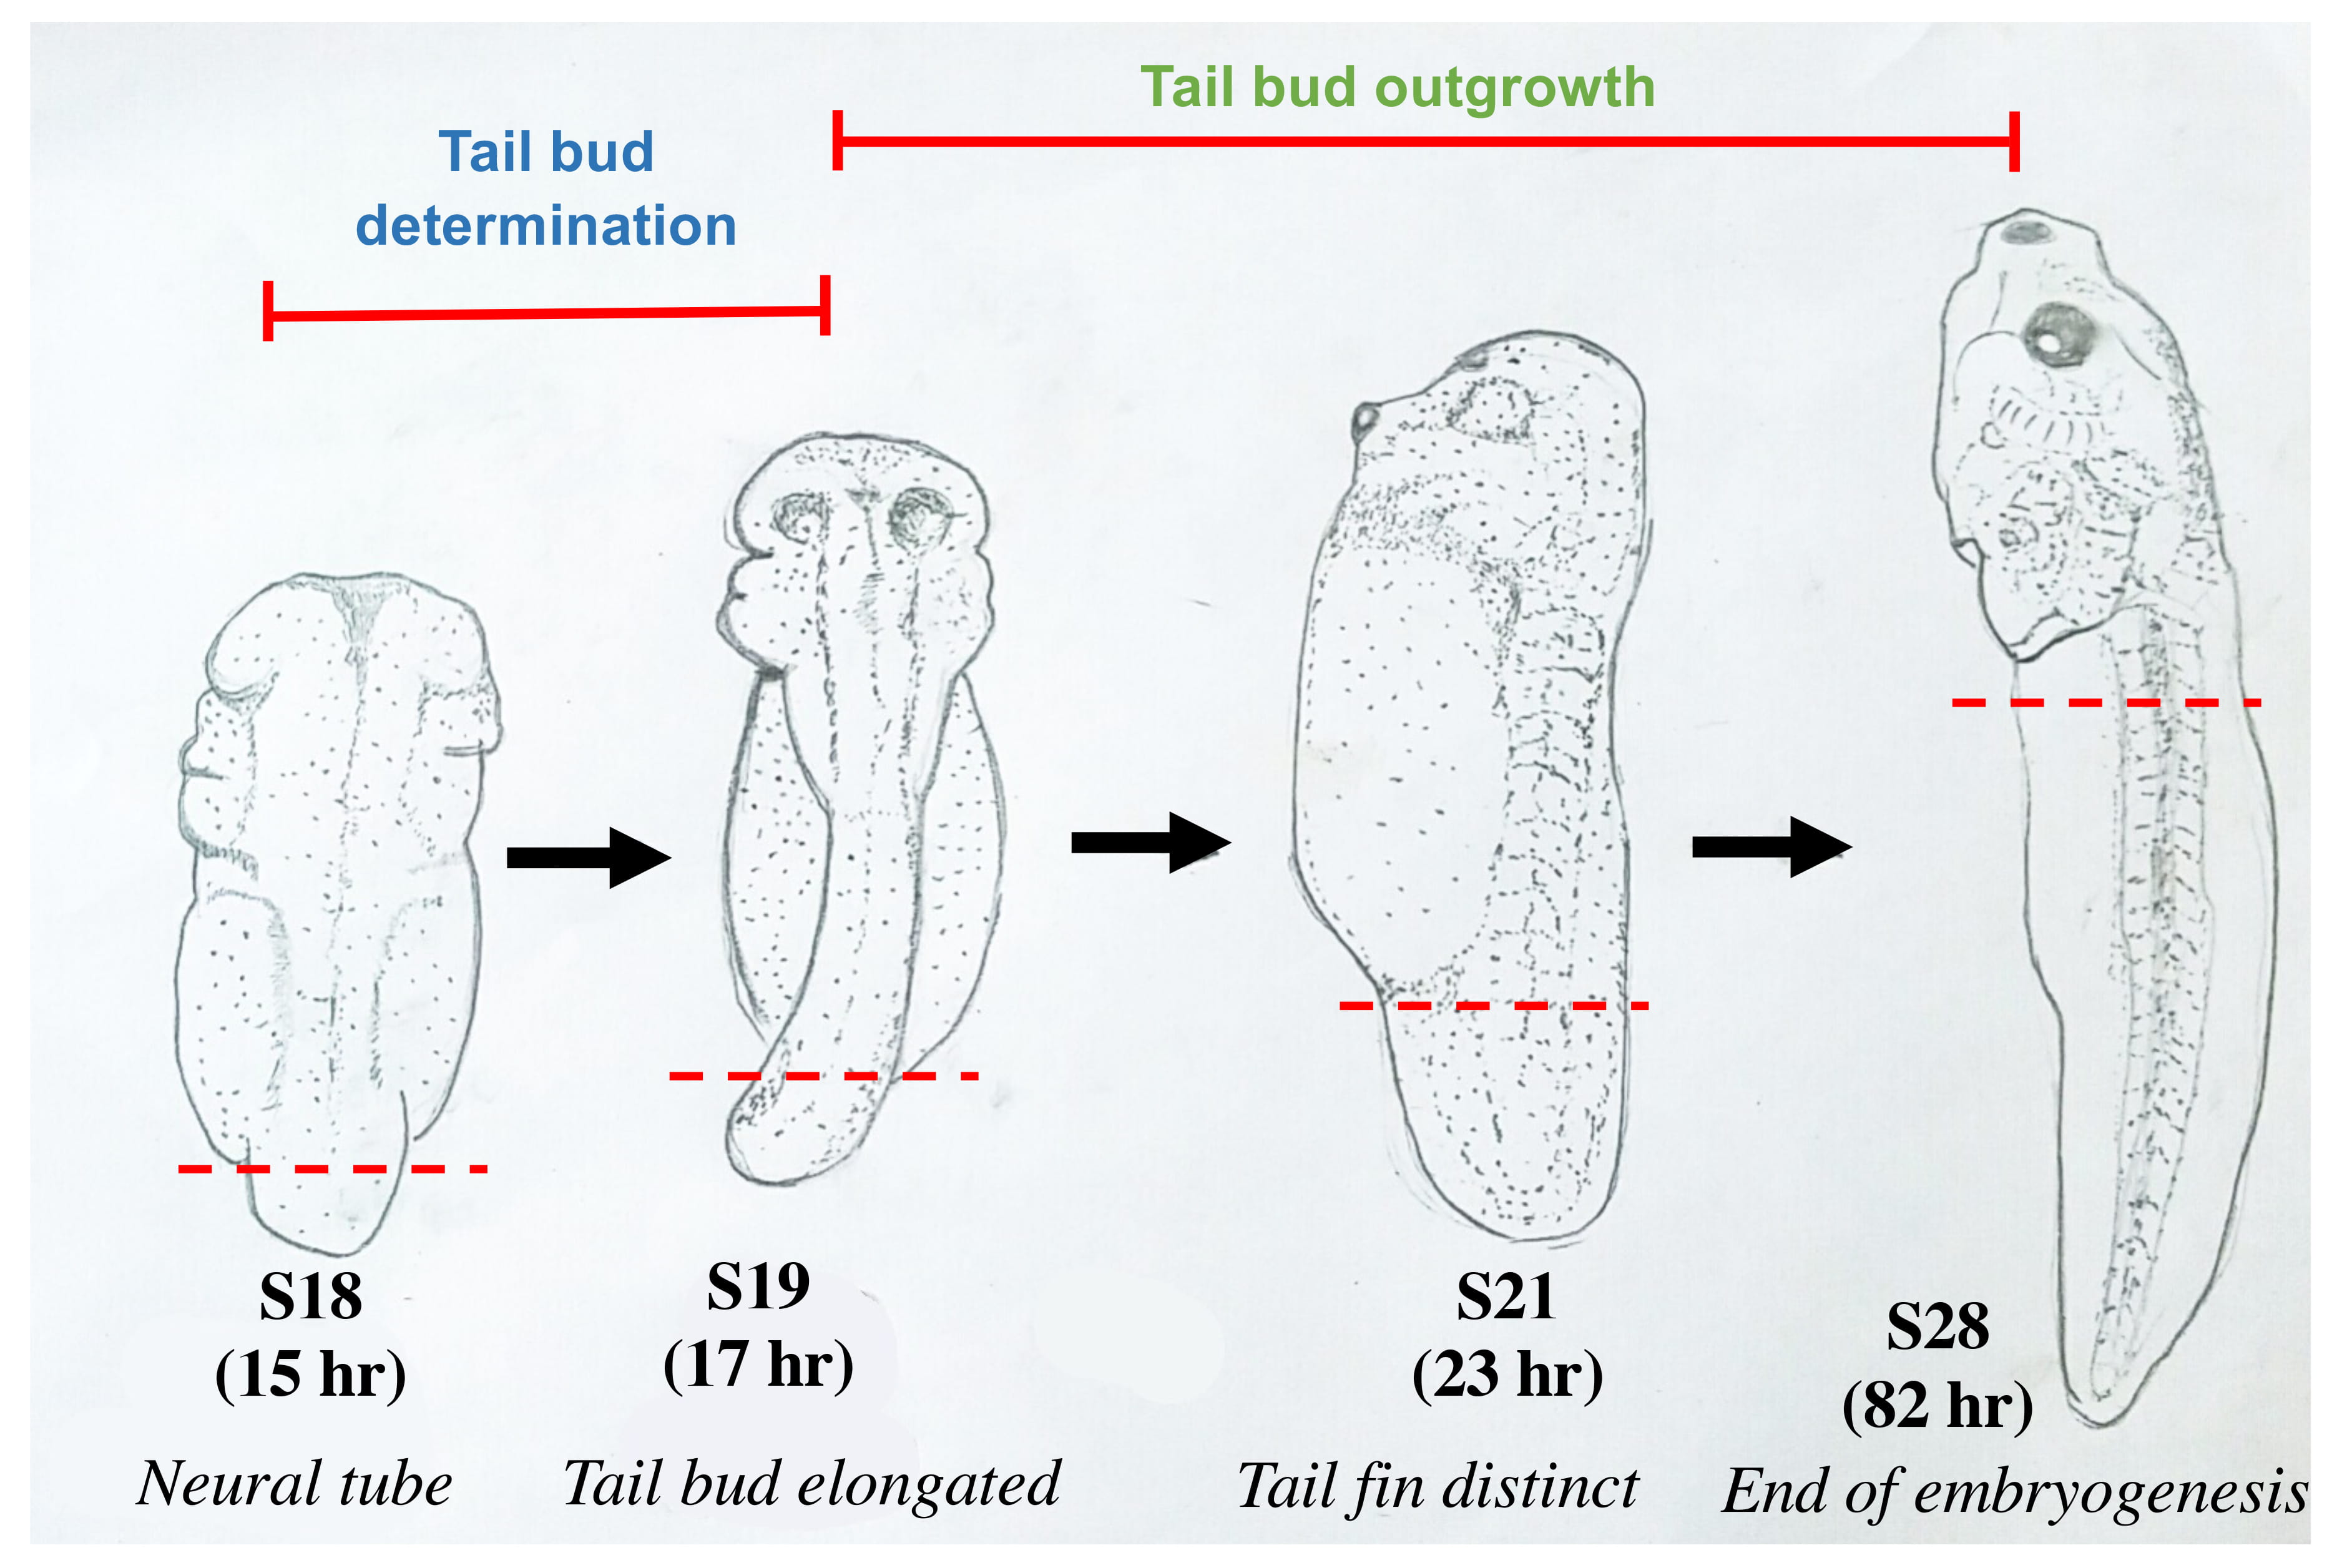 Fig. 1.
Morphological changes associated with tail development of M. fissipes embryos/tadpoles at different stages used in our study. S18: the neural tube stage when tail bud is small but visible; S19: tail bud I; S21: tail bud III when tail fin and medial cloacal tail piece are distinct; S28: end of embryogenesis and onset of feeding (see more detail at [9]). Red dashed line marks the point of dissection for tissue isolation. The time (hr) from fertilization to each of the four stages are also indicated.
Total RNA used for SMRT sequencing was isolated from heart, liver, spleen, lung,
kidney, skin, ovary, and testis from two adults M. fissipes as well as
from tadpole tail including at four stages (S38, S40, S41, S43) and tadpole
dorsal muscle at three stages (S36, S43, S45). The RNA was sequenced on a PacBio
RSII platform. All high-quality short reads from the RNA-Seq from the tadpole
tails at eight developmental stages (S18, S19, S21, S28, S39, S40, S41, S43) were
used to error-correct the SMRT sequences as previously described [7] and analyzed
by using the Proovread correction software [10]. We found that
de
novo transcripts in the 200–500 bp range account for the most, 60.11%
(360,893) of the total reads (Table 1) while only 0.22% (149) of that in
SMRT sequencing data [7]. However, 30.78% of
full-length transcripts had the length
| Index | Illumina RNA-Seq | Database | Annotation number of RNA-Seq (Annotation rate) |
| Total Nucleotides | 374444178 | NR | 132414 (22.05%) |
| All Unigenes | 600432 | NT | 82804 (13.79%) |
| Length (200–500 bp) | 360893 | KEGG | 46184 (7.69%) |
| Length (500–1k bp) | 157528 | SwissProt | 116599 (19.42%) |
| Length (1k–2k bp) | 58874 | PFAM | 118544 (19.74%) |
| Length ( |
23137 | GO | 121829 (20.29%) |
| Mean length | 624 | KOG | 42249 (7.04%) |
| Max length | 28898 | Annotated in all databases | 15384 (2.56%) |
| N50 | 769 | Annotated in at least one database | 196154 (32.67%) |
Through basic alignments to public databases, in total, 132,414 (22.05%), 82,804 (13.79%), 46,184 (7.69%), 116,599 (19.42%), 118,544 (19.74%), 121,829 (20.29%) and 42,249 (7.04%) de novo transcripts were annotated in the NR, NT, KEGG, SwissProt, PFAM, GO and KOG databases, respectively (Table 1). However, the annotation rate of de novo transcripts in each database was much lower than that of SMRT transcripts, such as 47,112 (69%) and 41,254 (61%) in the NR and GO, respectively [7]. Totally, there are only 32.67% of de novo transcripts were annotated in at least one database while the annotation rate of full-length transcripts were 78% [7]. These data indicated that transcripts obtained from SMRT sequencing were highly improved compared to de novo RNA-seq data.
In order to identify the gene expression program underlying tail development, we
mapped RNA-Seq clean reads at four indicated stages (S18, S19, S21, S28) to
proofread-corrected reference sequences. Totally 329,650,058 (50.11%) reads were
mapped (Supplementary Table 1). Then, the
expression level was determined by using RSEM software [11].
48,826
expressed transcripts with FPKM
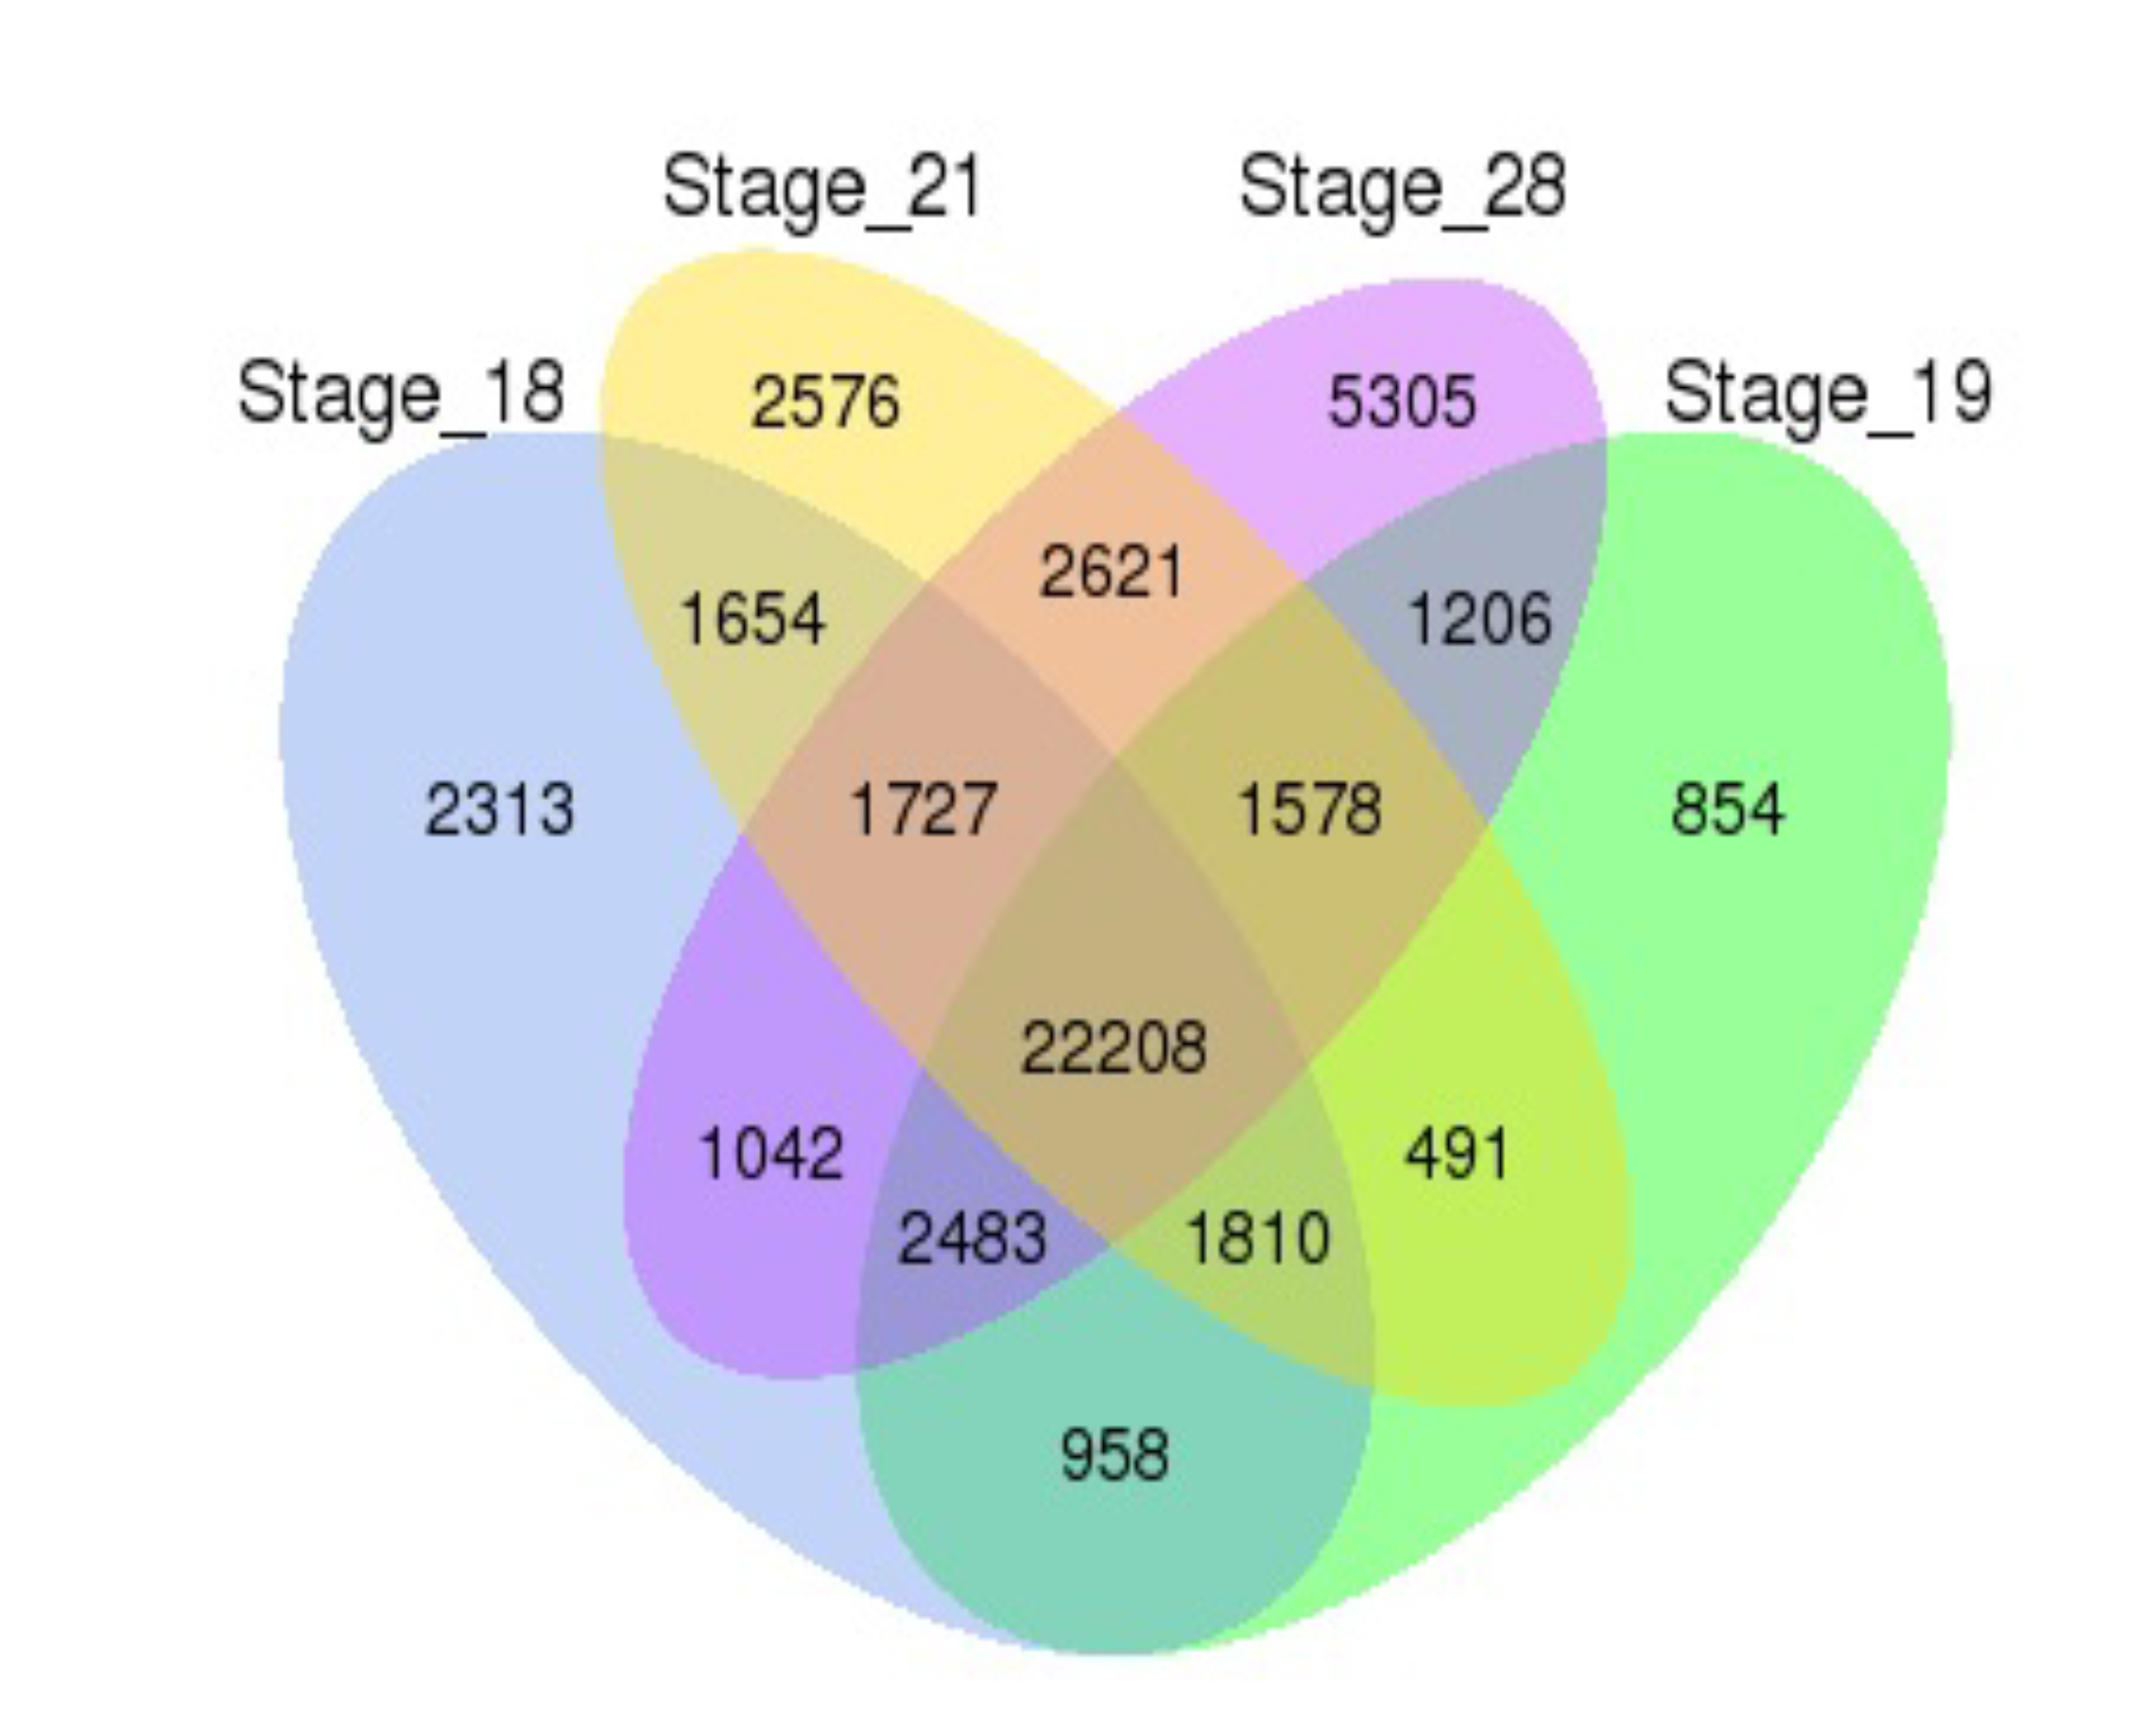 Fig. 2.
Venn diagram analyses reveal stage-specific of gene
expression. Venn diagrams showing the number of expressed transcripts (FPKM
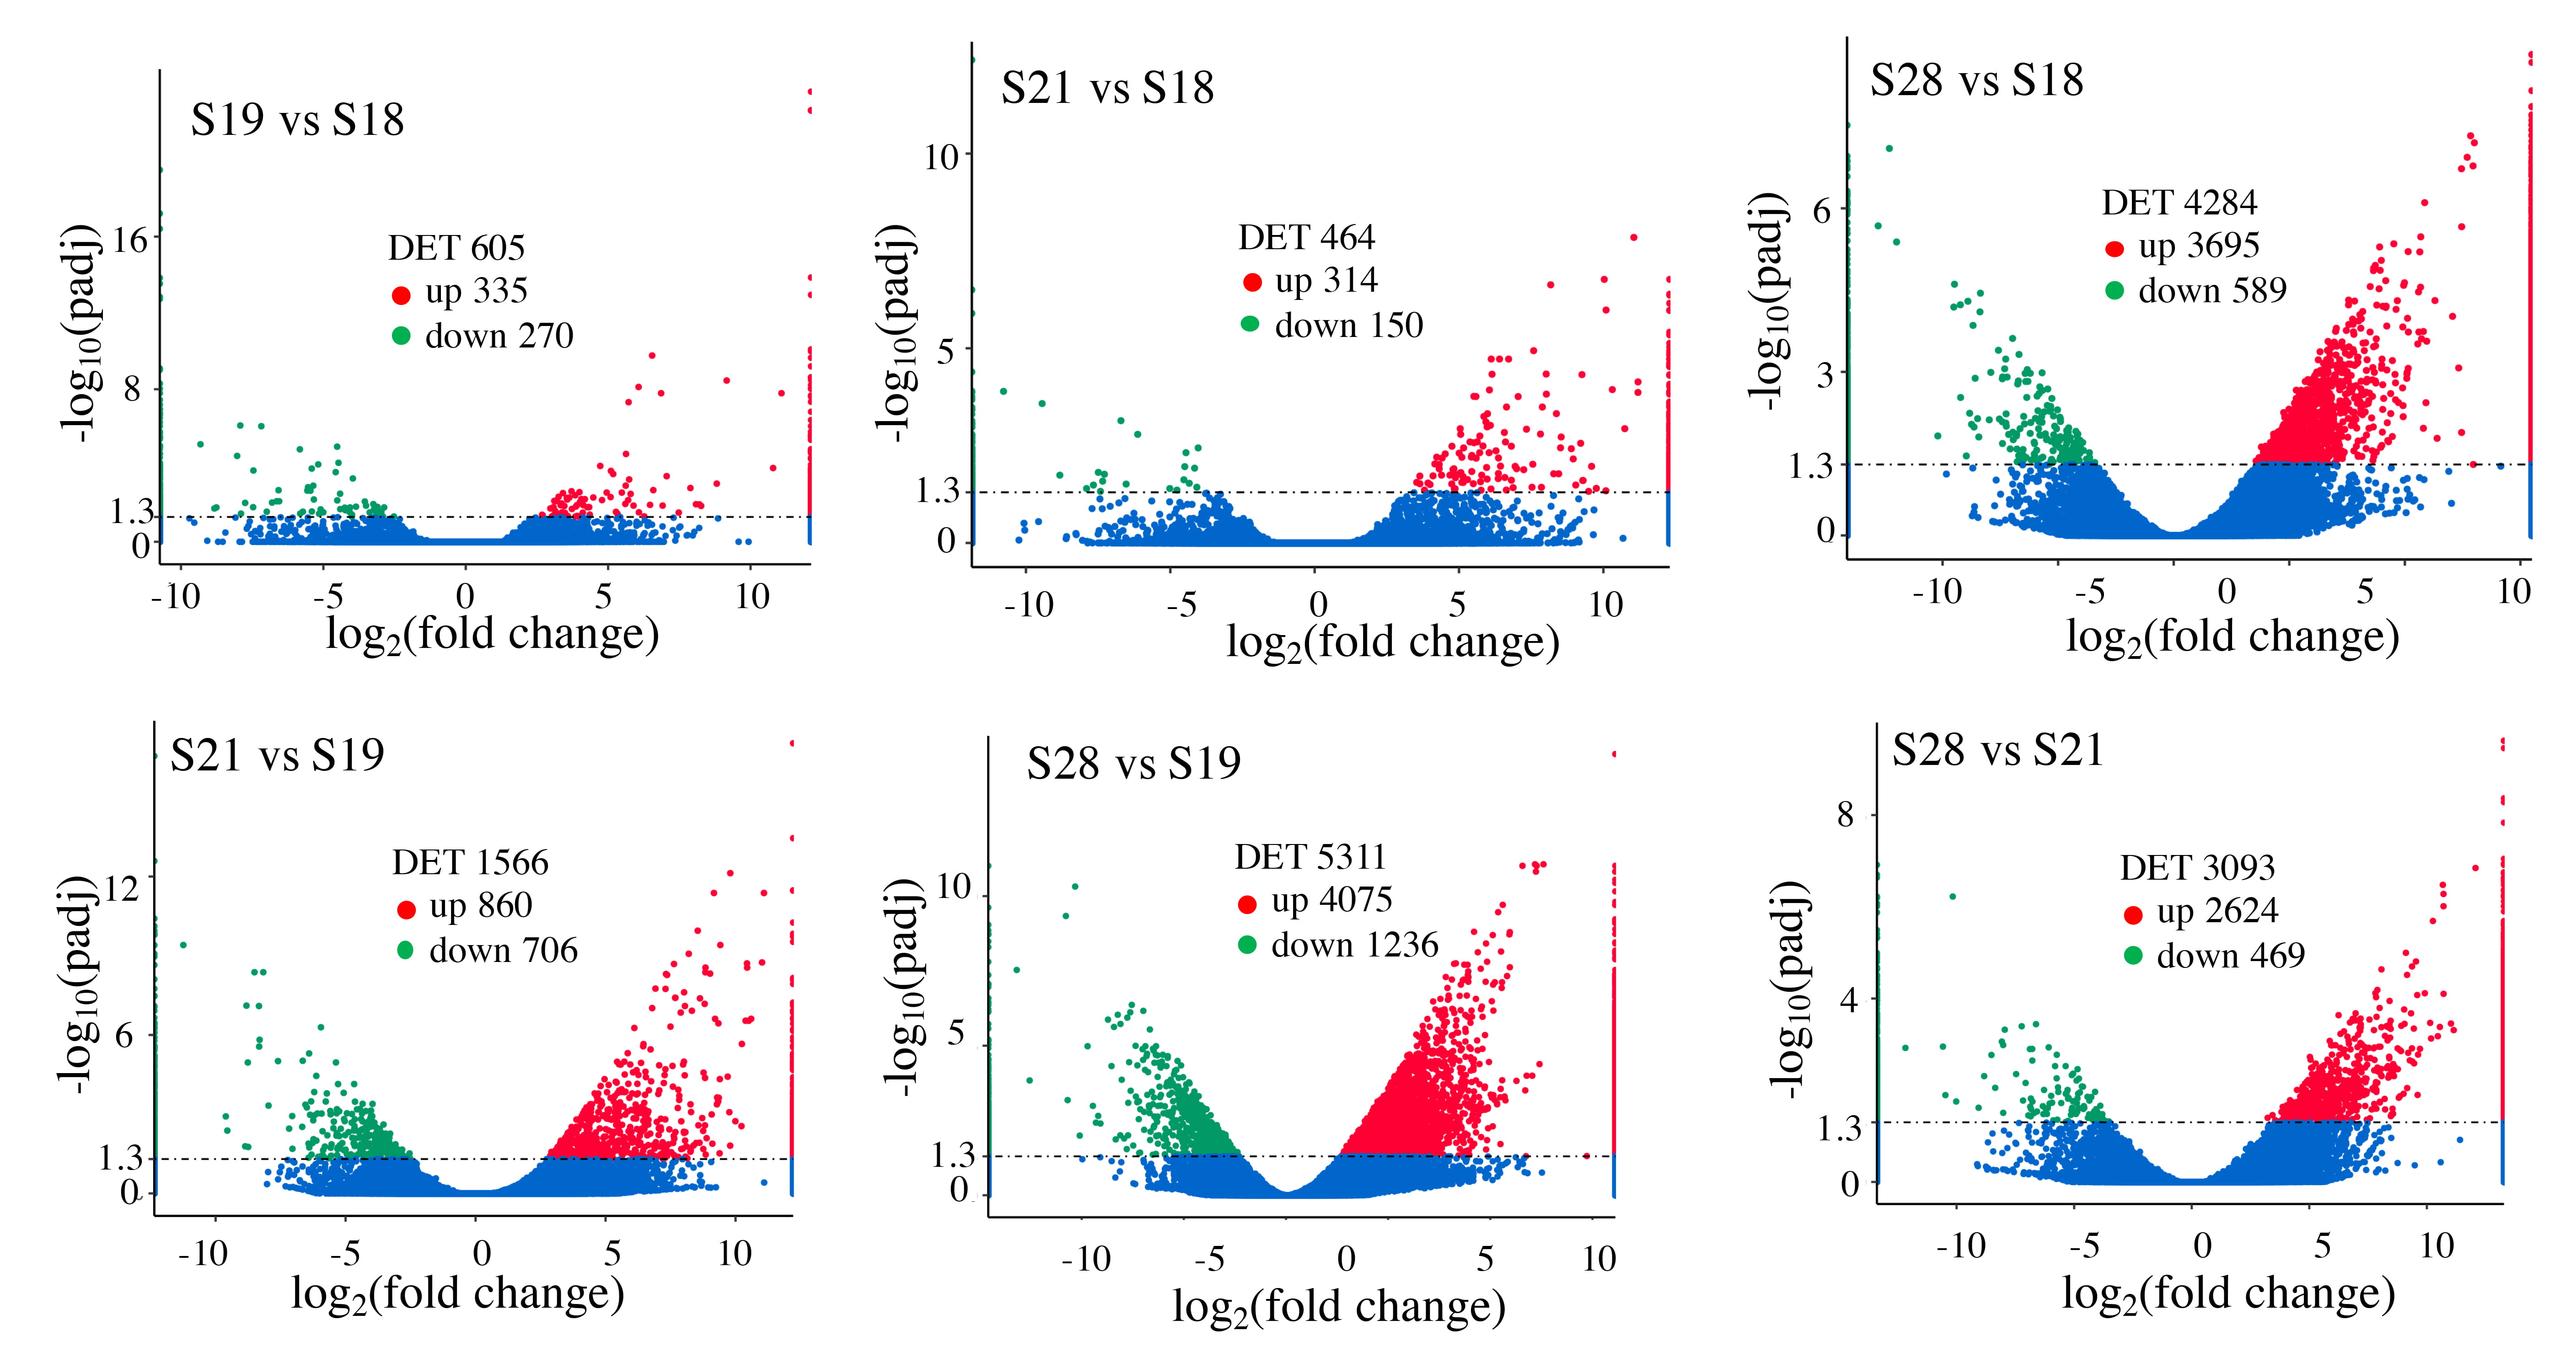 Fig. 3.
Pair-wise comparisons reveal that S28 tail has the
highest numbers of differentially expression transcripts (DETs, q
Hierarchical clustering of totally 8807 DETs were performed and the results were shown in a heatmap of the expression levels of each DET at four stages in Fig. 4. The DETs fell largely into two groups with highest or lowest expression levels at S28, and there were more DETs in the group with the highest expression level at S28 (Fig. 4). Thus, tail maturation at S28 involves more DETs than the other developmental stages and that most of the DETs involved in tail maturations are upregulated by S28. In addition, the tail gene expression patterns at S18, S19, and S21 were very similar to each other, especially between S18 and S19, consistent with the lack of significant morphology changes in the tail between S18 to S19 but drastic changes at S28 (Fig. 1).
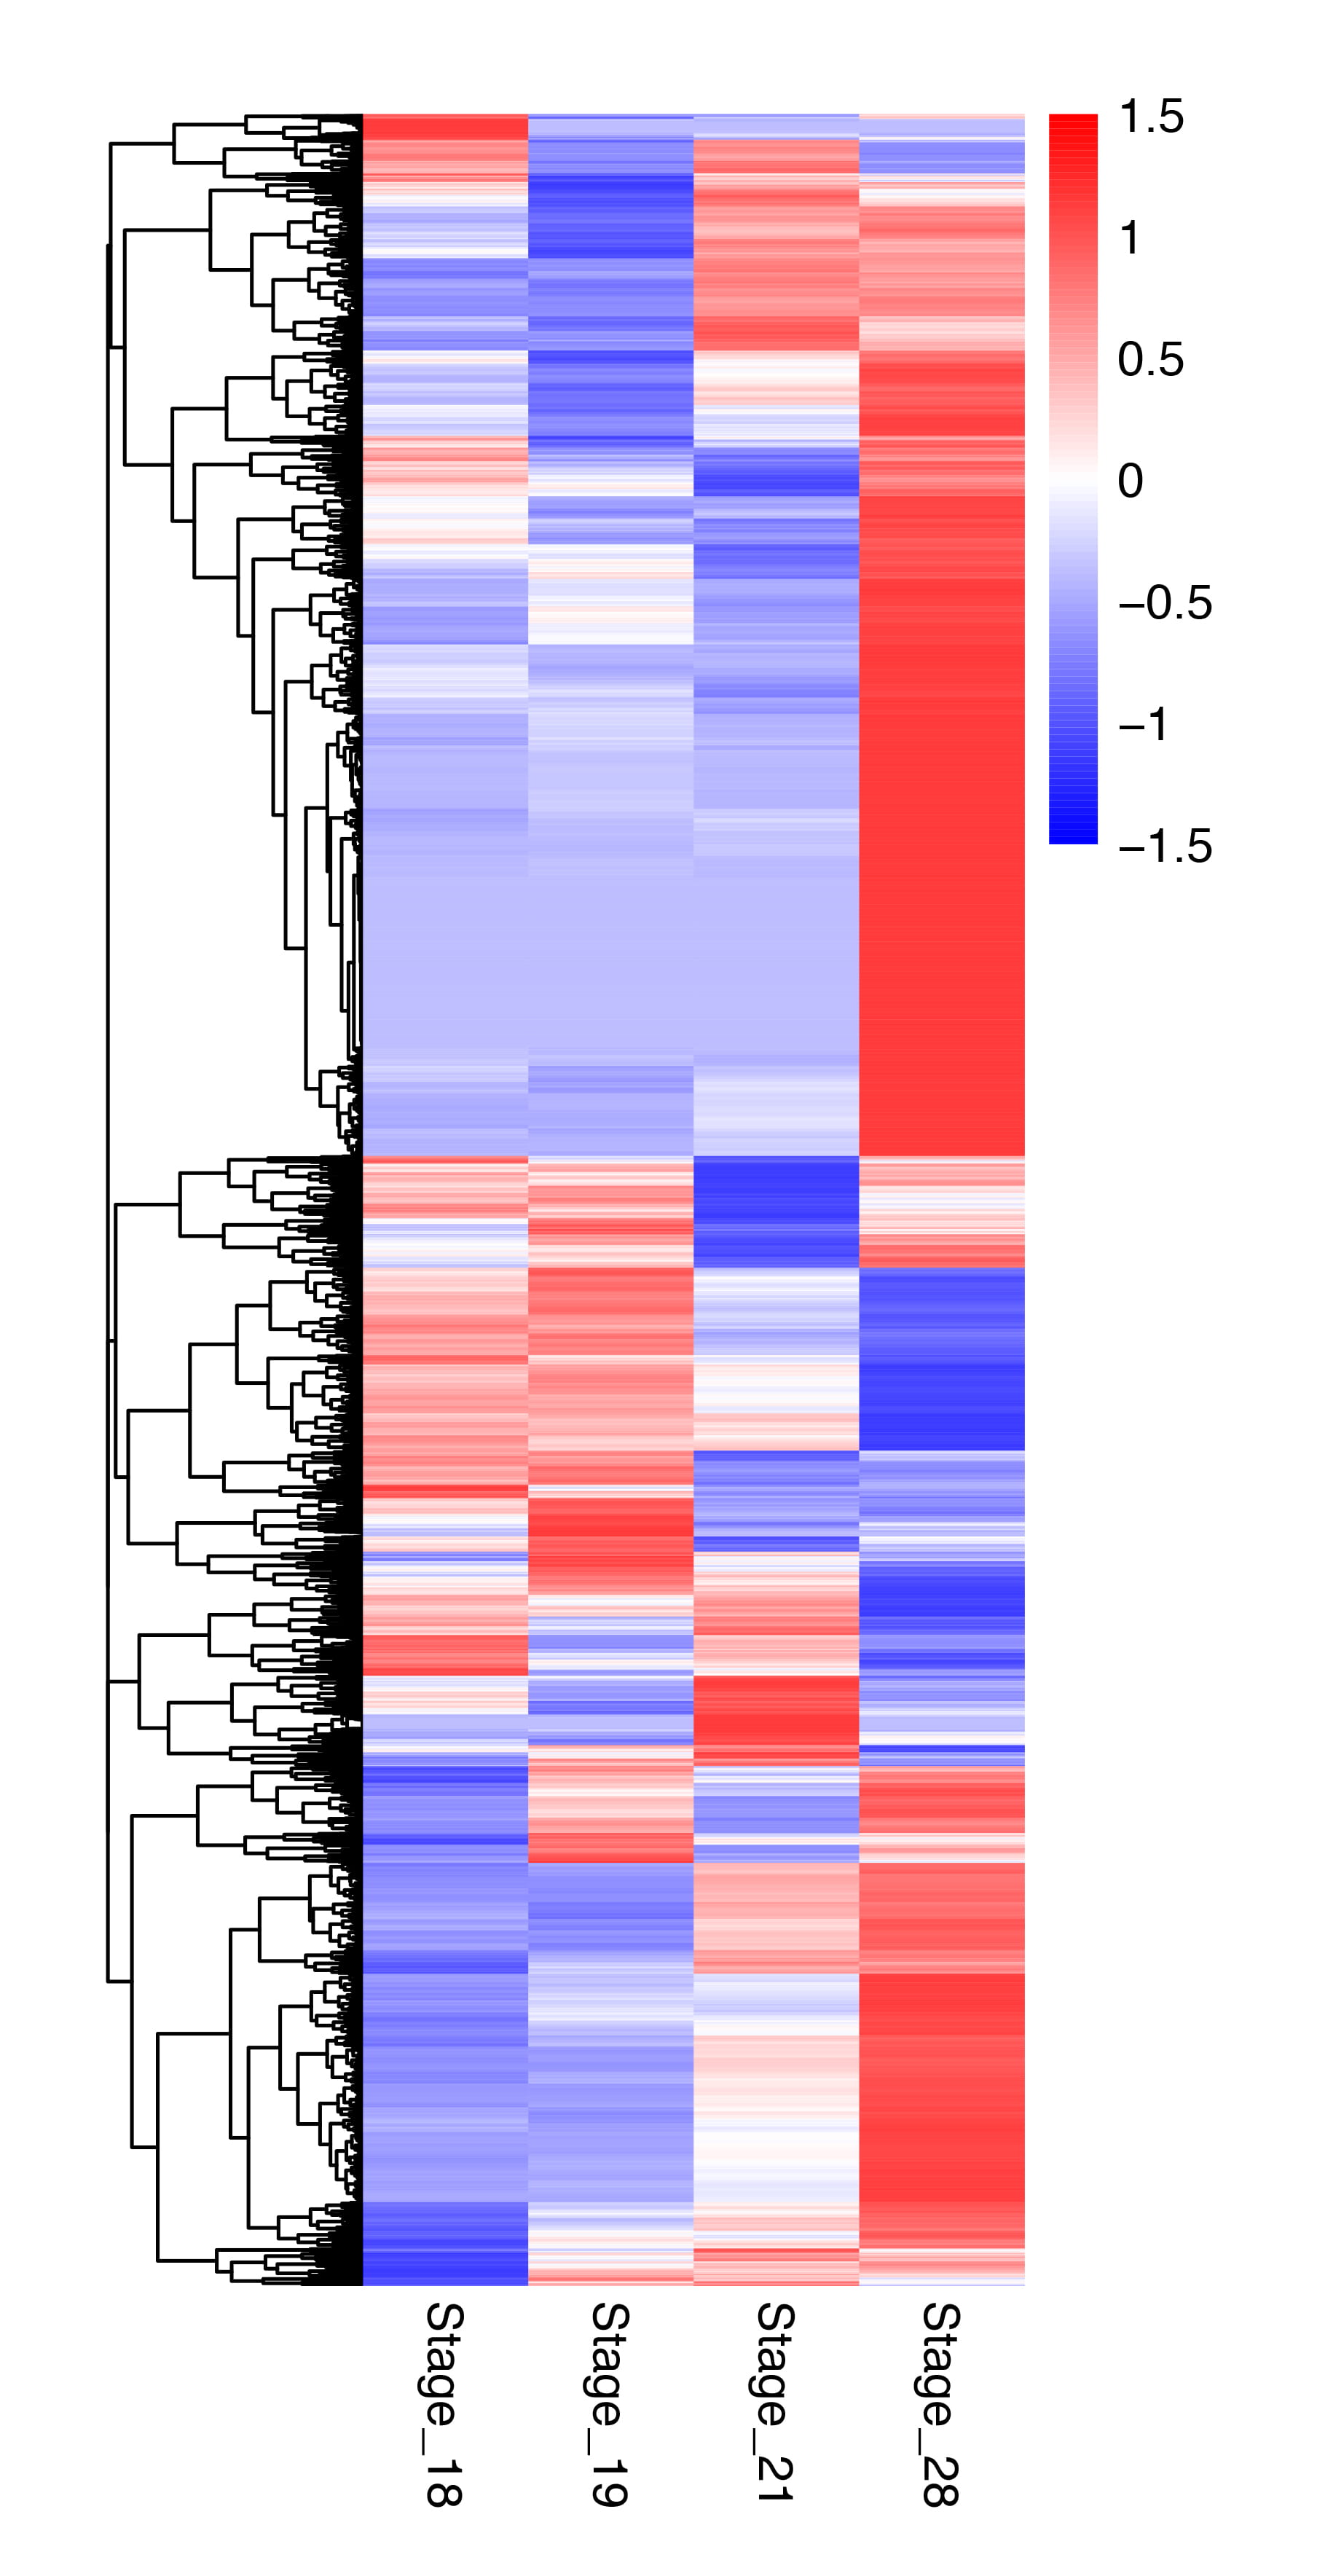 Fig. 4.
A heatmap showing the global expression patterns of the 8807 DETs at the four stages. The intensity of color indicates relative expression levels. Colors from red to blue correspond to high to low levels of expression. Note that the DETs fall into largely two categories with highest or lowest expression at stage 28, respectively. In addition, the expression levels for the majority of the DETs are most different between S18/19 and S28.
To understand the global gene functional categories and biological pathways
during tail development, GO and KEGG analyses were performed on the 8807 DETs.
These analyses revealed 110 significantly enriched GO categories and 6 highly
enriched KEGG pathways (q
To correlate the gene expression changes with the two phase of tail development, we first used K-means algorithm to cluster the DETs based on gene expression profiles across the four developmental stages. The DETs were scattered into eighteen clusters (Supplementary Fig. 2). To explore the gene regulation programs underlying different developmental stages, we focused on cluster 15, cluster 13, and cluster 3, in which the expression of the DETs were upregulated to high levels by S19, S21 and S28, respectively, suggesting their involvement in the respective transitions in the developmental stages. The DETs in each of the three clusters were classified into three GO categories by the Blast2GO, including biological process (BP), cellular component (CC), and molecular function (MF), and directed acyclic graph (DAG) was used to display the GO structures (Fig. 5). Top 10 GO term levels were selected as the master nodes in which only highly enriched GO term levels, such as levels 1, 6, 7, 8, 9, and 10, were displayed, with no significantly enriched GO terms were found in the GO term levels 2–5 (Fig. 5A, note that a node represents a GO term, an arrow represented a parent node, and the branches represent the containment relationships, with the range of function decreasing in size from top to bottom). For cluster 15, only DETs within the BP category were significantly enriched and the DAG showed that all enriched GO terms were eventually linked to three GO nodes: leucine catabolic process, valine catabolic process and tryptophan metabolic process (level 10 GO terms, Fig. 5A), suggesting an important role of amino acid metabolism in the tail development at S19 and later.
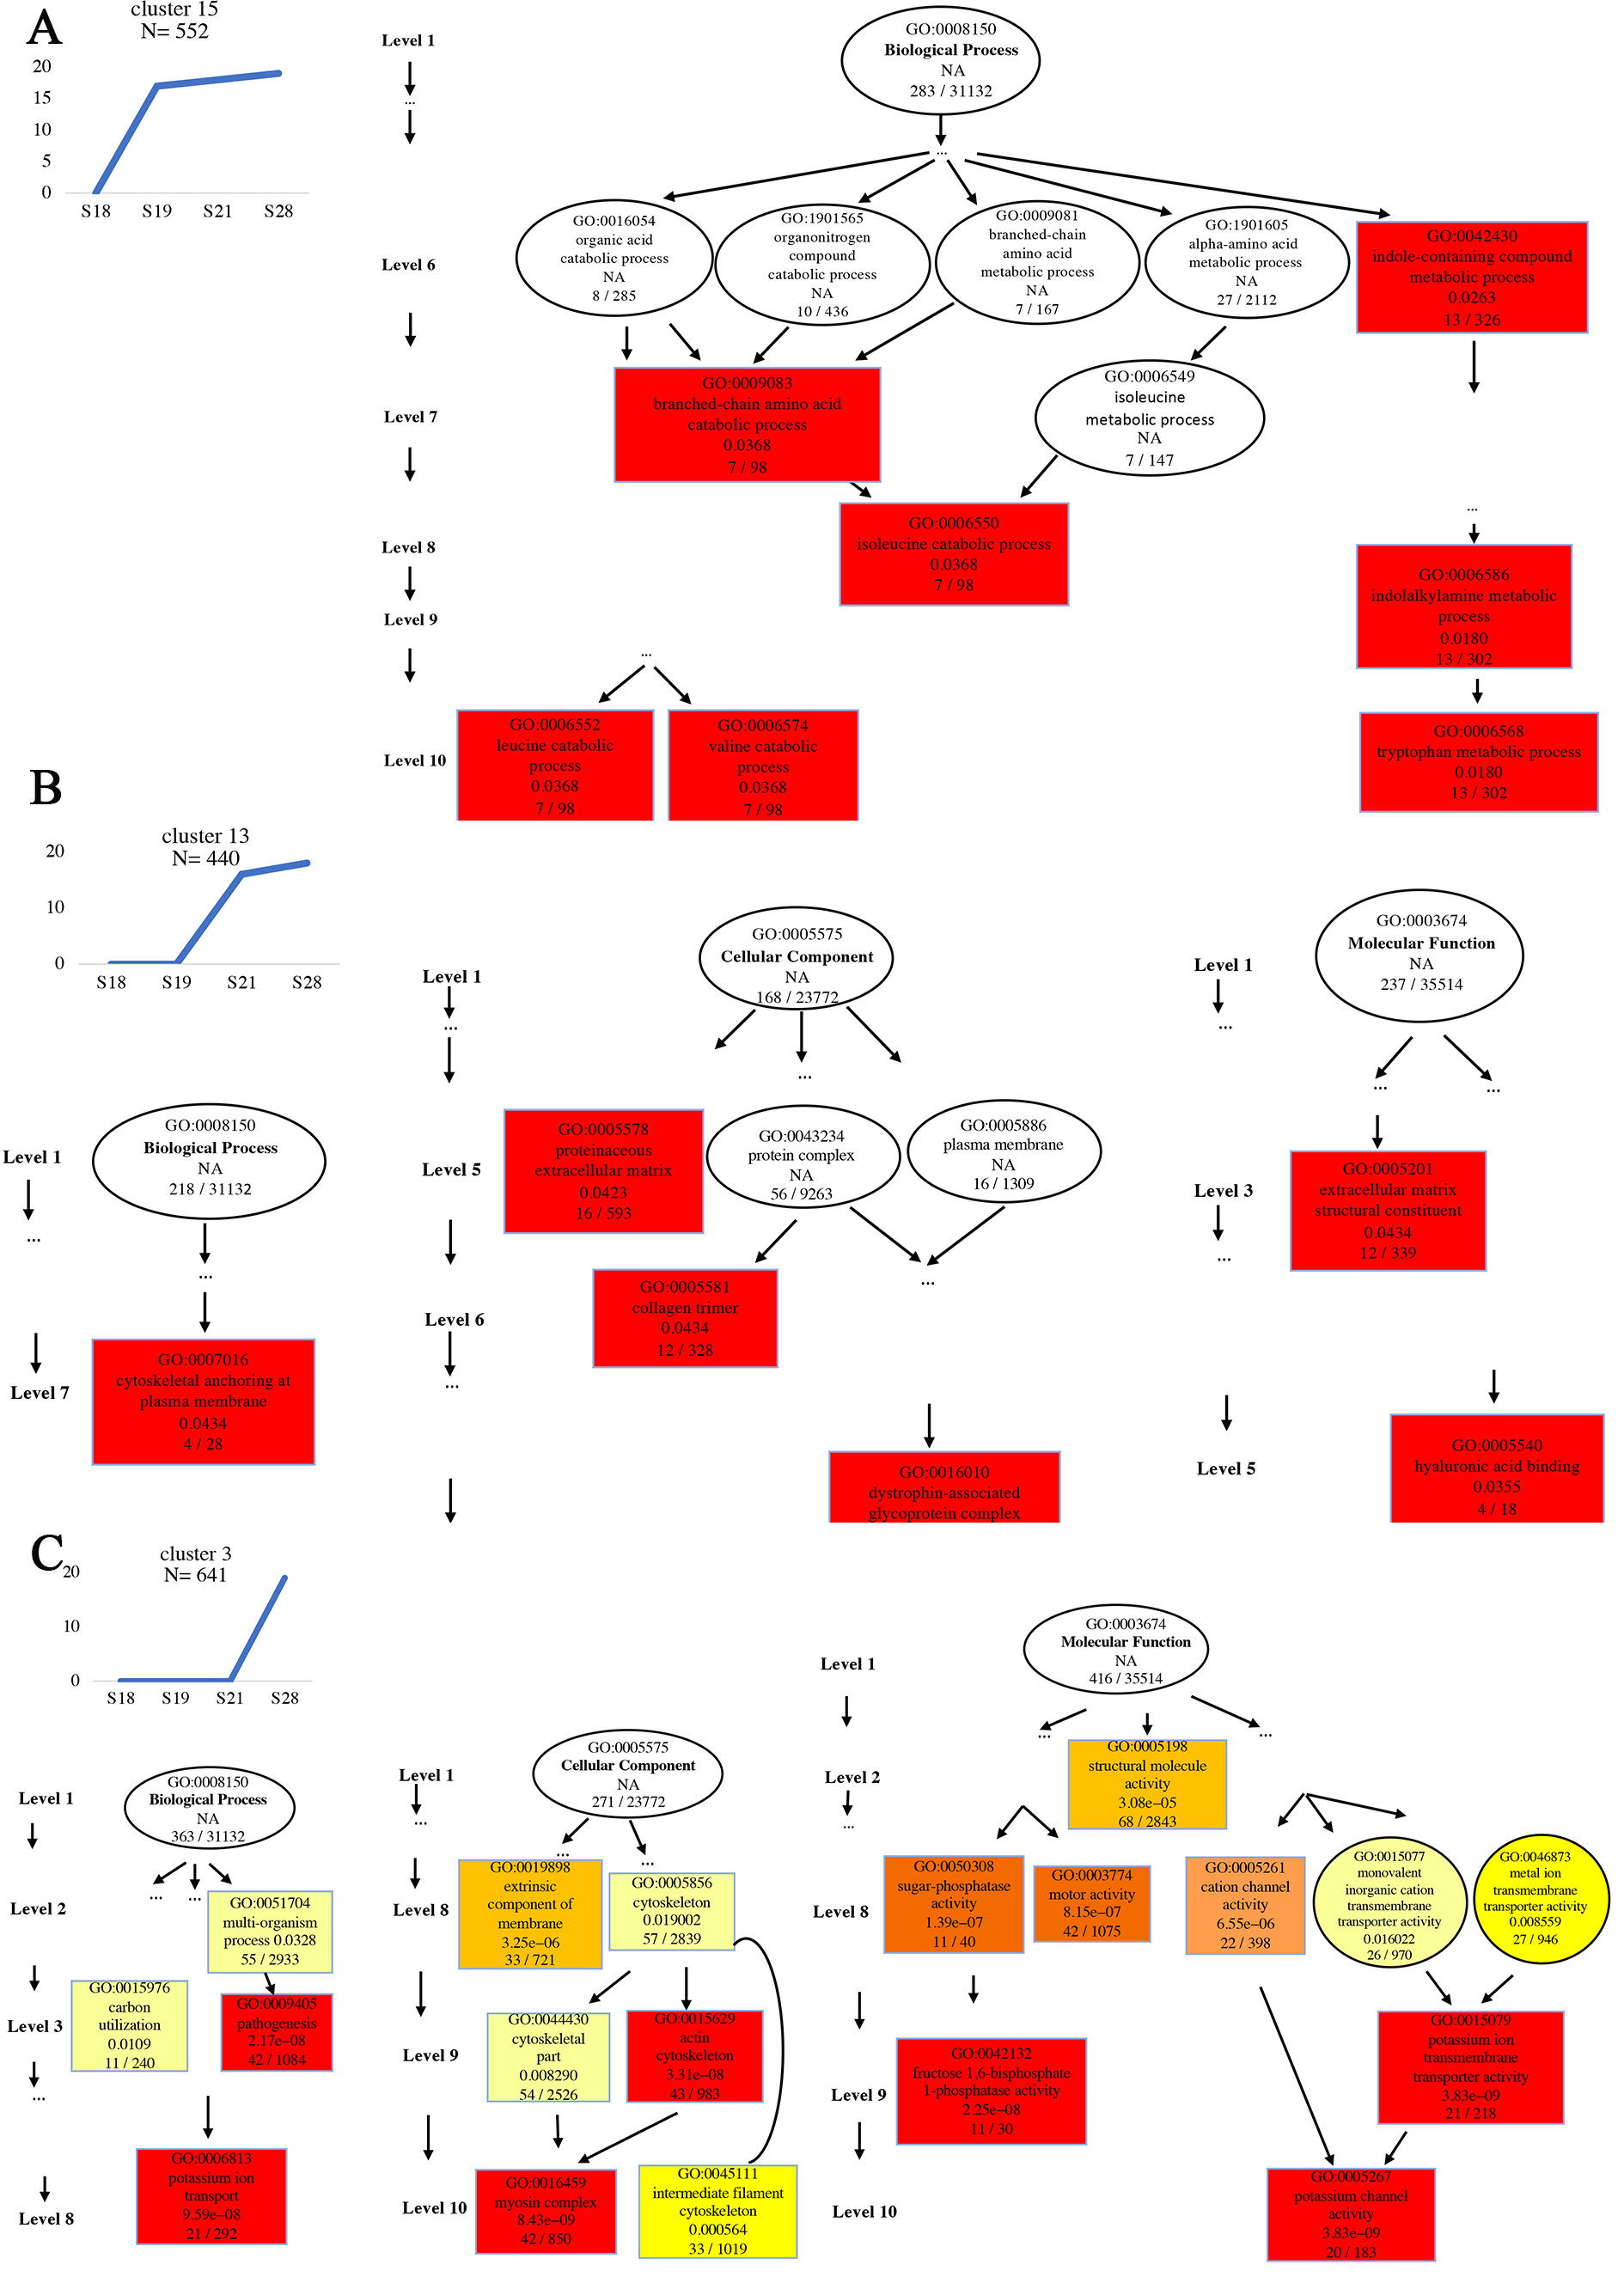 Fig. 5.
Directed acyclic graph (DAG) displaying the results of DEG enrichment according to GO analysis in three different DEG clusters. “N” in the left panel represents the number of DEGs in each cluster. For each cluster, the significantly enriched GO terms were arranged according to the GO levels, with the first level being either BP (Biological Process), CC (Cellar component), or MF (Molecular Function). Each box and circle indicate a GO term and the descriptions inside of which, from top to bottom, show GO term id, GO description, q value and the enriched DETs numbers/background gene numbers in the indicated GO term, respectively. Color depth represents the enrichment degree (based on q value, red is the most significantly enriched). Note that some levels had no GO terms shown as there were no GO terms enriched among the DEGs. (A) A cluster where the DETs were upregulated by S19 and remained highly expressed subsequently. These DETs were only significant enriched in biological process categories with leucine catabolic process, valine catabolic process and tryptophan metabolic process as the most significantly enriched. (B) A cluster where the DETs were upregulated by S21 and remained highly expressed subsequently. The GO terms “cytoskeletal anchoring at plasma membrane” of BP and “dystrophin-associated glycoprotein complex” of CC, and “hyaluronic acid binding” of MF are the most significantly enriched. (C) A cluster where the DETs were upregulated by S28. The GO terms “potassium ion transport” of BP and “myosin complex” of CC, and “potassium channel activity” of MF are the most significantly enriched.
For cluster 13, we found significantly enriched GO terms in three GO categories, BP, CC and MF and that there was a single node within each GO category linked to all enriched GO terms (Fig. 5B). These single nodes were GO term “cytoskeletal anchoring at plasma membrane” within BP, “dystrophin-associated glycoprotein complex” within CC, and “hyaluronic acid binding” within MF (Fig. 5B), indicating an important role of these process for the transition from tailbud determination to tailbud outgrowth (S19–S21).
Finally, the DETs upregulated by S28 (cluster 3) also had significantly enriched
GO terms in all three GO categories, BP, CC and MF. There was a single node, the
GO term “potassium ion (K
When we carried out KEGG pathway analysis on these three clusters
(
In contrast to the above three clusters, in which the DETs were upregulated to
highest levels at S28, two clusters
4
and 11, with a combined 1485 DETs, were DETs whose expression was downregulated
to lowest levels by S28 (Supplementary Fig. 2). Analyses of these
1485 DETs revealed the enrichment of 31 GO
terms (Supplementary Fig. 6A, Supplementary Table 7) and 9
KEGG pathways (Supplementary Fig. 6B, Supplementary Table 7)
with q
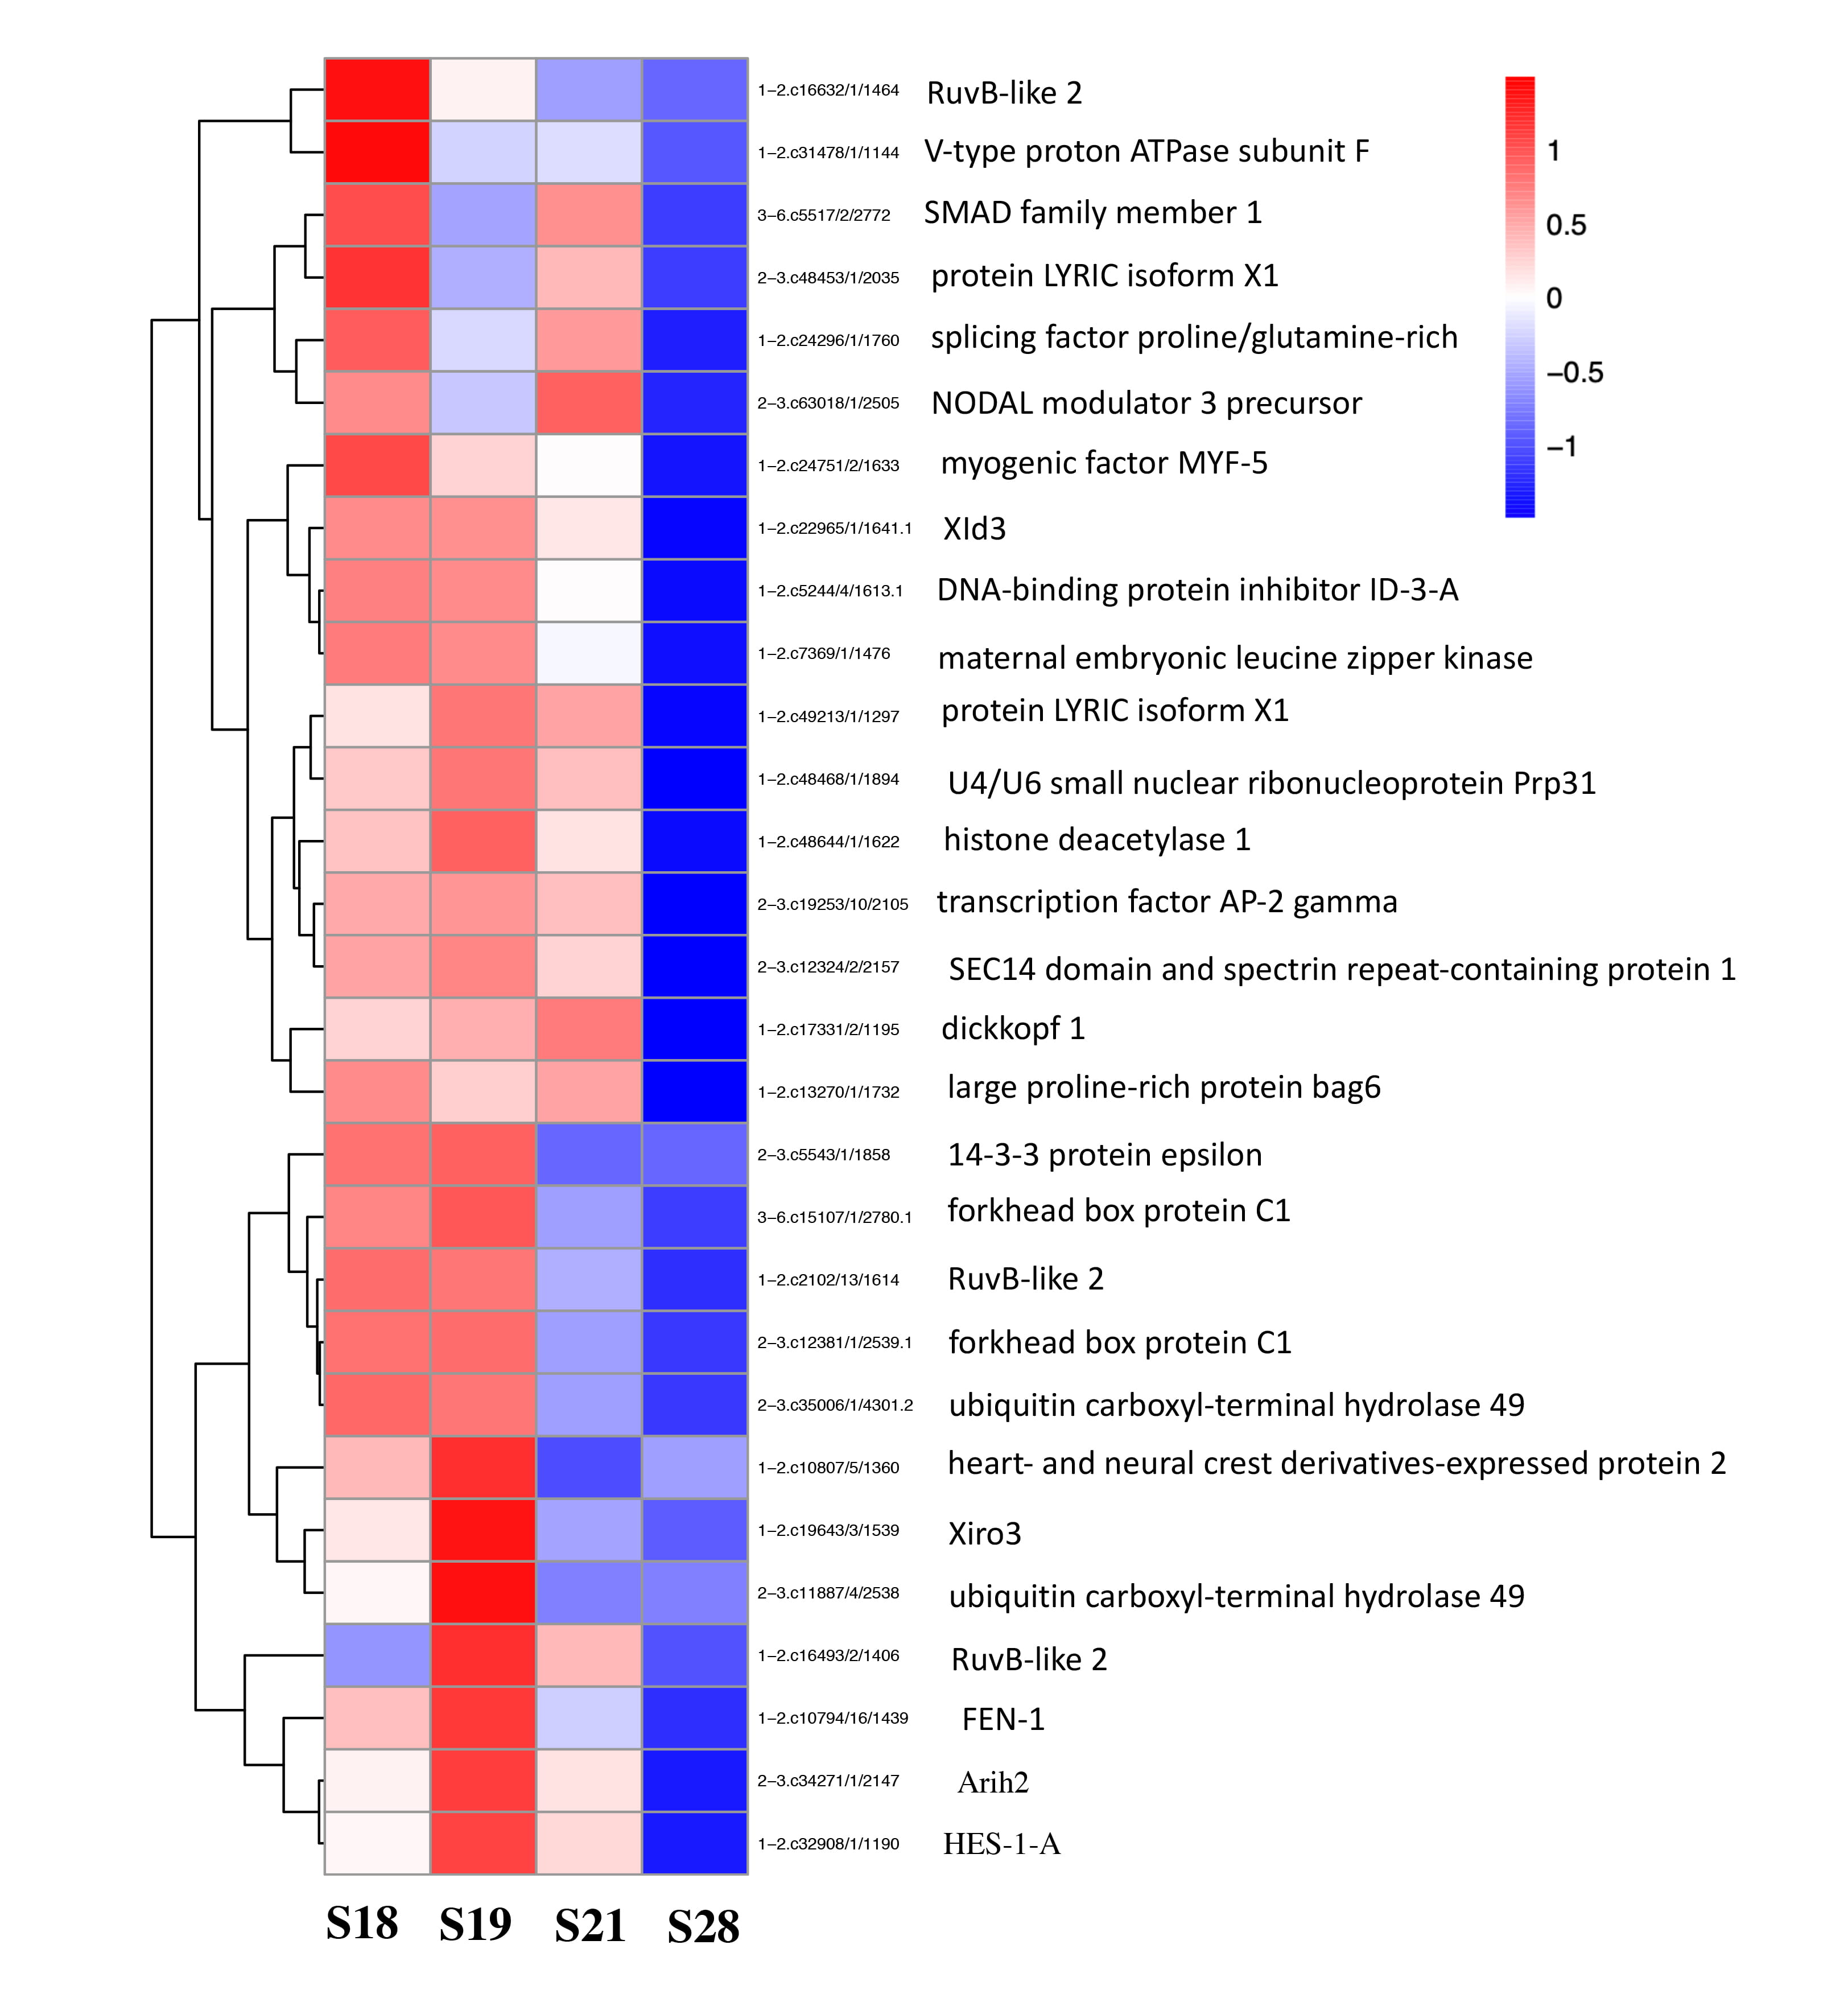 Fig. 6.
A heatmap showing the developmental expression patterns of the 29 EDTs present in total 20 organ development GO terms enriched among genes downregulated between stage 18 and stage 28. Most of the genes are highly expressed at S18 and S19 while downregulated by S28. The colors red to blue corresponds to high to low levels of expressions.
The KEGG pathways enriched among these 29 downregulated DETs included
TGF-
It is of interest that of the 9 highly enriched (q
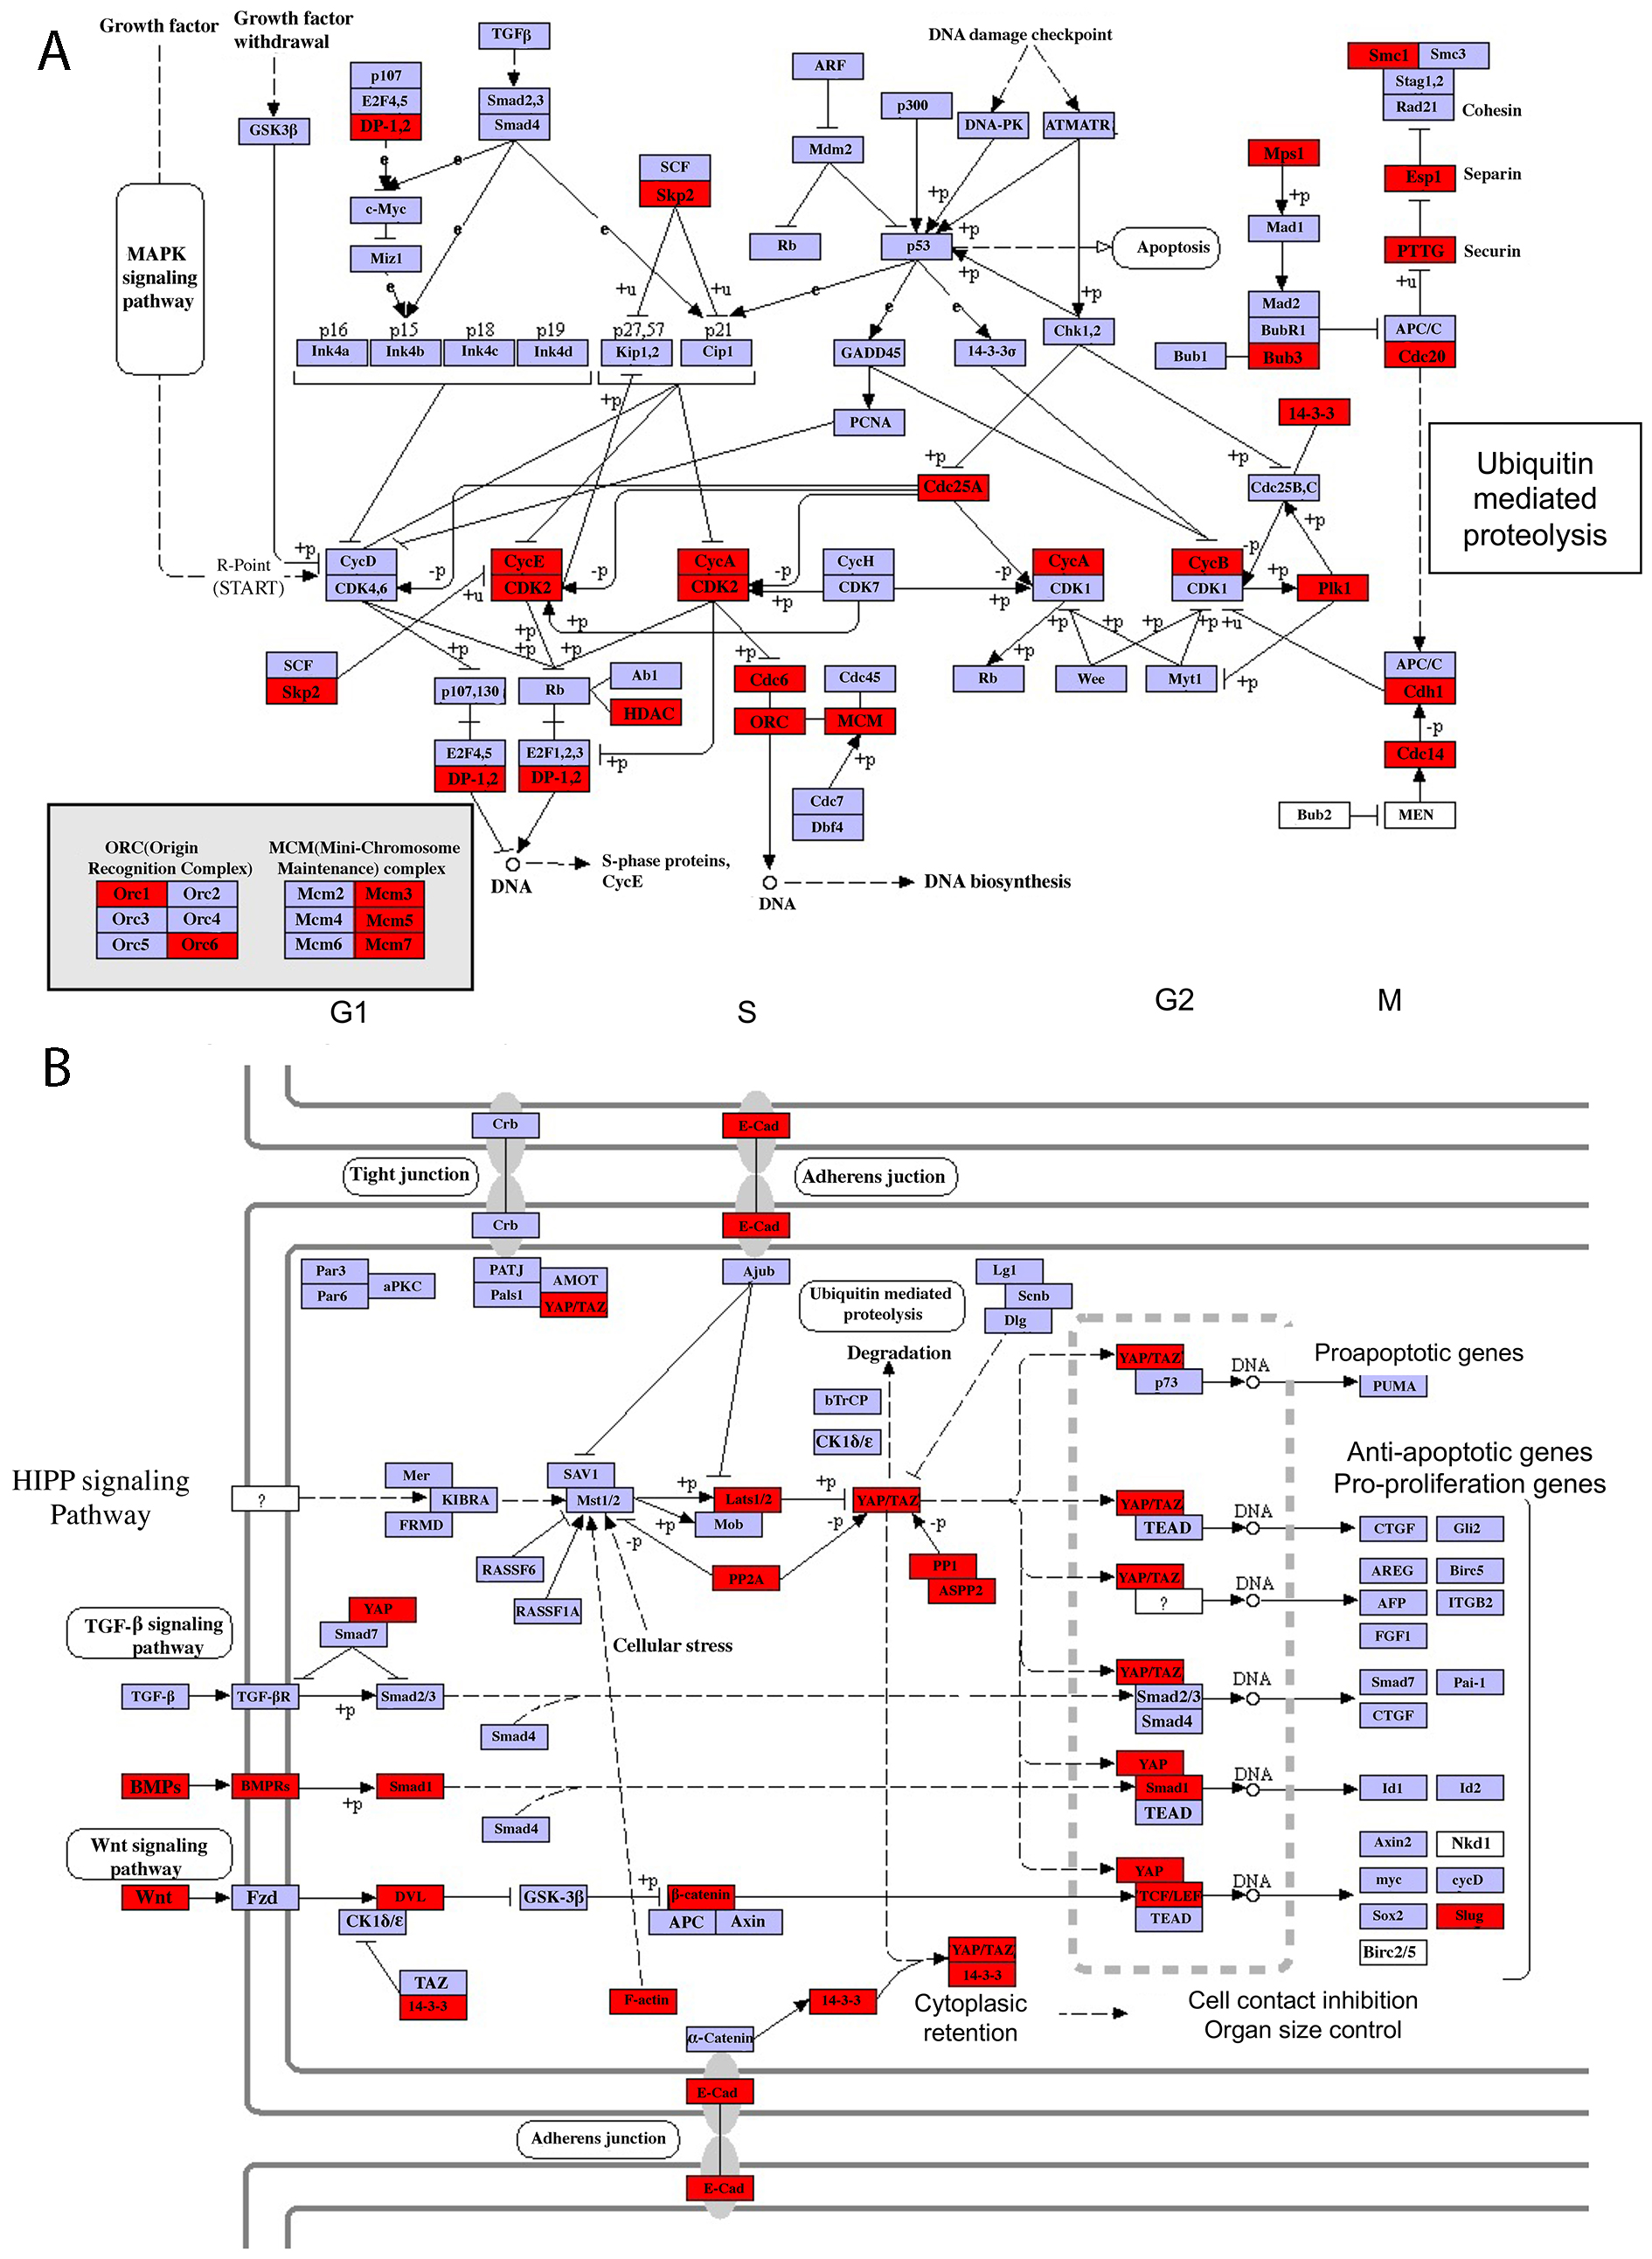 Fig. 7.
Selected pathways enriched among DETs that are highly expressed between S18 and S19 but downregulated by S28. (A) Cell cycle pathway. Note that Skp2, CDK2-cyclinA, HDAC, Mps1 and Cdh1, etc., were among the regulated genes. (B) Hippo signaling pathway. Note that BMPs, Wnt and YAP/TAZ were among the regulated genes. The red color indicates the genes that significantly enriched of the pathways.
RNA-Seq has been widely applied to studies in various species, especially non-model organisms, by offering a novel and efficient approach to generate transcriptome sequence [14, 15]. In addition, it allows researchers to focus on highly functional parts of the genome while avoiding complicated analyses of introns. However, it has many challenges in the transcriptome assembly and related analyses [16, 17]. In this study, we used SMRT sequencing with assistance of RNA-seq to provide a comprehensive transcriptome of M. fissipes. The average length and N50 length of full length transcripts, 1599 and 1956 bases, respectively, were much longer than corresponding values for de novo assembled transcripts of (624 and 769 bases, respectively) in this study or those reported for the same species from a previous study (732 and 1330 bases, respectively) [18]. In addition, the percentages of annotated transcripts from our SMRT sequencing analyses were also much higher than those reported earlier based on short-read RNA-Seq analysis. For example, 69% of the full length transcripts were annotated in NR database in our study compared to only 24.77% in the previous study [18]. Thus, SMRT sequencing with assistance of RNA-seq is more advantageous in obtaining real transcriptome transcripts for global gene expression studies.
Making use of the M. fissipes transcriptome thus obtained, we analyzed
the gene expression changes during tail development from S18 to S28. S18 is the
tail determination stage when just a small tailbud is present at the posterior
end of the body. S19 to S28 are the tailbud outgrowth stages with the fin, muscle
vascular, etc., being formed during this period. We discovered that there were
48,826 expressed transcripts and 8807 DETs based on pair-wise comparisons of gene
expression among these four stages. These DETs should be valuable resource for
study gene regulation and function during frog tail development. Indeed, our GO
analysis of the DETs upregulated between S18 and S19 revealed that amino acid
metabolic processes are highly enriched. Amino acid metabolism, such as BCAAs
(branched-chain amino acids, leucine, isoleucine and valine) and tryptophan
metabolism (Fig. 5A), is likely critical for building muscle tissue by
participating in increased protein synthesis as the tail transitions from tailbud
determination to outgrowth. Previous studies have shown that the metabolites of
BCAAs play an important role in protein synthesis, such as branched-chain keto
acids (BCKA),
While gene activation typically implicates a positive role in the subsequent developmental events, gene repression suggests that the corresponding genes may no longer be needed for and/or inhibit the subsequent development. In this regard, two downregulated DET clusters, clusters 4 and 11, are of particular interest. The DETs in these clusters are enriched with genes in “organ development” GO terms, which may be expected as tail development approaches completion between S21–S28. In addition, pathway analysis have revealed the enrichment of “Cell cycle” and “Hippo signaling pathway”, which are known to be important for the organ development [26, 27, 28, 29, 30] and downregulation of genes in these pathways would be expected as tail development is completed by S28. Such a correlation also exists at individual gene level. For example, among the DETs include Skp2, Mps1 and Cdh1, which are genes in Cell Cycle pathway (Fig. 7A). Skp2 positively regulates the G1-S transition and cell proliferation [31], Mps1 is a kinase required for mitotic checkpoint and Cdh1 regulates mitosis exit and G1-phase length [32, 33]. These genes are highly expressed at S18 and S19 when the tailbud starts to elongate, a process requiring extensive cell proliferation, and are then downregulated by S28 when tail development is complete.
A number of earlier studies have suggested that organ/tissue regeneration process is a part of the animal development program, especially for the re-growth phase, and thus there are various of shared genes and pathways between regeneration and normal development [34, 35, 36]. For instance, genes associated with Notch signaling, Hippo signaling, and Msx genes and Hox genes are expressed similarly during development and regeneration [35, 37]. In addition, both embryonic development and regeneration involve extensive cell proliferation, differentiation, large-scale cell movement and organismal patterning. Hence, for a long time, many researchers have been comparing embryogenesis and regeneration with an intention to use knowledge on embryonic development to unlock hidden regenerative potential and eventually aid in the development of regenerative medicines [38]. Interestingly, our study has revealed here numerous genes and pathways involved in tail development, such as Hippo signaling pathway, smad1/5/8, Id, Hes1/5, Mps1, Slug and HDAC, etc., reported to be important for regeneration [32, 39, 40, 41, 42, 43, 44, 45]. Slug in Hippo signaling pathway has been reported to modulate mammary epithelial stem cell activity and differentiation in vivo and the absence of Slug lead to the loss of mammary stem cell activity necessary for tissue regeneration and cancer initiation [44]. Thus, the genes/pathways that we have discovered to be significantly regulated during tail development should be a valuable resource for future research on the mechanisms of both tail development and regeneration.
In summary, we have obtained 48,826 high-quality and non-redundant full-length expressed transcripts in Microhyla fissipes and discovered 8807 DETs. Our results provide a global overview of gene expression patterns and new insights into the mechanisms involved in anuran tail development. As organ/tissue regeneration bears similarities to organ/tissue development, our findings here would also help to shed light on tail regeneration, and have implications in research and development of regenerative medicine.
SW, LL, and JJ conceived and designed the experiment; SW and Y-BS analyzed the data and prepared the manuscript. All authors participated in the manuscript preparation and approve the final version of the manuscript.
All experimental protocols and procedures were approved by the Experimental Animal Use Ethics Committee of the Chengdu Institute of Biology (Permit Number: 20150121003).
Not applicable.
This work was supported in part by the intramural Research Program of NICHD, NIH, Important Research Project of Chinese Academy of Sciences (KJZG-EW-L13), the National Natural Science Foundation of China (Grant No.32000311), Sichuan Science and Technology Project (2017JY0339), and Construction of Basic Conditions Platform of Sichuan Science and Technology Department (2019JDPT0020).
The authors declare no conflict of interest.
The sequencing data have been deposited in NCBI Sequence Read Archive (SRA) and the accession number is PRJNA504611. All data generated or analyzed during this study are included in this published article.
Supplementary material associated with this article can be found, in the online version, at https://www.fbscience.com/Landmark/articles/10.52586/5004.
DETs, differentially expressed transcripts; SMRT, single molecule long-read sequencing; BCAA, branched chain amino; GO, Gene ontology; KEGG, Kyoto encyclopedia of genes and genomes; RSEM, RNA-Seq using expectation maximization; FPKM, fragments per kilobase of exon model per million mapped reads; BP, Biological process; CC, Cellar component; MF, Molecular function; DAG, Directed acyclic graph.