


Frontiers in Bioscience-Landmark (FBL) is published by IMR Press from Volume 26 Issue 5 (2021). Previous articles were published by another publisher on a subscription basis, and they are hosted by IMR Press on imrpress.com as a courtesy and upon agreement with Frontiers in Bioscience.

1 Department of Hematology, The Third Xiangya Hospital, Central South University, Changsha 410013, PR China
2 Promab Biotechnologies, 2600 Hilltop Drive, Richmond, CA, 94806, USA
3 Biology and Environmental Science College, Hunan University of Arts and Science, Changde, 415000, China
4 Cancer and Immunogenetics Laboratory, Weatherall Institute of Molecular Medicine, John Radcliffe Hospital, Oxford, UK, OV3 9DS
Abstract
Placental alkaline phosphatase, PLAP encoded by ALPP gene in humans is mainly expressed in placenta and testis, and not expressed in any other normal tissues. PLAP is overexpressed in colorectal cancers which makes it an attractive target for CAR (chimeric antigen receptor)-T cell therapy. PLAP mRNA expression was detected in 21.5% (25 out of 116) of colorectal cancer cell lines and this expression was confirmed by FACS at the protein level. In addition, IHC staining on primary colorectal cancer tumors demonstrated PLAP expression in >20% of colorectal cancer tumors. We generated mouse and humanized PLAP ScFv-CAR-T cells and demonstrated high specificity against PLAP-positive colon cancer cells using RTCA (real-time cytotoxicity assay) and IFN-gamma secretion. In addition, humanized-CAR-T cells significantly decreased Lovo xenograft tumor growth in vivo. The combination of hPLAP-CAR-T cells with PD-1, PD-L1 or LAG-3 checkpoint inhibitors significantly increased the activity of hPLAP-CAR-T cells. This study demonstrates ability of novel PLAP-CAR-T cells to kill colorectal cancers and that the extent of killing can be increased by combination with checkpoint inhibitors.
Keywords
- Chimeric Antigen Receptor
- Immunotherapy
- Cancer
- PLAP
- Checkpoint inhibitor
CAR (chimeric antigen receptor)-T cell therapy has been successful in the treatment of hematological cancer patients (1), (2), (3), (4), (5). The chimeric antigen receptor contains a single chain fragment variant (ScFv) of an antibody targeting a cancer cell surface antigen fused to a hinge, transmembrane domain, co-stimulatory domain such as CD28 or 41-BB, and a CD3 activation domain (1, 6), (7, 8). Recently, two CD19-CAR-T cell therapies (Kymriah and Yescarta) have been approved by the FDA for the treatment of hematological cancers based on their high response rate in ALL and other hematological cancers in clinical trials (3), (9-11). There are several other CAR-T cells that have been tested in clinical trials such as CD22-CAR-T cells (12) for B-cell lymphoma and BCMA-CAR-T cells for multiple myeloma (13), (14).
In solid tumors, CAR-T cell therapy still has many challenges due to on-target off-tumor effects, suppressive tumor microenvironment, CAR-T cell trafficking and access to the tumor, T cell exhaustion and low persistence (15), (16-18). A major additional challenge for CAR-T cells targeting solid tumors is that most of the tumor solid tumor antigens so far tested are expressed in normal tissues causing potential toxicity by on-target/off-tumor effects. We have therefore focused our study on a solid tumor antigen that is not expressed in normal tissues, namely placental alkaline phosphatase (PLAP).
PLAP is expressed at a high level in placenta (19), but it is not expressed in normal tissues except for the testis (20). PLAP is a metalloenzyme that catalyzes the hydrolysis of phosphoric acid monoesters. It was found to be overexpressed in significant proportions of malignant seminomas, teratomas (20), (21), ovarian and cervical carcinomas (22), (23), (24), and colon adenocarcinomas (25). PLAP was also detected among several other membrane-bound proteins in exosomes of some non-small cell lung cancer patients with the potential to be a prognostic marker (26).
Colorectal cancer is the third leading cause of cancer-related deaths in women and men worldwide and, in particular, in the USA (27). There are several effective checkpoint inhibitor immunotherapies available for colorectal cancer, which produced good clinical responses but only for those colorectal cancers that are micro-satellite unstable. There is, therefore, a need for more effective immunotherapies for all the other types of colorectal cancer. The 5-year survival rate for metastatic colon cancer is only about 12% (27). In the present report, we have focused on targeting colorectal cancer with CAR-T cell therapy using PLAP as a target, as it was shown to be overexpressed in a significant subset of colorectal cancers (21).
An analysis of 116 colorectal cancer derived cell lines found that PLAP is expressed in 21.5% of the lines, and a similar level of expression was observed in 106 primary colorectal tissues by IHC. We used a PLAP ScFv from a mouse monoclonal antibody clone (19) to design a lentiviral CAR construct. PLAP-CAR-T cells specifically killed PLAP-positive colon cancer cells lines but did not kill PLAP-negative cell lines. PLAP-CAR-T cells also secreted significantly higher levels of IFN-gamma than did T cells or Mock CAR-T cells when tested against PLAP-positive cell lines, but not against PLAP-negative cell lines. We humanized the mouse PLAP ScFv and generated humanized PLAP-CAR-T cells to show that two humanized PLAP-CAR-T cells specifically targeted PLAP-positive colon cancer cells (Lovo, Caco-2, and LS123) but did not target PLAP-negative colon cancer cell lines (HCT116, SW620, and HT29). In addition, the humanized PLAP-CAR-T cells significantly inhibited colon cancer xenograft tumor growth. The humanized PLAP-CAR-T cell activity was enhanced by anti-PD-1 or LAG-3 antibodies suggesting that combination therapy with checkpoint inhibitors can be an effective approach to targeted immunological treatment of colorectal cancer. These data for the first time provide a basis for future clinical studies to target PLAP in colorectal cancer using PLAP-CAR-T cells.
HEK293FT cells from AlStem (Richmond, CA) were cultured in Dulbecco's Modified Eagle's Medium (DMEM) plus 10% FBS and 1% penicillin/streptomycin. Human peripheral blood mononuclear cells (PBMC) were isolated from whole blood obtained from the Stanford Hospital Blood Center, Stanford, CA according to an IRB-approved protocol. Colon cancer cell lines: PLAP-negative: SW620, HT29, HCT116 and PLAP-positive: Lovo, Caco-2, and LS123 were obtained from Dr. Walter Bodmer (Oxford, UK), whose laboratory authenticated cell lines using SNPs, Sequenom MassARRAY iPLEX and HumanOmniExpress-24 BeadChip arrays, and tested for the absence of Mycoplasma as described (28),(29). The cell lines were cultured in DMEM plus 10% FBS and penicillin/streptomycin. The list of the 116 colon cancer cell lines from W. Bodmer laboratory which were used for PLAP mRNA level detection is shown in Table 1. The cell lines were additionally authenticated by FACS using cell-specific surface markers and cultured in a humidified 5% CO2 incubator.
| Colon cancer cell lines | ALPP mRNA |
|---|---|
| LIM1863 | 12 |
| JHCOLOY1 | 23 |
| VACO429 | 23 |
| C10 | 25 |
| RW2982 | 26 |
| HCC2998 | 28 |
| HDC114 | 28 |
| HDC54 | 30 |
| HDC143 | 32 |
| VACO4A | 32 |
| HDC9 | 33 |
| KM20L2 | 33 |
| HDC8 | 33 |
| LIM2405 | 34 |
| CCO7 | 34 |
| HT29 | 35 |
| RW7213 | 36 |
| CX1 | 37 |
| GP2D | 37 |
| VACO4S | 38 |
| CW2 | 38 |
| CL40 | 40 |
| HDC73 | 41 |
| HDC57 | 42 |
| SW1463 | 42 |
| Colo201 | 42 |
| C106 | 42 |
| T84 | 44 |
| SNU479 | 44 |
| LS174T | 45 |
| SNUC1 | 46 |
| VACO400_12 | 46 |
| HDC111 | 46 |
| HCA46 | 46 |
| Colo320DM | 47 |
| SW403 | 47 |
| SNU1684 | 47 |
| HDC142 | 48 |
| C75 | 48 |
| GP5D | 49 |
| SNU1235 | 50 |
| HCT116 | 50 |
| HCT15 | 50 |
| SW48 | 50 |
| CC20 | 50 |
| Vaco5 | 51 |
| LS180 | 51 |
| OXCO1 | 51 |
| HRA19 | 52 |
| NCIH548 | 52 |
| CCK81 | 53 |
| SW948 | 53 |
| LIM1215 | 54 |
| COLO205 | 54 |
| C2284 | 55 |
| RKO | 57 |
| SNU70 | 57 |
| OXCO2 | 57 |
| NCIH747 | 57 |
| SNU1406 | 60 |
| NCIH498 | 60 |
| NCIH716 | 60 |
| C80 | 61 |
| LS411 | 61 |
| HCC56 | 61 |
| Vaco10MS | 61 |
| SNU1411 | 63 |
| SKCO1 | 63 |
| WIDR | 63 |
| Colo206 | 63 |
| LIM1863 | 64 |
| NCIH508 | 64 |
| HT55 | 64 |
| SW1222 | 64 |
| C84 | 64 |
| OXCO4 | 65 |
| C4054 | 65 |
| SW620 | 69 |
| LS1034 | 71 |
| C3953 | 74 |
| Gp2D | 75 |
| LS513 | 76 |
| C70 | 77 |
| C99 | 80 |
| HDC135 | 85 |
| CL11 | 86 |
| PMFKo14 | 87 |
| C125PM | 88 |
| SNUC2B | 90 |
| SW480 | 92 |
| SW837 | 96 |
| c10 | 100 |
| C105251 | 109 |
| HCT8 | 124 |
| RCM1 | 128 |
| c2bbe1 | 144 |
| SW1417 | 146 |
| SNU1544 | 161 |
| HCA7 | 170 |
| HDC82 | 188 |
| SW1116 | 196 |
| SNU1181 | 214 |
| DLD1 | 260 |
| TTITKB | 262 |
| ISCEROL | 271 |
| JHSKREC | 332 |
| CaR1 | 402 |
| C32 | 482 |
| PCJW | 484 |
| CACO2 | 657 |
| Lovo | 693 |
| OXCO3 | 749 |
| OUMS23 | 2040 |
| CL14 | 2664 |
| COLO678 | 2998 |
| LS123 | 3100 |
Monoclonal PD-1 (EH122H7), PD-L1 (clone 29E2A3), LAG3 (clone 7H2C65), CD62L (clone DREG-56), CD45RO (clone UCHL1), CD4 (clone RPA-T4) and CD8 (clone RPA-T8) antibodies were from Biolegend. PLAP antibody (clone H17E2) was purified from Dr. Walter Bodmer’s hybridoma or obtained from Thermo Fisher. Other antibodies were described in (30).
The second-generation CAR with CD8 alpha signaling peptide, PLAP ScFv H17E2 antibody (21), CD8 hinge, CD28 co-stimulatory domain, and CD3 activation domain was cloned down-stream of the EF1 promoter into a modified lentiviral vector pCD510 (Systems Bioscience). The same construct was generated with humanized PLAP ScFv (called humanized PLAP or PLAP h2, h4 (clone 2 or 4 respectively), with Mock control ScFv targeting intracellular protein or Mock control with a 45 amino-acid sequence containing three epitopes of a transferrin antibody (31), called (Mock-CAR). The mouse PLAP-CAR was generated by Synbio. The humanized PLAP ScFv sequences was synthesized by IDT as a gBlock sequence with Nhe I and Xho I restriction sites flanking the ScFv, and sub-cloned into a lentiviral vector containing Nhe I and Xho I sites between the CD8 alpha signaling peptide and CD8 hinge sequences.
Humanization of PLAP VH and VL sequences was performed as described in (32). The frames from the human antibody clones with highest homology were used for humanized pairs using bioinformatics in silico methods as described (30, 32-34). Mouse CDR were inserted into these clones, and different humanized ScFv variants were used for generating CAR constructs and performing CAR-T cell functional tests.
The lentiviral CAR constructs were used for generation of lentivirus by transfecting 293 FT cells using transfection agent (Alstem) and Lentivirus Packaging Mix as described (35). The lentiviral titers in pfu/ml were detected by RT-PCR using the Lenti-X qRT-PCR kit (Takara) and the 7900HT thermal cycler (Thermo Fisher) according to the manufacturer’s protocol.
PBMC were resuspended at 1 x 10⁶ cells/ml in AIM V-AlbuMAX medium (Thermo Fisher) containing 10% FBS with 300 U/ml IL-2 (Thermo Fisher). PBMC were activated with CD3/CD28 Dynabeads (Invitrogen), and cultured in 24-well plates. CAR lentivirus was added to the PBMC cultures at 24 and 48 hours using TransPlus transduction enhancer (AlStem), as described (30, 32, 35). The CAR-T cells were cultured and expanded for 14 days by adding fresh medium to maintain the cell density at 1 x 10⁶ cells/ml.
To detect CAR expression, 5x10⁵ cells were suspended in 1xPBS plus 0.5% BSA buffer and incubated on ice with 1% of human serum (Jackson Immunoresearch, West Grove, PA) for 10 min. Then allophycocyanin (APC)-labeled anti-CD3 (eBioscience, San Diego, CA), 7-aminoactinomycin D (7-AAD, BioLegend, San Diego, CA), biotin-labeled polyclonal goat anti-mouse-F(ab)2 antibody or its isotype control antibody were added, and the cells were incubated on ice for 30 min. Then cells were rinsed with buffer, stained with phycoerythrin (PE)-labeled streptavidin (BD Pharmingen, San Diego, CA), and analyzed on a FACSCalibur (BD Biosciences) first for light scatter versus 7-AAD staining, then the 7-AAD-negative live gated cells were plotted for CD3 staining versus F(ab)2 staining or isotype control staining. For FACS with colorectal cancer cell lines to detect PLAP levels mouse monoclonal PLAP antibody (H17E2) obtained from Dr. Walter Bodmer was used, and FACS analysis was performed on a FACSCalibur.
The binding of PLAP antibody with recombinant PLAP extracellular domain protein from Sino Biological was performed using Blitz ForteBio system, as described (30). In brief, anti-mouse-capture (AMC) biosensors were soaked in kinetics buffer (PBS, 0.1% Tween, 0.05% BSA) for 10 min, and then with mouse anti-PLAP antibody at 0.1 mg/mL in same buffer for 30 min. After washing, biosensors were used to bind the PLAP antigen at different concentrations. The Kd was detected with Blitz system software.
Adherent colorectal cancer target cells (1x10⁴ cells per well) were seeded into 96-well E-plates (Acea Biosciences, San Diego, CA) and cultured overnight using the impedance-based real-time cell analysis (RTCA) iCELLigence system (Acea Biosciences). After 20-24 hours, the medium was replaced with 1 x 10⁵ effector cells (CAR-T cells, Mock CAR-T cells or non-transduced T cells) in AIM V-AlbuMAX medium containing 10% FBS, in triplicate. In some experiments checkpoint protein antibodies PD-1, LAG-3 or isotype at 10 μg/ml were added to the effector cells either alone or in combination with CAR-T cells. In some series of experiments target cells were pre-treated with 20 ng/ml of IFN- gamma for 24 h. The cells were monitored for 1-2 days with the RTCA system, and normalized cell index proportional to impedance was plotted over time. Cytotoxicity was calculated as (impedance of target cells without effector cells – impedance of target cells with effector cells) x100 /impedance of target cells without effector cells.
The target cells were cultured with the effector cells (CAR-T cells or non-transduced T cells) in U-bottom 96-well plates with AIM V-AlbuMAX medium plus 10% FBS, in triplicate. After 16 h the supernatant was removed and centrifuged to remove residual cells. In some experiments, supernatant after the RTCA assay was used for IFN-gamma ELISA assays. The supernatant was transferred to a new 96-well plate and analyzed by ELISA for detecting levels of human IFN-gamma using kits from Thermo Fisher according to the manufacturer’s protocol.
Six-week old male NSG mice (Jackson Laboratories, Bar Harbor, ME) were housed and injected with CAR-T cells in accordance with the Institutional Animal Care and Use Committee (IACUC) protocol. Each mouse was injected subcutaneously with 2 x 10⁶ colon cancer cells in sterile 1x PBS. The CAR-T cells (1x10⁷ CAR-T cells/mice) were injected intravenously into mice at days 1, 7 and 13. Tumor sizes were measured with calipers twice-weekly and tumor volume (in mm3) was determined using the formula W2L/2, where W is tumor width and L is tumor length. At the end 0.1 ml of blood was collected and used for analysis of toxicology markers.
Mouse serum samples were processed with clinical chemistry analyzer (Beckman-Coulter AU680) by IDEX Bioanalytics (West Sacramento, CA) for detection levels of toxicology markers: ALT (alanine aminotransferase), AST (aspartate aminotransferase), and amylase in U/ml.
The slides with samples of different types of normal tissues or tumor tissues were obtained from Promab Biotechnologies (Richmond, CA). The TMA slide with primary colon cancer adenocarcinomas was obtained from Biomax (Rockville, MD) and used for IHC with PLAP antibody.
The primary tumor or normal tissue section slides or primary TMA slides were incubated in xylene twice for 10 min, then hydrated in alcohol and rinsed in 1xPBS. Heat-induced antigen retrieval was performed for 20 min in 10 mM citrate buffer, pH 6.0. The slides were rinsed with 1xPBS, incubated in a 3% H2O2 solution for 10 min, then rinsed again with 1xPBS, and incubated in goat serum for 20 min. The tissue section slides were incubated with mouse monoclonal PLAP (H17E2) antibody overnight at 4˚C or 1.5 hours at 37˚C. The slides were then rinsed 3 times with 1xPBS, incubated with biotin-conjugated secondary antibody for 10 min, rinsed with 1xPBS, incubated with streptavidin-conjugated peroxidase for 10 min, and rinsed 3 times with 1xPBS buffer. Then slides were incubated in DAB substrate solution for 2-5 min under the microscope. The reaction was stopped by washing in water, counterstained with hematoxylin, rinsed with water, and dehydrated in 75%, 80%, 95% and 100% ethanol and xylene. For negative control isotype antibody was used, and for positive control placenta samples were used. Images were acquired on the Motic DMB5-2231PL microscope using Images Plus 2.0. software (Motic, Xiamen, China). PLAP expression correlation with survival free prognosis was performed using R2 Genomics Analysis and Visualization platform (http://r2platform.com / http://r2.amc.nl).
We performed IHC staining with the PLAP H17E2 antibody on placenta, testis, colon cancer, ovarian cancer and other normal or malignant tissues from different types of cancers (Figure 1A). Placenta had highest staining, testis, colon and ovarian cancer were positive, while other types of cancer such as breast, lung, prostate cancer were negative as were normal tissues: pancreas, tonsil, rectum, muscle, esophagus, brain and other tissues (Figure 1A). In addition, we evaluated mRNA expression of PLAP expression in silico across 1457 different malignant cell lines, including 63 colorectal cancer cell lines using the Cancer Cell Line Encyclopedia (CCLE) (Figure 1B). Expression of PLAP was relatively high in gastro-intestinal (GI) cancers: cancers of esophagus, upper aerodigestive organs, stomach, pancreatic and colorectal cancers (Figure 1B). We also performed analysis using Genotype-Tissue Expression (GTEx) database of PLAP expression in nonmalignant normal tissues (Figure 1C). PLAP mRNA had minimal expression in many normal tissues (many had 0 TMP (transcript per million kb) mRNA level (Figure 1C). Thus, PLAP mRNA is not expressed in most normal tissues and positively expressed in a significant proportion of gastrointestinal cancers.
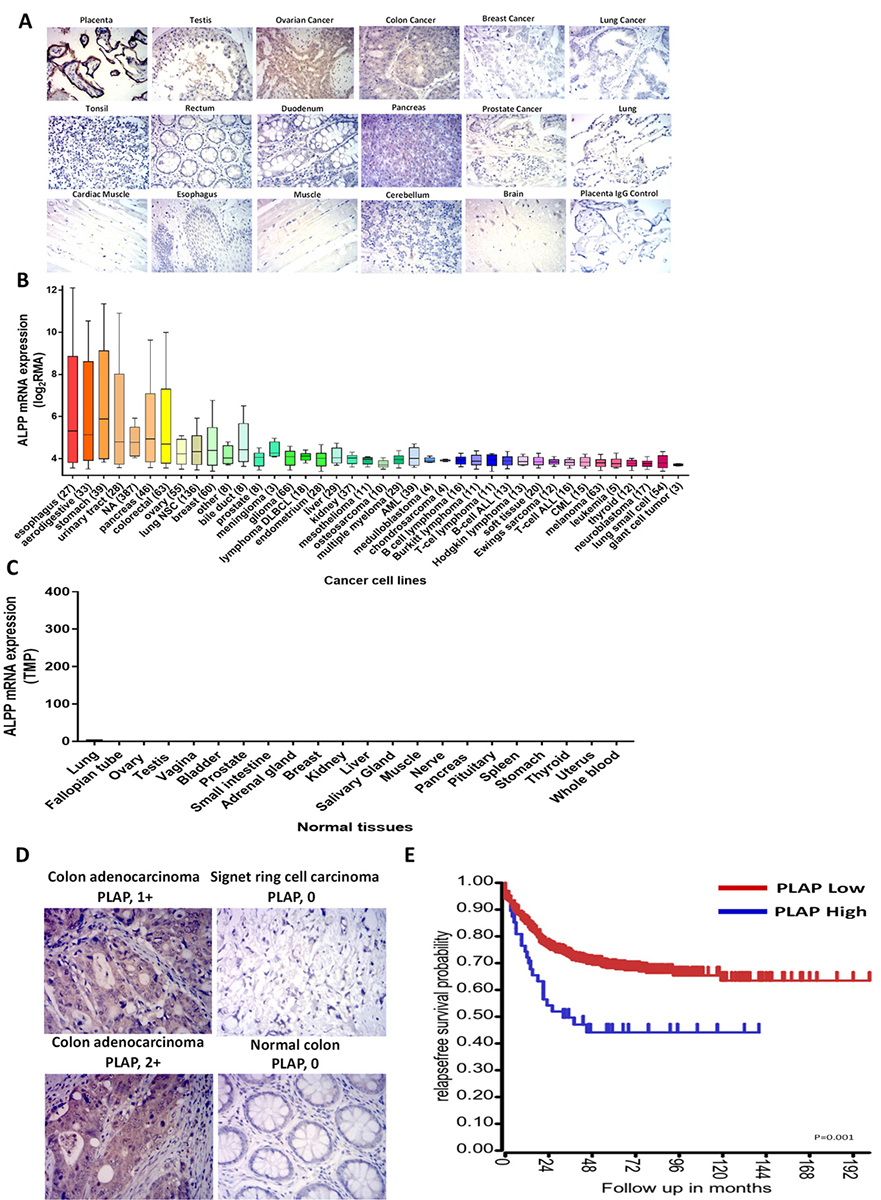 Figure 1
Expression of PLAP in primary tumor and normal tissues. A. IHC staining was performed on paraffin-embedded normal and tumor sections. High expression of PLAP was observed in placenta, positive expression in testis, ovarian and colon tumors. All other tissues were PLAP-negative. B. mRNA PLAP expression in malignant cell lines (n=1457) from the Cancer Cell Line Encyclopedia, CCLE. Y-axis shows log2 RMA, robust multiarray average. NSC, non-small cell; DLBCL, diffuse large B cell lymphoma; CML, chronic myeloid leukemia; ALL, acute lymphoblastic leukemia; AML, acute myeloid leukemia. C. PLAP mRNA expression in normal tissues according to Genotype-Tissue Expression (GTE) database. RNASeq data are shown. TMP, Transcripts per Million. D. Representative images of IHC with PLAP antibody using primary colorectal tumors. Colon adenocarcinoma was PLAP-positive, normal colon was PLAP-negative. E. PLAP expression by R2 genomics analysis and visualization platform in 557 primary colorectal cancer tumors and correlation with patient outcome is shown.
Next, we performed IHC staining with the PLAP antibody using 106 primary colon cancer tumors, and found PLAP expression in 25 of 106 samples, namely 23.6% of all cancer tumors (Figure 1D). We also tested PLAP expression by R2 genomics analysis and visualization platform in 557 primary colorectal cancer tumors and performed correlation with patient outcome (Figure 1E). Patients with high PLAP expression had shorter survival than patients with low PLAP expression demonstrating that PLAP expression can correlate with poor prognosis in colorectal cancer. These data show that PLAP is overexpressed in a significant proportion of primary colon cancer tumors.
In addition, we tested PLAP mRNA level in 116 colon cancer cell lines by microarray assay (28) and detected that 21.5% of colon cancer cell lines expressed PLAP mRNA (Figure 2A, Table 1). We also carried out a FACS assay using the anti PLAP antibody and showed high levels of PLAP expression in colon cancer cell lines with high PLAP mRNA expression: Lovo, Caco-2 and LS123 cell lines (Figure 2B). In contrast there was minimal PLAP expression in PLAP mRNA negative colon cancer cell lines such as HCT116, HT-29 and SW620 cell lines (Figure 2B). Thus, PLAP mRNA and PLAP protein levels were in good agreement with each other. PLAP H17E2 antibody recognized purified recombinant PLAP protein with a Kd=3.2 nM (Figure 2 C). PLAP antibody also specifically recognized PLAP protein expressed in HEK-293 cells transfected with PLAP DNA, called 293-PLAP cells (Figure 2D). It did not recognize PLAP in control HEK-293 cells (Figure 2D). Thus, PLAP is expressed in a significant proportion of primary colorectal cancers and PLAP antibody detects PLAP antigen providing a basis for developing a PLAP-CAR-T cell therapy against colorectal cancers.
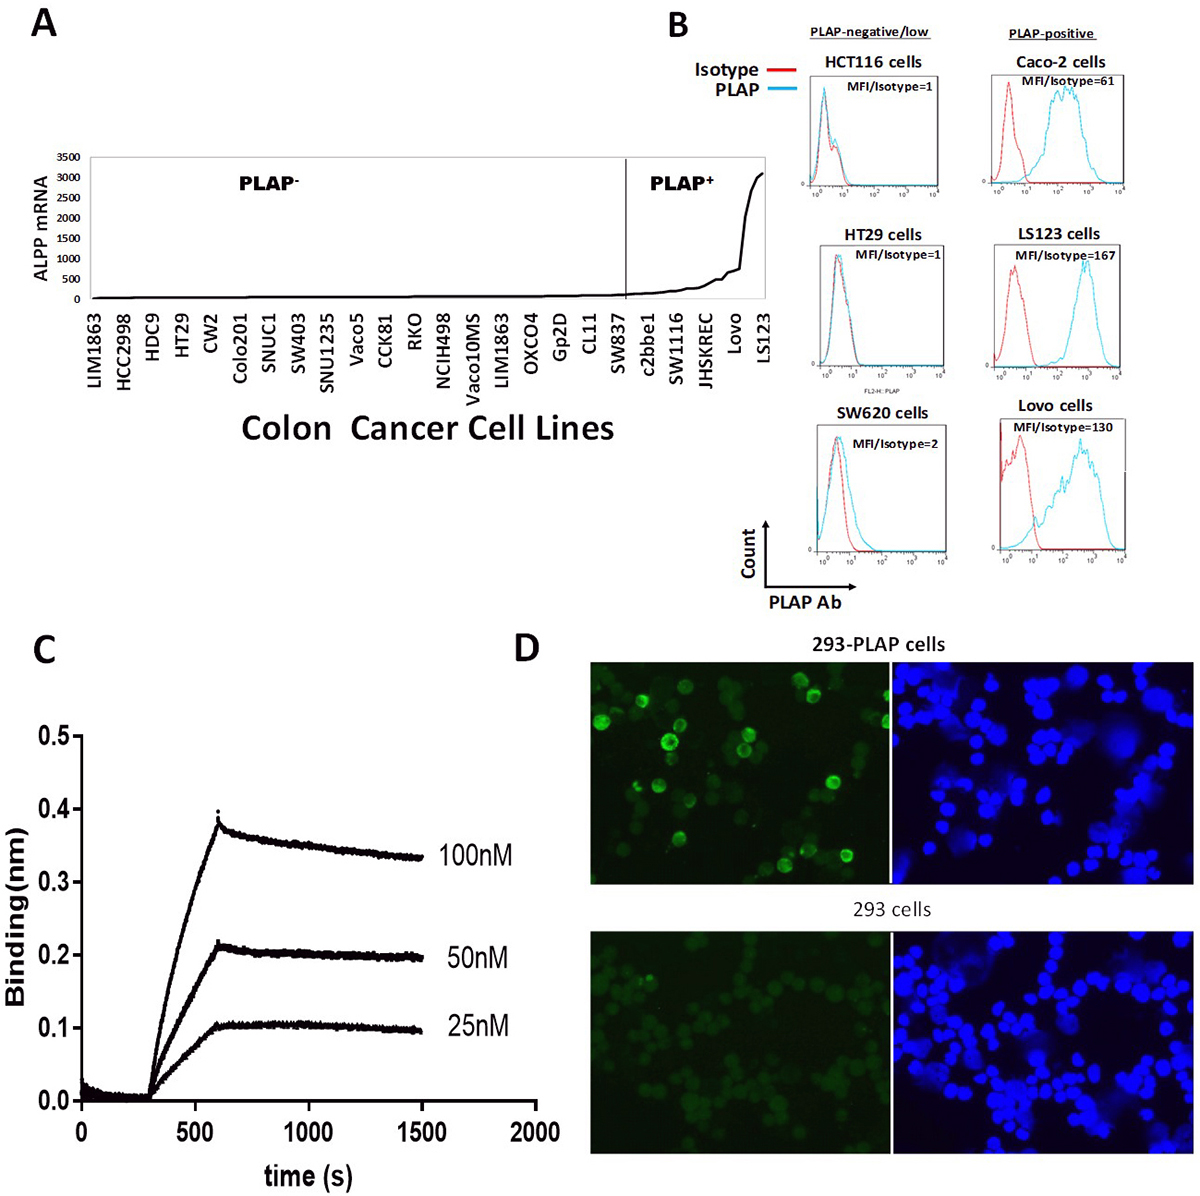 Figure 2
Expression of PLAP (ALPP) mRNA in colon cancer cell lines. A. The expression of ALPP (PLAP) mRNA was assessed by Affymetrix micro-array technology on 116 colon cancer cell lines (28). The list of colon cancer cell lines from left to right and ALPP mRNA levels are shown in Table 1. The cut-off for PLAP-positive or negative cancer cell lines is shown by vertical line (100 from Affymetrix analysis, Table 1). B. Protein expression of PLAP in 6 colon cancer cell lines was confirmed by FACS analysis. Flow cytometric staining with an antibody against PLAP (blue histogram) and an isotype control antibody (red histogram) is shown using PLAP-negative and PLAP-positive cell lines. MFI (Mean fluorescent intensity)/isotype ratio is shown for each cell line. C. The binding of PLAP monoclonal antibody H17E2 (22) to recombinant PLAP protein is shown by BLI Blitz analysis as described in Materials and Methods. D. PLAP antibody binds to PLAP expressed in stable HEK-293-PLAP cells. Negative control HEK-293 cells did not express PLAP. Nuclei are shown in blue color, PLAP staining (green color).
We designed a second-generation CAR construct using the mouse monoclonal PLAP antibody ScFv, CD8 alpha hinge, CD28 transmembrane and co-stimulatory domains and the CD3 activation domain (Figure 3A). We prepared lentivirus with PLAP-CAR and Mock CAR with intracellular protein ScFv, and transduced T cells to generate corresponding CAR-T cells. The PLAP-CAR-T cells underwent >200-fold expansion similarly to Mock-CAR-T cells or T cells (Figure 3 B). CAR-T positive cells were detected by FACS with anti-F(ab)2 antibody (Figure 3 C).
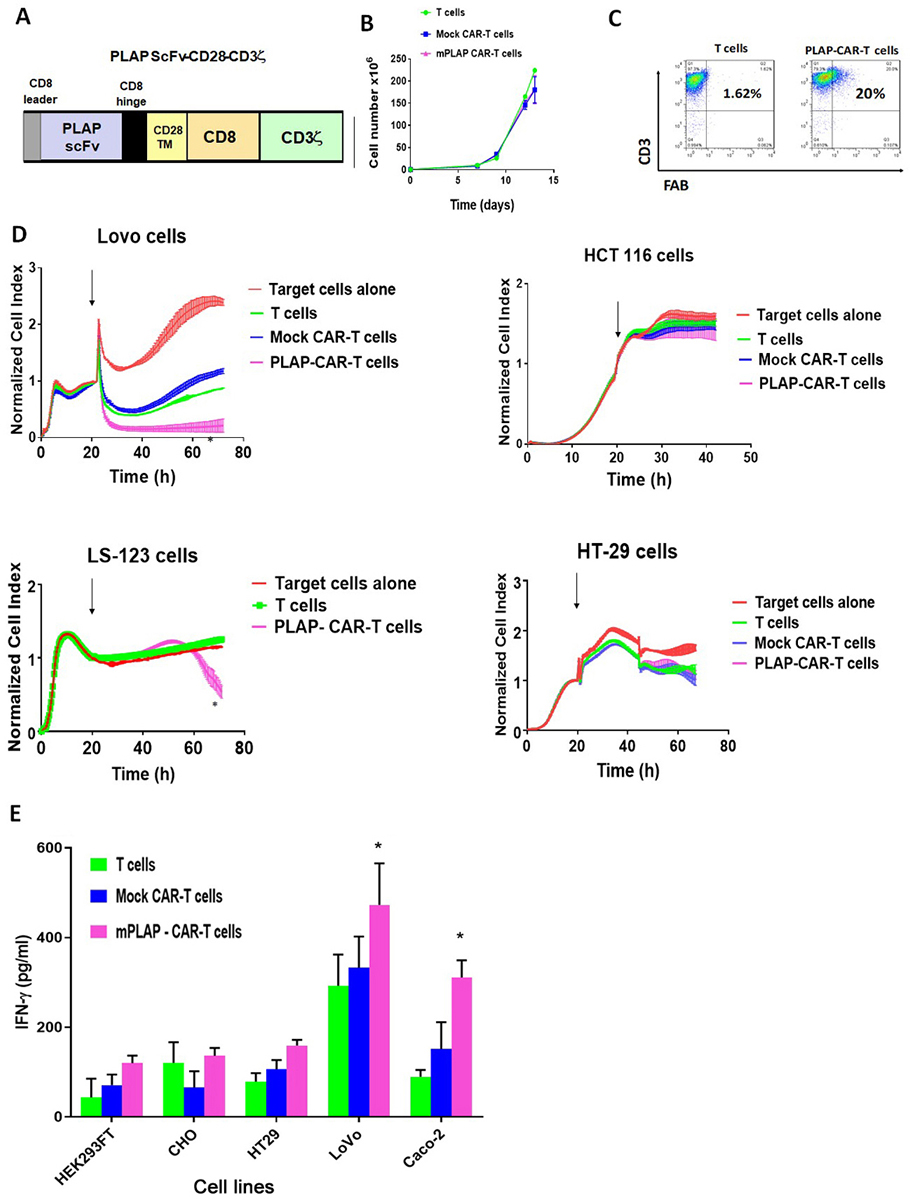 Figure 3
Mouse PLAP-CAR-T cells specifically kill PLAP-positive colon cancer cells. A. The scheme for the PLAP-CAR construct. CD8 alpha leader signaling peptide sequence; Mouse H17E2 antibody ScFv, single chain fragment variant; H, hinge region from CD8 alpha; TM, transmembrane domain from CD28 protein; CD28 costimulatory domain, and CD3 zeta activation domain. B. Expansion of PLAP-CAR-T cells. CAR-T cells expanded similarly to T and Mock-CAR-T cells. C. FACS analysis detected CAR-positive cells. FACS was performed with anti-CD3 and anti-F(ab)2 antibodies detecting extracellular CAR domain, as described in Materials and Methods. PLAP- CAR-T cells, and non-transduced T cells were analyzed by flow cytometry, using an APC-conjugated anti-CD3 monoclonal antibody (Y-axis) and anti-F(ab)2-PE antibody (X-axis), as described in Materials and Methods. D. RTCA assay with PLAP-CAR-T cells and PLAP-positive and negative cells. PLAP-CAR-T cells killed PLAP-positive colon cancer cells. Impedance-based real-time cytotoxicity assay (RTCA) was used as described in Materials and Methods. The normalized cell index on Y-axis is shown over time (X-axis) with addition of non-transduced T cells, mock CAR-T cells and PLAP-CAR-T cells. Arrow shows addition of effector cells to target cells. Left panels: PLAP-positive cell lines; right panels: PLAP-negative cell lines. All samples were analyzed in triplicate; average cell index ± standard errors are shown. *p<0.05, percent of cytotoxicity calculated as described in Materials and Methods of PLAP-CAR-T cells versus T cells. E. CAR-T cells secreted significant amounts of IFN-gamma when incubated with PLAP-positive target cells. All samples analyzed in triplicate. Bars show average level of IFN-gamma ± standard errors. * p<0.05, PLAP-CAR-T cells versus T cells, Student’s t-test.
PLAP-CAR-T cells were used in a Real-time cytotoxicity assay (RTCA) with PLAP-positive target colon cancer cell lines: Lovo, and LS-123; and with PLAP-negative colon cancer cell lines: HT29, and HCT116 (Figure 3D). PLAP-CAR-T cells caused significant killing against target Lovo and LS-123 colon cancer target cells in comparison with normal T cells and Mock CAR-T cells but did not have significant killing activity with PLAP-negative HCT116 and HT29 colon cancer cell lines (Figure 3D). In addition, all CAR-T cells secreted significant levels of IFN-gamma when mixed with PLAP-positive Lovo and Caco-2 target colon cancer cell lines but not against PLAP-negative HT29 colon cancer cell line (Figure 3E). There was also no significant secretion of IFN-gamma in the presence of control normal HEK-293 and CHO cell lines (Figure 3E). These data show specific cytotoxic activity of PLAP-CAR-T cells against PLAP-positive colon cancer cell lines.
We next humanized mouse PLAP ScFv and generated humanized PLAP-CAR-T cells by transducing PBMC cells (Figure 4 A). The humanized PLAP h2 and PLAP h4 CAR-T cells respectively contained > 44% and 51 % CAR-positive cells as detected by FACS with F(ab)2 antibody (Figure 4B). To confirm the specificity of the humanized PLAP-CAR-T cells for PLAP antigen, we performed FACS using biotinylated PLAP recombinant protein (Figure 4C). Biotinylated PLAP protein recognized the PLAP-CAR-T cells as well as FAB antibody, demonstrating specific binding of humanized PLAP-ScFv CAR to PLAP antigen (Figure 4 C). FACS analysis with antibodies to CD62L, CD45RO and F(ab)2 detected different T cell subtypes in the CAR-T cell population with a high proportion of memory type subsets: Tcm (CD62L+CD45RO+) and Tem (CD62L-CD45RO+) (Figure 4 D).
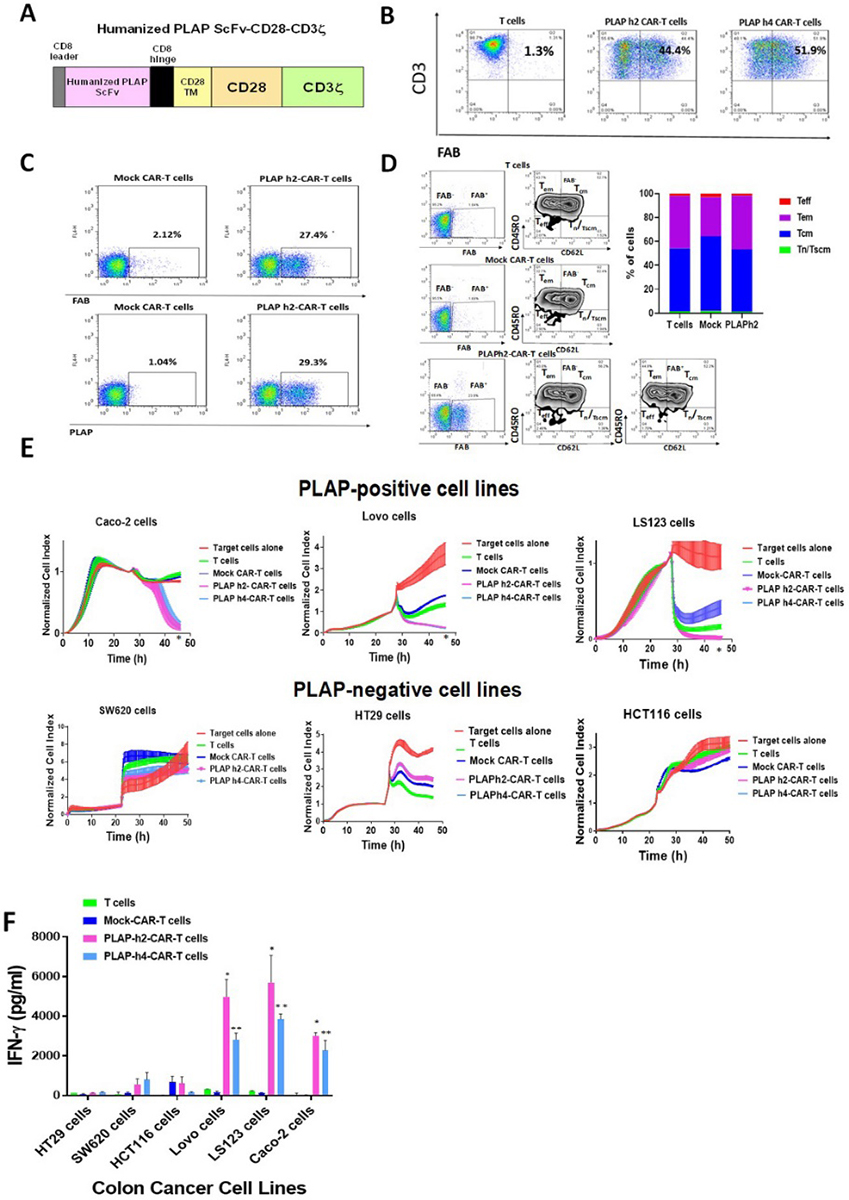 Figure 4
Humanized PLAP-CAR-T cells specifically kill PLAP-positive cancer cells. A. The scheme of humanized PLAP ScFv (clone H17E2)-CAR lentiviral construct. Different clones of humanized ScFv were used for the further experiments (clone 2 and clone 4, called h2 and h4). B. FACS analysis of PLAP h2- and PLAP h4-CAR-T cell cultures. Positive cells expressing CAR were detected by FACS with anti-F(ab)2 antibody as described in Materials and Methods. APC-conjugated anti-CD3 monoclonal antibody staining is shown on Y-axis and anti-F(ab)2-PE antibody on X-axis. C. Humanized PLAP- CAR-T positive cells were detected by FACS with biotinylated recombinant PLAP protein. The recombinant PLAP protein detected humanized PLAP-CAR-positive cells as well as anti-F(ab)2 antibody. Upper panel shows staining with anti-F(ab)2 antibody. Lower panel shows staining with recombinant PLAP protein. D. Different subsets of T cells were detected by FACS staining of PLAPh2-CAR-T cells with anti-F(ab)2, CD62L and CD45RO antibodies. The cells were stained with anti-mouse F(ab)2, CD62L, CD45RO antibodies. The gating was done first on F(ab)2-positive (marked FAB+) and F(ab)2-negative cells. T cells and Mock-CAR-T cells were mostly FAB-negative cells. PLAP-CAR-T cells had >20% FAB+ cells. The gating (left panels) and quantification of Tn/Tscm (CD62+CD45RO-), Tcm (CD62+CD45RO+), Tem (CD62-CD45RO+) and TEF (CD62-CD45RO-) T/CAR-T cells are shown. T cells, Mock-CAR-T cells and PLAPh2-CAR-T cells are shown. The right panel shows graphic quantitation of each T cell subset in T, Mock and PLAP+-CAR-T cells. Data are representative FACS from three independent experiments. E. Humanized PLAP-CAR-T cells specifically killed colon cancer cells. Upper panels show real-time cytotoxicity with PLAP-positive colon cancer cells lines, and lower panels show cytotoxicity with PLAP-negative colon cancer cell lines as described in Materials and Methods. Each sample is analyzed in triplicate, and average normalized cell index ±standard error is shown at each time point. *p<0.05, PLAP-CAR-T cells versus Mock CAR-T cells by Student’s t-test. F. Humanized PLAP-CAR-T cells secreted significant levels of IFN-gamma when co-cultured with PLAP-positive colon cancer cell lines in contrast to Mock-CAR-T cells and T cells. There were no significant levels of IFN-gamma against PLAP-negative colon cancer cell lines. p<0.05, PLAP-CAR-T cells versus Mock CAR-T cells by Student’s t-test.
Humanized PLAP-CAR-T cells significantly killed PLAP-positive cells as compared to Mock control CAR-T cells and did not significantly kill PLAP-negative cells in the RTCA assay (Figures 4 E). In addition, humanized PLAP-CAR-T cells secreted significant levels of IFN-gamma in the presence of PLAP-positive colon cancer cells but not against PLAP-negative colon cancer cells (Figure 4F). These data show that humanized PLAP-CAR-T cells specifically and effectively killed PLAP-positive colon cancer cells.
We analyzed hPLAP-CAR-T cell efficacy in a Lovo xenograft NSG mouse model in vivo (Figure 5). Lovo cancer cells were injected subcutaneously into NSG mice, and then CAR-T cells were injected intravenously after 1, 7 and 13 days. Humanized PLAP h2- and PLAP h4-CAR-T cells significantly decreased Lovo xenograft tumor growth (Figure 5A). Tumor sizes were also reduced by the humanized PLAP-CAR-T cells (Figure 5B). The mouse body weight was not decreased by hPLAP-CAR-T cells suggesting absence of major toxicity (Figure 5C). Human T cells and hPLAP-CAR-T cells were detected in mouse blood with anti-human CD3 antibody at day 16 demonstrating persistence of humanized PLAP-CAR-T cells in vivo (Figure 5D).
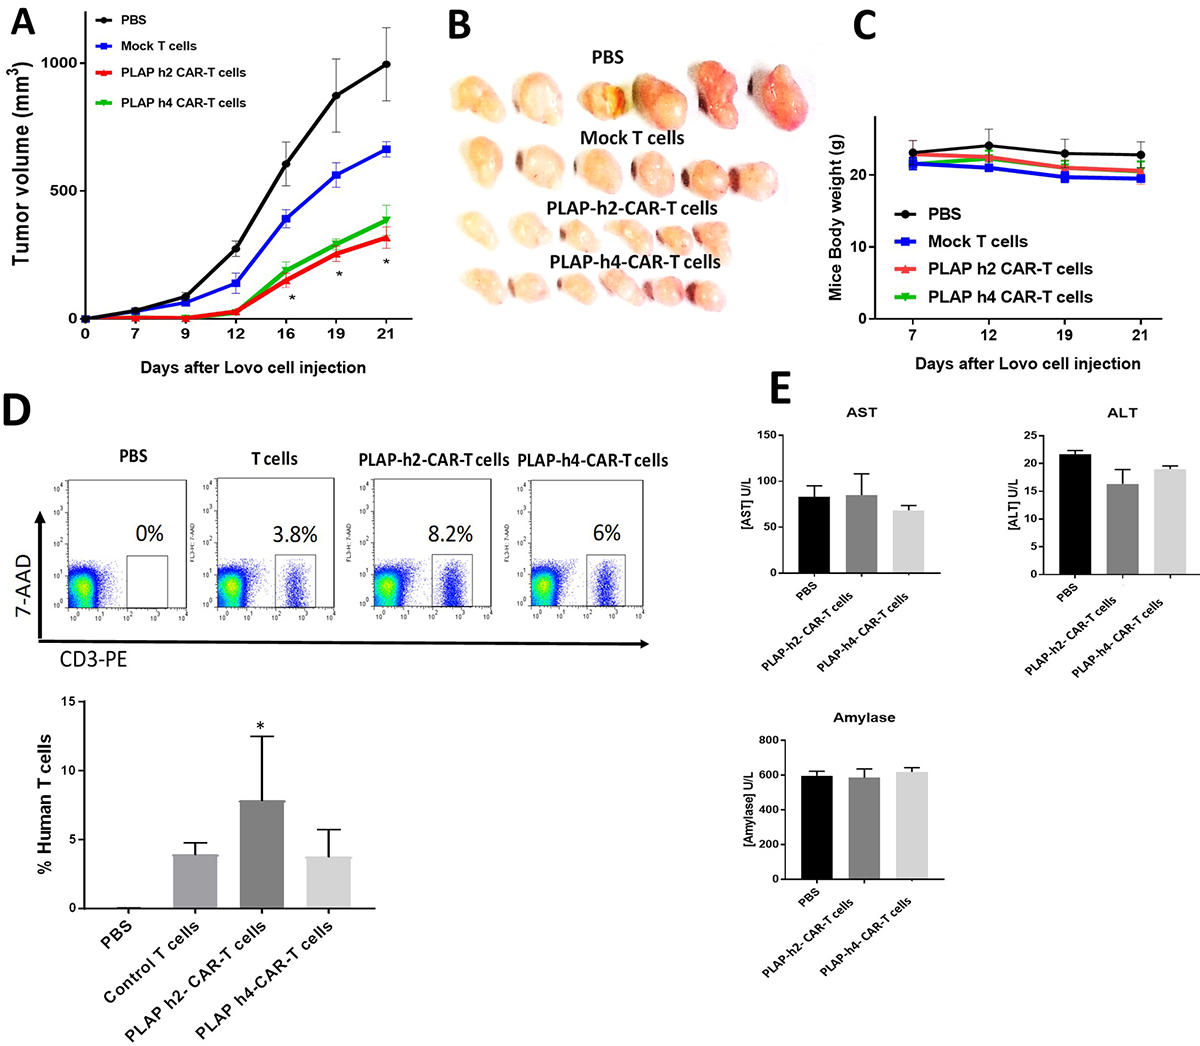 Figure 5
Humanized PLAP-CAR-T significantly decrease colon cancer xenograft tumor growth. A. Humanized PLAP-CAR-T cells significantly decreased Lovo xenograft tumor growth. The tumor volume of CAR-T cell-treated mice was significantly less than tumor volume of Mock CAR-T cell-treated mice. p<0.05, PLAP-CAR-T cell-treated versus control Mock CAR-T cell treated mice, Student’s t-test. B. The size of humanized PLAP-CAR-T cell-treated tumors was less than tumors of control mice. C. Mouse body weight was not affected by PLAP-CAR-T cell treatment. D. Human T cells were detected in blood of CAR-T cell treated mice by FACS with anti-human CD3 antibody. The Y-axis shows staining with 7-Aminoactinomycin D (7-AAD), a DNA-intercalating agent (7-AAD+ dead cells were gated out prior to analysis). The representative FACS is shown on upper panel. The percentage of human T cells is shown on lower panel; * PLAP h2 CAR-T cells vs control T cells p<0.05 by 1-way ANOVA with Tukey’s post-test. E. AST, ALT, and amylase levels in the mouse blood were not significantly affected by treatment with humanized PLAP-CAR-T cells. The samples were analyzed as described in Materials and Methods.
To further test for the toxicity of the CAR-T cells, we analyzed the levels of several indicative enzymes in the mouse blood serum: AST, ALT and amylase (Figure 5 E). The absence of any obvious effects of the CAR-T cells on these enzyme levels suggested the absence of any significant toxic effects. These results indicate that PLAP-CAR-T cells have high efficacy in the in vivo xenograft model with no obvious toxicity.
We evaluated the expression of PD-L1 on colon cancer target cells in response to hPLAP- CAR-T cells when they were co-cultured for 24 hours (Figure 6A). We also used IFN-gamma, an agent known to induce PD-L1 in cancer cells (36), as a positive control for PD-L1 induction. The PLAP-negative HT29 and HCT116 cells activated PD-L1 in response to hPLAP-CAR-T cells similarly as in response to T cells, Mock-CAR-T cells and IFN-gamma (Figure 6A). In contrast, PLAP-positive Lovo cells and LS123 cells significantly up-regulated PD-L1 in response to CAR-T cells substantially higher than in the response to T and Mock CAR-T cells, and even higher than the response to IFN-gamma (Figures 6A). These data show that hPLAP-CAR-T cells caused significant up-regulation of PD-L1 in PLAP-positive Lovo-1 and LS123 target cancer cells compared to Mock-CAR-T cells. The hPLAP-CAR-T cells did not cause significant up-regulation of PD-L1 in PLAP-negative HCT116 and HT29 target colon cancer cells compared with Mock-CAR-T cells and non-transduced T cells.
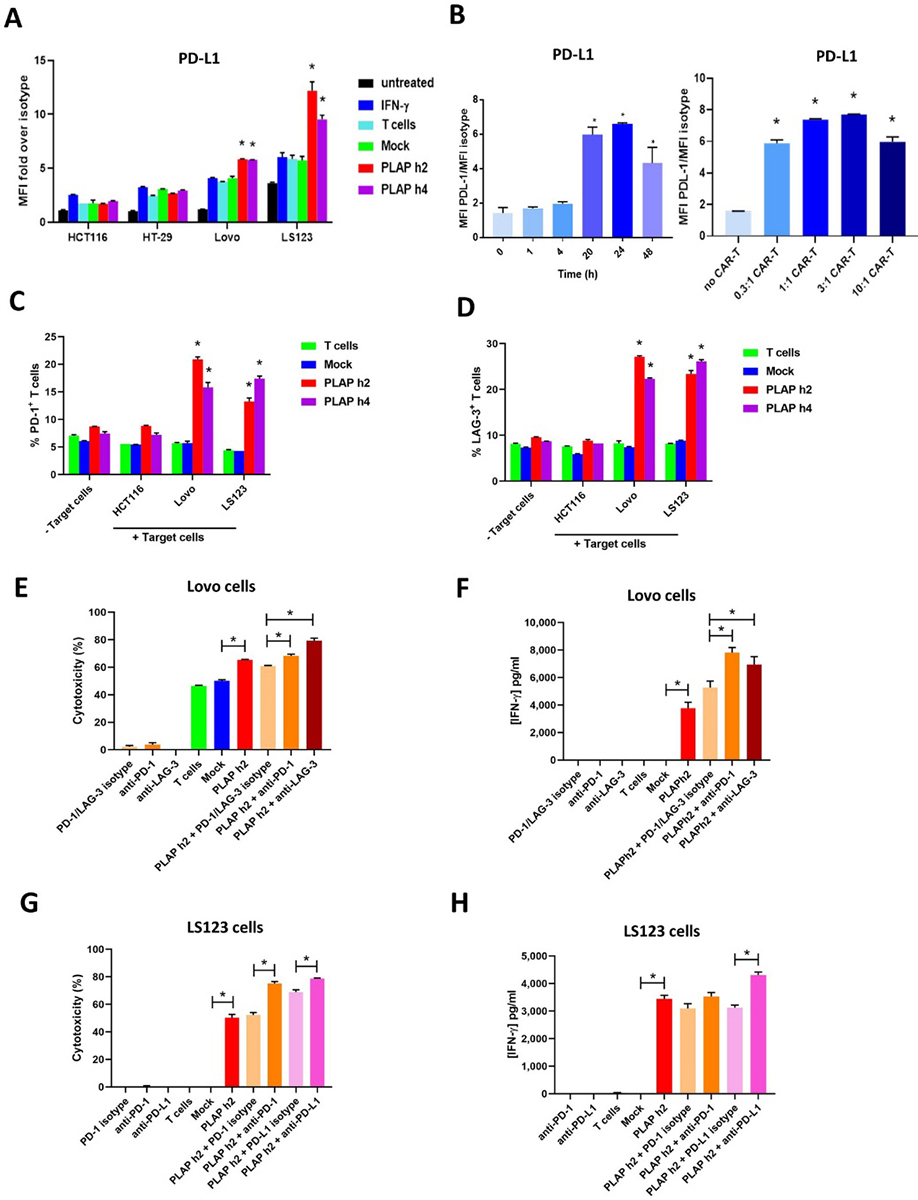 Figure 6
Combination of hPLAP-CAR-T cells with anti- PD-1, LAG-3 or PD-L1 antibody significantly increased activity of CAR-T cells against PLAP-positive colon cancer cells. A, PD-L1 expression in PLAP-positive and PLAP-negative colon cancer cell lines before and after hPLAPh2 and PLAP-h4 CAR-T-cell treatment. Addition of IFN-gamma (20/ng/ml) was used as a positive control for PD-L1 induction. MFI fold over isotype is shown. * p<0.05 by Student’s t test, PLAP-CAR-T cells versus IFN-gamma. B. Time- and dose-dependent induction of PD-L1 expression in Lovo cancer cells in response to hPLAP h2-CAR-T cell co-culture. Left panel shows time-dependent induction of PD-L1, and right panel shows dose-dependent induction of PD-L1 in Lovo cells after co-incubation with PLAP h2-CAR-T cells. C, PD-1 expression is induced in effector T cells after co-culture with PLAP-positive target cells: HCT116 cell line was used as PLAP-negative cell line. FACS analysis was done with the anti-PD-1 antibody before and after co-incubation with target cells. PD-1 level is significantly increased in effector cells after co-incubation with PLAP-positive target cell lines. * p<0.05, hPLAP-h2 and PLAP-h4 CAR-T cells versus Mock-CAR-T cells. Student’s t-test. D. LAG-3 expression is significantly upregulated in effector T cells after co-incubation with PLAP-positive Lovo and LS123 colon cancer cells. HCT116 cell line was used as PLAP-negative cell line. * p<0.05, hPLAP-CAR-T cells versus Mock-CAR-T cells. Student’s t-test. E, F. Combination of hPLAP-h2-CAR-T cells with PD-1 or LAG-3 antibody increases activity of hPLAP-CAR-T cells against PLAP-positive Lovo target cells. E. RTCA assay was performed with PLAPh2-CAR-T cells and with Lovo target cells either alone or in combination with PD-1 or LAG-3 antibody. Isotype control antibody was used as a negative control. F. Secretion of IFN-gamma by PLAP-CAR-T cells is significantly increased by co-culturing in the presence of anti-PD-1 or LAG-3 antibodies. *p<0.05, Student’s t-test PLAP-CAR-T cells plus PD-1 or LAG-3 antibody vs PLAP-CAR-T cells plus isotype antibody. G, H. Combination of hPLAP-h2-CAR-T cells with PD-1 or PD-L1 antibody increases activity of hPLAP-CAR-T cells against PLAP-positive LS123 target cells. G. RTCA assay was performed with PLAPh2-CAR-T cells with LS123 target cells either alone or in combination with PD-1 or PD-L1 antibody. *p<0.05, Student’s t-test, PLAP-CAR-T cells vs Mock-CAR-T cells or PLAP-CAR-T cells plus PD-1 Ab or PD-L1 antibody vs PLAP-CAR-T cells plus isotype antibody. H. Secretion of IFN-gamma by PLAP-CAR-T cells is significantly increased by co-culturing with LS123 cells in the presence of anti-PD-1 or PD-L1 antibodies. *p<0.05, Student’s t-test PLAP-CAR-T cells vs Mock-CAR-T cells; PLAP-CAR-T cells plus PD-L1 antibody vs PLAP-CAR-T cells plus isotype antibody.
Since Lovo cells had low levels of PD-L1 in untreated cells (Figure 6A), we focused on PD-L1 up-regulation in this colon cancer target cell line in response to PLAP-CAR-T cells in more detail. The expression of PD-L1 in Lovo cells was low at one and 4 hours after addition of hPLAP-CAR-T cells and resulted in significant up-regulation of PD-L1 only at 20-24 hours with no further increase at 48 hours (Figure 6B, left panel). We added different ratios of hPLAP-CAR-T cells to target Lovo cells, co-cultured for 24 hours, and then measured the dose-dependent response in terms of PD-L1 up-regulation in the target cells (Figure 6B, right panel). PD-L1 was significantly up-regulated even at low concentrations of hPLAP-CAR-T cells (Effector to target Lovo cell ratio, E: T=0.3:1) (Figure 6B, right panel).
To evaluate up-regulation of checkpoint proteins in effector cells after co-incubation of hPLAP-CAR-T cells with colon cancer cells, we measured the expression of checkpoint proteins: PD-1 and LAG-3 (Figure 6 C, D). Both PD-1 and LAG-3 were significantly up-regulated in hPLAP-CAR-T cells after co-culturing with PLAP-positive Lovo and LS123 PLAP-positive colon cancer target cells, as compared to either no target cells or co-culture with mock effector T cells (Figures 6 C, D). The PD-1 protein level was significantly up-regulated after co-culturing of hPLAP-CAR-T cells with PLAP-positive Lovo cells and LS123 cells but not with PLAP-negative HCT116 cells (Figure 6C). There was no significant up-regulation of PD-1 level after co-culturing control Mock-CAR-T cells with PLAP-positive target Lovo and LS123 colon cancer target cells (Figure 6C). LAG-3 was also significantly upregulated after co-culturing with Lovo and LS123 cancer cell lines but not with PLAP-negative HCT116 cells (Figure 6D). Thus, Lovo-1 and LS123 colon cancer cells up-regulated PD-L1 after co-culturing with hPLAP-CAR-T cells, and effector cells up-regulated PD-1 or LAG-3 expression after co-culturing with PLAP-positive cancer cells.
To test the effect of the further checkpoint inhibitors on killing of PLAP-positive Lovo cancer cells in combination with hPLAP-CAR-T cells, we used hPLAP-h2-CAR-T cells in combination with either an anti-PD-1 or an anti-LAG-3 antibody and performed an RTCA assay with Lovo as target cells (Figure 6E). There was significant up-regulation of activity by hPLAP-CAR-T cells in combination with PD-1 or LAG3 antibody versus hPLAP-CAR-T cells alone, or versus PD-1 or LAG3 antibody alone (Figure 6E). The combination of Lovo target cells and hPLAP-CAR-T effector cells with either PD-1 antibody or LAG-3 antibody significantly increased secretion of IFN-gamma as compared to treatment of Lovo cells with hPLAP-CAR-T cells and a control isotype antibody or checkpoint inhibitors alone (Figure 6F). There was no increased activity of hPLAP-h2-CAR-T cells against PLAP-negative HCT116 cells (not shown).
In addition, we analyzed the effect of combination of hPLAP-h2-CAR-T cells with PD-1 or PD-L1 antibodies on killing of LS-123 cells (Figure 6G). Both PD-1 and PD-L1 antibodies increased cytotoxic activity of PLAP-CAR-T cells against LS123 cells versus hPLAP-CAR-T cells alone with isotype antibody (Figure 6G). In addition, the combination of hPLAP-CAR-T cells and PD-L1 antibody treatment significantly increased IFN-gamma secretion as compared with hPLAP- CAR-T cells alone with isotype antibody (Figure 6H). This clearly shows that the combination of hPLAP-CAR-T cells with checkpoint inhibitors enhanced the efficacy of hPLAP-CAR-T cell-based therapy against colorectal cancers.
This report demonstrates, for the first time, that CAR-T cells targeting PLAP antigen can be effective in the treatment of PLAP overexpressing colorectal cancers. The fact that PLAP is not expressed in normal tissues other than testis and placenta ensures that CAR-T cell therapy is effectively cancer specific. Thus, we have shown that PLAP-CAR-T cells specifically decreased the viability of PLAP-positive colorectal but not PLAP-negative cancer cells (Figure 7). In addition, as a sign of their immune activation, PLAP-CAR-T cells secreted significant levels of IFN-gamma after co-incubation with PLAP-positive colon cancer cells but not after co-incubation with PLAP-negative cancer cells. We also have also shown that humanized PLAP-CAR-T cells had high specific killing activity against PLAP-positive but not PLAP-negative colon cancer cells. Humanized PLAP-CAR-T cells also significantly decreased Lovo xenograft tumor growth in vivo. The fact that there was no increase in AST, ALT or amylase enzyme levels in mouse blood, and no decrease of mouse body weight, after treating mice carrying human colon cancer xenografts with hPLAP-CAR-T cells, demonstrated that there was no toxic effect of hPLAP-CAR-T cells in vivo.
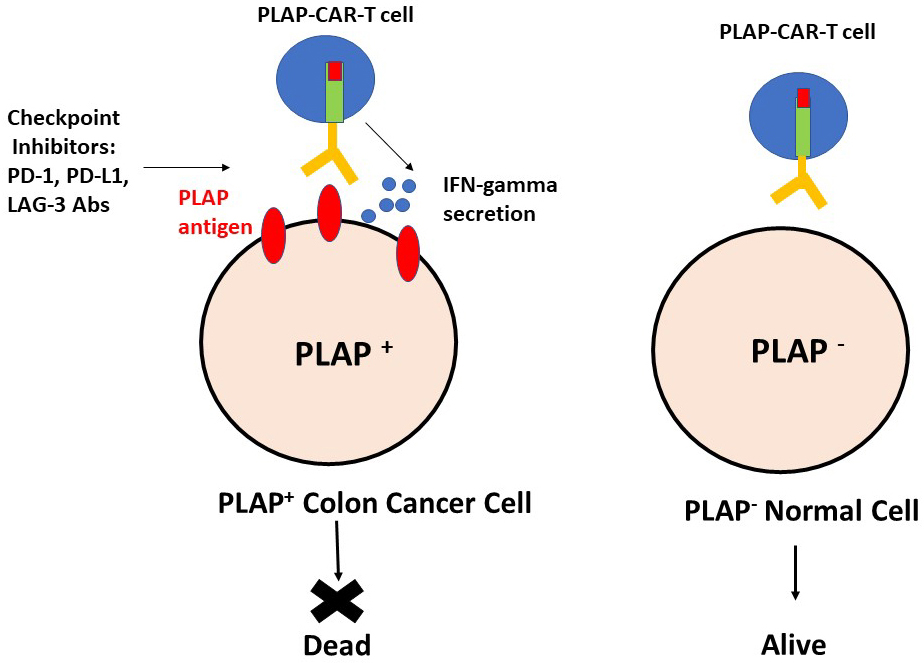 Figure 7
Specific activity of humanized PLAP-CAR-T cells against PLAP-positive colon cancer cells. Checkpoint inhibitors enhanced activity of PLAP-CAR-T cells against colon cancer cells.
Up-regulation of PD-1 on effector cells after co-culture with target cells has been demonstrated in several reports (17), (37). (38). As a consequence, it could be shown that inhibition of the PD-1/PD-L1 pathway with PD-1 antibody or CRISPR/Cas-9-mediated disruption of PD-1 in the effector T cells enhanced the cytotoxic activity of the effector CAR-T cells (38),(39). In agreement with these published results we have shown that combining hPLAP-CAR-T cell treatment with either anti-PD-1, PD-L1 or LAG-3 antibody checkpoint inhibitors increased the extent of CAR-T cell activity against PLAP expressing colon cancer cells (Figure 7). This shows that the combination of hPLAP-CAR-T cells and checkpoint inhibitors may be a good immunotherapeutic approach for the treatment of PLAP expressing solid tumors.
PLAP is overexpressed in about 20% of colorectal cancer derived cell lines (Figure 1), and a similar proportion of colorectal cancers (40), (41). Increased expression of secreted PLAP was found in serum samples from patients with PLAP expressing testicular cancers using sensitive immunoassays (21). This suggests that serum levels of PLAP could be used as a biomarker to detect PLAP-positive cancers. Radiolabeled PLAP antibody was used for imaging of PLAP expressing tumors and was even able to detect microscopic disease in the lymph nodes (22). Thus, a combination of serum detection of PLAP together with anti PLAP-based imaging may provide the basis for personalized PLAP-CAR-T cell therapy treatment of patients carrying early stage PLAP expressing cancers. Since PLAP has also been detected in ovarian (42),(23), (24), lung, pancreas and stomach tumors (43), testicular cancers (21) and teratomas, and has been shown to be present in exosomes of lung cancer patients (26), PLAP-CAR-T cell therapy should be applicable to a wide range of cancers in addition to colorectal cancer.
We would like to thank Dr. Janet Yuejuan Li for help with mouse xenograft experiments. V.G., R.B., H.Z., X.L, S.Y, Y.W, F.L., L.W. are employees of Promab Biotechnologies. VG is Volunteer Associate Clinical Professor, Department of Medicine, Oklahoma Health Sciences Center. WB is a Senior scientific adviser to Promab Biotechnologies.
PLAP
placental alkaline phosphatase
Chimeric Antigen Receptor
Single Chain Variable Fragment
Phosphate-Buffered