


Frontiers in Bioscience-Landmark (FBL) is published by IMR Press from Volume 26 Issue 5 (2021). Previous articles were published by another publisher on a subscription basis, and they are hosted by IMR Press on imrpress.com as a courtesy and upon agreement with Frontiers in Bioscience.

1 Department of Biotechnology, IIT Roorkee, Uttrakhand-247667, India
2 Department of Biology, York University, 4700 Keele Street, Toronto, Canada
Abstract
With rising antibiotic resistance at alarming rates in S. aureus, a major human pathogen, it is important to identify targets for new antimicrobial therapies. A number of two-component systems (TCS) have been implicated in S. aureus resistance to several antibiotics. The glycopeptide-resistance associated TCS, GraSR, is involved in cationic antimicrobial peptides (CAMPs) resistance through the regulation of mprF, dltABCD, and vraFG operons. GraS is a sensor histidine kinase, while GraR is a response regulator transcription factor, which is potential drug target. In lieu of the significance of GraSR in antibiotic resistance and the lack of structural studies on GraR, we undertook to determine the GraR structure through homology modelling. A series of small molecules were virtually screened and the top-scored molecules were analyzed for different pharmacophore properties and assessed for their binding potency to GraR (IC50). Further, a molecular dynamics simulation study of GraR-ligand complexes revealed that the predicted molecules exhibited good binding affinities at the dimerization interface of GraR. Thus, these molecules could be suitable inhibitors for the GraR-mediated signalling processes, which may be further utilized to develop novel antimicrobial agents against S. aureus.
Keywords
- Staphylococcus aureus
- Two-component system
- Histidine kinase
- Response regulator
- GraR
- CAMP
- Molecular Dynamics Simulation
Staphylococcus aureus is a Gram-positive coccus shaped bacterium, which is frequently found in the respiratory tract and on the skin of humans. As an opportunistic and commensal pathogen, it causes a number of diseases ranging from minor skin infections to life-threatening diseases such as pneumonia, endocarditis, meningitis, and toxic shock syndrome (1, 2). Due to the indiscriminate use of antibiotics, S. aureus have adapted to their use and have evolved resistance to most of the clinically used antibiotics, and are becoming a serious issue in hospital and community settings (1).
To the S. aureus infection, the host innate immune system uses the first line of defense to secrete cationic antimicrobial peptides (CAMP). CAMPs are amphipathic in nature, produced as a part of the host defense mechanism by the host epithelial, immune and skin cells (1, 3). Gram-positive bacteria counteract CAMPs through several resistance mechanisms, including proteolytic degradation, sequestration, cell surface modifications, and efflux. A number of these resistance mechanisms are controlled by two-component signal transduction systems (TCSs) (4). TCSs are abundantly present in bacteria and rare in archaea and eukaryotes, while markedly absent in metazoans (5).
Different bacterial species harbor various TCSs that are specialized in responding to a particular environment signal, such as pH, nutrient levels, osmotic pressure, redox state, quorum-sensing proteins, and antibiotics (6). Therefore, TCSs are perceived as attractive and potential targets for the development of novel antibacterial drugs. A specific inhibitor of TCS may be more effective than conventional antibiotics due to its unique mechanism of action; a specific TCS inhibitor is likely to have a narrow spectrum of action, hence the incidence of resistance may affect one pathogen but not the others (7).
In general, TCSs consists of a membrane-bound histidine kinase (HK) that acts as a sensor kinase and a cytoplasmic response regulator (RR) that often functions as a transcriptional regulator (6). The histidine kinase of a TCS responds to the external signal via its autophosphorylation and relays the information to RR through a phosphotransfer process that commences the cellular responses (5). A RR consists of a conserved N-terminal receiver domain (RD), which harbors the site for phosphorylation, a conserved aspartate residue, by its cognate histidine kinase, and a variable C-terminal effector domain (ED) which has a DNA binding motif (8). RRs exist in equilibrium between the active and inactive conformation, with the receiver domain serving as a molecular switch (9). The phosphorylation of the conserved aspartate residue causes structural and conformational changes that result in dimerization of the receiver domain and exposure of the DNA-binding motif in the ED (5, 8).
S. aureus resistance against CAMPs involves the increase of the positive charge on the bacterial cell surface. TCS GraSR mediates the modification of the bacterial cell surface charge. This TCS senses the presence of these peptides and regulates among the others, the expression of the operons mprF and dltABCD. Activation of these two operons leads respectively to the lysinylation of phosphatidyl-glycerol embedded into the cytoplasmic membrane and the D-alanylation of wall teichoic acid (WTA), which ultimately results in an overall positively charged cell surface. GraSR consists of GraS, a membrane-bound sensor kinase and GraR, a cytoplasmic response regulator that acts as a transcriptional regulator (6). In response to an extracellular signal(s), it is thought that GraS undergoes autophosphorylation at a conserved His residue in its cytoplasmic domain and thus it becomes active. Subsequently, to transduce the signal, the phosphoryl group of GraS is transferred onto a specific conserved aspartate residue of the receiver domain of GraR, Asp51. This phosphorylation step dimerizes GraR and modulates its transcriptional regulatory activity (6). Activation of GraR provides the resistance to S. aureus for CAMP through repulsion and expulsion mechanism (10). GraSR is also linked to the virulence and cell-wall metabolism (10). Sequence alignment analysis suggests that GraR belongs to the OmpR/PhoB family of RRs, which utilizes the conserved alpha4-beta5-alpha5 motif as the dimerization interface during their phosphorylation-induced activation (11, 12). Inhibition of the phosphorylation-induced dimerization in response regulators by small molecules was proposed as an effective way of inhibiting bacterial signal transduction (11). The 3-dimensional structure of GraR is not known; hence, it is unclear how the phosphorylation induced activation of GraR occurs. In this study, we used homology modeling to predict the 3-dimensional structure of GraR for the screening of novel compounds via virtual screening. Pharmacophore properties were assessed for the screened molecules. Molecular docking program AutoDock Tools and AutoDock Vina result infer that five novel compounds (ZINC000049170029, ZINC000095509204, ZINC000067688459, ZINC000049169934, and ZINC000095352231) interact with GraR with high binding affinities. These molecules are stabilized by hydrogen bonding, polar interaction, and hydrophobic interaction. In order to evaluate the interactions of these molecules with GraR, each respective complex was subjected to molecular dynamics (MD) simulation and molecular mechanic/Poisson-Boltzmann surface area (MMPBSA) binding free energy calculations. Our study suggests that these five novel molecules have the potential to interact in vivo with GraR.
Homology modeling was performed to construct the 3D structure of the GraR protein because its crystal structure is not available. Therefore, the GraR protein sequence from S. aureus was retrieved from UniProt database (UniProtKB - Q932F1) and the NCBI BLAST tool was used to determine the homologous structures (13, 14). The multiple sequence alignment of GraR from S. aureus with other homologous proteins, the structures of which are known, were generated using Clustal Omega and analyzed using ESPript3 (15, 16). Domains and motifs of GraR were assessed using various online tools and databases like InterPro, Prosite, and NCBI-Conserved domain database (17-19). The 3D homology model of GraR was predicted using the SWISS-Model server (https://swissmodel.expasy.org/) (20). Its calculation depends on the importance of threading template alignments and also the convergence parameters of the structure assembly simulations. The refinement of the disordered loops was performed using MODLOOP (21). The SWISS-PDB viewer was utilized for energy minimization of the modeled structure (22). The minimized model was validated by assessing the stereochemical quality using the various tools of SAVES server (http://nihserver.mbi.ucla.edu/SAVES/) such as PROCHECK, VERIFY3D, ERRAT and ProSA (23-26). PyMOL and chimera were used to visualize and analyze the validated model (27, 28). Furthermore, 3D- predicted model was validated by molecular dynamics using GROMACS 5.14 suite along with GROMOS54a7 force field on an Ubuntu-based workstation (29, 30).
Drug-like molecules were retrieved from ZINC DATABASE (https://zinc15.docking.org/) (31). Ligands were energy minimized by Universal Force Field (UFF) and converted to pdbqt format using Open Babel in PyRx0.8 for virtual screening (32, 33). Virtual screening was performed using PyRx0.8 along with VINA and the predicted binding affinity was calculated in kcal/mol (34). The grid for molecular docking was centered around Met90, Gly93, Ala94, Asp95, and Arg117 of interface residues of the protein. The grid center points were set at X=-46.4, Y=6.98, Z=26.8, and dimensions were as X=27.7, Y=28.9, and Z=28.7 with exhaustiveness 8. Further, poses with the highest binding affinity and the corresponding interactions were saved and analyzed in PyMOL (27).
The pkCSM web-server was used to determine the physicochemical and pharmacokinetic parameters such as molecular weight, total polar surface area, number of hydrogen bond donors and acceptors. The in-silico absorption, distribution, metabolism, excretion, and toxicity (ADMET) properties have been computed using pkCSM server (35). The ADMET profile of molecules was predicted by several factors such as water solubility, skin permeability, Caco-2 permeability, Human Intestinal absorption, P-glycoprotein substrate, the volume of distribution (VDss), cytochrome P450 323 2D6 inhibition, renal OCT2 substrate, total clearance, AMES toxicity, skin sensitization. XIAPin online web server tool (http://crdd.osdd.net/oscadd/xiapin/) was used to calculate the IC50 values of the most potent molecules.
The AutoDock 4.2.6. was utilized for docking of the screened molecules against GraR (36). Hydrogen atoms and Kollman charges were added on a protein using MGLTools. The hydrogen atoms and Gasteiger charges for ZINC000049170029 (1.99), ZINC000095509204 (2.00), ZINC000067688459 (2.00), ZINC000049169934 (2.00) and ZINC000095352231 (1.00) were added and saved in the pdbqt format. The chemical name and structures of the compounds are shown in Table 1. The grid map with a spacing of 0.375 Å was generated using AutoGrid4. The molecular docking grid was created around Met90, Gly93, Ala94, Asp95, and Arg117 of interface residues. The grid box dimensions and center point coordinates were set as 34 Å X 34 Å X 36 Å and -35.66, 9.138, -26.09, respectively. A Lamarckian genetic algorithm was utilized for molecular docking and the number of conformations were increased from 10 to 50. The highest binding and corresponding interactions pose were visualized and inspected in PyMOL (27). Moreover, HADDOCK web server is also utilized for the docking of ZINC000049170029, ZINC000095509204, ZINC000067688459, ZINC000049169934 and ZINC000095352231 with GraR (37-39). The protein and ligand interactions Figures were prepared using PyMOL, Chimera, and Maestro (Schrödinger Release 2017-4: Maestro, Schrödinger, LLC, New York, NY, 2017) (27, 28).
| S No: | ZINC ID | Chemical name | Chemical formula | Chemical structure |
|---|---|---|---|---|
| 1 | ZINC000049169934 | 1-Methyl-4-{(3S)-3-(5-(4-methylphenyl)-1,3,4-oxadiazol-2-yl)-1-pyrrolidinyl} piperidine | C19H26N4O | 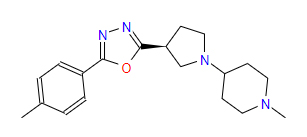 |
| 2 | ZINC000095352231 | 1-Cyclohexyl-3-{4-methyl-5-((2-methyl-1H-imidazol-1-yl)methyl)-4H-1,2,4-triazol-3-yl}piperidine | C19H30N6 | 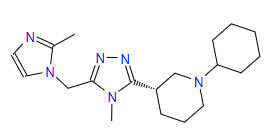 |
| 3 | ZINC000049170029 | 4-{(3S)-3-(5-(2-Methoxyphenyl)-1,3,4-oxadiazol-2-yl)-1-pyrrolidinyl}-1-methylpiperidine | C19H26N4O2 | 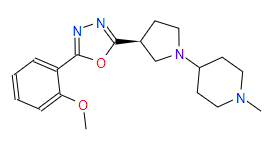 |
| 4 | ZINC000095509204 | 4-Methyl-6-(1-methyl-3-phenyl-1,8-diazaspiro(4.5)dec-8-yl)-2-pyrimidinamine | C20H27N5 | 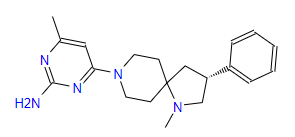 |
| 5 | ZINC000067688459 | N-{2-(3-(2-Pyridinyl)-1,2,4-oxadiazol-5-yl)ethyl}-3-azaspiro(5.5)undecan-9-amine | C19H27N5O | 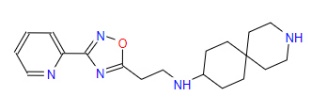 |
The atomistic dynamics and the binding stability of GraR–ligand complexes were studied using molecular dynamics simulation. The molecular simulation studies were done using the GROMOS96 54a7 force field along with SPC (simple point charges) water model in GROMACS 5.1.4. suite (29, 30). Topology of the inhibitors (ZINC000049170029, ZINC000095509204, ZINC000067688459, ZINC000049169934 and ZINC000095352231) were generated using PRODRG webserver (40). The systems were solvated in a triclinic box with a minimum of 2 nm marginal radii from the closest atom of protein and neutralize by adding the counter-ions (Na+). The dimensions and volume of the box were 9.91 X 7.93 X 9.1 nm and 718.04 nm3, respectively. The steepest descent algorithm was used for energy minimization to reduce the steric clashes. The energy minimization was performed using 50,000 iteration steps and the energy cut off was kept up to 10.0 kJmol-1. Two equilibration steps were performed: a constant number of particles, volume, and temperature (NVT) and a constant number of particle, pressure, and temperature (NPT) at 300 K. Berendsen temperature coupling method was used to regulate the temperature of the box. The first phase of the equilibration was done for 50,000 steps at 300 K; each step of 2 fs. Further, the next phase of equilibration was performed for 1 ns and coordinates were generated at every 1 ps. Particle Mesh Ewald (PME) with 1.6 Å Fourier grid spacing was used for calculation of Long-range electrostatics (41). The covalent bond constraints were done using the LINCS algorithm and coulomb interactions were calculated within a cut off the radius of 12 Å. The molecular dynamics simulation was run for 100 ns with a time step of 2 fs each and the trajectories were generated at every 10 ps. The RMSD, RMSF, Rg, SASA, number of hydrogen bonds were generated using g_rms, g_rmsf, g_gyrate, g_sasa, and g_hbond, respectively within in GROMACS (29).
The binding free energy of GraR-ligand complexes was determined using the g_mmpbsa tool (42). This software utilizes the Molecular Mechanics/Position-Boltzmann Surface Area (MMPBSA) method to calculate the binding free energy of interactions between protein-ligand complex. Here in this study, the trajectories for every 10 ps for the last 20 ns i.e. between 80 to 100 ns were collected to predict the binding energy.
The GraR sequence consisting of 224 amino acids was retrieved from the UniProt in the FASTA format (UniProtKB - Q932F1). NCBI Blast tool showed that GraR exhibits maximum sequence identity of 37 percent with NsrR (nisin resistance regulator protein) of Streptococcus agalactiae. The secondary structure of the GraR protein was predicted using PDBsum and shown in Figure 1. The functional domain of GraR, analyzed using Prosite, showed that GraR contained two conserved domains referred to as the N-terminal (receiver) and the C-terminal (effector) DNA-binding domain. Multiple sequence alignment of GraR along with the sequences of other homologous RRs, with known structures, was performed and generated using Clustal Omega and ESPript3, respectively, as shown in Figure 2 (15, 16).
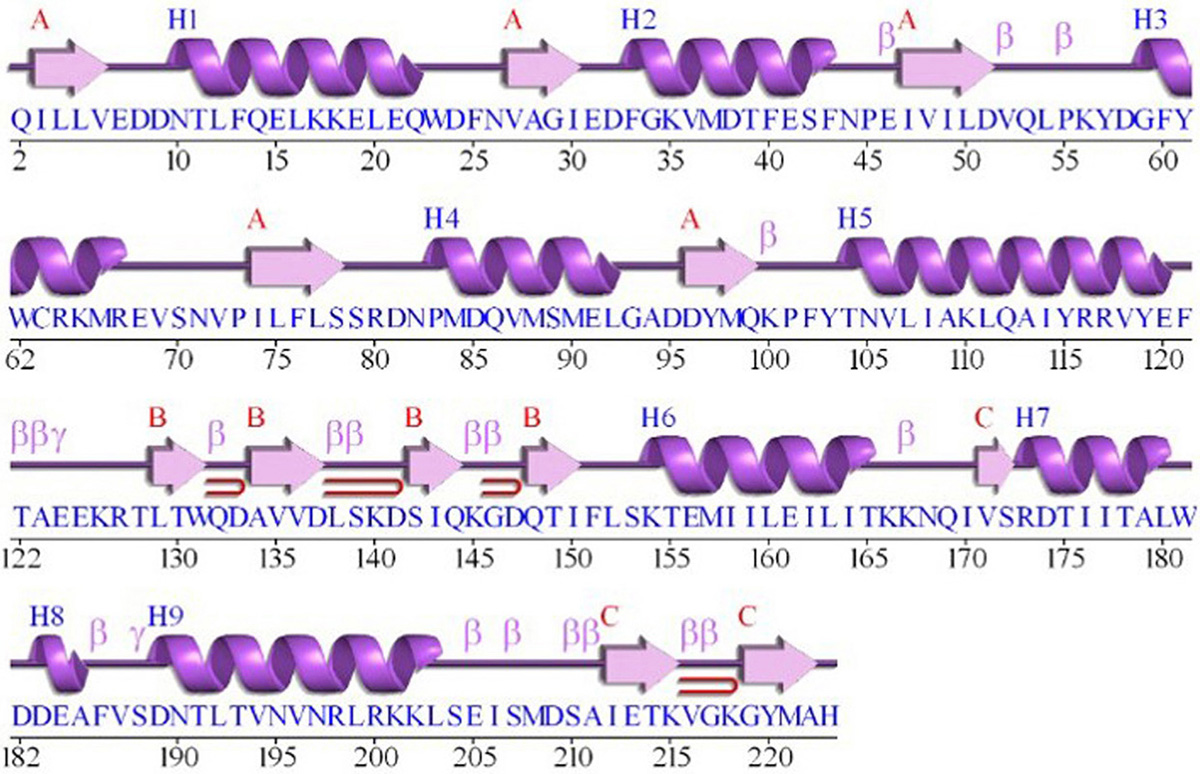 Figure 1
The secondary structure presentation of the GraR protein generated using PDBSum.
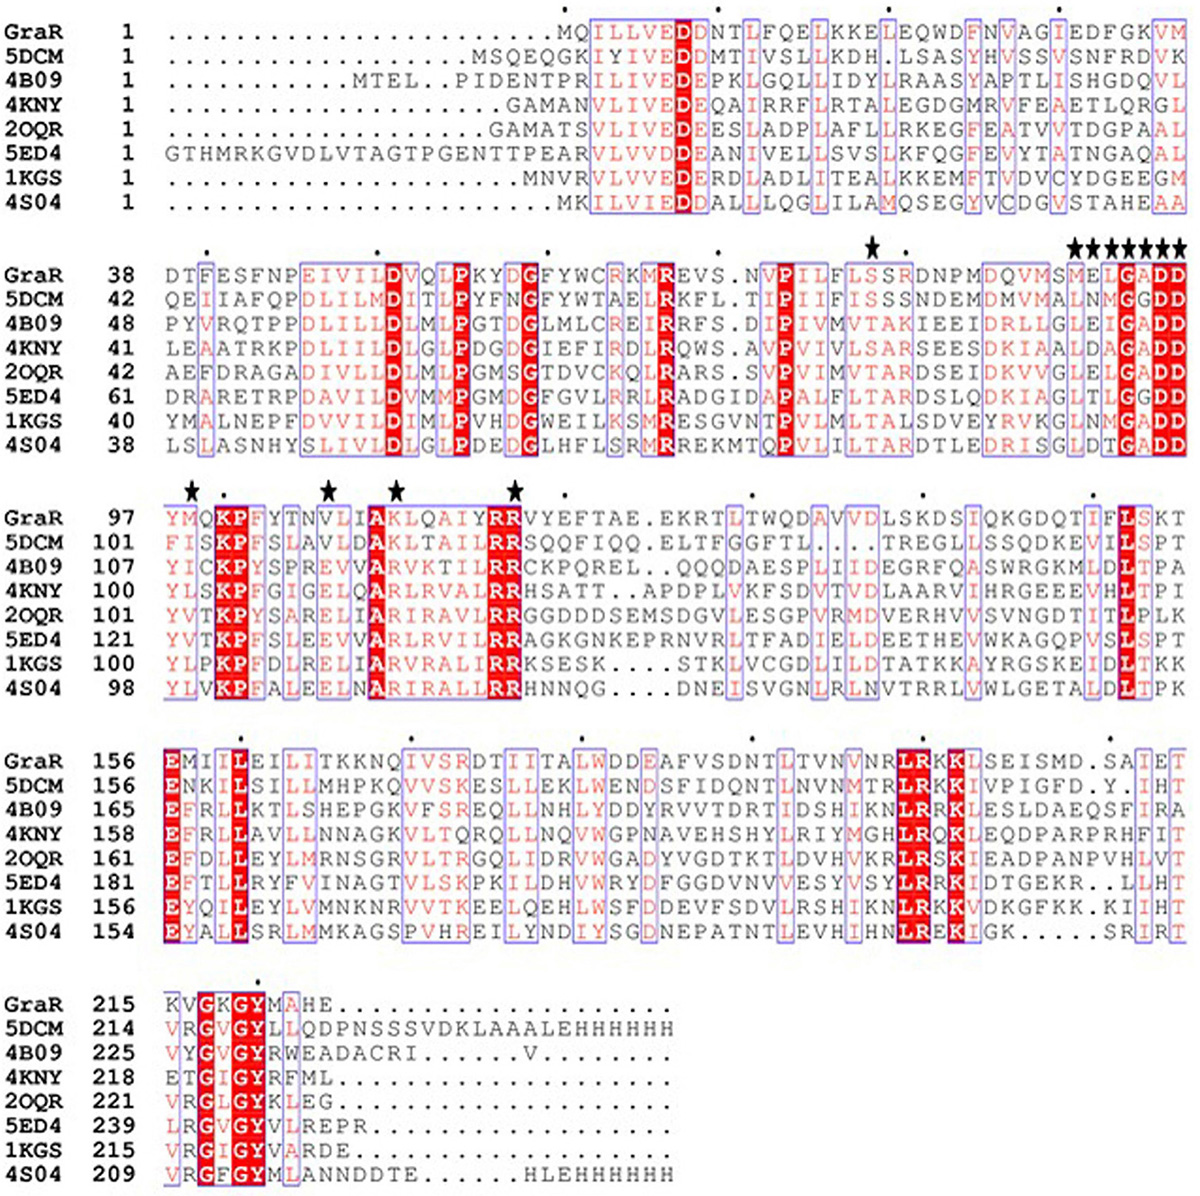 Figure 2
Multiple sequence alignment (MSA) of GraR from S. aureus with response regulators from different organisms. MSA was done using Clustal Ω, and ESPript 3 was used to generate the figure. The conserved residues are represented in red colour. The PDB ID 5DCM belongs to the C-terminal domain of the nisin resistance regulator NsrR from Streptococcus agalactiae; 4B09 belongs to the response regulator BaeR from Escherichia coli O6:H1; 4KNY belongs to the response regulator KdpE from Escherichia coli (strain K12); 2OQR: response regulator RegX3 from Mycobacterium tuberculosis; 5ED4 belongs to the response regulator PhoP from Mycobacterium tuberculosis; 1KGS belongs to the OmpR/PhoB homolog from Thermotoga maritima; and 4S04 belongs to the response regulator PmrA from Klebsiella pneumonia JM45.
The robust 3D model of GraR was generated from Swiss-Model web-server and represented as a cartoon in Figure 3. The constructed 3D structure was subjected to energy minimization using SWISS-PDB viewer, and the disordered regions were refined by ModLoop. SAVES server tools were used to check the quality and accuracy of the refined model. The Ramachandran plot of GraR generated by PROCHECK showed that 87.5 percent of the amino acid residues are in the most favoured region, 12 percent in the allowed region, and 0.5 percent in the disallowed region, as shown in Figure 4A, and Table 2. The modeled structure was analyzed using SAVES server. The quality factor of the model by ERRAT plot was 95.3 percent as shown in Figure 4B. VERIFY3D showed that the quality factor of 84.68 percent of amino acid residues has an average 3D-1D score greater than or equal to 0.2 as shown in Figure 4C. Further ProSA server gave a Z-score for the modeled and the template structure of -6.84 and -7.27, respectively. These Z-score values show that the predicted GraR structure is in good agreement with the structure of the experimentally determined homologous protein, as shown in Figure 5. The structural superposition of GraR modeled structure with the homologous structures has a Root Mean Square Deviation (RMSD) value of 0.11 Å for 181 C-alpha atoms. The model was subjected to the molecular dynamics using GROMACS. The RMSD plot shows that the model achieved convergence at 0.47 nm up to 34 ns and was stable throughout the simulation. The validated GraR model exhibited 224 amino acids along with 9 alpha helices (alpha1-alpha9) and 12 beta sheets (beta1-beta12) as shown in Figure 3. It consisted of two domains named as the N-terminal and the C-terminal DNA binding domain. The N-terminal domain (residues 1-121) is comprised of the central parallel beta sheets (beta 1-5) surrounded by alpha-helices alpha1 and alpha5 on one face and alpha2 to alpha4 on the other side. This domain also contained the highly conserved alpha4-beta5-alpha5 motif.
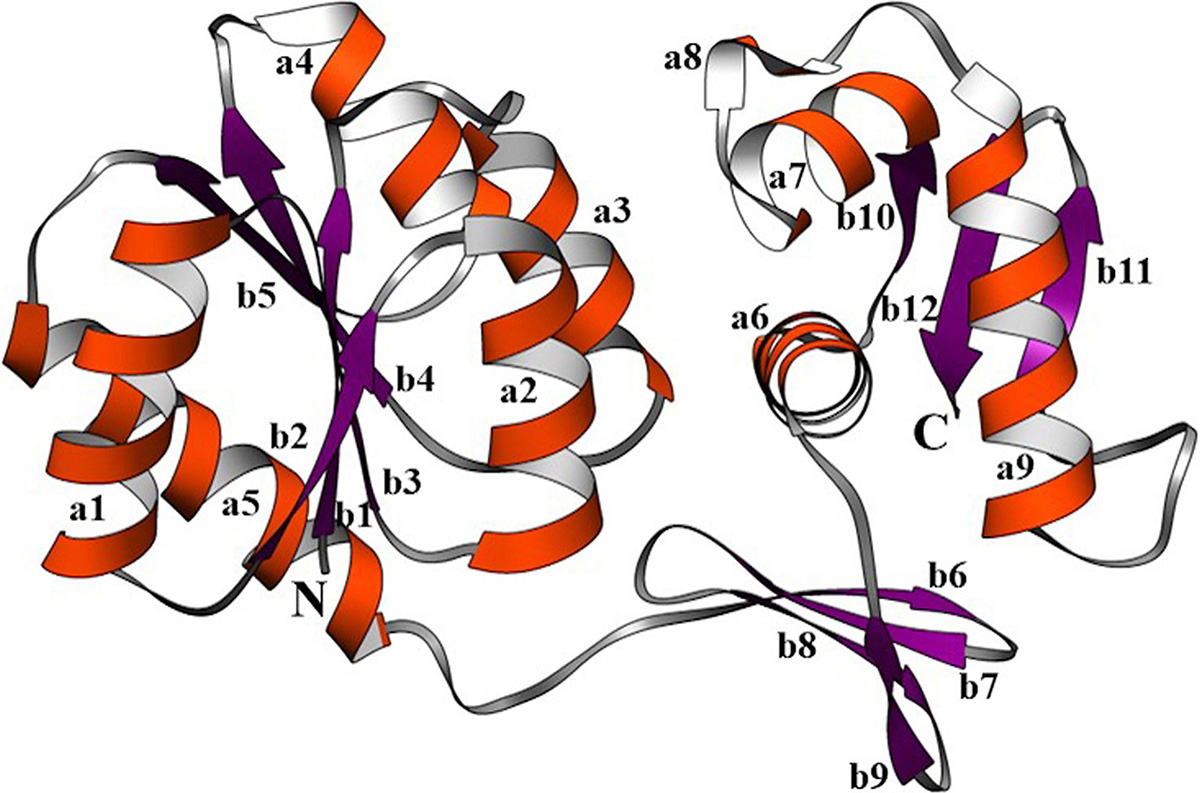 Figure 3
The computer-aided structure of GraR protein obtained from SWISS-MODEL and shown in ribbons using Chimera. The alpha-helices (a1-9), beta-sheets (b1-12), and loops are shown in orange, purple, and grey, respectively.
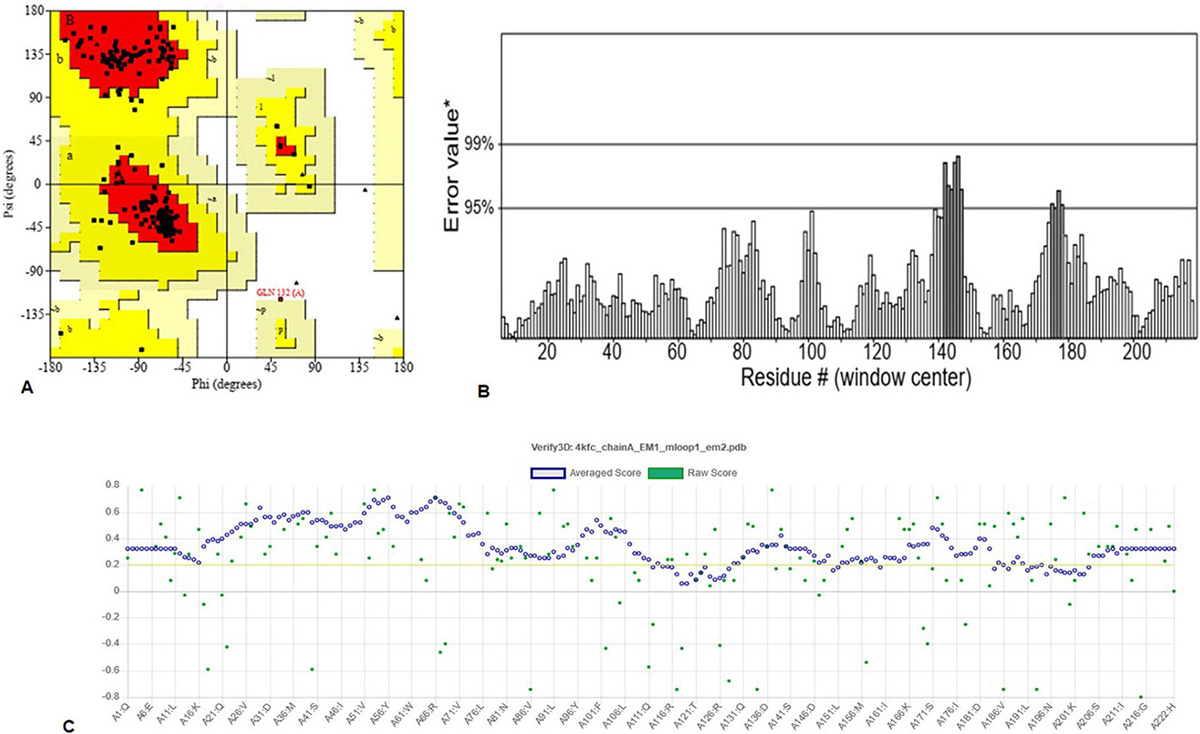 Figure 4
Assessment of the GraR model quality: (A) Ramachandran plot 3D model of GraR generated using PROCHECK. The most favoured region, allowed region, and disallowed region, is colored in red, yellow, and white, respectively. (B) ERRAT plot showing the quality of the GraR model. (C) The results obtained from the Verify-3D server, which calculated the compatibility of the 3D model with its 1D.
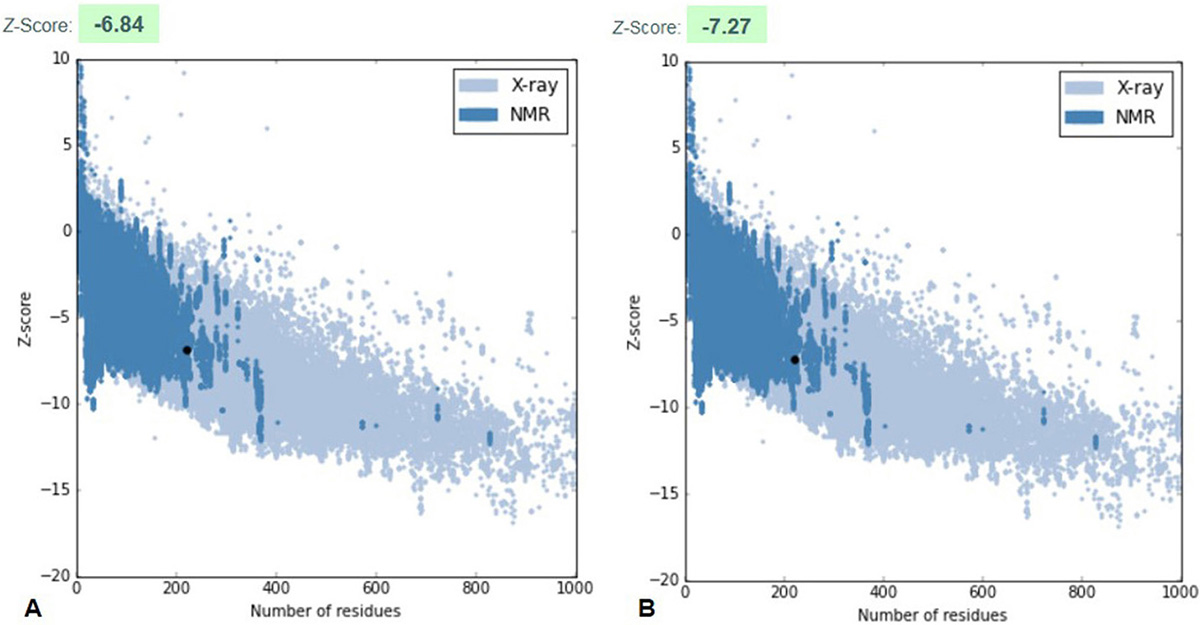 Figure 5
ProSA plot represents the overall quality of the model. (A) ProSA z-score of modeled GraR structure (B) ProSA z-score of the template, the response regulator KdpE structure from Escherichia coli (strain K12) (PDB ID: 4KFC).
| Ramachandran plot value | Percentage of residues |
|---|---|
| Most favoured regions | 87.5 |
| Additional allowed regions | 12.0 |
| Generously allowed regions | 0.0 |
| Disallowed regions | 0.5 |
Very interestingly, the alpha4-beta5-alpha5 motif was exposed to milieu. Normally, this motif is involved in intra-domain interactions in the other OmpR/PhoB proteins, such as PrrA and DrrD; interactions that hold the RR in an inactive state (43, 44). The C-terminal domain (residues 129-224) harbored the helix-turn-helix fold, which is a conserved feature among RRs and it is involved in DNA binding. This helix-turn-helix motif in GraR started with four-stranded antiparallel beta-sheets and was followed by a three-helix bundle and two stranded anti-parallel beta-sheets. Further, a loop of 7 residues (residues 122-128) connected both N- and C-terminal domains. Of note, the alpha 7-9 helices were predicted to be fully exposed to milieu by the GraR model, suggesting that unphosphorylated GraR should be able to bind to DNA. Indeed, Muzamal et al. showed that unphosphorylated GraR bound well to the promotor region of the vraFG operon (6).
Drug-like compounds in the sdf format were retrieved from the ZINC database. Downloaded molecules were converted into pdbqt format using Open Babel. These molecules were used for virtual screening against GraR model utilizing AutoDock Vina in PyRx0.8. AutoDock Vina generated nine distinct poses along with the binding affinity of each ligand. Ligands that had high binding affinity were selected and inspected along with the corresponding interactions in PyMOL.
The virtual molecules ZINC000049170029, ZINC000095509204, ZINC000067688459, ZINC000049169934, and ZINC000095352231 were predicted by pkCSM web-server (http://biosig.unimelb.edu.au/pkcsm/) to meet the Lipinski’s rule of five criteria and ADMET properties. All the above compounds have a molecular weight of less than 500 Da, a LogP less than 5, and H-bond acceptors and donors of less than 10 and 5, respectively (Table 3). Further, the ADMET profile of these molecules was evaluated using pkCSM to predict the overall risks of absorption, distribution, metabolism, excretion, and toxicity as shown in Table 4. All of the five compounds showed good water solubility and fulfill the skin permeability criteria. Likewise, all the compounds showed significant Caco-2 permeability and also showed good human intestinal absorption of more than 90 percent. The steady-state volume of distribution (VDss) and unbound plasma fraction of all the compounds were below 1.8 and 0.6, respectively. None of the five compounds were found to be an inhibitor for the Cytochrome enzyme. The total clearance value of all the compounds was below 0.9. All the compounds showed a negative AMES, which indicates that they are non-mutagenic and non-carcinogenic. The XIAPin online server predicts that the above compounds have IC50 values (the required amount of inhibitor to decline the enzymatic activity by 50 percent) in the range of 2.98 to 3.98 µM as shown in Table 3. Further, binding of these molecules to GraR was cross-checked using another molecular docking program.
| S No: | ZINC ID | Molecular Weight (Da) | LogP | Rotatable Bonds | H-bond Acceptors | H-bond Donors | IC50 (µM) |
|---|---|---|---|---|---|---|---|
| 1 | ZINC000049170029 | 342.443 | 2.6287 | 4 | 6 | 0 | 3.93 |
| 2 | ZINC000095509204 | 337.471 | 2.82552 | 2 | 5 | 1 | 2.98 |
| 3 | ZINC000067688459 | 341.459 | 2.5761 | 5 | 6 | 2 | 3.56 |
| 4 | ZINC000049169934 | 326.444 | 2.92852 | 3 | 5 | 0 | 3.98 |
| 5 | ZINC000095352231 | 342.491 | 2.88042 | 4 | 6 | 0 | 3.62 |
| Provide title | Properties | ZINC0000 |
ZINC0000 |
ZINC0000 |
ZINC0000 |
ZINC0000 |
|---|---|---|---|---|---|---|
| Absorption | Water solubility | -2.575 | -2.785 | -2.603 | -2.852 | -2.645 |
| Caco-2 permeability | 0.895 | 1.292 | 1.163 | 0.982 | 0.998 | |
| Intestinal absorption (human) | 96.317 | 94.691 | 94.777 | 90.758 | 93.625 | |
| Skin Permeability | -2.886 | -3.01 | -2.976 | -2.907 | -3.023 | |
| P-glycoprotein substrate | Yes | Yes | Yes | Yes | Yes | |
| P-glycoprotein I inhibitor | No | No | Yes | No | No | |
| P-glycoprotein II inhibitor | No | No | No | No | No | |
| Distribution | VDss (human) | 0.059 | 1.793 | 1.522 | 1.012 | 1.039 |
| Fraction unbound (human) | 0.524 | 0.345 | 0.317 | 0.549 | 0.597 | |
| CNS permeability | -2.944 | -2.149 | -2.47 | -2.027 | -2.978 | |
| Metabolism | CYP2D6 substrate | No | No | No | No | No |
| CYP1A2 inhibitor | Yes | Yes | Yes | No | Yes | |
| CYP2C19 inhibitor | No | No | No | No | No | |
| CYP2C9 inhibitor | No | No | No | No | No | |
| CYP3A4 inhibitor3 | No | No | No | No | No | |
| Excretion | Total Clearance | 0.781 | 0.735 | 0.696 | 0.63 | 0.866 |
| Renal OCT2 substrate | No | Yes | Yes | No | No | |
| Toxicity | AMES toxicity | No | No | No | No | No |
| Max. tolerated dose (human) | 0.112 | -0.513 | -0.498 | -0.823 | -0.513 | |
| Oral Rat Acute Toxicity (LD50) | 2.659 | 3.072 | 2.818 | 2.596 | 3.054 | |
| Oral Rat Chronic Toxicity (LOAEL) | 1.597 | 1.423 | 1.45 | 1.043 | 0.564 | |
| Skin Sensitisation | No | No | No | No | No | |
| Minnow toxicity | 1.735 | 1.777 | 1.193 | 1.263 | 1.354 |
Molecular docking studies were employed to analyze the binding energy of the selected five compounds against GraR. All the compounds showed a binding affinity in the range of -6.38 to -10.24 kcal/mol, as shown in Table 5. All the docked compounds were predicted to bind to the alpha4-beta5-alpha5 motif (Figure 6 and 7), which is shown to be involved in the phosphorylation-induced dimerization of OmpR/PhoB family of RRs (45). The GraR residues located in this motif: Arg67, Asn72, Pro73, Met90, Gly93, Ala94, Asp95, and Arg117 are conserved among the OmpR/PhoB proteins, as shown in Figure 2, and were predicted to interact with the screened compounds. The GraR-ligand complexes are stabilized by H-bonding and hydrophobic interactions (Figure 7 and 8): ZINC000095509204, ZINC000067688459, and ZINC000095352231 displayed H-bonding with Asp95 while ZINC000049170029 and ZINC000049169934 formed H-bond with Arg117, and Met90, respectively, (Figure 8). Except for ZINC000095509204, four out of the five compounds showed H-bonding with Arg67. HADDOCK docking results also show that 5 compounds (ZINC000049170029, ZINC000095509204, ZINC000067688459, ZINC000049169934, and ZINC000095352231) possess a good binding affinity for GraR protein as shown in Table 6. HADDOCK docking results are in accord with AutoDock results.
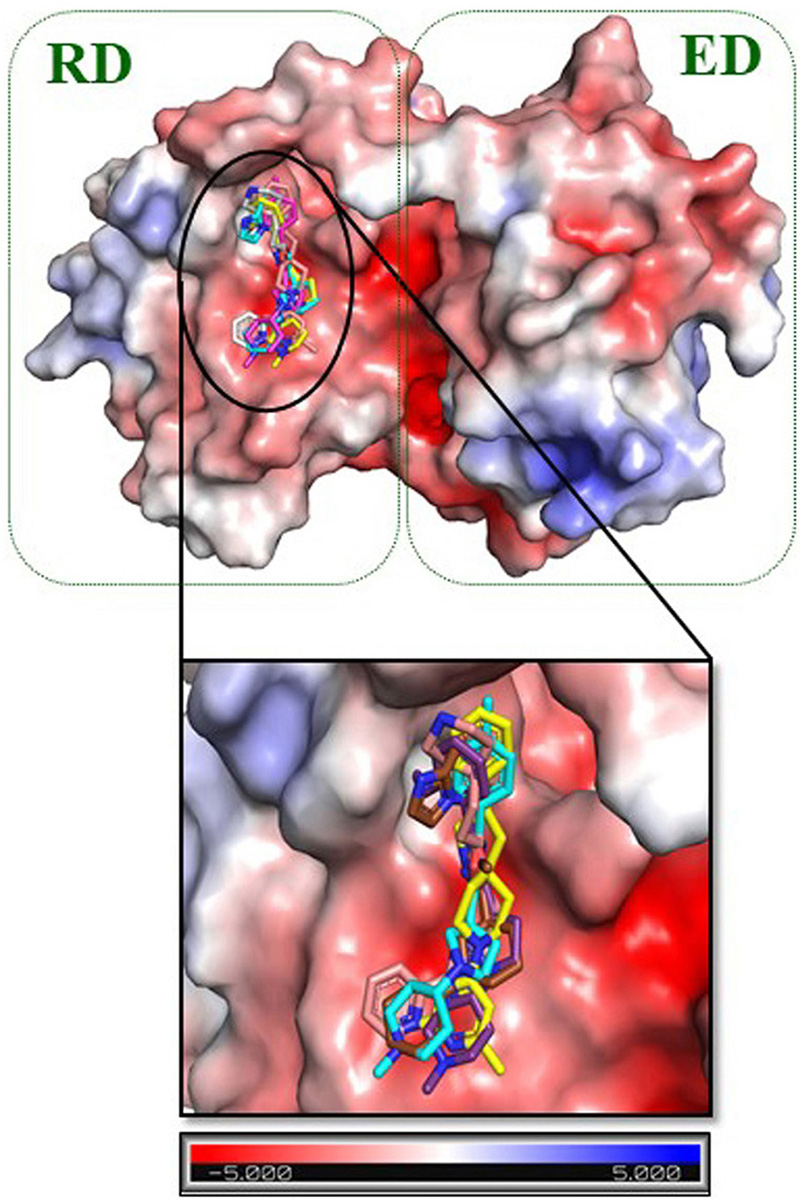 Figure 6
Electrostatic surface representation of GraR from S. aureus. The close-up view shows the binding pocket for ZINC000095509204, ZINC000067688459, ZINC000049169934, ZINC000095352231, and ZINC000049170029. These compounds are shown as carbon in gold, pink, cyan, brown, and purple respectively. Response regulator domain (RD) and effector domain (ED) are represented in the green dotted box. The electrostatic potential surface is color coded, red for negative and blue for positive electrostatic potential.
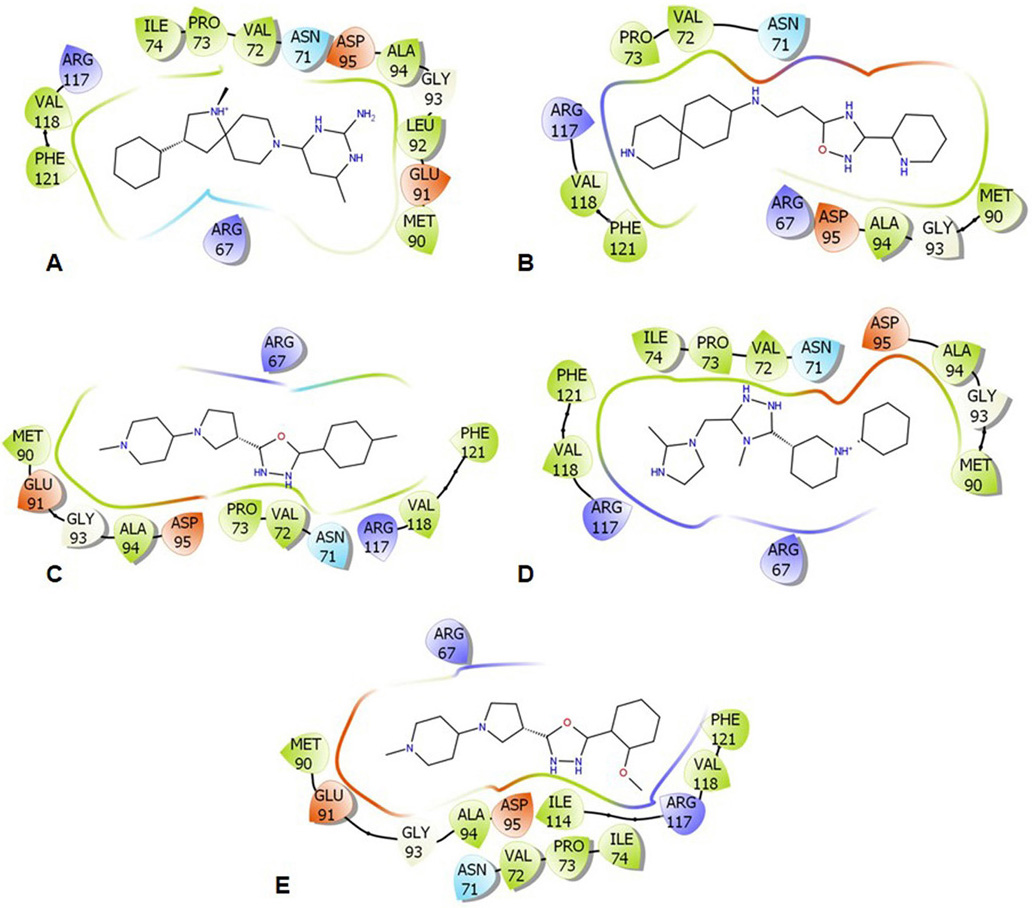 Figure 7
Illustrative representation of the protein-ligand interactions within 4 Å. (A) ZINC000095509204, (B) ZINC000067688459, (C) ZINC000049169934, (D) ZINC000095352231, and (E) ZINC000049170029. The color-coding features: green for hydrophobic, red for acidic, blue for basic, and cyan for polar residues.
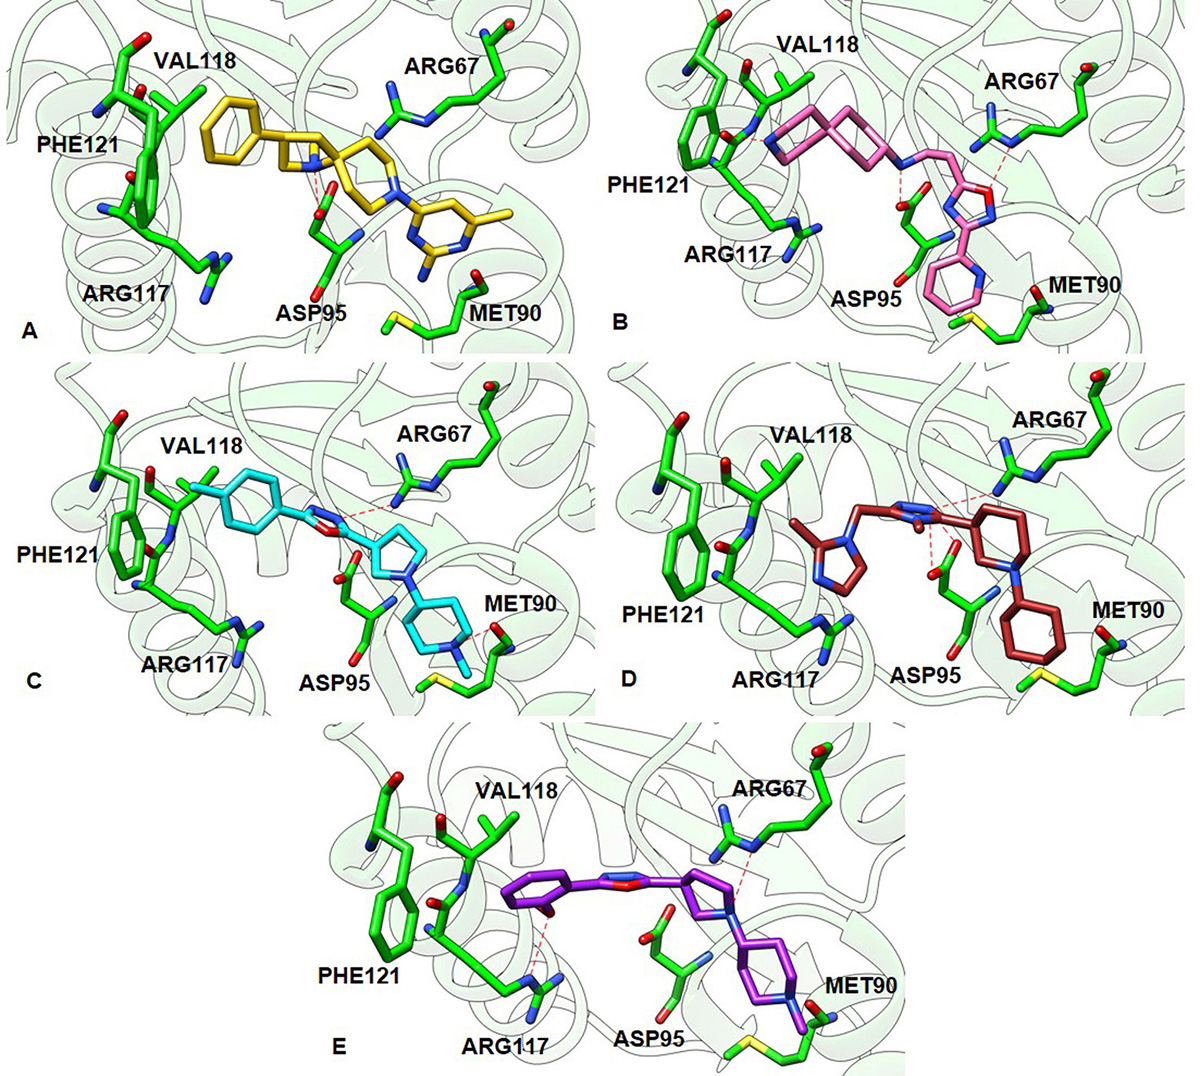 Figure 8
The best and the most stable binding conformation inferred from docking of the hit compounds against the constructed 3D model of GraR. (A) ZINC000095509204 (gold), (B) ZINC000067688459 (pink), (C) ZINC000049169934 (cyan), (D) ZINC000095352231 (brown), and (E) ZINC000049170029 (purple). The hydrogen bonds between the ligands and the receptor are shown as red dashed lines.
| S No: | ZINC ID | Binding affinity (kcal/mol) | Interacting residues | ||
|---|---|---|---|---|---|
| AutoDock Vina | AutoDock Tool | H-bond | Hydrophobic | ||
| 1 | ZINC000049170029 | -7.4 | -10.24 | Arg67, Arg117 | Met90, Ala94, Val72, Pro73, Ile74, Phe121, Val118, Ile114 |
| 2 | ZINC000095509204 | -6.9 | -8.5 | Asp95 | Met90, Leu92, Ala94, Phe121, Ile74, Pro73, Val72, Val118 |
| 3 | ZINC000067688459 | -6.8 | -8.08 | Arg67, Asp95, Arg117 | Pro73, Val72, Val118, Met90, Ala94, Phe121 |
| 4 | ZINC000049169934 | -6.9 | -6.93 | Arg67, Met90 | Met90, Ala94, Val72, Pro73, Val118, Phe121 |
| 5 | ZINC000095352231 | -7.0 | -6.38 | Arg67, Asp95 | Met90, Ala94, Asn71, Val72, Pro73, Ile74, Phe121, Val118 |
| S No: | Compounds | HADDOCK Score | Van der wall Energy (kcal/mol) | Electrostatic Energy (kcal/mol) | Desolvation Energy (kcal/mol) |
|---|---|---|---|---|---|
| 1. | ZINC000049170029 | -86.0 +/- 4.9 | -15.5 +/- 4.8 | -406.5 +/- 37.0 | -3.6 +/- 3.1 |
| 2. | ZINC000095509204 | -72.0 +/- 2.4 | -21.2 +/- 2.3 | -169.8 +/- 7.5 | -17.2 +/- 4.5 |
| 3. | ZINC000067688459 | -70.8 +/- 1.6 | -19.8 +/- 0.8 | -157.8 +/- 5.8 | -20.6 +/- 1.8 |
| 4. | ZINC000049169934 | -59.8 +/- 2.8 | -21.5 +/- 2.8 | -111.8 +/- 11.6 | -17.4 +/- 5.6 |
| 5. | ZINC000095352231 | -53.6 +/- 3.1 | -21.2 +/- 2.3 | -78.7 +/- 10.9 | -17.3 +/- 2.3 |
Molecular dynamics (MD) simulation was performed to understand the variation at the atomistic level in GraR during the binding of each compound and determine stable and static interactions between the ligand and GraR. Molecular dynamics of GraR and GraR-ligand complexes were done in triplicates to explore the receptor-inhibitors interactions. In the current study, different parameters such as Root Mean Square Deviation (RMSD), Root Mean Square Fluctuation (RMSF), radius of gyration (Rg), Solvent Accessible Surface (SASA), and formation of hydrogen bond during the molecular simulation were characterized.
The conformational changes and the dynamic stability of the C-alpha backbone atoms of GraR and GraR-ligand were studied by analyzing the RMSD during the simulation. RMSD data shows that all the protein-ligand complexes attained equilibrium at 34 ns and systems were found to be stable for up to 100 ns as shown in Figure 9A. The average values of RMSD for GraR and GraR-ligand complexes are shown in Table 7. The RMSD values of GraR-ligand complexes are in the range of 0.41 nm to 0.44 nm, which is lesser than RMSD values obtained for GraR, as shown in Figure 9A. Ligand RMSD in GraR-ligand complexes are shown in Figure 9B. The average ligand RMSD is in the range of 0.05 to 0.1 nm, suggesting that binding of each compound to GraR is stable and static. Overall, the RMSD results show that the binding of each compound to GraR is stable and does not affect the stability of the C-alpha backbone of the protein.
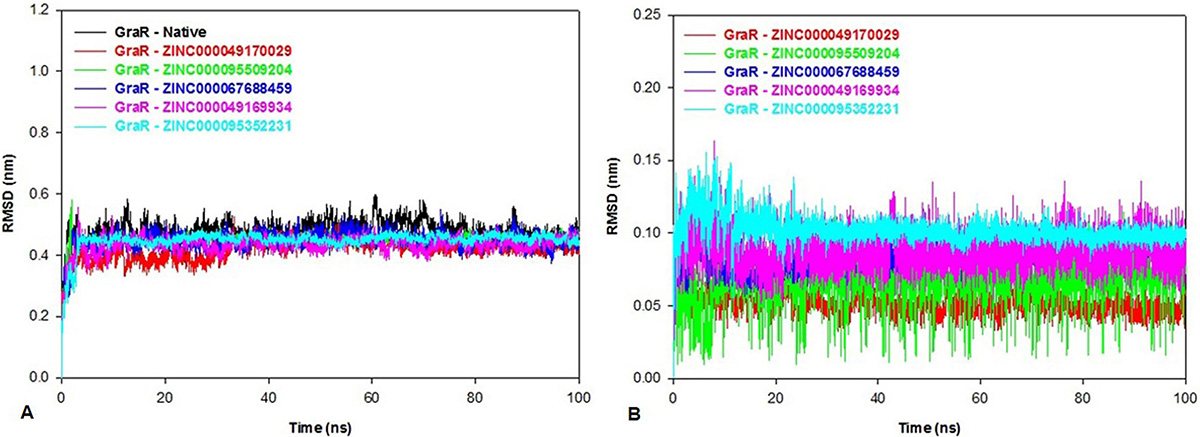 Figure 9
Root mean square deviation (RMSD) of the native protein, protein-ligand complexes and the ligand only. The RMSD plot of (A) GraR and GraR-ligand complexes, (B) Inhibitors/Ligands: ZINC000049170029 (red), ZINC000095509204 (green), ZINC000067688459 (blue), ZINC000049169934 (pink), and ZINC000095352231 (cyan) for 100 ns MD simulation.
| S No: | Compounds | Average Protein RMSD (nm) | Average ligand RMSD (nm) | Average RMSF (nm) | Average Radius of gyration (nm) | Average SASA (nm)2 | Intra-protein H-bonds |
|---|---|---|---|---|---|---|---|
| 1. | GraR | 0.46 | ----- | 0.21 | 2.04 | 133.1 | 169.9 |
| 2. | ZINC000049170029 | 0.41 | 0.05 | 0.16 | 1.92 | 122.7 | 179.5 |
| 3. | ZINC000095509204 | 0.44 | 0.07 | 0.18 | 1.96 | 129.4 | 181.1 |
| 4. | ZINC000067688459 | 0.44 | 0.09 | 0.17 | 2.00 | 128.5 | 174.2 |
| 5. | ZINC000049169934 | 0.43 | 0.09 | 0.16 | 1.98 | 131.7 | 174.5 |
| 6. | ZINC000095352231 | 0.44 | 0.10 | 0.19 | 2.00 | 129.9 | 176.2 |
RMSF refers to the fluctuation in the C-alpha atoms from its average position throughout the molecular simulation. The secondary structure elements and loops indicate lower and higher RMSF, respectively. Here, we determined the residual mobility of the protein-ligand complex and plotted it against the amino acid number and fluctuation. The RMSF profile of the GraR-ligand complexes is almost comparable to GraR as shown in Figure 10. The average RMSF values of GraR-ligand complexes are in the range of 0.16 to 0.19 nm, which is smaller than GraR alone, as shown in Table 7. Therefore, the overall RMSF data indicate that each compound formed a stable complex with GraR and did not fluctuate in the binding site.
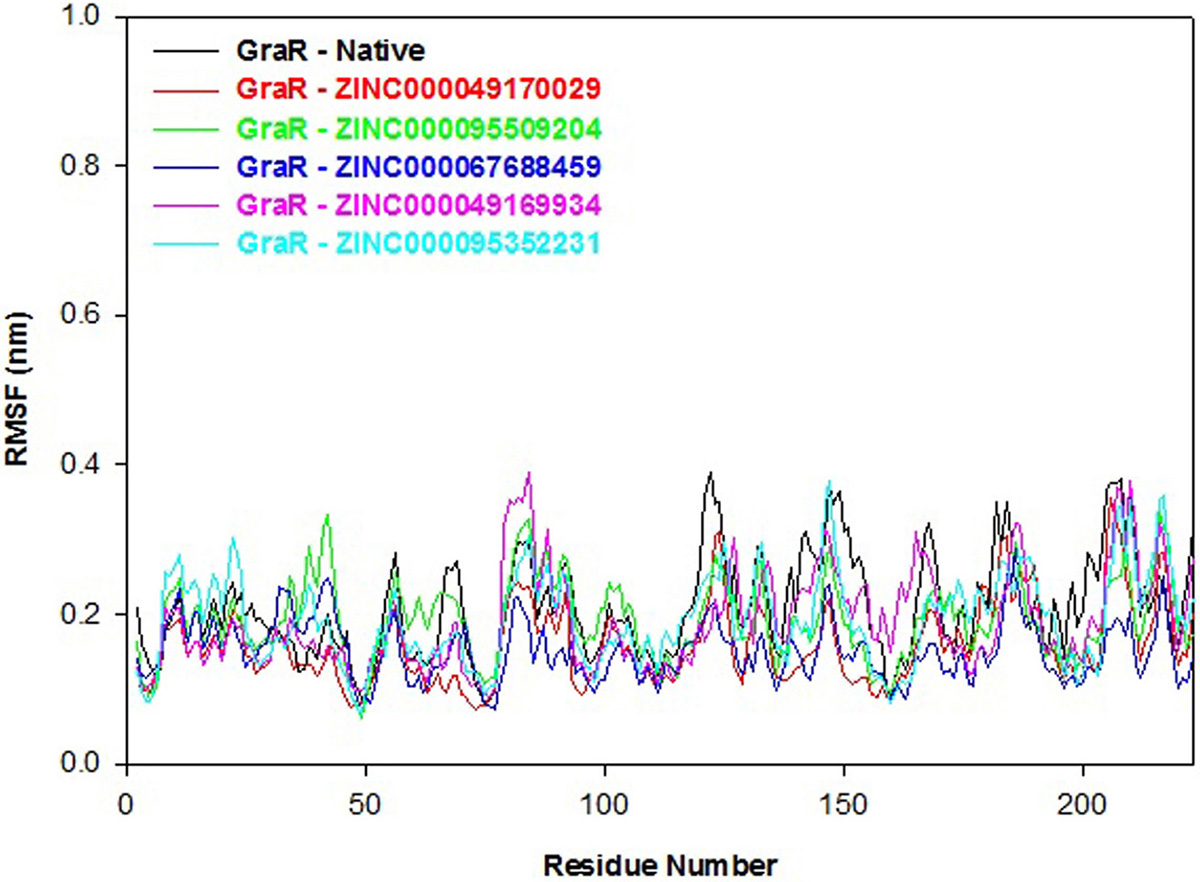 Figure 10
Root mean square fluctuation (RMSF) profiles of GraR (black), GraR-ZINC000049170029 (red), GraR-ZINC000095509204 (green), GraR-ZINC000067688459 (blue), GraR-ZINC000049169934 (pink), and GraR-ZINC000095352231 (cyan) during the molecular simulation of 100 ns.
Radius of gyration (Rg) indicates the overall compactness of the protein during the molecular dynamics. A smaller Rg value signifies a stably folded protein. The GraR-ligand complexes exhibit smaller Rg values as compared to the GraR protein, as shown in Figure 11. Protein-ligand complexes reveal an average Rg value in the range of 1.92 to 2.00 nm which is lesser than GraR, as shown in Table 7. These Rg results confirm that binding of each compound to GraR results in the formation of stable complexes.
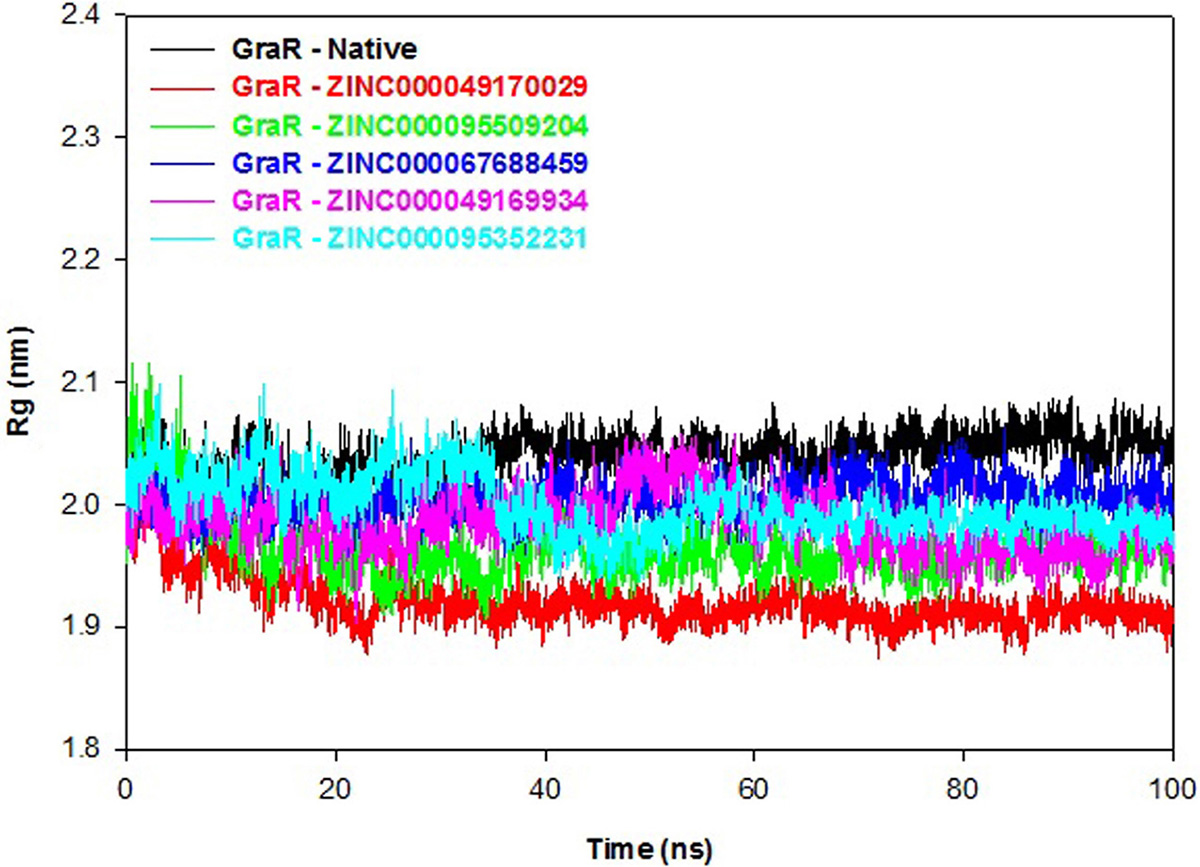 Figure 11
Radius of gyration graph of GraR and GraR-ligand complexes. The radius of gyration co-related with the compactness of the GraR protein during the molecular simulation time period of 100 ns.
Polar and non-polar interactions of atoms contribute to the solvation free energy of a protein. SASA displays the probe of the center of the solvent molecule as it covers the surface of the receptor molecule. SASA of a protein decreases with increment in compactness of protein, so variation in SASA can predict the change in the structure of a protein. SASA plot shows that values of protein-ligand complexes are smaller compared to the native protein, as shown in Figure 12. The average SASA values of GraR-ligand complexes are in the range of 122.7 to 131.7 nm2, which is smaller than GraR (133.1 nm2). SASA results suggest that the GraR-ligand complexes are more stable compared to GraR.
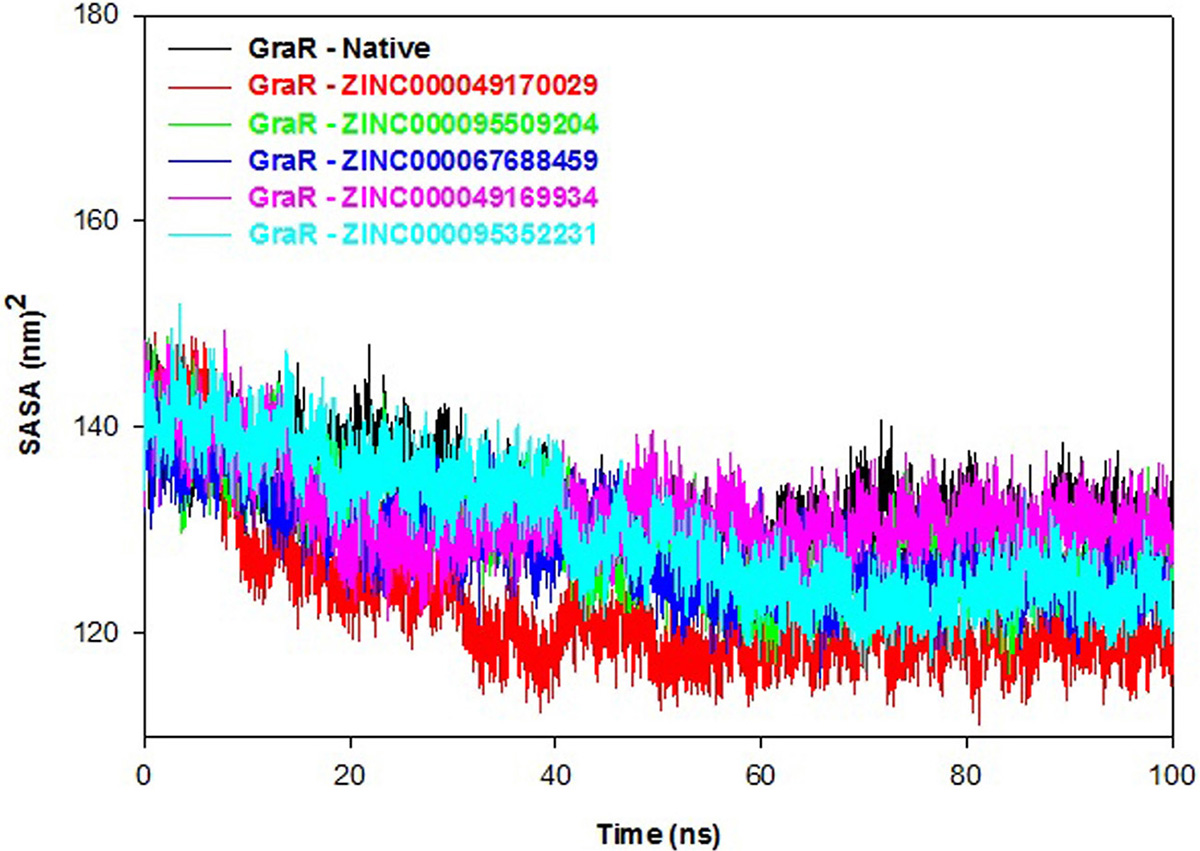 Figure 12
Solvent accessible surface area (SASA) profile of GraR and GraR-ligand complexes. SASA results of GraR, GraR-ZINC000049170029, GraR-ZINC000095509204, GraR-ZINC000067688459, GraR-ZINC000049169934, and GraR-ZINC000095352231 complexes at 300K for molecular simulation of 100 ns.
A hydrogen bond between an acceptor and a donor atom was generated within a distance and an angle range of 3.5 Å and 120o, respectively. The g_hbond tool of gromacs was utilized to predict the number of hydrogen bonds and distribution pattern in native protein and protein-inhibitor(s) complexes. Intra-protein hydrogen bond graph was plotted to calculate the stability of GraR and GraR-ligand complexes as shown in Figure 13A. The GraR-ligand complexes exhibit more intra-protein hydrogen bonds compared to GraR, as shown in Figure 13B. In average, the number of the Intra-protein hydrogen bonds in GraR-ligand complexes is in the range of 174.2 to 181.1, while in GraR there are about 169.9 intra-protein hydrogen bonds, as shown in Table 7. Investigation of the inter-molecular hydrogen bond indicates that GraR-ligand complexes possess the minimum number of three hydrogen bonds during the molecular simulation, as shown in Figure 13C. The distribution of the hydrogen bond length depicts that GraR-ligand complexes form hydrogen bond from high to low affinity, which is related to GraR, as shown in Figure 13D. Overall, investigation of the hydrogen bonding shows that each compound tends to form stable GraR-ligand complex.
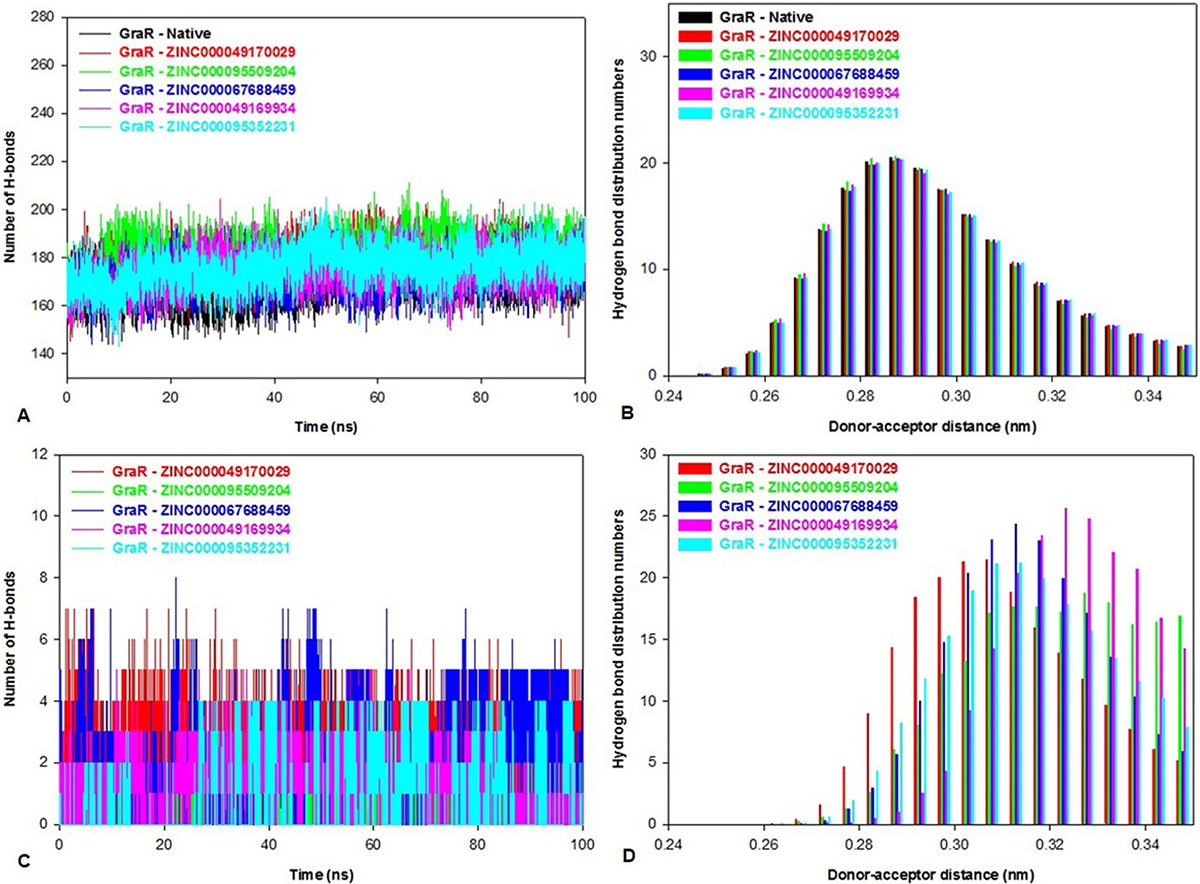 Figure 13
Bar representations of the hydrogen bond numbers and distribution in GraR, and GraR-ligand complexes. The hydrogen bond distribution is shown. (A) Intra-protein hydrogen bond numbers, (B) Intra-protein hydrogen bond distributions during the course of 100 ns simulation at 300 K, (C) Inter-molecular hydrogen bond numbers and (D) Inter-molecular hydrogen bond distributions during the course of 100 ns simulation at 300 K.
The quantitative estimation of the binding free energy of ligand to a protein was calculated using the MMPBSA. The molecular dynamics trajectories of the last 20 ns were retrieved and used to generate the binding affinity of each complex. All the compounds show binding affinity in the range of -142.39 to -119.51 kJmol-1, as shown in Table 8. The GraR-ZINC000049170029, GraR-ZINC000095509204, GraR-ZINC000067688459, GraR-ZINC000049169934, and GraR-ZINC000095352231 complexes exhibited a binding energy of -142.39 +/- 4.77, -133.41 +/- 23.32, -129.05 +/- 28.09, -130.44 +/- 6.56 and -119.51 +/- 4.78 kJmol-1, respectively. The MMPBSA data confirmed that each compound can bind to GraR with a high binding affinity and result in the formation of a stable GraR-ligand complex.
| S No: | Compound | Van der Waals energy (kJ/mol) | Electrostatic energy (kJ/mol) | Polar solvation energy (kJ/mol) | SASA energy (kJ/mol) | Binding energy (kJ/mol) |
|---|---|---|---|---|---|---|
| 1 | ZINC000049170029 | -107.39 +/- 1.46 | -205.39 +/- 5.81 | 17.14 +/- 4.89 | -15.74 +/- 0.14 | -142.39 +/- 4.77 |
| 2 | ZINC000095509204 | -50.44 +/- 9.32 | -205.85 +/- 32.66 | 129.77 +/- 20.29 | -6.81 +/- 1.13 | -133.41 +/- 23.32 |
| 3 | ZINC000067688459 | -68.59 +/- 6.12 | -205.53 +/- 71.43 | 155.48 +/- 51.85 | -10.41 +/- 0.82 | -129.05 +/- 28.09 |
| 4 | ZINC000049169934 | -61.26 +/- 1.46 | -186.74 +/- 8.77 | 127.52 +/- 12.61 | -13.85 +/- 0.13 | -130.44 +/- 6.56 |
| 5 | ZINC000095352231 | -94.77 +/- 2.62 | -175.24 +/- 11.97 | 164.56 +/- 10.07 | -13.96 +/- 0.29 | -119.51 +/- 4.78 |
A number of studies have shown that bacteria use signal-transduction pathways, such as those mediated by the two-component systems, in response to antibiotic-induced stress and as means to confir resistance to antibiotics (46-50). Here we focussed on the GraSR TCS, which responds to the action of CAMPs. (46-48, 51, 52). S. aureus infection causes the production of CAMPs by the host’s immune system (53, 54). CAMPs have a net positive charge at the physiological pH and may play a vital role in skin infections and life-threatening diseases such as pneumonia, endocarditis, meningitis, and toxic shock syndrome (1, 2). The response regulator protein GraR controls the expression of mprF, the dltABCD, and vraFG operons, the gene products of these operons are involved in resistance to several CAMPs.
In this study, the GraR structure was predicted and refined using SWISS model and SWISS PDB viewer. The refined model was assessed and validated using PROCHECK, VERIFY-3D, ERRAT, and ProSA. The domain analysis showed N- and C-terminal domains in the GraR in which C-terminal behaves as a DNA binding domain. Both domains are connected by a short loop of 7 residues (residues 122-128). The N-terminal domain (residues 1-121) is comprised of central parallel beta sheets (beta 1-5) surrounded by alpha1 and alpha5 helices on one face and alpha2-alpha4 helices on the other face (Figure 3). This domain hosts the phosphorylation site, Asp51, the homodimerization site, and the highly conserved alpha4-beta5-alpha5 motif (6). The C-terminal domain (residues 129-224) hosts the DNA binding motif i.e. helix-turn-helix fold, which is conserved among the OmpR/PhoB family of proteins. The DNA-binding motif starts with four-stranded antiparallel beta-sheets and is followed by a helices bundled with two stranded anti-parallel beta-sheets. The GraR model shows two unique structural features: alpha4-beta5-alpha5 motif is fully exposed and not involved in the intra-domain interactions seen in other OmpR/PhoB proteins (43, 44), and the helix-turn-helix motif is also exposed. The latter feature is in agreement with previous in vitro studies of GraR DNA-binding activity (6).
The molecular docking and simulations studies were utilized to predict the efficiency of ligands binding to protein (55-58). Virtual screening is a powerful technique to identify potential lead compounds in the field of drug discovery (59-61). Drug-like compounds of the ZINC database were screened against a validated model of GraR using AutoDock Vina in PyRx0.8. The binding conformation of the ligand and its interaction with the dimerization interface residues, along with the binding energy were considered important factors for the selection of the best-docked conformation. A total of 5 compounds: ZINC000049170029, ZINC000095509204, ZINC000067688459, ZINC000049169934, and ZINC000095352231 were selected on the basis of the binding energy. Furthermore, visual inspection of the protein-compound complexes revealed that these compounds interact with Arg67, Asn72, Pro73, Met90, Gly93, Ala94, Asp95, and Arg117 residues of GraR, which are found in the alpha4-beta5-alpha5 motif, and are conserved among the OmpR/PhoB family of RRs.
The Lipinski rule of five was used to screen out the drug-like compound from the selected compounds. Drug-like properties such as molecular weight (less than 500 Da), H-bond donor (less than 5), H-bond acceptor (less than 10), and cLogP (less than 5) were analyzed for all the selected compounds. ADMET studies were performed to predict the pharmacokinetic properties and toxicity of drug-like compounds. The five selected compounds (ZINC000049170029, ZINC000095509204, ZINC000067688459, ZINC000049169934, and ZINC000095352231) fulfilled the Lipinski rule of five and ADMET criteria, and they showed low IC50 value. These studies suggested that the five selected compounds satisfied all the parameters for a potent inhibitor.
Further, the molecular docking studies were employed to study the interaction of the above compounds with GraR using AutoDock 4.2.6. and HADDOCK. The ZINC000049170029 compound showed the highest binding energy (-10.24 kcal/mol) and others showed slightly less binding energies, ranging from -8.5 kcal/mol to -6.93 kcal/mol. Furthermore, the compounds ZINC000067688459, ZINC000095509204, and ZINC000095352231 were predicted to form intermolecular hydrogen bonds with Asp95 of GraR, while ZINC000049170029 and ZINC000049169934 were predicted to form intermolecular hydrogen bonds with Arg117 and Met90 of GraR, respectively, as shown in Figure 8. The docking study also predicted that all the five compounds are surrounded by hydrophobic residues in GraR (Val72, Pro73, Met90, Ala94, Val118, and Phe121) (Figure 7). From these results, it can be inferred that the hydrogen bonds and the hydrophobic interactions are likely to provide stability protein ligand complex. The best binding modes of all these compounds, generated by AutoDock, AutoDock Vina and HADDOCK, were almost identical. Hereafter, we speculate that these compounds may bind specifically to the GraR protein to inhibit its dimerization upon phosphorylation.
Molecular dynamics simulation was performed to understand the structural and conformational changes in the protein-ligand complex. RMSD of GraR-ligand complexes were smaller than GraR, suggesting that binding of each compound to GraR results in the formation of a stable complex. The overall values of RMSF indicate that the predicted inhibitor(s) was(were) well fitted into GraR without causing any structural fluctuations in the protein-ligand complex. The smaller Rg value of GraR-ligand complex in comparison to that of GraR suggests that the protein-ligand complexes are compactly packed and stable. SASA analysis also revealed that binding of these compounds to GraR tends to make the protein more compact as compared to GraR. The predicted inter-molecular hydrogen bonds in the protein-ligand complexes were shown to be stable throughout the molecular simulations and hence they are suggestive of stability of these complexes. MMPBSA data confirmed that all the compounds bound efficiently to GraR. The overall molecular dynamics simulations result conclude that all the screened compounds are potent molecules likely to prevent the homodimerization of GraR, which can then inhibit the GraSR response to CAMPs, and lead to the re-sensitization of S. aureus to CAMPs.
S. aureus is a major human pathogen that has developed resistance against various antibiotics. TCSs respond to a specific environmental signal such as pH, nutrient levels, osmotic pressure, redox state, quorum-sensing proteins and antibiotics. GraR of S. aureus is an attractive target for drug development as its inhibition could reduce in vivo survival. A 3D model of GraR was predicted and further validated using several tools of SAVES server. To identify potent GraR-binding molecules, a structure-based virtual screening of GraR against the ZINC database molecules was performed. The selected molecules were screened by assessing the pharmacophore properties such as Lipinski rule of five and ADMET, and IC50. The molecular docking was used to analyze the interactions between the identified compounds and GraR. The molecular docking results showed that five compounds: ZINC000049170029, ZINC000095509204, ZINC000067688459, ZINC000049169934, and ZINC000095352231 interact at the dimerization interface residues of GraR through hydrogen bonding, hydrophobic and polar interactions as they have the aromatic ring with a charged group. The molecular dynamics study confirmed that the selected compounds bind to GraR efficiently and form stable GraR-ligand complexes. These lead compounds can be further validated in vitro studies and subsequently can be utilized for the development of antimicrobial compounds against S. aureus.
I am the corresponding author of this manuscript and I declare no conflict of interest. PD and VD contributed equally to this paper. PD thanks Ministy of Human Resource Development and VD thanks Department of Biotechnology (DBT/2015/IIT-R/349) for financial support.
TCS
Two-component systems
cationic antimicrobial peptides
histidine kinase
response regulator
receiver domain
effector domain
wall teichoic acid
molecular dynamics
molecular mechanic/Poisson-Boltzmann surface area
Universal Force Field
volume of distribution
Root Mean Square Deviation
Root Mean Square Fluctuation
Solvent Accessible Surface Area
nano second.