


Frontiers in Bioscience-Landmark (FBL) is published by IMR Press from Volume 26 Issue 5 (2021). Previous articles were published by another publisher on a subscription basis, and they are hosted by IMR Press on imrpress.com as a courtesy and upon agreement with Frontiers in Bioscience.

1 Glycation, Oxidation and Disease Laboratory, Department of Research, Touro University College of Osteopathic Medicine. 1310 Club Drive, 94592, Vallejo, CA, USA
2 Department of Medical Science, University of Guanajuato, 20 de Enero 929, 37320, Leon, Guanajuato, Mexico
Abstract
In this review, we highlight the specific metabolic effects of fructose consumption that are involved in the development of metabolic syndrome non-alcoholic fatty liver disease and its association with obesity. The specifics effects of fructose on the liver are particularly germane to the development of a vicious cycle that starts with liver steatosis driving insulin resistance. These effects include 1) increased de novo lipogenesis, 2) increased liver fat, 3) dyslipidemia 4) increased uric acid production which feeds back on increased fructose metabolism and, 5) increased methylglyoxal and Maillard reaction that may affect adenosyl-monophosphate-dependent kinase Fructose increases cortisol activation especially in visceral fat. The hormones involved in satiety control are affected by fructose consumption. Fructose derived advance glycation end-products may also induce a state of inflammation by engaging its receptor, RAGE. Directionality for the effect of fructose on metabolic syndrome is becoming clear: fructose drives hepatic fat, which in turn drives insulin resistance. There is an urgent need for more clinical and educational interventions to regulate/reduce fructose consumption in our population, especially in children and adolescents.
Keywords
- Fructose
- Obesity
- Metabolic syndrome
- Leptin
- Fatty liver
- Insulin resistance
- Maillard reaction
- AGEs
- RAGE
- De novo lipogenesis
- Review
Obesity is a global health problem that is increasing in prevalence around the world, affecting adults as well as children and adolescents. One out of three adults and three out of ten children or adolescents are obese or overweight (1, 2). Obesity is a risk factor for the development of type 2 diabetes mellitus (T2DM), cardiovascular disease (CVD) (3), metabolic syndrome (MetS) (4-6), and is related to various chronic conditions including: high blood pressure (7), insulin resistance (IR) (8), dyslipidemia, atherosclerosis, a low-grade chronic inflammation, non-alcoholic fatty liver disease (NAFLD) and cancer (9).
Both obesity and metabolic syndrome are associated with various factors including genetics, physical activity, environment, and diet (6, 10). Diet, a component of lifestyle, plays a significant role in this epidemic specifically diets rich in fats, protein, sodium, and sugar (11). Since the past century, as the intake of added sugar has increased, at par, the effect of sugar on health has also been studied (12, 13). In 1900, sugar had already been shown to be related to various diseases (14). Currently, a large body of evidence has defined sugar as a toxic substance that contributes largely to non-communicable diseases, mainly due to the metabolic effects of fructose and its components (13, 15, 16). Despite the known metabolic effects of fructose, its dietary intake has continued to increase in recent years (17-19). Evidence is increasing for a key role of hepatic fructose metabolism leading to liver and visceral fat accumulation as a key factor that generates insulin resistance, which dovetails and generates MetS and ends up in obesity (20). Therefore, the purpose of this review is to highlight the specific metabolic effects of fructose consumption (beyond the caloric content) in the development of MetS, NAFLD and their association with obesity. Other aspects such as fructose’s addictive potential and central nervous system (CNS) actions will not be discussed at large and the reader is referred to other comprehensive reviews in these areas.
Fructose is a monosaccharide found mainly in sucrose (50% glucose and 50% fructose), fruits, honey as well as in processed forms like fructose-containing caloric sweeteners (FCCS), high fructose corn syrup (HFCS) and employed in processed foods and beverages called sugar-sweetened beverages (SSBs) (21). Epidemiological studies have related fructose consumption (in sugar, or HFCS form) with obesity (22), MetS , T2DM (23), CVD (24) and NAFLD (6,25-27). The correlation with SSBs is particularly strong (28, 29). The mechanism of how fructose participates in these pathologies is not completely clear yet, however, different studies in both animals and humans (30, 31) has allowed the dissection of some of its metabolic effects.
Free fructose is absorbed directly in the intestinal lumen, whereas from larger molecules like sucrose, both glucose and fructose are acquired by the cleavage of sucrase (invertase), an enzyme found in the brush border of the villi or enterocyte of the small intestine (32, 33). Intestinal fructose is mostly transported via the glucose transporter 5 (GLUT5) via diffusion on the luminal side and glucose transporter 2 (GLUT2) on the basolateral side (33, 34). Fructose enters the liver from the portal circulation (32, 35). The liver contains two glucose and two fructose transporters, GLUT 2 and GLUT 8 respectively (Figure 1). Fructose transport and metabolism within hepatocytes is regulated by GLUT 8. (36, 37). Fructose is metabolized mostly in the liver (more than 80% undergoes first pass extraction), whereas when consumed in isolation, approximately 50% is converted to glucose, 15-20% into hepatic glycogen and 15-25% into lactate or fatty acids (FA) which are secreted as very low-density lipoproteins (VLDL) triglycerides (TG) or stored as intrahepatic fat (38-40).
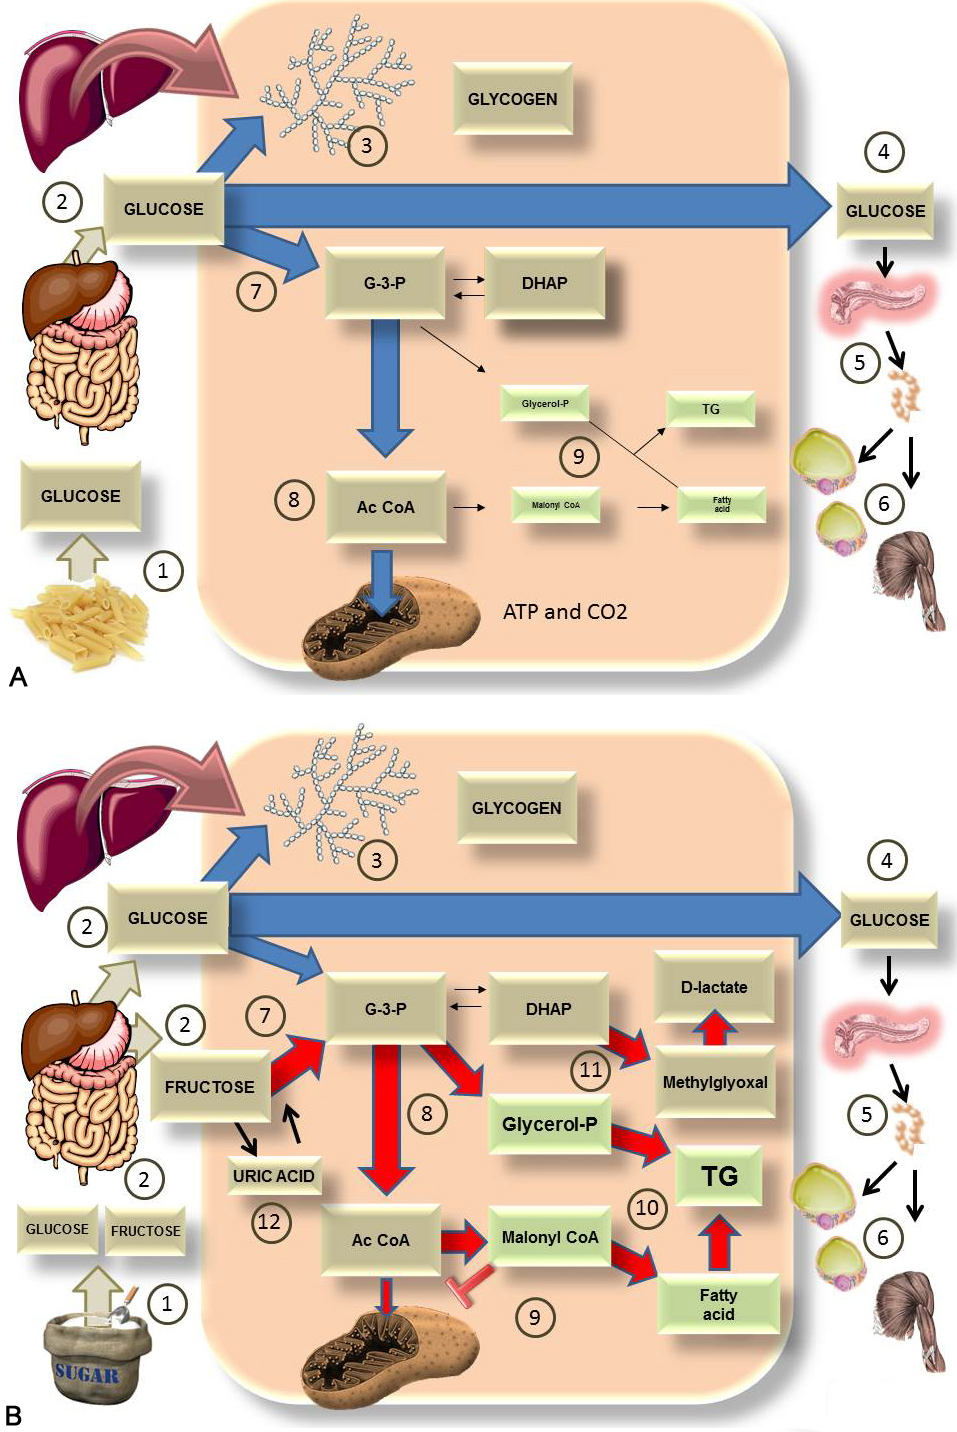 Figure 1
It’s not all about the calories nor about all carbohydrates but a specific one. This diagram shows the comparison of the major pathways for the fate of either A) 100 g of glucose (from starch) or B) 100 of sugar (50% glucose and 50% fructose). A). After digestion of starch 1), glucose enters the portal vein 2). In the liver it is converted, in part, to glycogen 3) and most of it goes into the bloodstream 4) to feed the tissues as it increases insulin secretion 5) and glucose enters muscle and adipose tissues 6). The rest is used to fuel the liver itself via glycolysis 7) leading to Acetyl coenzyme A (AcCoA) 8) which generates energy in the mitochondria. Very little is converted to fat 9) via the process of de novo lipogenesis (DNL). B). After digestion of sugar 1), glucose and fructose enter the portal vein in equal amounts 2). In the liver, glucose will be turned, in part, into glycogen 3). Most of it enters the bloodstream 4) to feed the tissues as it increases insulin secretion 5) and glucose enters muscle and adipose tissues 6). Fructose does not leave the liver for the most part. Instead, it is quickly phosphorylated by FFK C, bypassing regulatory steps in glycolysis and flooding the system 7), 8). The trapped metabolites have one fate: they are turned into fat by de novo lipogenesis 9) and 10). This process impairs FA oxidation by the mitochondrion because malonylCoA inhibits carnitine palmitoyl transferase I (CPT I) and FA transport into the mitochondrion 9). Some of the trioses are also transformed into the toxic metabolite methylglyoxal (MG), which can be detoxified to D-lactate 11). These processes have dire consequences as explained in the next figures. Finally, as further developed in other diagrams, quick phosphorylation of fructose leads to energy depletion and uric acid production, which in turn stimulates fructose metabolism 12).
In the liver, three key enzymes metabolize fructose. First, fructose is phosphorylated to fructose 1 phosphate (fructose-1-P) by the enzyme fructokinase C (FFK C), also named ketohexokinase (KHK). Fructose-1-P is then converted into di-hidroxyacetone-phosphate (DHAP) by the enzyme aldolase B and glyceraldehyde-3-phosphate (G-3-P) via thiokinase (TKFC). These trioses participate in other metabolic pathways: glycolysis, lipid synthesis, gluconeogenesis, and glycogenesis (41, 42) (Figure 1). It is important to note that fructose enters glycolysis more directly, and consequently is not tightly regulated as glucose (19).
Most of the ingested fructose is extracted from the portal blood via first pass hepatic metabolism while only a small fraction of the ingested fructose will eventually enter the systemic circulation (40). It needs to be said that we rarely consume pure fructose, rather, it is co-ingested with glucose and this makes all the difference. To better highlight these differences, Figure 1 A and B compares what happens with a load of glucose (from pasta, for instance) and the same load of sucrose (fructose and glucose).
Some studies in animals (43, 44) and humans (45, 46) have shown that fructose, compared with glucose or starch in diets with the same number of calories, is able to increase food intake, visceral fat, circulating TGs, blood pressure and reduces fatty acid oxidation, insulin sensitivity and energy metabolism (47, 48). All of these characteristics are related to the presence of MetS and various scientific evidence shows that drinks sweetened with fructose or HFCS have a role in the pathogenesis of MetS and its components (6, 11, 23).
It is noteworthy that while glucose generates energy in the form of ATP during its metabolism, fructose consumption is able to the decrease the levels of intracellular ATP due to the quick process of phosphorylation by FFK C (Figure 1B). As we show further below, replenishing of the ATP increases AMP leading to its catabolism into uric acid. The lack of ATP in turn generates a mitochondrial oxidative stress that favors an increase of lipogenesis, blockade of the oxidation of FA (46) and stimulates gluconeogenesis (49-51) as we further elaborate in section 3.2. On the other hand, while the metabolism of glucose is limited by the amount of ATP and insulin, the metabolism of fructose is not limited by these factors.
As previously mentioned, the result of fructose ingestion (Figure 1) may first be evidenced by an increase in hepatic glucose production and the conversion to lactate in the liver which can be measured in the blood. After this, an increase in plasma lipids is observed due to the production of fat from fructose in the liver. As reported by multiple authors, high fructose concentrations converts pyruvate to acetyl-CoA by the reaction of pyruvate dehydrogenase. The flux of pyruvate dehydrogenase from increased entry into the TCA cycle also results in an increased acetyl-CoA and citrate cycled in the synthesis of fatty acids (52) which are stored as intrahepatic fat and/or secreted into the bloodstream as VLDL triglyceride. Liver fat accumulation is a key link to IR, an entity linked to MetS and NAFLD (53-55).
There is a close relationship between fructose consumption, DNL (FA and TG synthesis) and NAFLD. Fructose increases hepatic FFK C and induces DNL (25) which is increased in NAFLD (56, 57), a process characterized by an imbalance between the lipids synthesized via DNL or lipolysis and lipid oxidation or VLDL export from liver (58). The excess fat in the liver may lead to the development of hepatic IR (59) as well as nonalchoholic steatohepatitis (NASH), a stage that predisposes to cirrhosis (60, 61) and its complications (32, 35, 62).
Isotopic studies have shown that people with NAFLD produce 2 times more liver fat and secrete more VLDL-triglycerides via DNL compared to IR obese subjects and 3 times more compared with healthy subjects (9, 32). Moreover, prolonged exposure of lipids in the liver causes oxidative stress in the endoplasmic reticulum ER and this alters apolipoprotein B100 degradation as well as VLDL secretion (63), a condition described in people with NASH (61).
The main deleterious effects of fructose at the hepatic and systemic level include: insulin resistance, inflammation, stress hepatic, ATP depletion (64), DNL (triglyceride and fatty acid synthesis) (65-69), NAFLD, nonalcoholic steatohepatitis (NASH) (67, 70), acid uric production (47, 71), endoplasmic reticulum stress (ER), fibrosis (9)(71). These will be explored further in the following sections. In addition, we have proposed that the increase in trioses flux that increases lipogenesis should also greatly increase the generation of methylglyoxal (MG) and its detoxification product, D-lactate (72, 73). The importance of fructose metabolism in fatty liver disease is highlighted clearly by the fact that Pfizer is developing (phase 1) PF-06835918 a FK C inhibitor.
Fructose participates in formation of methylglyoxal compound (MG), a powerful precursor of advanced glycation end products (AGEs) formed in vivo (which are described in another section of this review). MG is detoxified as D-lactate. Trioses formed in the unregulated metabolism of fructose may increase the MG production in the liver (74, 75). This increase of MG generates dicarbonyl stress, which is characterized by modification/dysfunction of proteins (MG attacks especially arginine residues) and DNA (76-78). We have advanced the hypothesis that MG inactivates the enzyme adenosyl-monophosphate-dependent kinase (AMPK), which under normal conditions would activate the catabolic pathways in the liver. However, MG may have affinity for the three arginines of the subunit gamma of AMPK. When coupled to them, AMPK is inactivated thereby favoring the anabolic processes including lipogenesis and IR which are widely related to obesity, metabolic syndrome and NAFLD (73).
AMPK is a master regulatory enzyme that controls the cellular energy state (79-81). A decrease in energy activates AMPK by initiating catabolic pathways and inhibiting anabolic pathways (79, 82). AMPK is comprised of three sub units: alpha, beta and gamma (its allosteric site). The epsilon subunit is linked to AMP by 3 Arginine residues (79, 82). The allosteric regulation is influenced by the AMP/ATP ratio and blocking the allosteric site of AMP can inhibit activation of AMPK. Related to this, as previously described, the particular metabolism of fructose leads to the formation of triose (catalyzed by FFK C), a process that favors a rapid depletion of ATP (51, 83), while at the same time, AMP production forms uric acid. This change in proportion of ATP/AMP should activate AMPK with its consequent effects, however, under the consumption of fructose this does not happen. To explain this flagrant metabolic paradox, as shown in Figure 2.
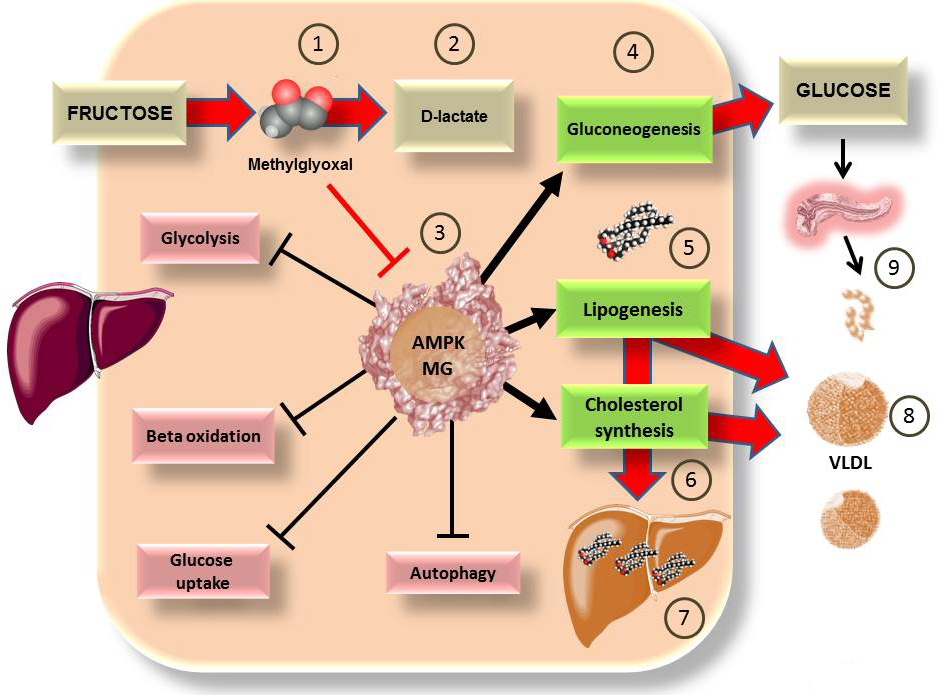 Figure 2
Some of the deleterious actions of fructose on the liver may be due to the actions of methylglyoxal on master regulatory enzyme AMPK. As shown in Figure 1 B, fructose metabolism is largely hepatic. we have proposed that a surge of fructose (40 g in liquid form which is not uncommon in our diet), through unregulated metabolism, generates MG 1), which can be detoxified to D-lactate 2), and we use as a marker of this flux (76), a process that may be overwhelmed. MG is very reactive and may bind to the 3 key arginine residues in the allosteric site of AMPK, rendering it non responsive 3). AMPK favors energy generation, its cumulative actions may be summarized as anti-diabetic. If rendered inactive, the processes favored are gluconeogenesis 4), increasing hepatic production of glucose even in the fed state, lipogenesis 5) and cholesterol synthesis 6). These are precisely the processes which research has shown are stimulated by fructose, with the consequences of ectopic fat accumulation 7), hyperlipidemia 8), insulin hypersecretion 9) and therefore insulin resistance (53, 84). Further research is needed to fully establish the above as a clinically relevant mechanism.
It has been demonstrated that MG is metabolized by the glyoxalases system which is diminished in the presence of clinical obesity and glyceroneogenesis (74-76,85). Large loads of fructose can alter the metabolism of MG (86) increasing the excess of triose, MG and D-Lactate. D-lactate is of particular interest since its plasma levels have been used as a surrogate marker of MG flux (87-89). In support of our contention, Thornalley has found increased MG and D-lactate in obese adults (74, 76) and we have shown the same in adolescents in a cross sectional study (Reyna Rodriguez, Claudia Luevano, Sergio Solorio, Russell Caccavello, Yasmin Bains, Ma. Eugenia Garay and Alejandro Gugliucci, CCLM, in press 2018). Further, in an intervention study, fructose restriction resulted in a 38% decrease in D-lactate levels in just 10 days) (Yasmin Bains, Caccavello Russell, Michael Wen, Susan Noworolski, Kathleen Mulligan, Viva Tai, Jean-Marc Schwarz, Ayca Erkin-Cakmak, Robert Lustig and Alejandro Gugliucci unpublished results 2018).
Therefore, fructose, by increasing MG (and its product D-lactate) may play a key role in obesity and metabolic syndrome through the MG postulated mechanism on AMPK (73). More research is needed to ascertain this contention. It has also been proposed that the dicarbonyl stress promoted by MG (acting on many other proteins) can play an important role in the development of IR in obesity and increase the risk of developing DMT2 and NAFLD (76).
Uric acid, produced from the AMP generated by the metabolism of fructose, activates the renin-angiotensin system and inhibits endothelial nitric oxide (NO) a vasodilator, causing an increase in blood pressure (45,90-92) which, together with the mitochondrial effects of fructose contribute to MetS development (45,93-95). The fluxes of uric acid generated by fructose are a result of transient energy deficits generated by quick unregulated phosphorylation of fructose as depicted in Figure 1B. In Figure 3, we expand on the details of this process.
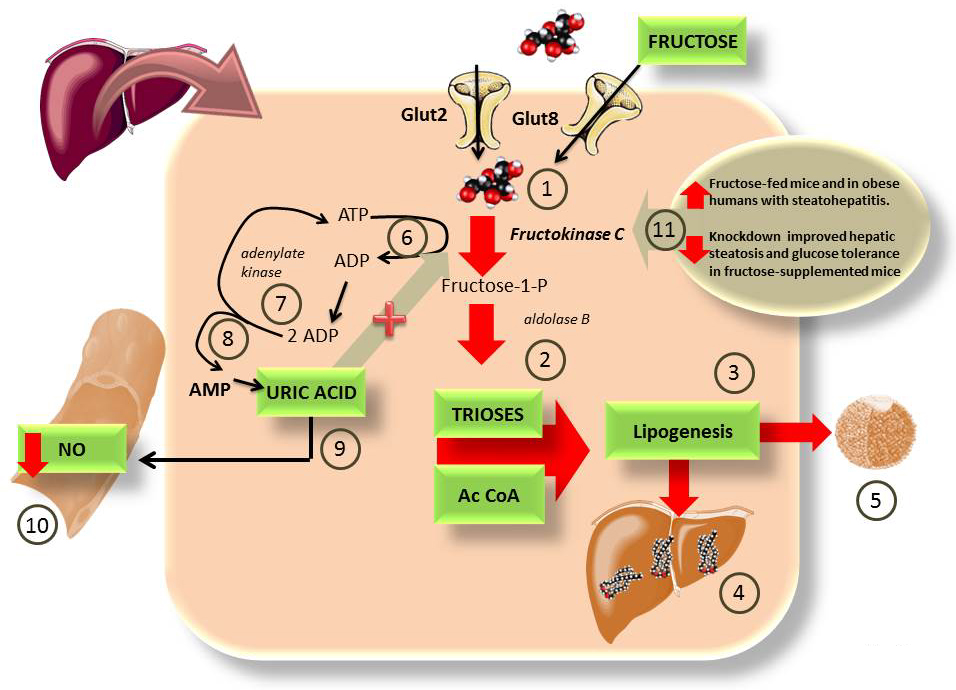 Figure 3
Some of the deleterious actions of fructose on the liver may be due to ATP depletion and uric acid formation. As depicted in Figure 1B, fructose bypasses the 2 key regulatory steps in glycolysis because The liver has the very active FFK C 1), that floods the cytosol with trioses and AcCoA 2), which lead to lipogenesis 3), fatty liver 4) and hyperlipidemia 5), especially because fructose is co-ingested with glucose which is used for glycogen production (instead of fructose, Figure 1 A) vs 1 B)). This drives insulin secretion which enhances lipogenesis 3). The rapid, unregulated phosphorylation of fructose leads to quick cytosolic ATP depletion 6). In order to replenish the cytosolic ATP the cells use adenylate kinase 7) to generate 1 ATP and 1 AMP from 2 ADP 8). AMP is an endproduct that is degraded into uric acid. Uric acid quenches NO, leading to impaired vascular tone and hypertension 10). One important feature of uric acid is that it has been shown to be a FFK C activator, and therefore a perpetuator of this cycle (93). Actually, the mutation by which we lost uricase during evolution has been proposed as an evolutionary advantageous feature, facilitating fruit fructose assimilation in times of plenty (96). Uricase expression in experimental animals reduces fructose deleterious effects (97). The importance of FFK C is further evidenced by recent studies showing that its activity is enhanced in both obese humans with NASH (98) and fructose-fed mice (99). Its knockdown prevents fructose-induced steatosis and IR 11) (45, 93).
Since uric acid is a consequent product of ATP depletion and increased AMP in fructose metabolism, it has been used as a marker of hepatic decrease of ATP (100, 101). Studies have reported that acid uric induces oxidative stress and inflammation increasing lipogenesis, decreasing FA oxidation as well as AMPK activity (49, 50, 100) similar to what happens when systems such as nicotinamide adenine dinucleotide phosphate-oxidase (NADPH oxidase) and nuclear factor-kappa B (NF-kB) are activated (102, 103).
Studies where the uric acid synthesis inhibitor allopurinol has been used, have shown that a decrease in uric acid improves the MetS induced by fructose (93) and that this decrease in uric acid has a beneficial impact on both blood pressure and IR in humans (104-106), besides, acid uric promotes to NALFD due it effect of increase lipogenesis (49, 50, 107).
The group of Lustig et al has shown that SSBs have an impact on uric acid levels and blood pressure even in adolescents (90), highlighting the need for timely interventions in this age group to prevent future complications. Furthermore, these authors have highlighted that in addition to a regulation of salt intake, a regulation in sugar consumption, and therefore fructose, should be a treatment goal to prevent both hypertension and the metabolic syndrome (91).
Fructose exerts effects on both adipose tissue and liver, including adipogenesis, oxidative stress, inflammation, and glucocorticoid activation (71, 108, 109) which induces an increase in proliferation and differentiation of adipocytes (110).
The activation of inactive glucocorticoids such as cortisone in humans and 11-dehydrocorticosterone in rodents to their active forms, cortisol and corticosterone respectively (110) refers to an increase in bioavailability of these active forms within cells (7, 111). This glucocorticoid transformation is exerted by the enzyme 11 beta-hydroxysteroid dehydrogenase (11-beta-OHSDH), which is expressed both in the liver and in adipose tissue (and in other tissues such as the kidney and skeletal muscle) and is found in the luminal membrane of the endoplasmic reticulum (ER) (110, 112).
This enzyme is crucial for glucocorticoid activation via its reductase activity, which is dependent on NADPH (7, 71, 113). This reductase activity is increased in the presence of hexose 6 phosphate dehydrogenase (H6PDH), which forms NADPH in the ER lumen and therefore maintains the reducing power (109,114-116). In addition to these cofactors, 11-beta-OHSDH is induced in the presence of pro-inflammatory cytokines (114,117-119). Thus, the way in which fructose activates glucocorticoids is via stimulating an inflammatory state and activating NADPH, which in turn induces 11-beta-OHSDH (110). In addition, studies have shown that fructose is capable of affecting the gene expression of 11-beta-OHSDH (120, 121). We summarize these data in Figure 4.
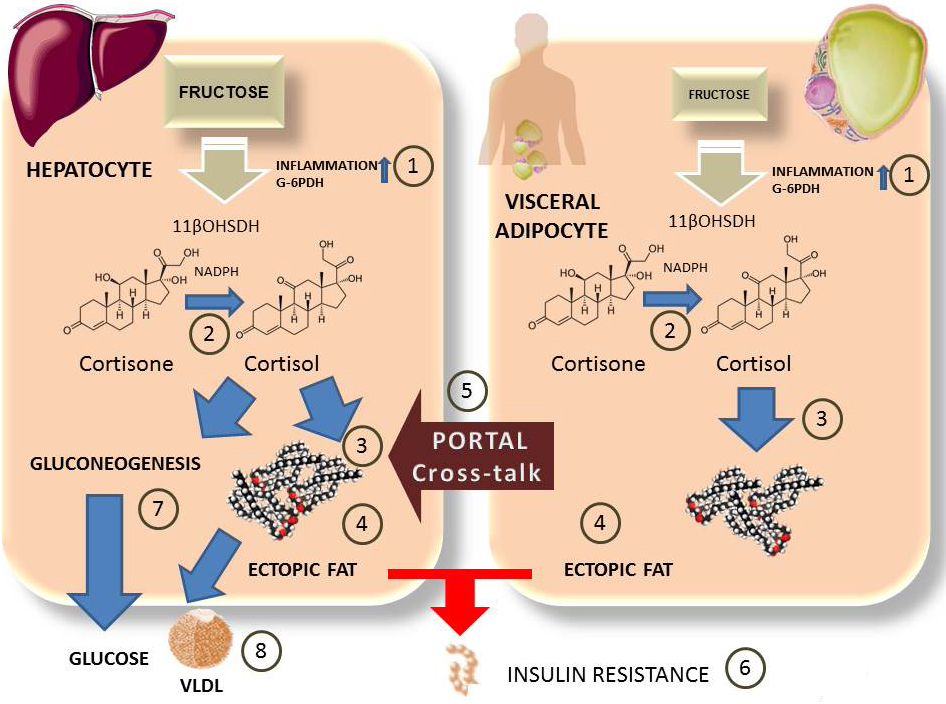 Figure 4
Fructose and cross-talk between visceral adipose tissue and hepatocytes. The role of cortisol. Fructose in hepatocytes (over 90% percent of intake) or visceral adipose tissue (minor but non-negligible concentrations) also induces local inflammation and activation of G6PDH 1). This leads to activation of 11βOHSDH which turns inactive cortisone into cortisol 2). Cortisol stimulates fat synthesis 3) in both tissues as well as deposit of ectopic fat 4). Visceral adipose tissue cross-talks via portal circulation with inflammatory molecules as well as FA which enhance liver IR. Cortisol stimulates gluconeogenesis and hepatic glucose output 7), as wells as hyperlipidemia 8).
Regarding the inflammation caused by fructose (122), studies have reported that its consumption can lead to infiltration of macrophages in adipocytes, which promotes release of pro-inflammatory cytokines and increased inflammation (116,119,123-125). In addition, fructose also participates in the development of inflammation and insulin resistance which induces ER stress in adipocytes (122) which depletes the expression of endoplasmic reticulum oxidoreductase 1 alpha (ERO-1alpha), an ER chaperon responsible for regulating the secretion of adiponectin, adipokine considered anti-inflammatory and insulin sensitizer (126). This state of inflammation caused by fructose stimulates 11-beta-OHSDH and elevates cortisol within cells with its consequent effects involved in different metabolic alterations including components of MetS (113, 124, 127, 128).
A close relationship has been reported between 11-beta-OHSDH, cortisol, obesity and MetS (127-130) since the cellular bioavailability of cortisol induces processes involved in the components of MetS. In fact studies have reported that people with metabolic syndrome show an increased expression of 11-beta-OHSDH and intracellular cortisol (131), a state similar to key metabolic processes present in Cushing's syndrome, which is characterized by an excess of glucocorticoids (132).
In regards to the effects of glucocorticoids active in adipose tissue, it has been documented that there is an increase of intracellular cortisol in subcutaneous adipocytes (110) (where 11-beta-OHSDH activity is doubled) (133, 134). This can be induced by the effects of fructose, resulting in insulin resistance in subcutaneous adipocytes, thereby inhibiting the entry of FA and promoting greater flow and storage of unesterified FA in visceral deposits, mainly liver and visceral adipose tissue (VAT) (110,130,135-137).
11-beta-OHSDH also has an effect on hypertension since it is expressed in vascular tissue and can influence the homeostasis of blood pressure. It has been described that glucocorticoids produce a vasoconstrictor effect (138) which can induce endothelial dysfunction (139).
It is important to note that unlike glucose, fructose induces this glucocorticoid activation; in vitro studies have reported that glucose-6-phosphate (G6P) and fructose-6-phosphate (F6P) stimulate the reductase activity of 11-beta-OHSDH (71, 110) both in liver microsomes and in adipose tissue microsomes. In the latter, the presence of ER-luminal F6P isomerase forms G6P through the formation of NADPH dependent of hexose-6-phosphate dehydrogenase (H6PDH) (109). In addition, studies have reported that fructose compared to glucose generates more ER-luminal NADPH since fructose is easily transported through the plasma membrane and F6P through the ER membrane compared to glucose and G6P (71).
Finally, although more studies are required, it has been suggested that cortisol effects induced by fructose can be mediated by the activity of FFK-C from the liver through a metabolic crosstalk and inflammation (126).
Therefore, when 11-beta-OHSDH increases cortisol within the cells, it plays a role in the increase of visceral fat, inflammation, IR, hyperlipidemia and hypertension; characteristics of MetS.
Fructose-mediated advanced glycation endproducts (AGEs) formation via the Maillard reaction in foods may also be implicated in inflammation and MetS (140). Though well known by food chemists for decades, the Maillard reaction by fructose at physiological temperatures and pressures was studied starting only in the 80’s (141). These early studies helped establish the potential harmful effects of fructose on proteins as far more potent than those from glucose. The Maillard reaction (adduct formation between reactive carbonyls in glucose, fructose and their metabolites-such as methylglyoxal or deoxyglucosone-with amino groups in protein, DNA and lipids) has been implicated in diabetes complications. Fructose is 8 to10 times more reactive than glucose for Maillard reaction product formation as a result of the higher stability of its open chain form and its keto group. It does not form the Amadori but the Heyns product (141). The common methods employed for glucose glycation do not detect the Heyns products and/or other fructose-mediated adducts which has slowed down research on the potential role of fructose glycation in the pathogenesis of chronic disease in humans. Fructose-AGE concentration was measured in more than 100 commercial products (142). The highest levels of Fructose-AGE were shown in yoghurt beverages. Glycation adducts in food can be absorbed (up to 10% of dietary AGEs are absorbed) and exert their deleterious effects via engagement of the pro-inflammatory receptor for advanced glycation end products (RAGE) (141). In Figure 5 we summarize two pathways by which fructose may exert pro-inflammatory effects by yet another mechanism.
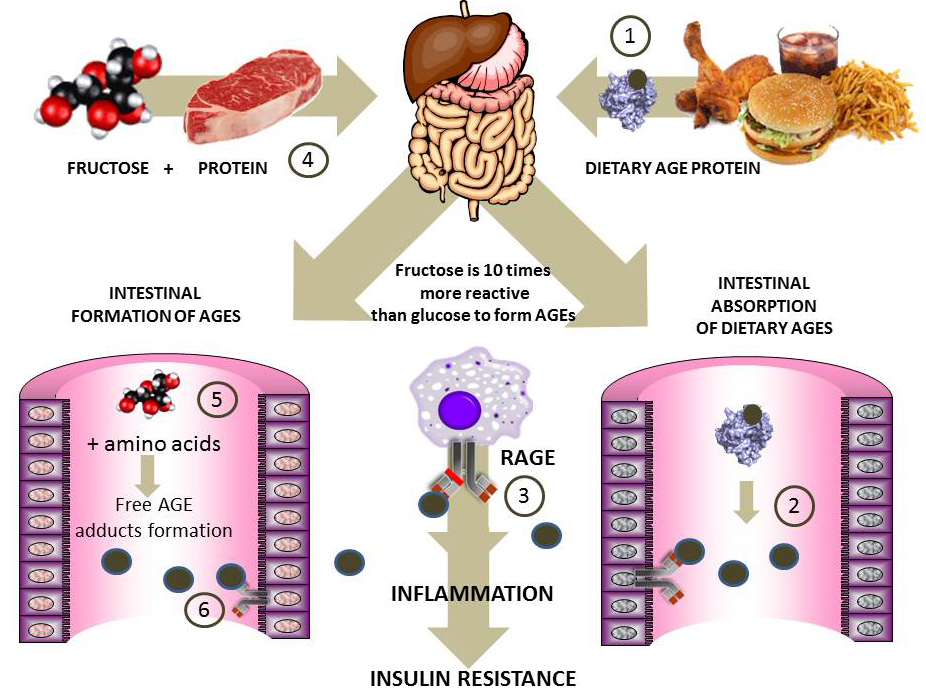 Figure 5
Fructose-derived advanced glycation products: the role of dietary AGEs in inflammation and insulin resistance. The Maillard reaction between carbonyls and proteins has been implicated in the pathogenesis of diabetic complications. Fructose (10 times more reactive than glucose) forms AGEs in processed foods. 1) Preformed AGE proteins in food (processed food is very high in fructose) results in intestinal digestion and absorption of AGE peptides 2) which bind to RAGE and are pro-inflammatory and generators of IR 3). Another putative pathway, for which epidemiological evidence (143, 144) and our own in vitro (145, 146) data vouch for is intestinal formation of AGEs 5) and 6) when excess fructose and amino acids or peptides are found in the intestinal lumen as a result of the co-ingestion of sugar and proteins 4). These AGEs, when absorbed, will generate the same effects as shown in 3). More evidence should be forthcoming on the relative role of these processes in fructose-induced pathogenesis of IR.
Different scientific evidence has shown a positive association between sugar-sweetened beverages (SSBs) and weight gain or obesity, and concluded that this type of beverages or free consumption of sugar in people who ingest them influence body weight by increasing both intake energy through its consumption and increasing appetite (113, 147, 148). Indeed, more than 80% of the studies without conflicts of interest with the food industry find a positive correlation between SSBs and obesity. The way in which fructose increases appetite or decreases satiety is through inducing an insulin and leptin resistance (44,149-151) state as shown in Figure 6. This has deleterious effects promoting metabolic diseases such as obesity, MetS, and cardiovascular disease (152).
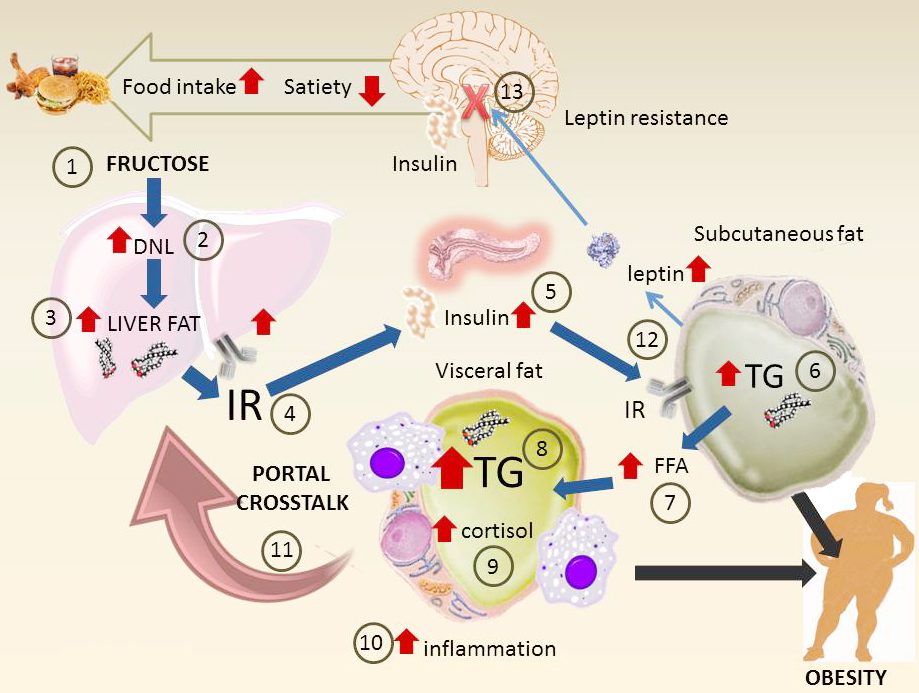 Figure 6
Main pathways of fructose metabolism that lead to insulin resistance, metabolic syndrome and obesity. This diagram summarizes the key mechanisms at the whole body level. Surges of fructose 1) (together with glucose that increases insulin secretion) increase DNL 2) and liver fat 3). These in turn generate hepatic IR 4). Hyperinsulinemia ensues as a compensating mechanism 5). Subcutaneous fat, less resistant to insulin, accumulates fat 6) but also increases output of FFA 7). Visceral fat uptakes fatty acids and accumulates TG 8), increases in size and is inflamed. In situ cortisol production enhanced by fructose increases the effect 9). The mass of visceral fat uploads its inflammatory molecules as well as FFA to the portal vein which then increases hepatic IR 11). Subcutaneous fat increase leptin secretion (which would lead to decreased appetite and more energy expenditure) 12). However, hyperinsulinemia leads to CNS leptin resistance. This leads to less satiety, more food intake and the cycle goes on.
Leptin is a hormone synthesized mainly in adipose tissue which circulates in proportion to body fat. This hormone is a key regulator of energy intake via its interaction with hypothalamic centers, increasing satiety and energy expenditure (44, 153). However, both obesity and fructose consumption induce an alteration in the function of leptin, called leptin resistance (44, 154) where the hypothalamic centers become resistant to its action, consequently the satiety response that should be produced is inhibited resulting in greater food consumption (6). Studies have reported that a chronic consumption of fructose is associated with increased plasma leptin levels and insulin alteration (155-158), however under an acute consumption of fructose there are contrasting results (44, 155).
In addition to the effects on leptin, unlike glucose or starch, fructose has also an effect on intestinal hormones related to satiety, where it may not inhibit the release of ghrelin from the intestine leading to an orexigenic effect and releases, to a lesser extent, satiety hormones such as glucagon-like peptide 1 (GLP-1) and peptide YY (PPY) (13, 157). Further studies are required to establish these effects of fructose on intake since most of the related studies are based on indirect markers of control of food intake (13) and studies with direct measures of consumption intake or satiety have not been able to establish differences between fructose and other sugars in humans (159).
Some authors have indicated hunger can be stimulated when ATP concentrations are reduced in the liver by blocking FA oxidation, (160) a characteristic of fructose metabolism fructose. They suggest increased energy intake compensates for ATP levels but when intake is from sugar, the consequences include an accumulation of fat which may increase corporal weight (161).
Another mechanism involved in the weight gain associated with fructose consumption could be the effect that sugar has on inducing pleasurable responses by stimulating dopamine in the nucleus accumbens and midbrain (150, 162). A repeated stimulation of dopamine by sugar could alter the function of dopaminergic receptors, this has been demonstrated in obese subjects through image studies, while animal studies show signs of abstinence when removing sugar (43, 163).
Therefore, weight gain and obesity induced by fructose could be related to the addictive response to sugar consumption (150, 151), reduced ATP in liver as well as a promotion of resistance to leptin (6, 164).
Although there are different epidemiological studies that evaluate the consumption of fructose in humans, causal relationships are more difficult to infer because it is challenging to separate the impact of the confounding variables that participate in these processes (13). However, among the main associations found in prospective studies is the associated fructose consumption (either through FCCS, SSBs or HFCS) with body weight gain (165), increased energy intake (166, 167), dyslipidemia, IR, T2DM (168), gout (169), chronic kidney disease (170), MetS (20) and NAFLD (9), and CVD (171).
In addition to weight, or fat mass, the total intake of energy is a confounding variable in these studies that evaluate the effects of fructose, however, studies where excess energy has been compared with diets high vs low in fructose have shown excess fructose can increase body fat and body weight in a few days (171), increase liver glucose production (53, 155, 172), increase TG (155, 172) intrahepatic fat accumulation (173), and increased uric acid concentrations (13, 172, 174).
It must be noted that fructose can be produced endogenously in the liver (and other tissues during hyperglycemia) and exerts its consequent metabolic effects through diets with high glycemic index and diets high in sodium that stimulate the enzyme aldose reductase and therefore an endogenous fructose secretion and contributing to MetS (175) (MA Lanaspa, Andres-Hernando, M Kuwabara, N Li, C Cicerchi, T Jensen, DJ Orlicky, C Roncal-Jimenez, T Ishimoto, T Nakagawa, et al. unpublished results, 2017).
As previously mentioned, is noteworthy that while glucose generates energy in the form of ATP during its metabolism, fructose consumption is able to the decrease the hepatic levels of ATP due to the quickly phosphorylaton by FFK C (Figure 1B), stimulating gluconeogenesis (49-51), lipogenesis, mitochondrial oxidative stress that alters the oxidation of fat and at the same time promotes depletion of ATP (46). Related to this it has been reported these effects can be observed after an oral ingestion of fructose equivalent to that containing a soft drink (64). A clinical study compared the effects of the consumption of glucose versus fructose sweetened beverages (which covered 25% of the total energy requirements) after 10 weeks in overweight and obese participants. The noteworthy results show that weight gain was similar with both beverages, but only the fructose beverage group showed DNL and, lipid in VAT, dyslipidemia and insulin resistance were augmented in overweight/obese participants (71, 172).
Summarizing the effects at the adipose tissue level, fructose can conduce adipogenesis, oxidative stress, inflammation, adipokine production, adipocyte hypertrophy, and as in the liver, fructose activates corticosteroids production through reductase activity of 11-beta-OHSDH (71, 112). Some studies have shown a high adipogenic potential in adipocyte precursor cells (APCs) related to fructose consumption that cause hypertrophy in adipocytes (71). An observational and longitudinal study evaluated changes in VAT after six years and evidenced that fructose may be a cause of insulin resistance and increased VAT found in consumers of major sugar-sweetened beverages amounts (176). However, the authors cannot clarify if these results were attributed only to fructose, glucose or both. Others related studies which compared the effects of fructose versus glucose have reported fructose excess mainly increase VAT while glucose excess increase subcutaneous fat (172). In addition, hypercaloric fructose-containing caloric sweeteners (FCCS) diets increase TG and acid uric levels while hypercaloric high-glucose or high-fat diets did not, without difference in weight-maintenance diet (177).
Regarding the effects of fructose on systemic IR, while some studies have reported that fructose induces IR (178-180), other studies report that fructose does not increase IR in muscle (measured by hyperinsulinemic-euglycemic clamps) (53,54,84,155,180).
Finally, regarding the effect of fructose on weight gain, studies have shown a stimulation of neural and pleasurable responses at the level of brain that are conducive to excessive energy intake (181-183), while at the hormonal level, besides insulin resistance, fructose can induce leptin resistance that can enhance hedonic responses by suppressing satiety (6,43,44,49,150,151,157,159)
The evidence from animal and human studies reviewed in this article converges to indicate a specific deleterious role of fructose in metabolism that favors DNL, liver steatosis and insulin resistance. The main pathways involved are summarized in Figure 6. Surges of fructose 1) (together with glucose that increases insulin secretion) increase DNL 2) and liver fat 3). These in turn generate hepatic IR 4). Hyperinsulinemia ensues as a compensating mechanism 5). Subcutaneous fat, less resistant to insulin, accumulates fat 6) but also increases output of FFA 7). Visceral fat uptakes fatty acids and accumulates TG 8), increases in size and is inflamed. In situ cortisol production enhanced by fructose increases this effect 9). The mass of visceral fat uploads its inflammatory molecules as well as FFA to the portal vein which then increases hepatic IR 11). Subcutaneous fat increases leptin secretion which would typically lead to decreased appetite and more energy expenditure 12). However, hyperinsulinemia leads to CNS leptin resistance leading to less satiety, increase food intake and the cycle goes on.
All these observations, highlighting the relationship between fructose consumption and MetS, obesity, NAFLD, corticosteroid activation and MG and D-lactate production require relevant attention. Even organizations such as the World Health Organization (WHO) and the American Heart Association (AHA) (184, 185) suggest limiting sugar consumption. Despite these recommendations and with the accumulating evidence on the role of fructose in MetS and obesity, there has been no unanimous opinion about the specificity of fructose as a few authors (many of whom are partially funded by the sugar industry) continue to claim that the effects are merely due to an increase in caloric intake.
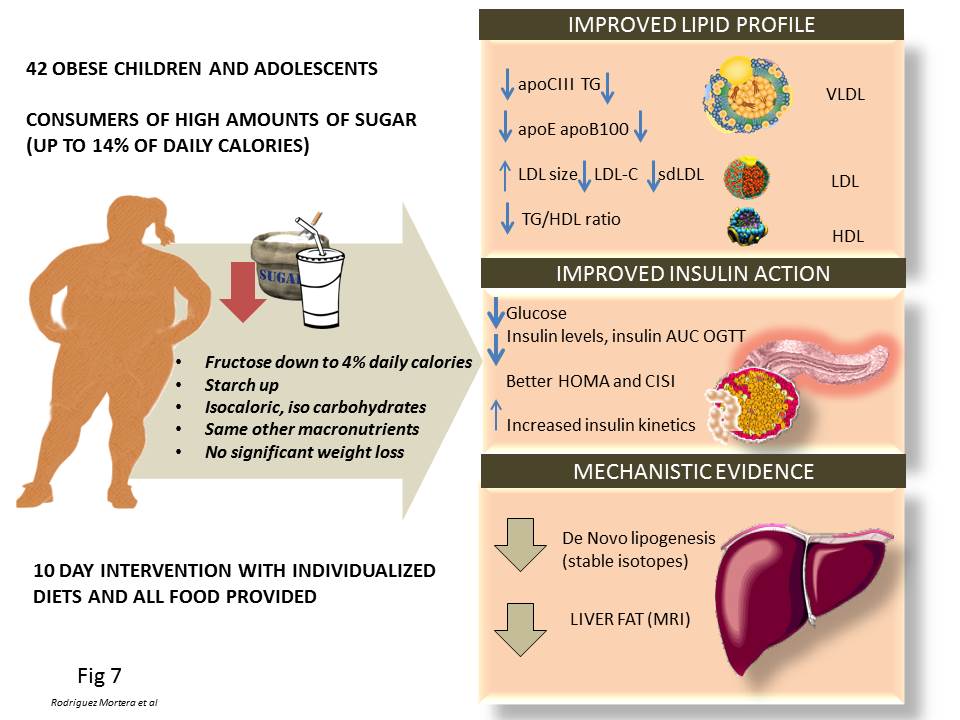 Figure 7
Evidence supporting the roles of fructose in the pathogenesis pathways summarized in this review that stem from our group studies on humans. Since overfeeding humans with sugar would lead to weight increase (and therefore a major confounding factor to interpret the data), we conducted a fructose restriction study as depicted in the figure, keeping, calories, CHO and macronutrients at the same level, so that changes could ascribed to the changes in fructose intake, which was reduced about 2/3rd from the diet of obese adolescents for only 10 days. Short-term fructose restriction with isocaloric substitution of complex carbohydrate in obese Latino & African American children whose habitual diets were high in sugar: Improved fasting lipids, lipoprotein subclasses, apo CIII, Improved fasting glucose, insulin and AUC during OGTT, Decreased hepatic de novo lipogenesis, Decreased liver fat. These results suggest that hepatic de novo lipogenesis may be an important mechanism contributing to liver fat accumulation in children, which can be reversed by short-term fructose restriction. These data suggest directionality for the effect of fructose on metabolic syndrome fructose drives hepatic fat, which in turn drives insulin resistance.
As a result, some of us decided to conduct a human intervention study that would help dissect this mechanism. We summarize our published results in Figure 7 (68, 186, 187). Since overfeeding humans with sugar would lead to a weight increase (and therefore a major confounding factor to interpret the data), we conducted a fructose restriction study as depicted in the figure, keeping calories, carbohydrate (CHO) and macronutrients constant so that changes could be ascribed to the changes in fructose intake, which was reduced by about 2/3rd from the diet of obese adolescents for only 10 days. Short-term fructose restriction with isocaloric substitution of complex carbohydrate in obese Latino & African American children whose habitual diets were high in sugar resulted in:
These results suggest that hepatic de novo lipogenesis may be an important mechanism contributing to liver fat accumulation in children, which can be reversed by short-term fructose restriction. This data suggests directionality for the effect of fructose on metabolic syndrome: fructose drives hepatic fat, which in turn drives insulin resistance. Further research is needed to fully establish the above mechanism, its long term effectiveness and the translation to adults.
We have highlighted the main metabolic effects of fructose consumption (unrelated to its caloric content) that are involved in the development of MetS, NAFLD and its association with obesity.
We have made the case that the specifics effects of fructose (as compared with glucose) on the liver are particularly germane to the development of a vicious cycle that starts with liver steatosis. In addition, we have summarized the effects in adipose tissue, cortisol activation, and the hormones involved in satiety control, all of which are affected by fructose consumption. We put forward yet other mechanisms: the formation of MG and its effect on AMPK and other proteins, and fructose derived AGEs that induces a state of inflammation and oxidative stress by engaging RAGE and processes involved in the development of these aforementioned pathologies.
These results underscore the need for more clinical and educational interventions within our population to regulate/reduce fructose consumption especially in children and adolescents, the main consumers of fructose, who have demonstrated significant metabolic alterations related to obesity and fructose consumption.
This work was funded in part by Touro University California. The authors are grateful to Dr. Ricardo Hermo for critical reading of the manuscript.