

 , Anatoliy Kazak 2,*
 , Inna Chernousova 1, Nadezhda Gallini 2, Marina Rudenko 3, Artem Vapilov 2
1 “All-Russian National Research Institute of Viticulture and Winemaking” Magarach, “RAS”, 298600 Yalta, Russia
2 Humanitarian Pedagogical Academy, V.I. Vernadsky Crimean Federal University, 295007 Simferopol, Russia
3 Institute of Physics and Technology, V.I. Vernadsky Crimean Federal University, 295007 Simferopol, Russia
Abstract
This study aimed to investigate the modeling and design of product compositions using grape stem extracts, with an emphasis on phenolic compounds and antioxidant activity. Grape stems, a significant byproduct of winemaking, are a rich source of bioactive phenolic substances.
Aqueous ethanol extracts were obtained from grape stems of European varieties; the Magarach Institute developed a new selection. Phenolic compounds were quantified using ultraviolet-visible spectrophotometry via the Folin-Ciocalteu method and high-performance liquid chromatography (HPLC). Antioxidant activity was evaluated using an amperometric method. In addition, mathematical models have been developed to predict product composition based on mixing various components. Key HPLC parameters (detection wavelength, flow rate, column temperature, injection volume) and amperometric calibration procedures are described.
The mass concentration of phenolic substances in the extracts ranged from 7.95 to 16.40 g/dm3, and the antioxidant activity ranged from 6.30 to 13.90 g/dm3. Identifying the compositions of stem extracts was conducted with a focus on studying substances with a non-flavonoid structure: phenolic acids, esters, and stilbenes. Statistical analysis (analysis of variance (ANOVA) with post-hoc t-tests) confirmed significant differences (p < 0.05) between grape varieties. Furthermore, the developed mathematical model—validated using coefficient of determination (R2) and Root Mean Squared Error (RMSE) metrics—demonstrated robust predictive capabilities for product compositions.
These results indicate that grape stems are a valuable source of bioactive compounds for developing functional products. In addition, the proposed mathematical modeling approach offers a reliable method for designing product compositions. These findings provide a basis for developing software tools to optimize product formulation in the food industry.
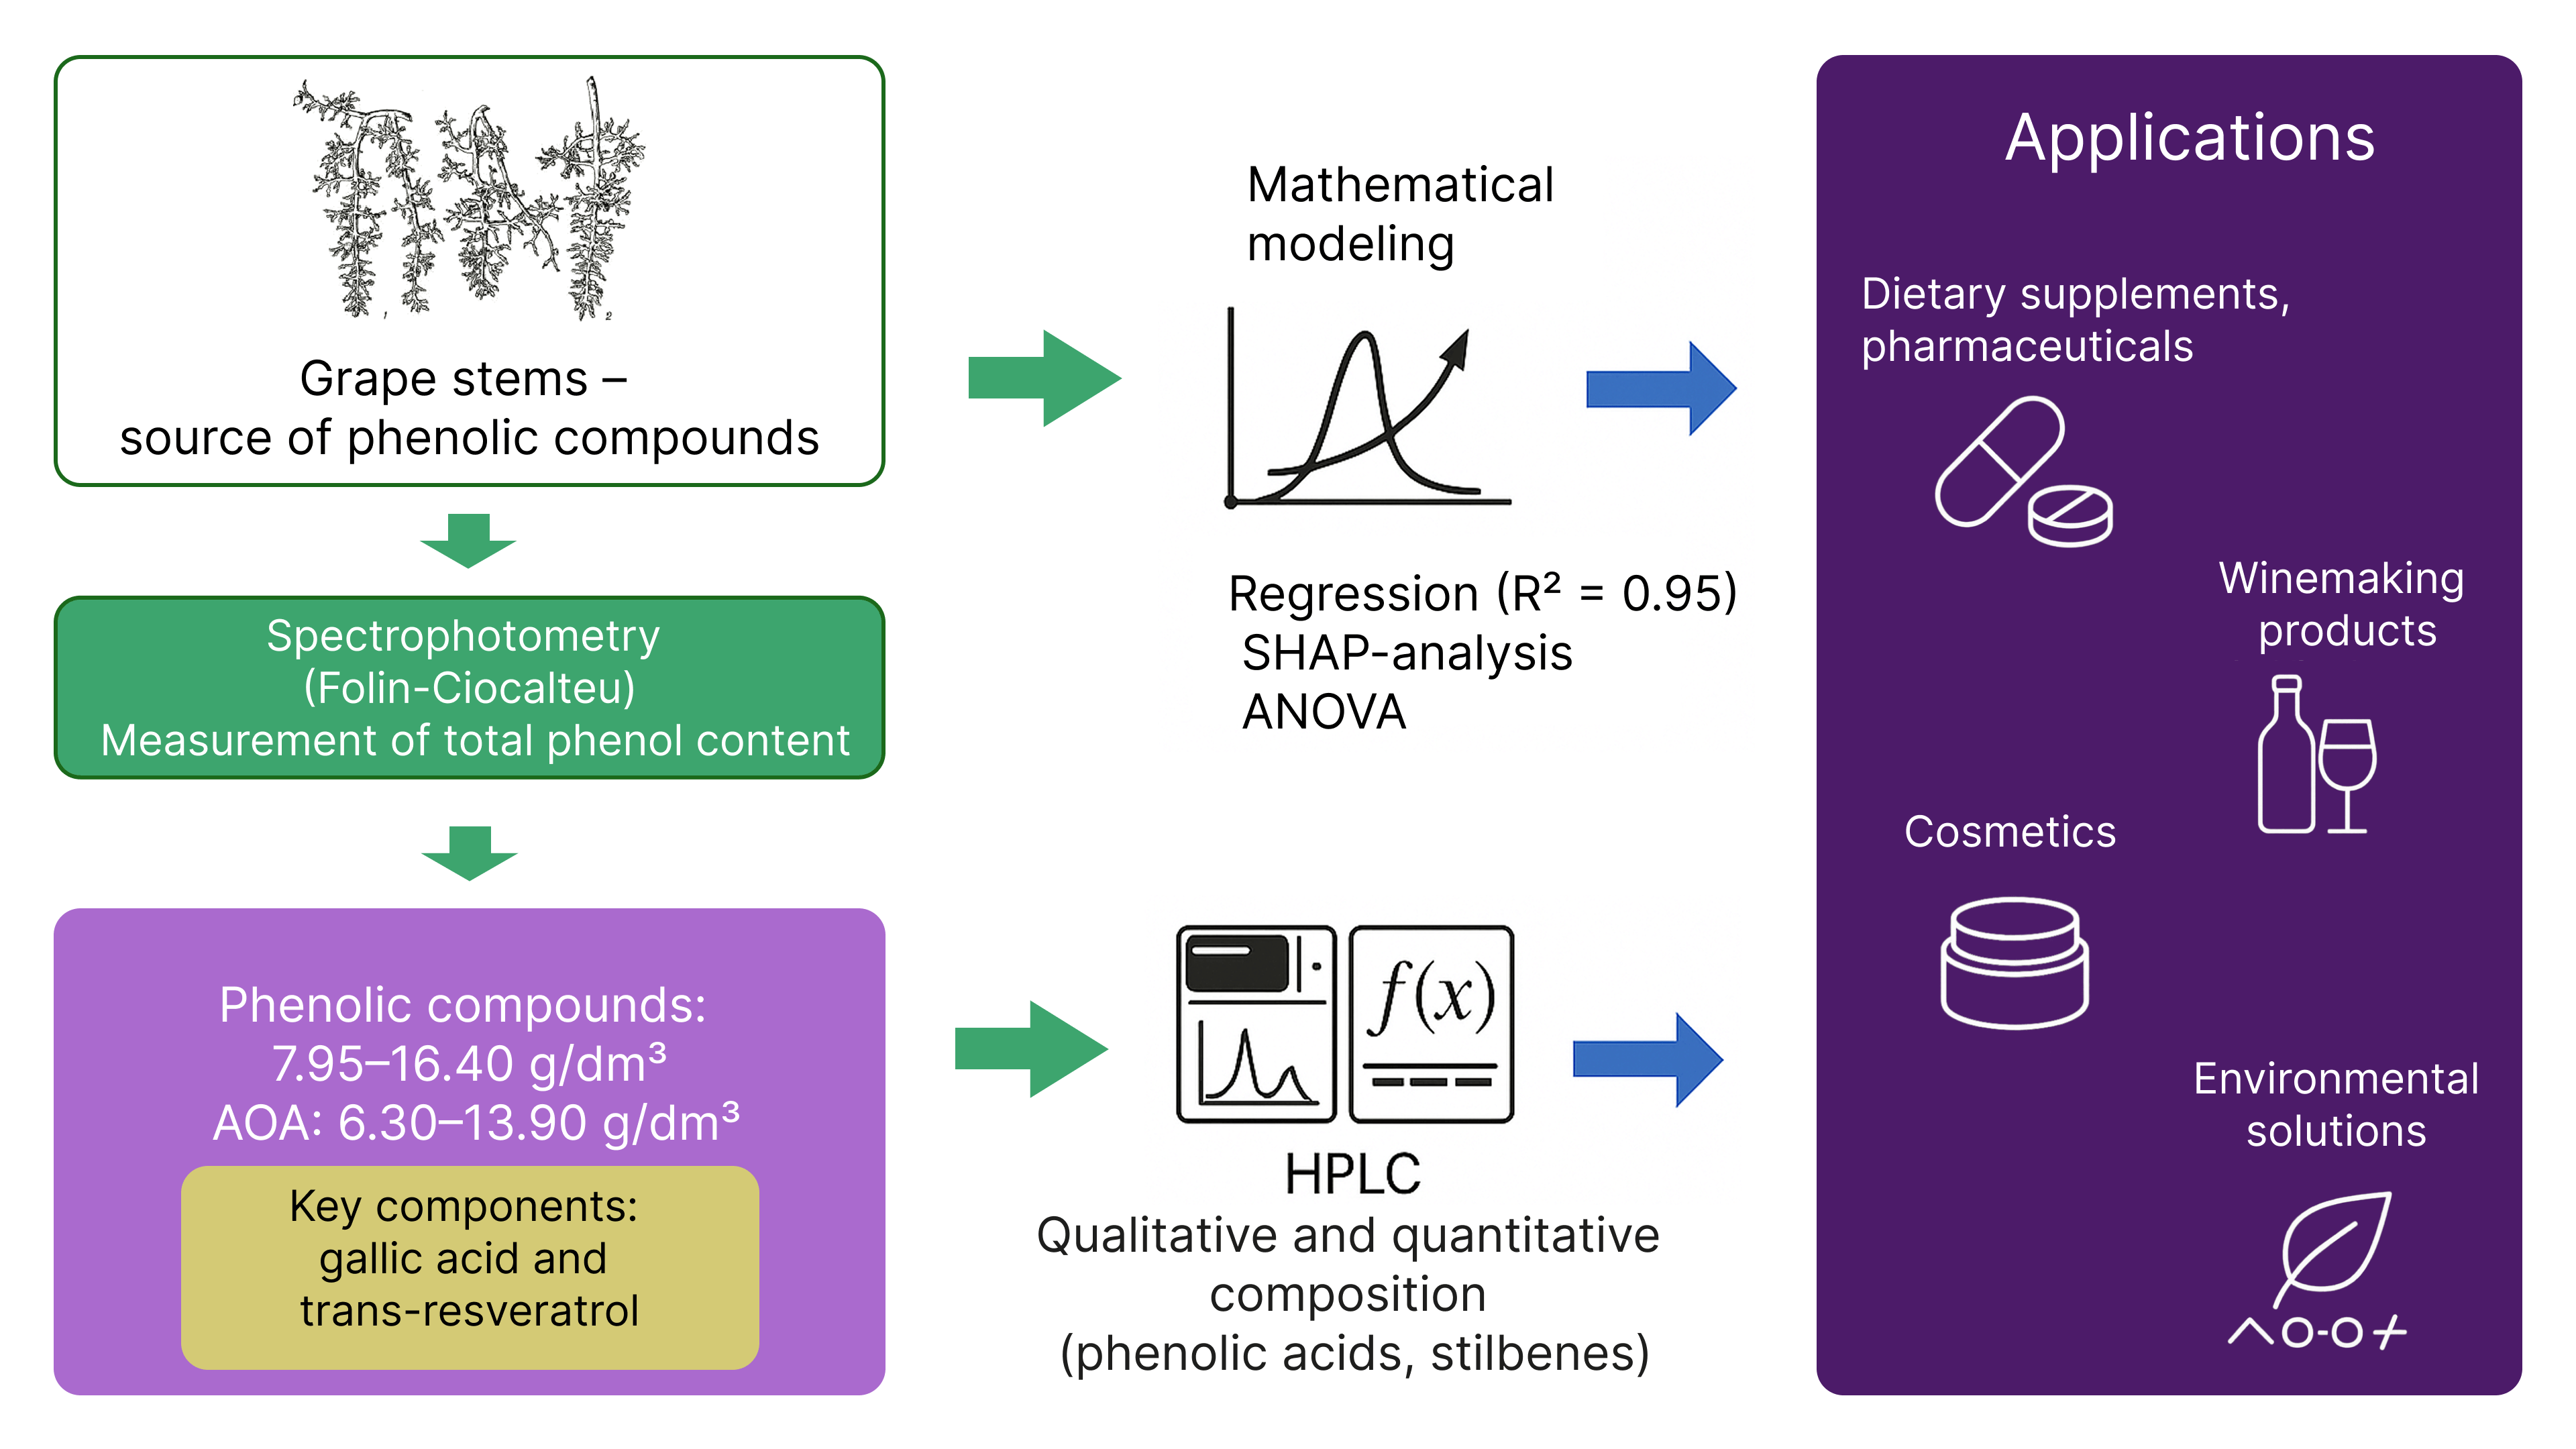
Graphical Abstract
Keywords
- optimization
- waste products
- phenols
- cinnamic acids
- benzoic acids
- stilbenes
- antioxidant activity
The phenolic composition of grapes is largely determined by the technology implemented in the processing procedure. The traditional European method for producing dry wines excludes the use of grape stems; however, the stems are a source of phenolic compounds that largely determine the magnitude of the antioxidant activity [1, 2, 3, 4, 5, 6]. As a result, stem waste, which constitutes approximately 1.4–7.5% of the processed grape mass, remains unused in the food industry (including winemaking); for example, processing 1000 tons of grapes for must and wine produces, in addition to the pomace (skin and seeds), an average of about 5 tons of stems [7, 8, 9, 10, 11]. According to Costa-Pérez et al. [12], grape stems are rich in bioactive compounds with high antioxidant activity, suggesting that the extracts from stems could serve as effective antioxidant-containing components in developing novel products with enhanced antioxidant capacity. Specifically, the non-flavonoid fraction of white grape stems includes phenolic acids and their esters and stilbenes [13, 14, 15, 16, 17].
In vivo studies have further established that key phenolic substances such as gallic acid and trans-resveratrol exhibit strong antioxidant and biological activities [18, 19, 20, 21].
Phenolic acids in grape stems are mainly represented by hydroxybenzoic acids (e.g., gallic, syringic acids) and hydroxycinnamic acids (e.g., caffeic, p-coumaric, ferulic acids). For instance, Anastasiadi et al. [14] reported that gallic acid is present in significant quantities (ranging from 176 to 184 mg/kg dry weight). In contrast, other phenolic acids were detected only at minimal concentrations, near the detection limits. These acids have been documented to possess antibacterial, antimutagenic, and anti-inflammatory effects [22, 23, 24, 25], and their biological impact is further evidenced by reductions in blood cholesterol levels [26] and inhibition of human immunodeficiency virus type-1 integrase [27]. Upon ingestion, phenolic acids undergo extensive metabolization via conjugation reactions, yielding glucuronides, methylated, and sulfate derivatives, which can enhance their biological activity relative to the native compounds [28, 29, 30, 31, 32, 33]. Phenolic acids have been shown to exhibit considerably higher antioxidant activity than well-known antioxidant vitamins in vitro [34]. Moreover, previous studies have suggested that a daily intake of approximately 200 mg of phenolic acids may be beneficial [35, 36, 37].
Stilbenes in the grape stem, such as trans-resveratrol, known
3-glucoside (trans-piceid), and oligomeric derivatives (viniferins),
further contribute to the bioactivity of the extracts [38]. Piñeiro
et al. [39] reported that the dry weight of the mass concentration of
stilbenes in extracts from white grape stems ranges from 14.3
The conducted analysis of scientific literature devoted to the extraction processes of biologically active substances from plant raw materials allowed us to simulate the process of sample preparation and subsequent extraction, which includes the following stages: drying and grinding of grape stems [58, 59, 60, 61, 62]; extraction with a 70% water-ethanol extractant [63]; ultrasonic treatment of the extraction medium [39, 64].
Despite extensive characterization of the polyphenolic profile of grape stems, a gap remains in the literature regarding optimizing product formulations that incorporate these extracts. Thus, the present study was designed to provide a comprehensive qualitative and quantitative analysis of the phenolic compounds in grape stem extracts. In addition, this study aimed to evaluate the antioxidant activity of these extracts using advanced modern analytical techniques. Furthermore, a unified mathematical model based on systems of linear equations will be developed and validated to predict and optimize the composition and properties of products formulated using grape stem extracts. The novelty of this work lies in its integrative approach, combining detailed chemical characterization with mathematical modeling to facilitate the design of functional products. By maximizing the utilization of grape stems—an underexploited resource in the food industry—this study seeks to establish a robust methodological framework for future product development.
Although previous studies have covered the polyphenolic composition of grape stems in detail, a clear gap in the literature remains regarding optimizing product formulations containing stem extracts. Existing data indicate high contents of both monomeric and polymeric phenolic compounds with significant antioxidant activity, but the practical application of these data in technological processes remains poorly understood. In addition, standard extraction and analytical methods do not always allow a full assessment of the effect of each compound on the final product quality. Thus, there is a need to develop an integrated approach that would combine chemical characterization with mathematical modeling and statistical analysis (including analysis of variance (ANOVA)). Such an approach will accurately predict product properties and optimize technological processes, ensuring maximum use of grape stems, a resource traditionally considered a waste. As a result, this section highlights the relevance of the study and identifies areas where further work is needed to improve the efficiency of using bioactive components in the food industry.
To achieve these goals as mentioned above, this study included exploratory data analysis to identify patterns of distribution and relationships between phenolic compounds, the development of regression models to predict the concentration of key components, such as stilbenes, and the use of SHapley Additive exPlanations (SHAP) analysis to determine the contribution of individual phenolic substances to the formation of the predictive model. In addition, this study will potentially apply a multiple-factor analysis to visualize the multivariate structure of the data and identify differences between grape varieties, conduct ANOVA to assess the statistical significance of differences between varieties, and assess the potential use of grape stem extracts in the food and pharmaceutical industries.
This study covers two main datasets that reflect the polyphenolic composition of grape stems. The data are divided into two categories: non-flavonoid and flavonoid phenolic compounds. The analyses are performed on several grape varieties, which allows the variability in the phenolic composition to be assessed depending on the array. This study also includes a synthetic data augmentation method to increase the sample size and provide more reliable statistical modeling. Thus, the presented methodology combines chemical characterization, statistical modeling, and machine learning, creating a basis for developing products with high antioxidant contents. Grape stem extracts can be useful in winemaking and the food and pharmaceutical industries, where natural antioxidants are required to stabilize products and improve their biological value.
This study has high practical significance since it aimed to solve the problem of not using grape stems, which are waste-rich, in bioactive phenolic compounds with pronounced antioxidant activity. Integrating modern analytical methods with synthetic data augmentation and mathematical modeling allows the detailed characterization of the composition of both non-flavonoid and flavonoid phenols and the development of highly accurate and interpretable models for predicting the properties of final products. These results can be used to optimize technological processes and develop functional products, which significantly increase the economic and environmental value of grape stems in the food and pharmaceutical industries.
The total content of phenolic compounds was determined using the
Folin–Ciocalteu reagent. To prepare the reagent, 100 g of sodium tungstate
(Na2WO4
High-performance liquid chromatography (HPLC) was implemented to analyze phenolic substances in various forms (monomeric, oligomeric, and polymeric). The eluents used were methanol (Vekton) (solution A) and an aqueous solution of trifluoroacetic acid (C2HF3O2) (Vekton) at a concentration of 0.6 g/100 cm3 (solution B). Standard samples of trans-resveratrol and syringic acid (all from Sigma-Aldrich Chemie GmbH, Steinheim, Germany), gallic acid, and caffeic acid (Fluka, Chemie GmbH, Buchs, Switzerland) were employed to identify individual phenolic compounds.
The antioxidant activity (AOA) evaluation was performed using an amperometric method based on the generated current measurement during the oxidation of antioxidant molecules. The current value directly depended on the concentration and chemical structure of the antioxidants in the sample. The standard used was 6-hydroxy-2,5,7,8-tetramethylchroman-2-carboxylic acid (Trolox-C) (Sigma-Aldrich Chemie GmbH).
The subject of the study was alcoholic stem extracts of 11 white grape (Vitis vinifera L.) varieties (Aligote, Rkatsiteli, Kolombar, Shabash, Tashly, Soldaya, Abla, Aurora, Pervenets Magaracha, Podarok Magaracha, Kok Pandas) from the ampelographic collection at National Research Center “Kurchatov Institute”—“Magarach” (NRC “Kurchatov Institute”—“Magarach”). The extracts were prepared from stems remaining after the production of white wines during the vintages of 2012–2023, while the grapes were characterized by technological maturity and met the requirements for grapes to be used in the production of grape wines (the mass concentration of sugars in grapes is a maximum of 400 g/dm3). The raw material was crushed into particles with a size of 1–3 cm using the Bosch AXT Rapid 2000 (Bosch, Miskolc, Hungary) unit, after which it was poured with a 70% aqueous ethanol solution. To accelerate the extraction of phenolic compounds, ultrasonic treatment was applied at a frequency of 35 kHz using the Bandelin Sonorex RK 255 H (Bandelin, Berlin, Germany) unit for 10–20 minutes until each substance achieved the equilibrium concentration [39, 64, 65, 66, 67, 68].
The total content of phenolic compounds was determined using a single-beam scanning spectrophotometer Specord 40 Analytik Jena (Analytik Jena, Jena, Germany) in the wavelength range of 190–1100 nm. HPLC was applied to determine the chemical composition of the phenolic compounds using the Agilent Technologies 1100 system (Agilent Technology, Waldbronn, Germany) equipped with a diode-array detector and a Zorbax SB-C18 column (Agilent Technology). The AOA values were determined using the flow amperometric analyzer “Tsvet Yauza-01-AA” (NPO “Khimavtomatika”, Moscow, Russia).
The colorimetric method is based on the ability of phenolic compounds to reduce phosphotungstic and phosphomolybdic acids, which are components in the Folin-Ciocalteu reagent, and form colored tungsten (W8O23) and molybdenum oxides (Mo8O23). The intensity of the blue coloration is proportional to the concentration of phenols and was measured colorimetrically. Measurements were performed in quartz cuvettes with a 1 cm optical path.
A calibration graph was constructed using gallic acid solutions in 100 cm3 volumetric flasks by adding 2.5, 5.0, 7.5, 10.0, 12.5, 15.0, 17.5, 20.0, and 25.0 cm3 of a gallic acid standard solution. Next, 1 cm3 of distilled water was added to the flask for the control solution. Then, 1 cm3 of Folin-Ciocalteu reagent, 15–20 cm3 of distilled water, and 10 cm3 of sodium carbonate solution were added to each flask, and distilled water was added until the final volume was achieved. After 30 minutes, the optical density was measured at a wavelength of 670 nm against the control solution. A calibration graph was plotted based on the obtained optical density values.
The qualitative and quantitative composition of phenolic substances in the studied samples was determined by HPLC in gradient mode using an Agilent Technologies chromatographic system (model 1100). A Zorbax SB-C18 chromatographic column with a size of 2.1–150 mm, packed with silica gel, with a grafted octadecylsilyl phase possessing a sorbent particle size of 3.5 µm, was used to separate the substances. The eluent composition during chromatography was changed according to the content of component B, and the following scheme was applied: 0 min 8%; 0–8 min 8–38%; 8–24 min 38–100%; 24–30 min 100%. The eluent flow rate was 0.25 cm3/min. The volume of the injected sample was 2 µL; column thermosetting was 40 °C. Chromatograms were recorded at the following wavelengths: 280 nm for gallic acid and 313 nm for hydroxycinnamic acid derivatives. Individual compounds were identified by comparing their spectral characteristics with those described in the literature and by matching the retention time of the peak being determined and the peak of the standard sample. The spectral characteristics of individual substances were confirmed using literature data [69, 70, 71, 72, 73, 74, 75]. The quantitative content of individual components was calculated using calibration graphs for the dependence of the peak area on the concentration of the substance, constructed using standard substance solutions. All determinations were performed in triplicate.
The electric current generated by the oxidation of antioxidant molecules in a test sample consisting of one or a mixture of substances on the surface of the working electrode at a certain potential was converted into a digital signal and compared with the signal obtained from the antioxidant standard under the same detection conditions. Calibration curves were constructed using a series of measurements of standard solutions with concentrations of 0.5, 1.0, 5.0, and 10.0 mg/dm3. Five consecutive measurements of the analyzer output signal were conducted for each parallel sample of the analyzed specimen, and the desired value (in terms of Trolox-C) was calculated for each input using the calibration characteristic. The arithmetic mean of the obtained values and the relative standard deviation were also calculated. Accordingly, a 2.2 mM H3PO4 solution was used as an eluent; the eluent flow rate varied from 1.0 to 5.0 cm3/min. The voltage potential varied from +2.0 to –2.0 V. Five consecutive measurements of the standard solution signals (output curve area) were carried out at different potentials. The arithmetic mean of five measurements (standard deviation no more than 5%) was recorded as the result. Based on the obtained data, a calibration graph was constructed with the coordinates: X represents the standard signal (output curve area); Y denotes the standard concentration, mg/dm3, described by the equation Y = aX + b. The approximation coefficient was 0.99. The reproducibility of the method relative to the Trolox-C standard was 8.6%, and the convergence of the results obtained was 5%. The calculation of the convergence and reproducibility of the method was carried out using the Spline program.
This study aimed to create unified methodological approaches to designing and modeling the composition and properties of products using stem extracts.
The objects of the study were mathematical models and methods for setting and solving problems in compiling and optimizing the composition of products using stem extracts.
A synthetic data augmentation method was used to increase the sample size and improve the statistical robustness of the models. The original values of phenolic compound concentrations were expanded by adding random noise distributed according to the normal law. In this case, the distribution parameters (mean and standard deviation) for each feature were determined based on the calculated statistical characteristics of the original data. Synthetic observations were generated for each grape variety and then combined with the original data by concatenation. This approach imitates the natural variability of phenolic concentrations and provides sufficient data for building reliable regression models and conducting other statistical analyses.
All experimental data were processed using standard statistical software. The mean and standard deviation were calculated for all triplicate measurements. Calibration curves for both HPLC and amperometric analyses were constructed with a minimum of five concentration points and validated by checking the coefficient of determination (R2). To control the data quality, control samples were regularly analyzed, which allowed for the stability of the devices to be monitored and possible deviations in the indicators to be promptly detected. The established criteria for repeatability and accuracy of measurements were strictly observed, and the results obtained were systematically compared with the standard values. This ensured the high reliability of the data and reproducibility of the experiment.
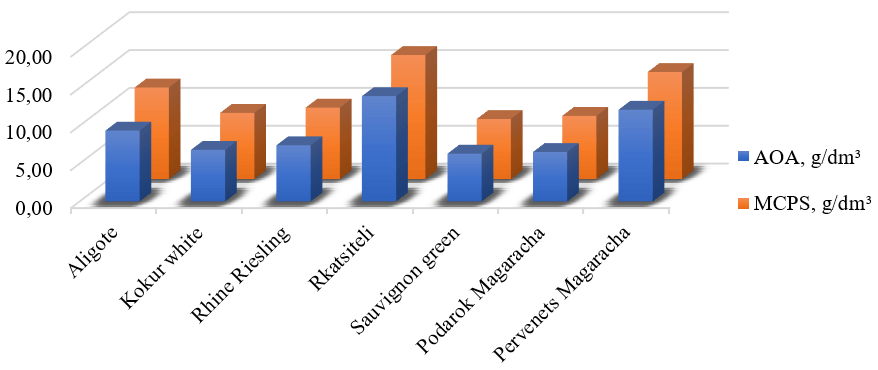
The values of the mass concentration of phenolic substances (MCPSs) and AOA of the aqueous ethanol extract experimental samples from white technical grape stems are presented in Fig. 1. According to our research, 11 phenolic compounds with the non-flavonoid structure were identified in the composition of the phenolic complex of the water–ethanol extracts from white grape stems (Aligote, Kokur white, Rhine Riesling, Rkatsiteli, Sauvignon green, Podarok Magaracha, Pervenets Magaracha) that reached technological maturity and were processed into wine.
 Fig. 1.
Mass concentration of phenolic substances and antioxidant activity of aqueous ethanolic extracts from white grape stems. AOA, antioxidant activity; MCPSs, mass concentration of phenolic substances.
The mass concentration of phenolic substances determined in the aqueous ethanol
extracts from grape stems was between 7.95 and 16.40 g/dm3. The final result
was taken as the arithmetic mean of two parallel determinations, the discrepancy
between which did not exceed (for the measurement range of 3000–20,000
mg/dm3) 39 mg/dm3. The error limit for measuring the mass concentration
of phenolic substances at a confidence probability of p = 0.95 for the
specified measurement range was
A study of the qualitative and quantitative phenolic compositions of grape stems revealed that these 11 compounds include biologically active substances consisting of phenolic acids and their esters (caftaric acid, coutaric acid, caffeic acid, ferulic acid, p-coumaric acid, ellagic acid, gallic acid, protocatechuic acid, syringic acid, and the ethyl ether of p-coumaric acid) and stilbenes. Data presented in Table 1 show that white grape stems possess a diverse phenolic composition, with both similarities and differences in the qualitative and quantitative content of individual compounds and compound groups.
| Phenolic composition of aqueous ethanol stem extracts, mg/dm3 | Aligote | Rhine Riesling | Rkatsiteli | Pervenets Magaracha | |
| Hydroxycinnamic acids and their esters | |||||
| Caftaric acid | 113.7 |
134.9 |
169.0 |
146.7 | |
| Coutaric acid | 12.4 |
17.3 |
14.7 |
15.8 | |
| Caffeic acid | 5.9 |
3.2 |
10.1 |
8.2 | |
| Ferulic acid | 9.1 |
10.0 |
19.8 |
12.7 | |
| p-coumaric acid | 1.5 |
2.3 |
4.6 |
5.4 | |
| Ethyl ether of p-coumaric acid | 1.8 |
2.0 |
8.8 |
3.7 | |
| Ellagic acid | 3.9 |
3.0 |
8.1 |
7.8 | |
| Hydroxybenzoic acids | |||||
| Gallic acid | 87.5 |
69.8 |
171.1 |
130.5 | |
| Protocatechuic acid | 3.1 |
3.4 |
6.8 |
11.9 | |
| Syringic acid | 1.5 |
3.6 |
7.1 |
4.5 | |
| Stilbenes | |||||
| trans-resveratrol | 23.8 |
28.0 |
32.5 |
26.8 | |
The aqueous–ethanolic extracts from grape stems include up to 4.4% of the mass concentration of phenolic substances of stilbenes compounds [39].
The qualitative and quantitative compositions of the aqueous ethanol extracts from grape stems of the most common European varieties in the southern regions of Russia: Aligote, Rhine Riesling, Rkatsiteli, and grape varieties of an interspecific selection from the NRC “Kurchatov Institute”—“Magarach”—Pervenets Magarach. Analysis of the qualitative and quantitative phenolic compositions for the aqueous ethanol extracts from grape stems showed that the content of biologically active compounds, such as hydroxybenzoic acids and stilbenes, in the extract samples from the Rkatsiteli grape variety, were higher by 47.8% and 17%, respectively, than those from other varieties.
A linear regression model was developed using the phenolic profile parameters as input data to predict the stilbene concentration. The resulting model demonstrated high accuracy, as evidenced by the determination coefficient R2 = 0.95, calculated on the test set (Fig. 2). This confirms that the phenolic profile can be a reliable predictor of the stilbenes content in the samples.
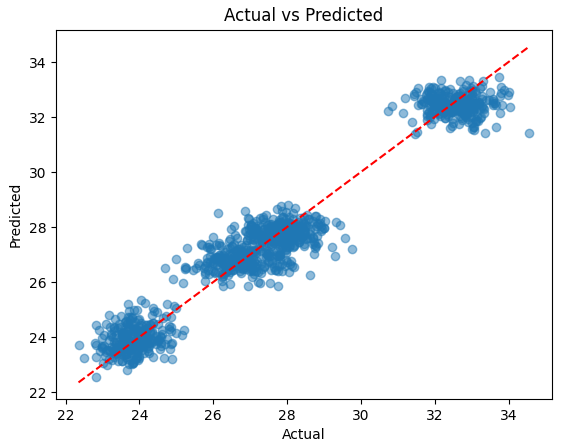 Fig. 2.
Comparison of actual and predicted stilbenes concentrations.
In addition to a high coefficient of determination (R2 = 0.95), the model demonstrated a low root mean square error (RMSE = 1.12 mg/dm3), indicating strong predictive accuracy. These metrics confirm the robustness of the model when applied to both original and synthetically augmented data.
Compared to traditional regression models, our approach integrates SHAP analysis, providing interpretability and allowing for the identification of key predictors. Moreover, the incorporation of synthetic data enhances model generalizability without compromising accuracy. The model was further validated on a subset of experimental data, demonstrating reliable predictive performance in real-world conditions.
When training the model, an expanded set was used, including both the original data and synthetically generated observations, which improved the generalization ability of the model. These data were randomly divided into training (75%) and testing (25%) subsets.
Fig. 2 compares the actual and predicted stilbenes concentrations from the model (actual vs. predicted). As demonstrated in Fig. 2, most points are concentrated along the diagonal line, indicating a high correspondence between the predictions and the actual data.
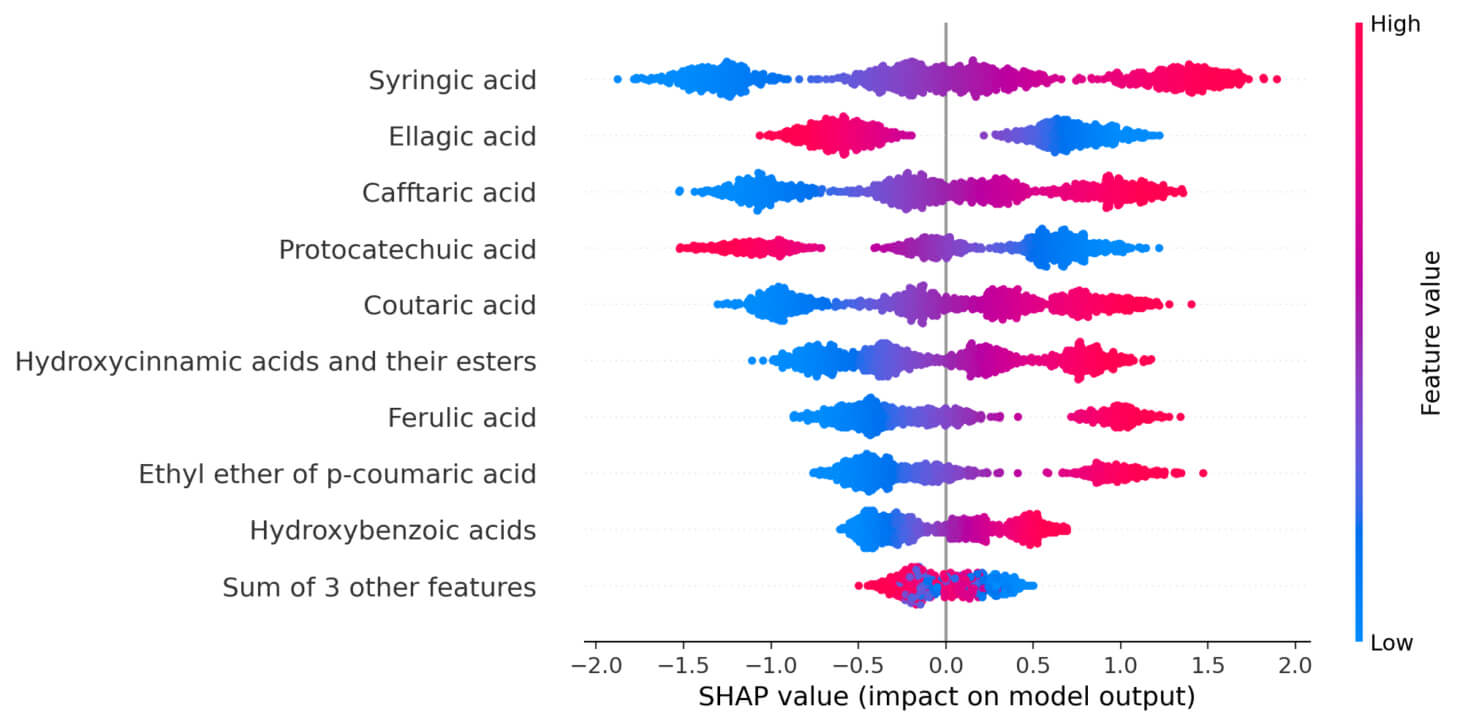
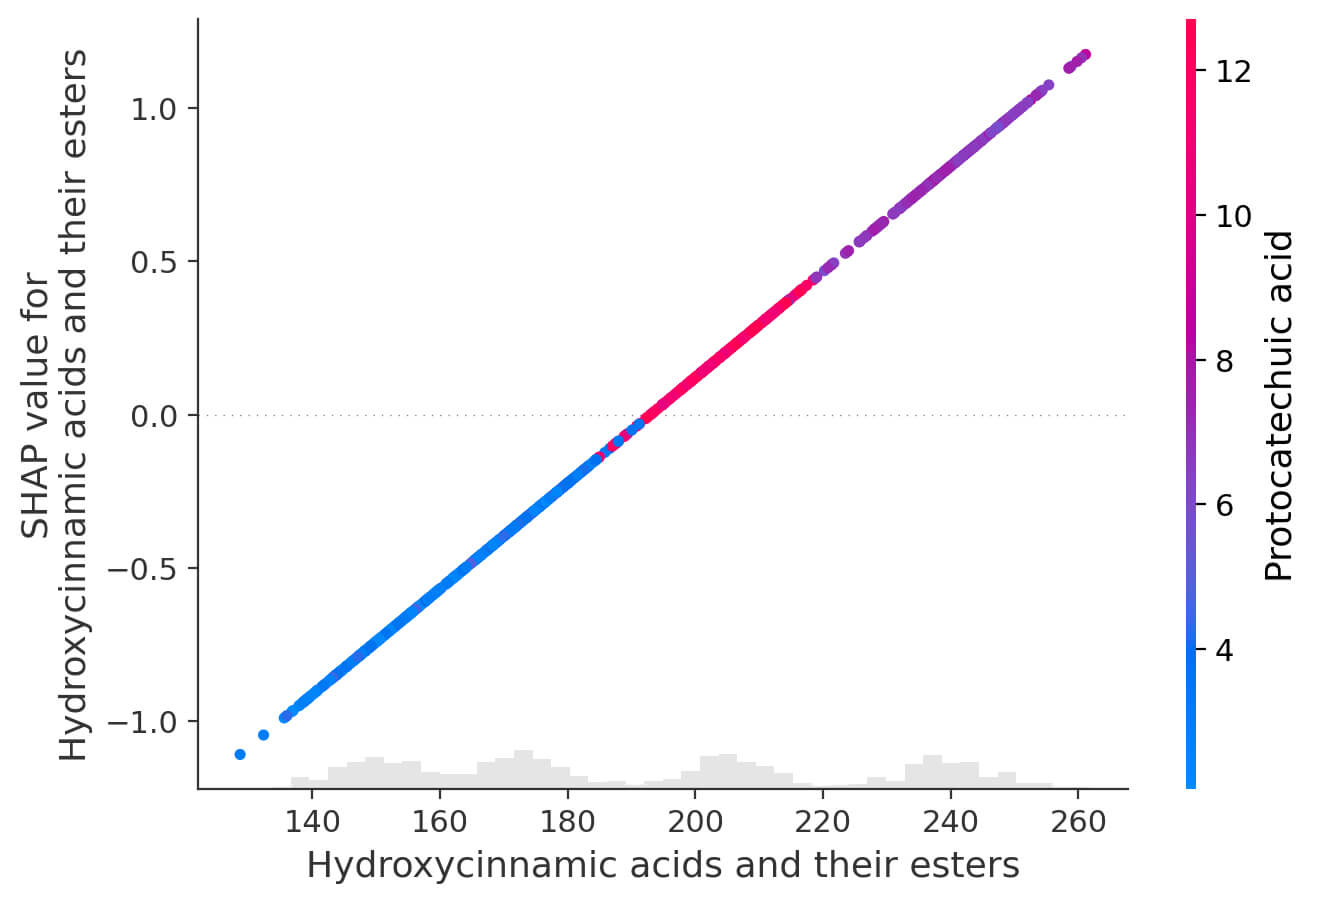
Subsequently, SHAP (SHapley Additive exPlanations) analysis was performed to assess the contribution of individual phenolic compounds in predicting the stilbenes concentration and to interpret the performance of the constructed regression model. This method allows for a quantitative assessment of the significance of each feature and its impact on the model output, which is especially important when analyzing complex multivariate data characterized by a high degree of multicollinearity and overlapping effects of individual compounds. A SHAP summary plot was constructed for non-flavonoid phenolic compounds as part of the analysis (Fig. 3), which ranks the features in order of their contribution to the model. This plot demonstrates which phenolic profile components contribute most to predicting the stilbenes concentration. The color scale displays the value of each feature in a specific observation (from low to high), which allows us to assess the significance of each compound and the direction of its influence (positive or negative). A SHAP dependence plot was constructed for the group of hydroxycinnamic acids and their esters (Fig. 4). This plot allows us to study the relationship between the SHAP value and the concentration of compounds in this group. The observed linear dependence indicates a direct contribution of these compounds to the predicted concentration of stilbenes.
 Fig. 3.
SHAP summary plot for non-flavonoid phenolic compounds. SHAP, SHapley Additive exPlanations.
 Fig. 4.
SHAP dependence plot for hydroxycinnamic acids and their esters.
Moreover, the color indication of the second feature (protocatechuic acid) allows us to evaluate the effect of interactions between the components, showing how the combined effect of several phenolic compounds is reflected in the model.
In general, the SHAP analysis results confirmed the high interpretability of the model and the biological validity of the selected predictors. These obtained dependencies allow us to assess both the contribution of each compound to the forecast and identify potential mechanisms involved in forming the phenolic profile of grape stems and their relationship with the accumulation of stilbenes. This makes the model a forecasting tool and an important means for an in-depth study of metabolic relationships within the phenolic complex.
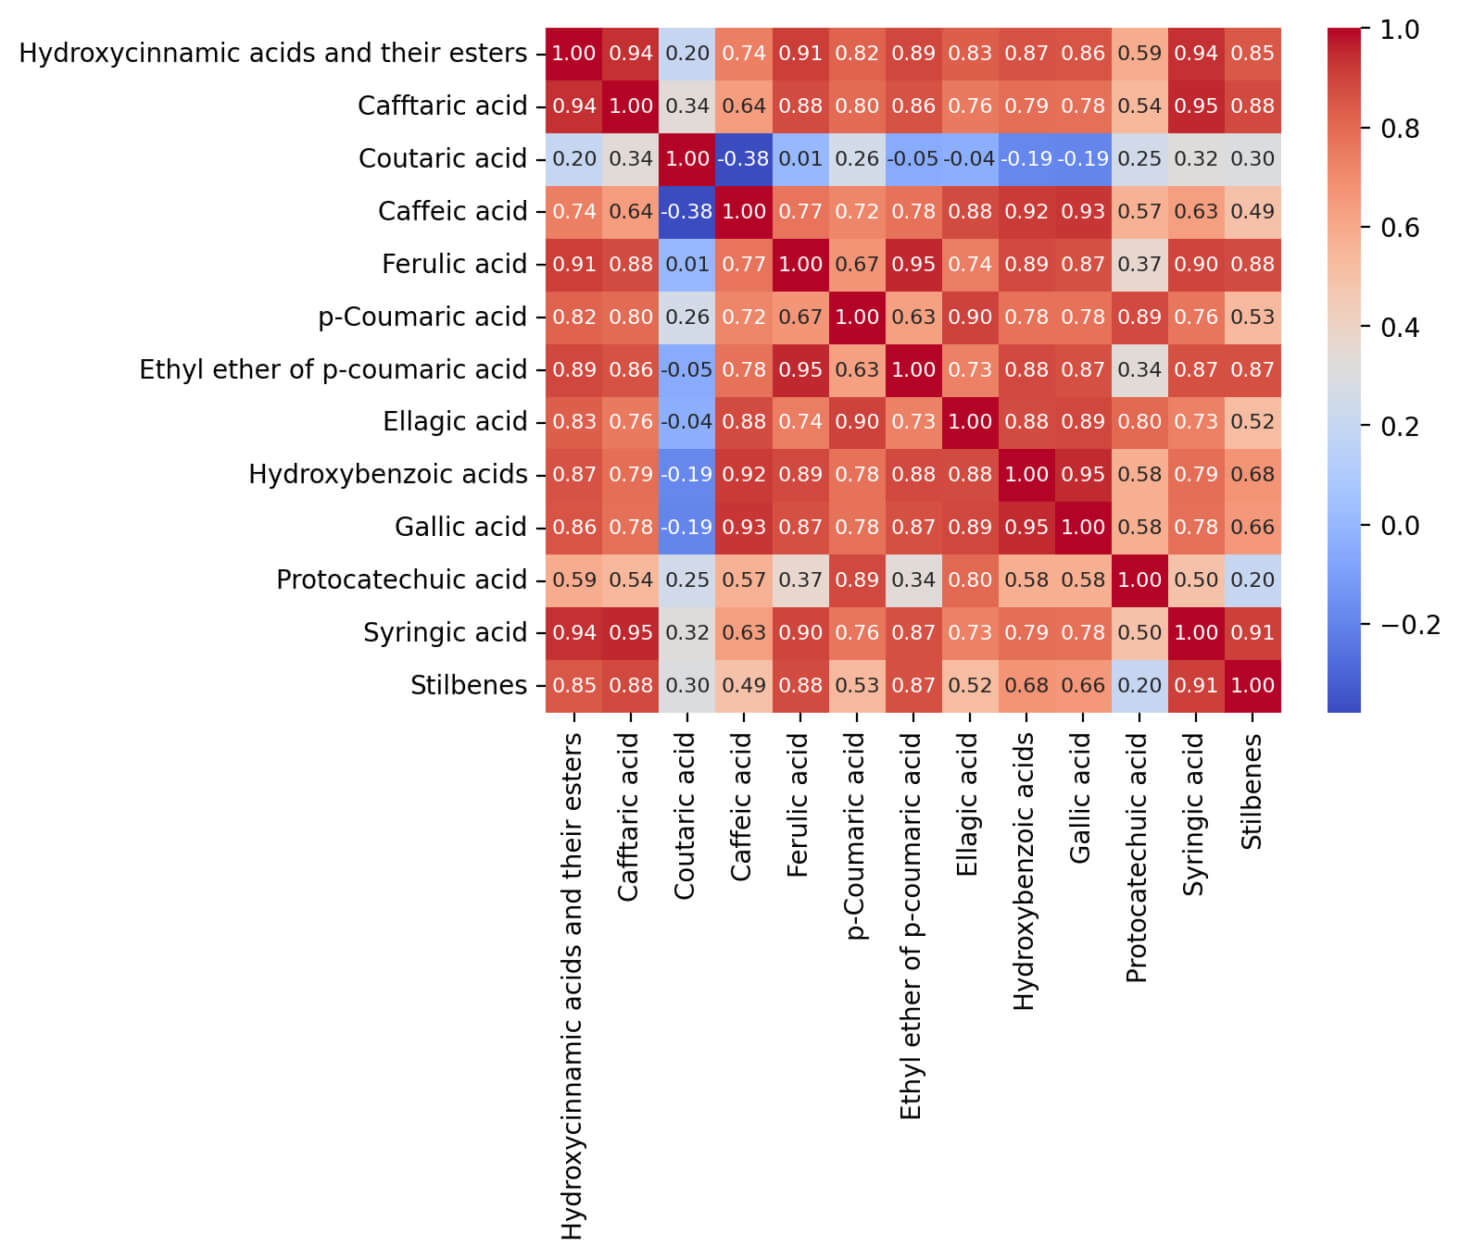
The correlation analysis between phenolic compounds in grape stems allows us to identify stable patterns in their joint accumulation, which is especially important for understanding metabolic relationships and identifying key predictors for calculating the concentration of stilbenes. The correlation matrix for non-flavonoid phenolic compounds demonstrates a clear clustering into two main groups: hydroxycinnamic acids and their esters and hydroxybenzoic acids (Fig. 5).
 Fig. 5.
Correlation matrix of non-flavonoid phenolic compounds.
Further, high positive correlations are observed (coefficients above 0.8) within each group, indicating similar trends in their variability and, probably, a common biosynthetic nature of these compounds. For example, hydroxycinnamic acids (caftaric, caffeic, and ferulic acids) demonstrate almost complete synchronicity in their concentrations, which suggests these compounds participate in common biochemical cascades. Interestingly, the relationship between the two main clusters is less pronounced—the correlation coefficients between hydroxycinnamic and hydroxybenzoic acids range from weakly negative to moderately positive values (from –0.2 to +0.4). This may indicate differences in the mechanisms involved in the biosynthesis or functional differentiation of these compound classes in the metabolism of grape stems. Thus, the construction and analysis of correlation matrices can allow the identification of groups of compounds with similar accumulation dynamics and the assessment of the degree of connectivity between key classes of phenolic compounds. The obtained data provide a basis for further studying the regulation of metabolic pathways and a reasonable choice of informative predictors when modeling the content of target metabolites, such as stilbenes.
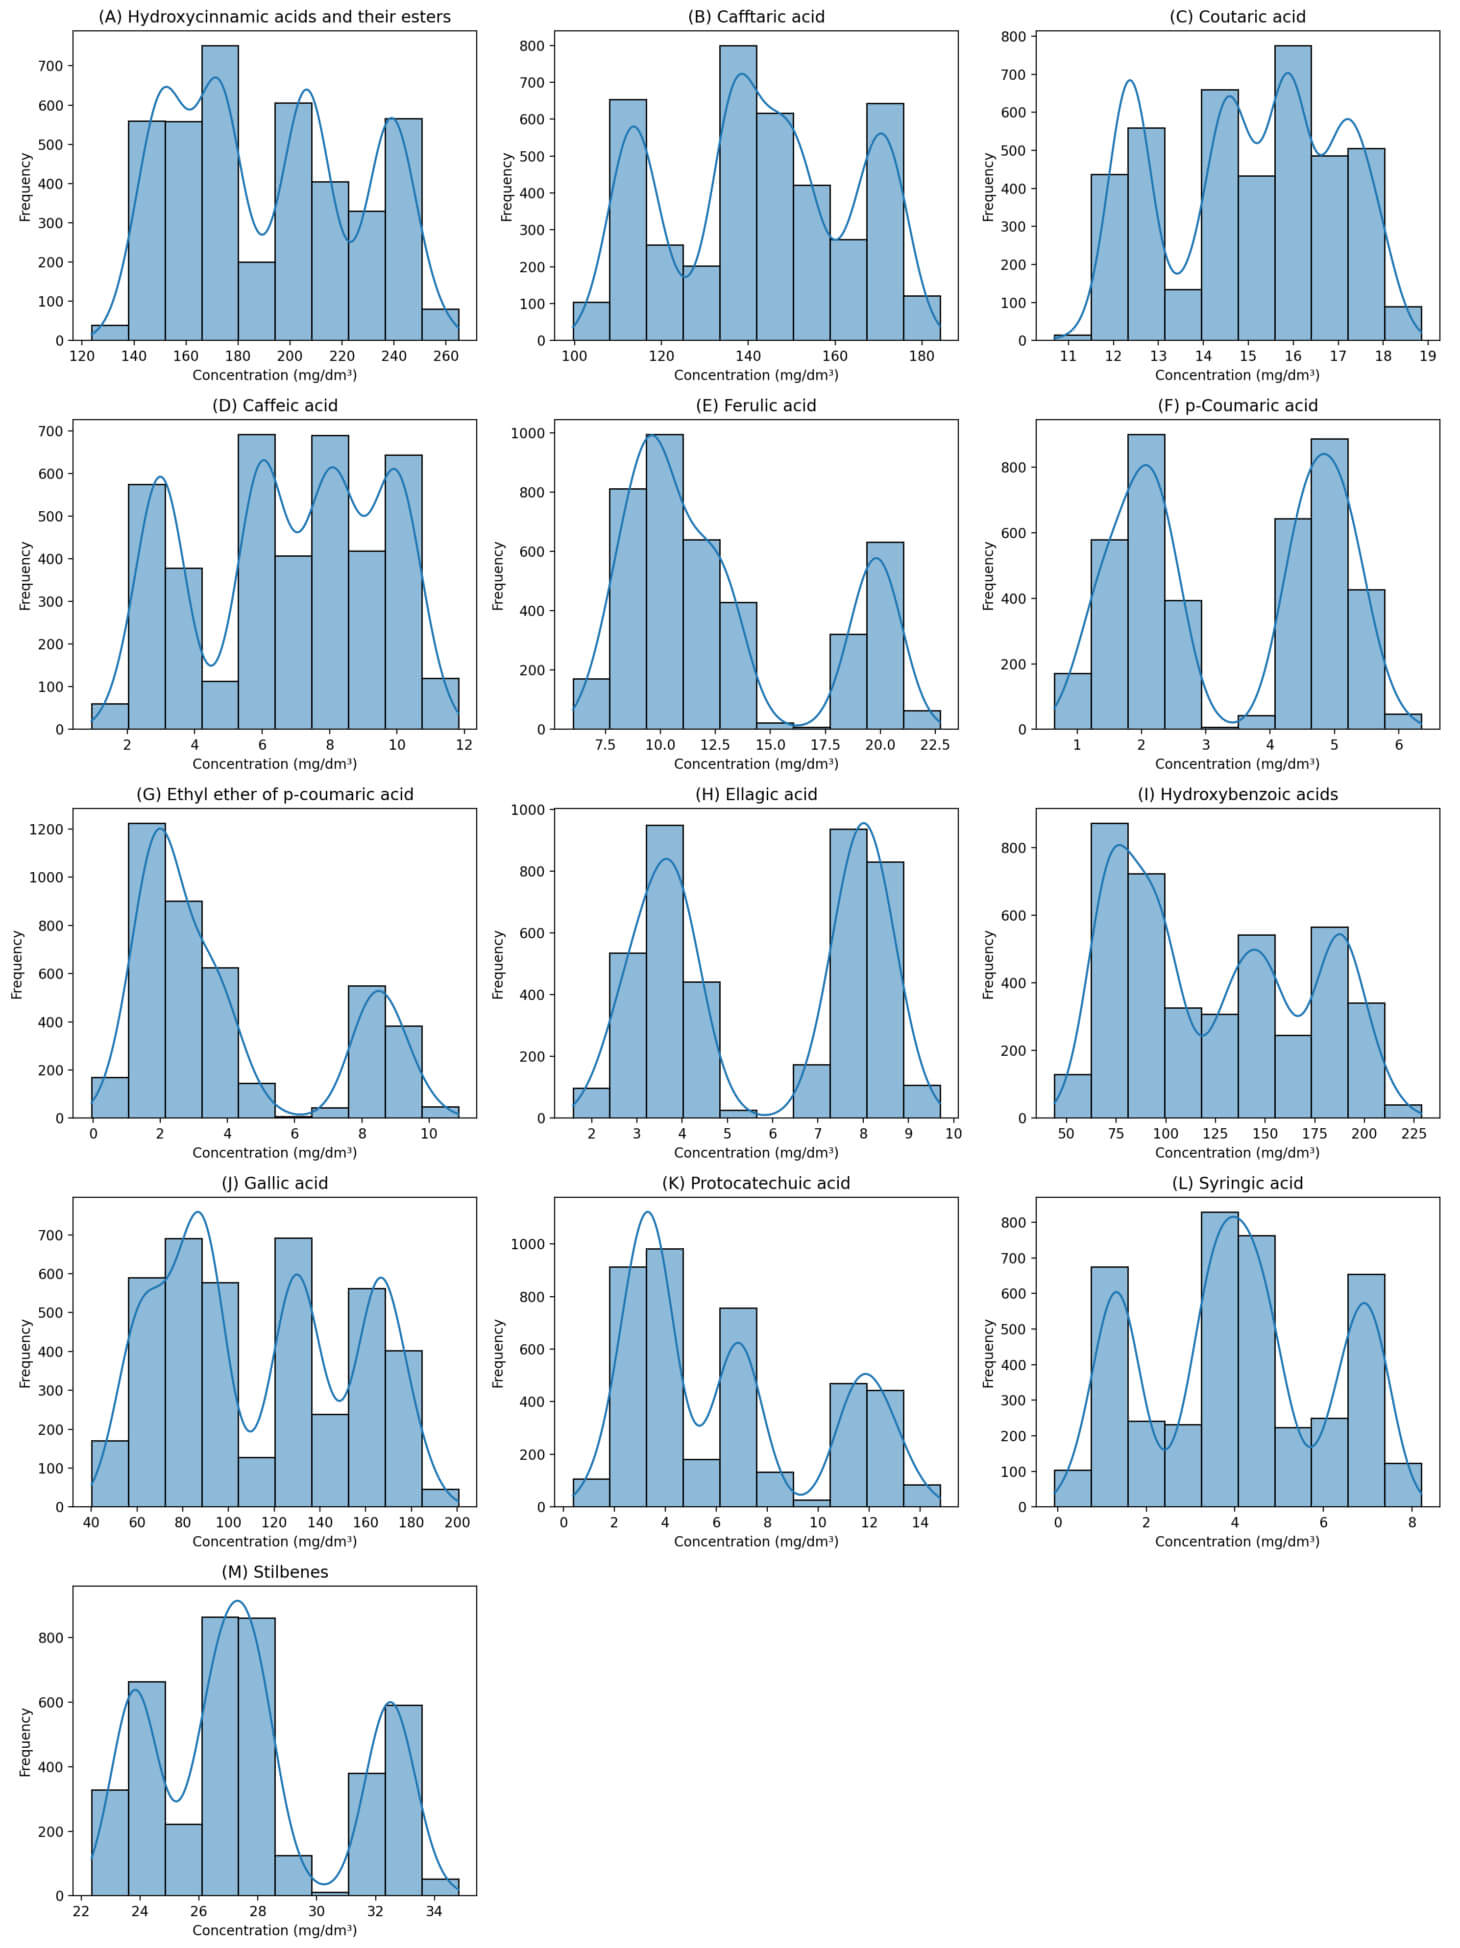
Histograms of the concentration distribution of phenolic compounds not only allow an assessment of the overall variability of the data but also provide an opportunity to identify key distribution features for each class of compounds.
These graphs can aid researchers in determining which compounds are characterized by stable concentrations (narrow range of values) and which components are characterized by high variability (widespread). Moreover, histograms depicting the concentration distribution of phenolic compounds allow us to assess the variability and distribution pattern of values. The histograms for the non-flavonoid compounds are presented in Fig. 6 (with annotations from (A) to (M)).
 Fig. 6.
Concentration distribution histograms for non-flavonoid phenolic compounds. (A) Hydroxycinnamic acids and their esters, (B) caftaric acid, (C) coutaric acid, (D) caffeic acid, (E) ferulic acid, (F) p-coumaric acid, (G) ethyl ether of p-coumaric acid, (H) ellagic acid, (I) hydroxybenzoic acids, (J) gallic acid, (K) protocatechuic acid, (L) syringic acid, (M) stilbenes.
These visualizations allow us to identify compounds with the most stable and variable concentrations, which is important for the subsequent interpretation of statistical indicators. Indeed, most hydroxycinnamic and hydroxybenzoic acids in the non-flavonoid phenolic compounds show distributions close to normal, with one distinct mode and a symmetrical pattern (Fig. 6). This suggests that these compounds accumulate relatively uniformly in the sample set. However, distributions with shifted modes or signs of bimodality are observed for some components, such as stilbenes and individual cinnamic acid esters, which may indicate the presence of subgroups in the sample or differences in metabolic pathways between grape varieties.
When analyzing histograms, special attention should be paid to the presence of outliers, especially in small samples. The presence of individual observations with extremely high or low concentrations may indicate both technological factors (e.g., sample processing features) and biological heterogeneity in the source material. These features must be considered during further data processing and the construction of predictive models.
Histograms serve not only as a tool for the initial assessment of the data structure but also as an important means for identifying potential artifacts, assessing the stability of individual predictors, and preliminarily identifying groups of compounds with high or low variability. All these aspects are critically important when preparing data for regression analysis and subsequent interpretation of the obtained models.
Analysis of the histograms illustrating the distribution of phenolic compound concentrations showed that most components have relatively stable distributions, which indicates the reliability of the original data and the correctness of the sampling procedure. At the same time, increased variability in concentrations was revealed for several compounds, which may indicate varietal or technological features in the formation of the phenolic profile. These identified distribution features were considered when forming a synthetic sample and in subsequent regression analyses to predict the concentration of stilbenes. These histograms allowed a visual assessment of the data structure and played an important role in creating a statistically valid model that considers the natural variability in the phenolic composition of grape stems.
One-way analysis of variance (ANOVA) was performed to assess the statistical significance of the differences in the phenolic compound concentrations between cultivars on the synthetically expanded sample. Table 2 presents the p-values for non-flavonoid phenolic compounds.
| Phenolic composition of aqueous ethanol stem extracts, mg/dm3 | p-value | |
| Hydroxycinnamic acids and their esters | 0.341 | |
| Caftaric acid | 0.500 | |
| Coutaric acid | 0.862 | |
| Caffeic acid | 0.611 | |
| Ferulic acid | 0.656 | |
| p-coumaric acid | 0.741 | |
| Ethyl ether of p-coumaric acid | 0.304 | |
| Ellagic acid | 0.645 | |
| Hydroxybenzoic acids | 0.843 | |
| Gallic acid | 0.337 | |
| Protocatechuic acid | 0.667 | |
| Syringic acid | 0.378 | |
| Stilbenes | 0.193 | |
These results showed that the within-group variability increases significantly when homogenizing the synthetic data, leading to higher p-values, indicating no statistically significant differences between varieties in some cases.
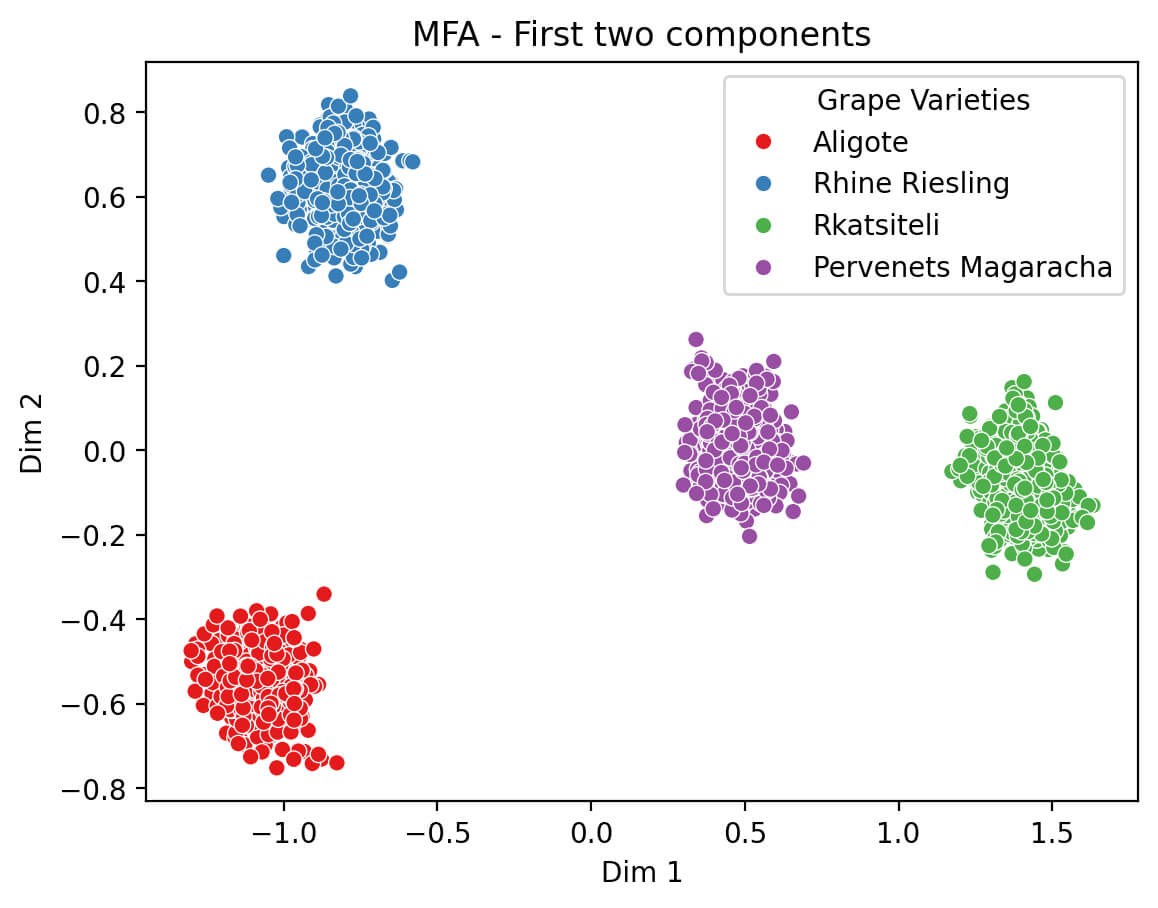
Multiple factor analysis (MFA) was performed on non-flavonoid phenolic compound datasets to assess the data structure and identify sample groupings based on the phenolic profile (Fig. 7). The MFA allows the distribution of the grape stem samples to be visualized using the first two principal components; each point corresponds to a separate sample, and the color indication reflects the varietal affiliation. The observed clear separation of samples by varieties (Aligote, Rhine Riesling, Rkatsiteli, and Pervenets Magaracha) indicates the high information content of the non-flavonoid phenolic profile for varietal differentiation.
 Fig. 7.
Multiple factor analysis (MFA) of phenolic compounds.
The first principal component (Dim 1) makes the greatest contribution to the differentiation of varieties and, according to the trait loading results, is determined mainly by the content of hydroxycinnamic acids and their esters. The second component (Dim 2) is largely associated with variations in the concentrations of hydroxybenzoic acids and stilbenes, which reflects the contribution of these compounds to the overall difference in phenolic profiles.
The MFA of independent datasets shows that non-flavonoid phenolic compounds are informative predictors of grape stem varietal affiliation. The clear clustering of samples by varieties indicates stable differences in phenolic profiles due to genetic features and the possible influence of growing conditions and technological factors. These results underline the importance of a comprehensive consideration of phenolic compounds in analyzing the quality and origin of raw grape materials.
An integrated approach combining the chemical characterization of grape stem extracts and mathematical modeling provides a deep understanding of the potential of using grape stems in functional food production. High variability in phenolic compound concentrations and antioxidant activity confirm that grape stems are a valuable raw material despite their traditional lack of use. The constructed regression models demonstrate with high accuracy (R2 = 0.95) that the chemical profile is a reliable predictor of product quality. Furthermore, the SHAP analysis allows for the contribution of each compound to be interpreted and key components to be identified; meanwhile, MFA visualizes the multivariate structure of the data, confirming the possibility of varietal differentiation. ANOVA results indicate the effect of synthetic augmentation on intragroup variability, which is important for further optimization of the final product composition. Thus, the results of this study serve as a basis for developing software tools capable of optimizing the composition and properties of products using grape stem extracts, which have high practical and economic significance for the food and pharmaceutical industries.
Thus, this study established that the analyzed grape stems are characterized by a wide composition of valuable biologically active substances, namely, hydroxybenzoic and hydroxycinnamic acids and stilbenes, the extraction of which into aqueous ethanol extracts has a significant effect on increasing the level of antioxidant activity. The obtained data indicate the high value of the stems as a valuable source of biologically active compounds for the development and production of functional products.
The results of this analysis can be used to formulate the basic principles of constructing mathematical models suitable for solving problems in modeling and designing the composition and properties of products using stem extracts. The main types of problems arising in the problem-solving of modeling and designing the composition and properties of products using stem extracts, as well as basic algorithms and numerical methods for solving them, were also identified and formulated. These results can develop the basis for creating application programs to calculate and optimize the composition of products using stem extracts.
This study included a comprehensive qualitative and quantitative analysis of phenolic compounds in stem extracts of different grape varieties and an assessment of antioxidant activity using spectrophotometry and amperometry. The ANOVA results confirmed statistically significant differences in the phenolic profile between varieties. The MFA data further substantiated this, demonstrating the variety-specific structures of phenolic profiles. Regression models were developed and validated to predict the content of target components (in particular, stilbenes) based on the phenolic profile. The high predictive ability of the models (R2 = 0.95) confirms the possibility of using the phenolic composition as a reliable predictor. The SHAP analysis allowed us to quantitatively assess the contribution of individual phenolic compounds to the formation of the predictive model and identify key predictors, ensuring the interpretability of the results. A universal mathematical model has been created based on systems of linear equations, which allows both direct problems, calculating the composition of the finished product based on known concentrations of phenolic compounds, and inverse problems, determining the required proportions of components to obtain a product with specified characteristics, to be solved. The model has been successfully validated using the R2 and RMSE metrics, which confirmed the suitability of the model for optimizing product compositions.
Synthetic data augmentation has made it possible to increase the sample size, which ensures the statistical stability of the developed models and considers the natural variability in the phenolic composition.
The obtained results create a scientific and practical basis for developing software solutions and process regulations for optimizing the composition of functional products using grape stem extracts, which is highly relevant for the food and pharmaceutical industries.
The dataset is available from the corresponding author upon request.
Conceptualization, YG; Methodology, IC; Software, AK and MR; Validation, NG; Formal Analysis, YG, IC, AV; Investigation, YG; Data Curation, IC and MR; Writing — Original Draft Preparation, YG, NG and IC; Writing — Review and Editing, AK and NG; Project Administration, AK and MR. All authors contributed to editorial changes in the manuscript. All authors have read and agreed to the published version of the manuscript. All authors have participated sufficiently in the work to take public responsibility for appropriate portions of the content and agreed to be accountable for all aspects of the work in ensuring that questions related to its accuracy or integrity.
Stems white grape (Vitis vinifera L.) samples were obtained from the collection of National Research Center “Kurchatov Institute”—“Magarach” (Yalta, Crimea).
Not applicable.
The authors acknowledge the financial support provided by the Russian Science Foundation (Grant No. 24-25-20001).
The authors declare no conflict of interest.
References
Publisher’s Note: IMR Press stays neutral with regard to jurisdictional claims in published maps and institutional affiliations.