

 , Assif Yitzhaky 2, Libi Hertzberg 1,2,3,*
1 School of Medicine, Faculty of Medical and Health Sciences, Tel Aviv University, 6997801 Tel Aviv, Israel
2 Department of Physics of Complex Systems, Weizmann Institute of Science, 7610001 Rehovot, Israel
3 Adult Inpatient Ward, Shalvata Mental Health Center, 45100 Hod Hasharon, Israel
Abstract
Schizophrenia is a complex mental disorder with an estimated heritability of 80%, yet its underlying pathophysiology remains poorly understood. Emerging evidence implicates the α-amino-3-hydroxy-5-methyl-4-isoxazole propionic acid (AMPA) glutamate receptor—a key player in fast excitatory synaptic transmission, encoded by Glutamate Ionotropic Receptor AMPA Type Subunits 1-4 (GRIA1-4)—in the disorder's pathophysiology. However, findings from postmortem brain samples regarding GRIA1-4 expression have been inconsistent. This study aimed to systematically evaluate the differential expression of GRIA1-4 genes in schizophrenia by integrating transcriptomic data from postmortem brain tissue and patient-derived cerebral organoids.
We conducted a participant-level meta-analysis of seven postmortem brain sample datasets (n = 295; 151 schizophrenia, 144 controls) and analyzed an independent organoid dataset (n = 16). Expression differences between schizophrenia and control samples were quantified using Hedges' g under a random-effects model, with heterogeneity assessed using the I2 statistic.
Our analysis revealed significant downregulation of all four GRIA genes (GRIA1-4) in postmortem brain tissue from individuals with schizophrenia, with the effect concentrated in a subgroup of patients. No substantial heterogeneity was attributable to differences in brain regions or measurement platforms. Consistent downregulation of GRIA1-3 was observed in patient-derived cerebral organoids, which model early neurodevelopmental stages.
Our findings highlight AMPA receptor dysfunction as a potential contributor to schizophrenia pathophysiology in a subgroup of patients, consistent with the broader role of glutamatergic signaling disruption in this disorder. The convergent evidence from postmortem brain tissue and developmental models underscores the need for further investigation of GRIA genes as potential biomarkers for patient stratification and as therapeutic targets. While further study is needed to understand the functional consequences of our findings, such insights may inform the development of personalized treatment strategies targeting glutamatergic dysfunction in schizophrenia.
Keywords
- gene expression profiling
- organoids
- receptors
- AMPA
- glutamate
- schizophrenia
(1) Glutamate Ionotropic Receptor AMPA Type Subunits 1-4 (GRIA1-4) expression is significantly reduced in schizophrenia across seven postmortem brain datasets.
(2) A coordinated downregulation of GRIA1-4 characterizes a distinct molecular subgroup of individuals with schizophrenia.
(3) Similar downregulation of GRIA1-3 is present in schizophrenia-derived cerebral organoids, supporting developmental involvement.
(4) These findings highlight
Schizophrenia is a chronic psychiatric disorder with a lifetime prevalence of about 0.7% [1], characterized by a complex constellation of symptoms that span three primary domains: positive symptoms, such as hallucinations and delusions; negative symptoms, including social withdrawal and flattened affect; and cognitive impairments, including deficits in working memory and verbal learning. Unlike the transient nature of psychosis, these persistent symptomatic clusters, especially cognitive and negative symptoms, drive significant social and occupational disability. Consequently, the disorder imposes a profound socioeconomic and emotional burden on affected individuals, their families, and global healthcare systems [2, 3, 4].
Schizophrenia has a strong genetic component, with heritability estimated at about 80% [5]. Genome-wide association studies (GWAS) have identified more than 290 risk loci, each contributing only a modest increase in risk [6], and together explaining 25–50% of genetic liability [7, 8]. Many of the associated variants are located in noncoding regions, which are enriched with regulatory sequences that influence gene expression rather than protein structure [9]. Therefore, it is essential to examine gene expression patterns and identify genes with differential expression in schizophrenia to better understand the genetic and molecular basis of the disease.
For decades, the dopamine hypothesis has dominated the neurochemical understanding of schizophrenia, proposing that symptoms result from increased dopaminergic activity in the striatum and decreased activity in prefrontal regions [10, 11, 12, 13]. Another hypothesis that has gained significant support in recent decades is the involvement of glutamatergic signaling in schizophrenia. Glutamatergic dysfunction has been associated with both psychotic symptoms and cognitive deficits [14, 15, 16]. This hypothesis is mainly supported by the psychotomimetic effects of noncompetitive N-methyl-D-aspartate (NMDA) receptor antagonists such as ketamine and phencyclidine [17, 18, 19, 20], suggesting that NMDA receptor hypofunction may play a role in symptom development. However, focusing only on NMDA receptor dysfunction might oversimplify the underlying pathophysiology. Clinical trials targeting glutamatergic transmission have shown limited therapeutic benefit [21], indicating that glutamate-related changes probably go beyond receptor binding and involve more extensive synaptic and circuit-level processes.
Glutamate receptors are divided into two main groups: (1) Ionotropic receptors,
which respond to synthetic glutamate derivatives like NMDA, AMPA
(
NMDA receptors co-localize with AMPA receptors (AMPARs) at excitatory synapses throughout the brain, where AMPAR activation modulates N-methyl-D-aspartate receptors (NMDARs) function [23, 24]. AMPARs are multimeric structures composed of four subunits, encoded by the Glutamate Ionotropic Receptor AMPA Type Subunits 1-4 (GRIA1-4) genes (referred to as GluR1–4 in earlier literature) [23, 25], which can assemble in multiple homo- or heteromeric combinations, contributing to substantial receptor diversity. AMPARs mediate fast excitatory neurotransmission through Na+ influx and subsequent postsynaptic depolarization, which relieves the Mg2+ block of the NMDA receptor channel and allows Ca2+ entry [23, 26]. NMDARs-dependent long-term potentiation and depression (LTP/LTD), both critical mechanisms underlying learning and memory, rely on the dynamic regulation of AMPAR trafficking [27, 28]. Individuals with schizophrenia experience cognitive impairments, including various learning and memory deficits [29]. It has also been suggested that enhancing AMPA receptor activity could be a practical way to address NMDA receptor hypofunction and the associated cognitive impairments in schizophrenia [26]. Animal studies further highlight the role of AMPARs in behaviors associated with schizophrenia. GRIA1 knockout mice exhibited behavioral abnormalities linked to schizophrenia, including increased locomotor activity in response to novelty, impaired prepulse inhibition, disorganized social behaviors, and a lack of pleasure responses [30, 31, 32].
At the genetic level, GRIA genes are highly conserved among mammals [33]. GRIA1 was found to be associated with schizophrenia in a GWAS that identified 108 associated loci [34], as well as in a study of a Korean population [35]. Importantly, GRIA3 was identified as one of 10 genes with ultra-rare variants that were associated with schizophrenia, in a study of the Schizophrenia Exome Sequencing Meta-Analysis (SCHEMA) consortium [36]. Findings regarding the associations of GRIA2 and GRIA4 with schizophrenia have been inconsistent across studies [37, 38, 39, 40].
A systematic review of postmortem studies examining AMPA receptor subunits’ expression and binding in patients with schizophrenia reported inconsistent results. This inconsistency was observed across studies investigating AMPA receptor binding, subunit protein expression, and subunit messenger RNA (mRNA) expression [41]. Few studies have observed a reduction in AMPA subunits’ mRNA expression in brain samples from patients with schizophrenia compared to healthy control subjects [42, 43, 44], while others found no significant difference [45, 46], and a few studies reported increased mRNA expression [47, 48]. Few studies have reported a decrease in AMPA expression at the protein level [49, 50], while others did not find any significant difference [51, 52, 53], and some observed increased protein levels [54, 55]. Similarly, findings on AMPA receptor binding were inconsistent. Some studies found reduced receptor binding in brain samples from individuals with schizophrenia [56, 57], whereas others reported no significant differences [44, 58, 59, 60], or increased receptor binding [61, 62].
Preclinical studies demonstrate that positive allosteric modulators, such as AMPAkines, enhance synaptic plasticity and cognitive performance and may potentiate antipsychotic efficacy in the context of glutamatergic dysfunction [63, 64]. Therapeutic modulation of AMPARs has therefore emerged as a promising avenue for treating schizophrenia. However, translation to clinical efficacy has been limited by challenges related to drug potency, subunit selectivity, and tolerability [64, 65].
Brain samples from individuals with schizophrenia are only accessible postmortem, which may not reflect changes that occur during the early stages of the disease. Furthermore, the differential expression observed in postmortem samples might be influenced by confounding factors such as medication and duration of illness. Brain organoid models, created from induced pluripotent stem cells (iPSCs), serve as valuable tools for studying early human brain development in the context of neurodevelopmental disorders. A study using organoids derived from individuals with schizophrenia reported altered expression of genes involved in synaptic and neurodevelopmental processes compared to healthy controls, including downregulation of GRIA1-3 [65].
Given the important role of glutamate signaling in schizophrenia, the evidence for an association at the genetic level, and the inconsistent findings on GRIA gene expression, we systematically compared GRIA expression levels in brain samples from patients with schizophrenia and healthy individuals. Following the Preferred Reporting Items for Systematic Reviews and Meta-Analyses (PRISMA) 2020 guidelines [66], we conducted a participant-level meta-analysis of seven publicly available datasets (overall 295 samples). Additionally, we analyzed an organoid dataset, produced from patients with schizophrenia and controls, to explore GRIA during early neurodevelopment.
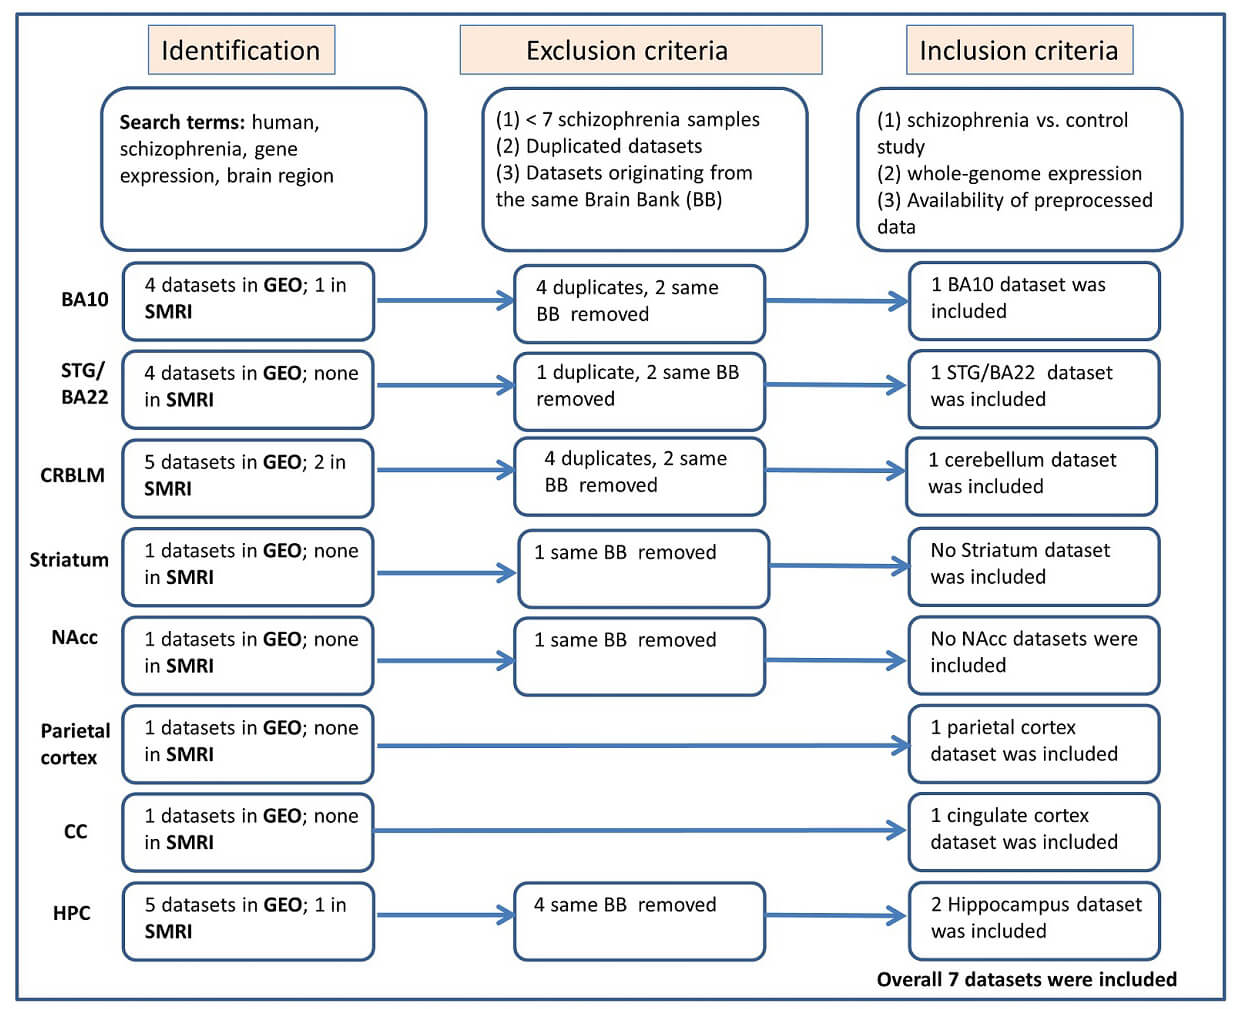
Gene expression datasets were identified through a structured search of the National Center for Biotechnology Information Gene Expression Omnibus (NCBI GEO; https://www.ncbi.nlm.nih.gov/geo/) and the Stanley Medical Research Institute (SMRI) Array Collection (https://www.stanleyresearch.org/brain-research/array-collection/). Searches included the terms schizophrenia, gene expression, human, and brain. Dataset screening and selection procedures followed the PRISMA 2020 guidelines [66], and the full workflow is illustrated in Fig. 1. Studies were eligible if they: (1) included postmortem human brain samples from individuals with schizophrenia and healthy controls, (2) provided normalized expression matrices, and (3) sampled one of the following brain regions: Brodmann area (BA) 10, superior temporal gyrus (BA22), cerebellum, parietal cortex, anterior cingulate cortex, nucleus accumbens, striatum, or hippocampus. Datasets were excluded when they contained overlapping samples obtained from the same brain bank. Study metadata included sample sizes, demographic information, assay platform, postmortem interval (PMI), and tissue pH (Table 1, Ref. [67, 68, 69, 70, 71, 72, 73, 74]). Additional preprocessing steps, normalization, quality control, and outlier removal are reported in the Supplementary Materials.
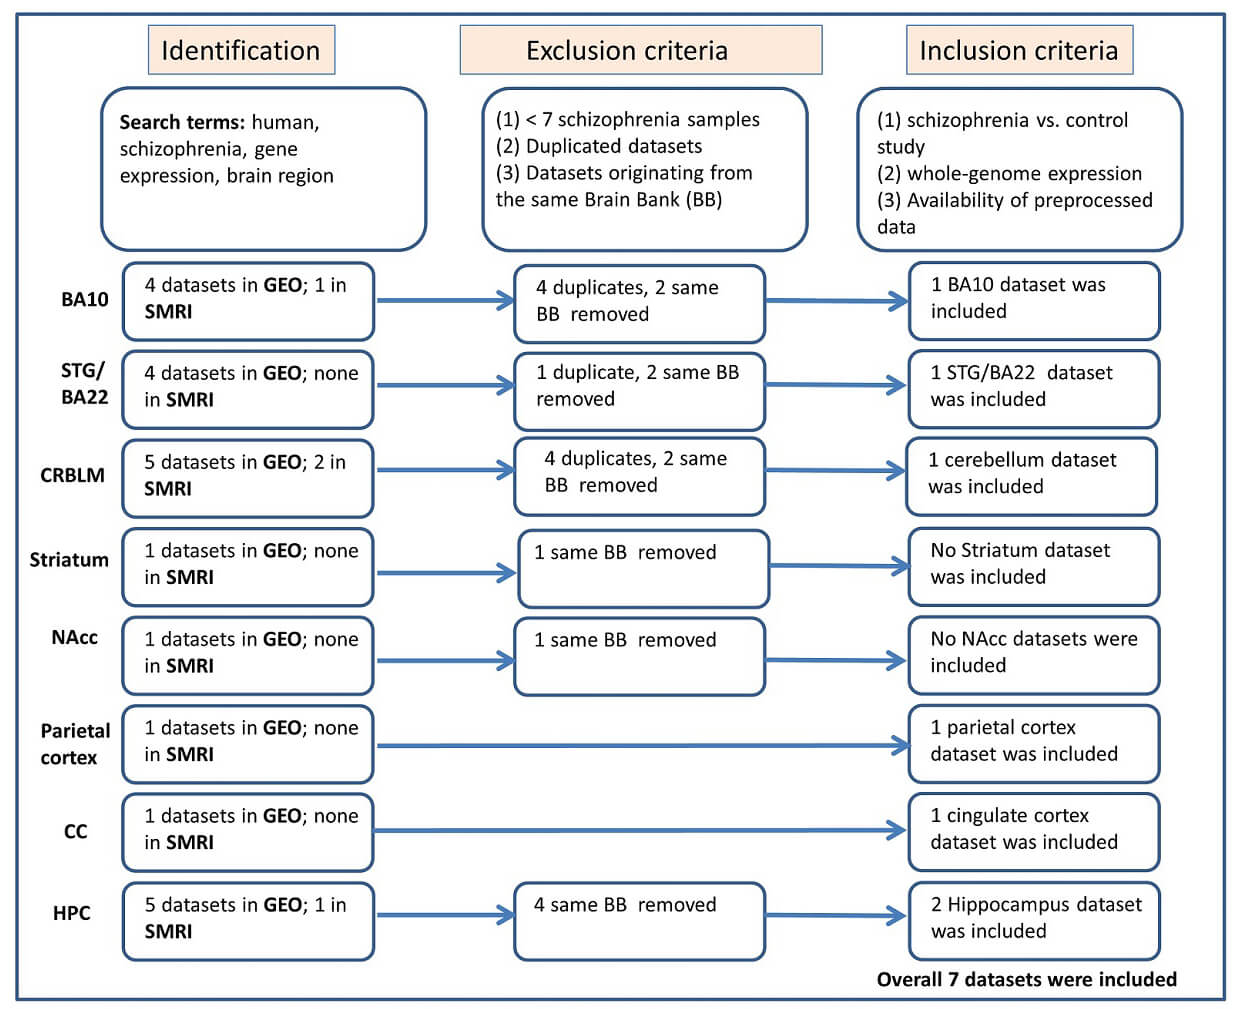 Fig. 1.
Diagram illustrating the study identification and selection process conducted in accordance with PRISMA 2020 guidelines. The flowchart summarizes dataset retrieval, screening stages, and final inclusion criteria. Abbreviations: SMRI, Stanley Medical Research Institute; GEO, Gene Expression Omnibus; CMC, Common Mind Consortium; CC, cingulate cortex; BA, brodmann area; STG, Superior Temporal Gyrus; CRBLM, cerebellum; NAcc, Nucleus Accumbens; HPC, hippocampus; PRISMA, Preferred Reporting Items for Systematic Reviews and Meta-Analyses.
| Postmortem Brain sample datasets (295 samples) | ||||||||
| Accession | Publication | Brain region; Brain bank | # SZ (151 samples) | # CNT (144 samples) | Platform | Mean Age (standard dev.) | Mean PMI (standard dev.) | Mean pH (standard dev.) |
| GDS4523 | (Maycox et al., 2009) [67] | BA10; CCHPC | 27 | 23 | HG U133 Plus 2.0 | SZ: 73 (15) | SZ: 8.2 (7) | SZ: 6.1 (0.2) |
| 19M:8F | 12M:11F | CNT: 69 (22) | CNT: 10 (4) | CNT: 6.5 (0.3) | ||||
| p = 0.45 | p = 0.30 | p = 8 × 10⁻⁶ | ||||||
| GSE37981 | (Pietersen et al., 2014) [68] | STG Pyramid.; HBTRC | 9 | 8 | U133 X3P Array | SZ: 67 (20) | SZ: 17 (5) | Not provided |
| 4M:5F | 4M:4F | CNT: 67 (21) | CNT: 18 (3) | |||||
| p = 0.99 | p = 0.71 | |||||||
| GDS1917 | (Paz et al., 2006) [69] | CRBLM; Maryland | 13 | 14 | U133 Plus 2.0 Array | SZ: 46 (12) | SZ: 12.8 (5) | Not provided |
| 13M:0F | 14M:0F | CNT: 43 (10) | CNT: 15.6 (6) | |||||
| p = 0.50 | p = 0.18 | |||||||
| GSE35978 | (Chen et al., 2013) [70] | Parietal cortex; SMRI | 51 | 45 | Gene 1.0 ST Array | SZ: 43 (10); | SZ: 31 (16) | SZ: 6.4 (0.3) |
| 37M:14F | 31M:14F | CNT: 46 (9) | CNT: 27 (12) | CNT: 6.5 (0.3) | ||||
| p = 0.14 | p = 0.17 | p = 0.015 | ||||||
| GSE80655 | (Ramaker et al., 2017) [71] | ACC; Pritzker | 23 | 24 | Illumina HiSeq 2000 | SZ: 43 (9); | SZ: 21 (9) | SZ: 6.8 (0.2) |
| 20M:3F | 21M:3F | CNT: 50 (13) | CNT: 22 (7) | CNT: 6.9 (0.1) | ||||
| p = 0.043 | p = 0.62 | p = 0.044 | ||||||
| GSE53987 | (Lanz et al., 2019) [72] | HPC; Pittsburgh | 15 | 18 | HG U133 Plus 2.0 | SZ: 46 (9); | SZ: 19 (7) | SZ: 6.4 (0.3) |
| 9M:6F | 9M:9F | CNT: 48 (11) | CNT: 19 (5) | CNT: 6.6 (0.2) | ||||
| p = 0.49 | p = 0.99 | p = 0.055 | ||||||
| GSE138082 | (Perez et al., 2021) [73] | HPC CA3; Dallas | 13 | 12 | Illumina HiSeq 2500 | SZ: 54 (11); | SZ: 23 (7) | Not provided |
| 9M:4F | 9M:3F | CNT: 56 (9) | CNT: 20 (4) | |||||
| p = 0.59 | p = 0.20 | |||||||
| Organoid samples dataset (16 samples) | ||||||||
| Accession | Publication | Samples type | # SZ (8 samples) | # CNT (8 samples) | Platform | |||
| GSE133534 | (Kathuria et al., 2020) [74] | iPSC derived cerebral organoids | 8 5M:3F |
8 6M:2F |
Illumina NovaSeq 6000 | |||
#, number of; SZ, schizophrenia; CNT, controls; PMI, postmortem interval; ACC, anterior
cingulate cortex; CA3, Cornu Ammonis 3; pyramid., pyramidal;
parvalb., parvalbumin; M, males; F, females;
Pritzker, Pritzker Neuropsychiatric Disorders Research Consortium; Pittsburgh,
Brain Tissue Donation Program at the University of Pittsburgh; Dallas, Dallas Brain Collection; Maryland,
Maryland Brain Collection; HBTRC, The Harvard Brain Tissue Resource Center;
CCHPC, Charing Cross Hospital Prospective Collection; iPSC, induced pluripotent
stem cells; Two-sided t-test associated p-values are listed for
each dataset, for having different (SZ vs. CNT) mean age, PMI, and pH;
Statistically significant differences (p-value
Differential expressions of GRIA genes were assessed using an individual participant-level meta-analytic framework. Standardized mean differences between schizophrenia and control groups were quantified using Hedges’ g [75], with positive values representing higher expression among schizophrenia samples and negative values indicating reduced expression. Effect sizes and 95% confidence intervals were estimated using the “metacont” function from the R meta package (version 3.6.1, R Foundation for Statistical Computing, Vienna, Austria) [76]. Because the included datasets differed in brain regions, platforms, and preprocessing strategies, pooled effect sizes were calculated using a random-effects model [77], which accounts for both study and between-study variability and improves generalizability [78].
To assess heterogeneity across the datasets included in the meta-analysis, we
quantified between-study variability using three complementary measures:
Cochran’s Q, I2, and
Differential expression of GRIA genes was measured in a patient-derived organoid dataset, which was downloaded from the GEO database (GSE133534) and comprised 16 samples (8 from patients with schizophrenia and 8 from controls). Study metadata included sample sizes, sex, and assay platform (Table 1). Additional preprocessing steps, normalization, quality control, and outlier removal are reported in the Supplementary Materials. Differential log2 expression was calculated using a two-sided t-test.
To assess whether group differences in gene expression could be influenced by clinical or biological covariates, multiple linear regression models were fitted for each dataset using the MATLAB “fitlm” function [82]. Available covariates included age, sex, PMI, tissue pH, and antipsychotic medication history. Schizophrenia diagnosis served as the primary predictor variable. Regression results are reported as t-statistics and p-values, indicating whether differential expression remained significant after adjustment.
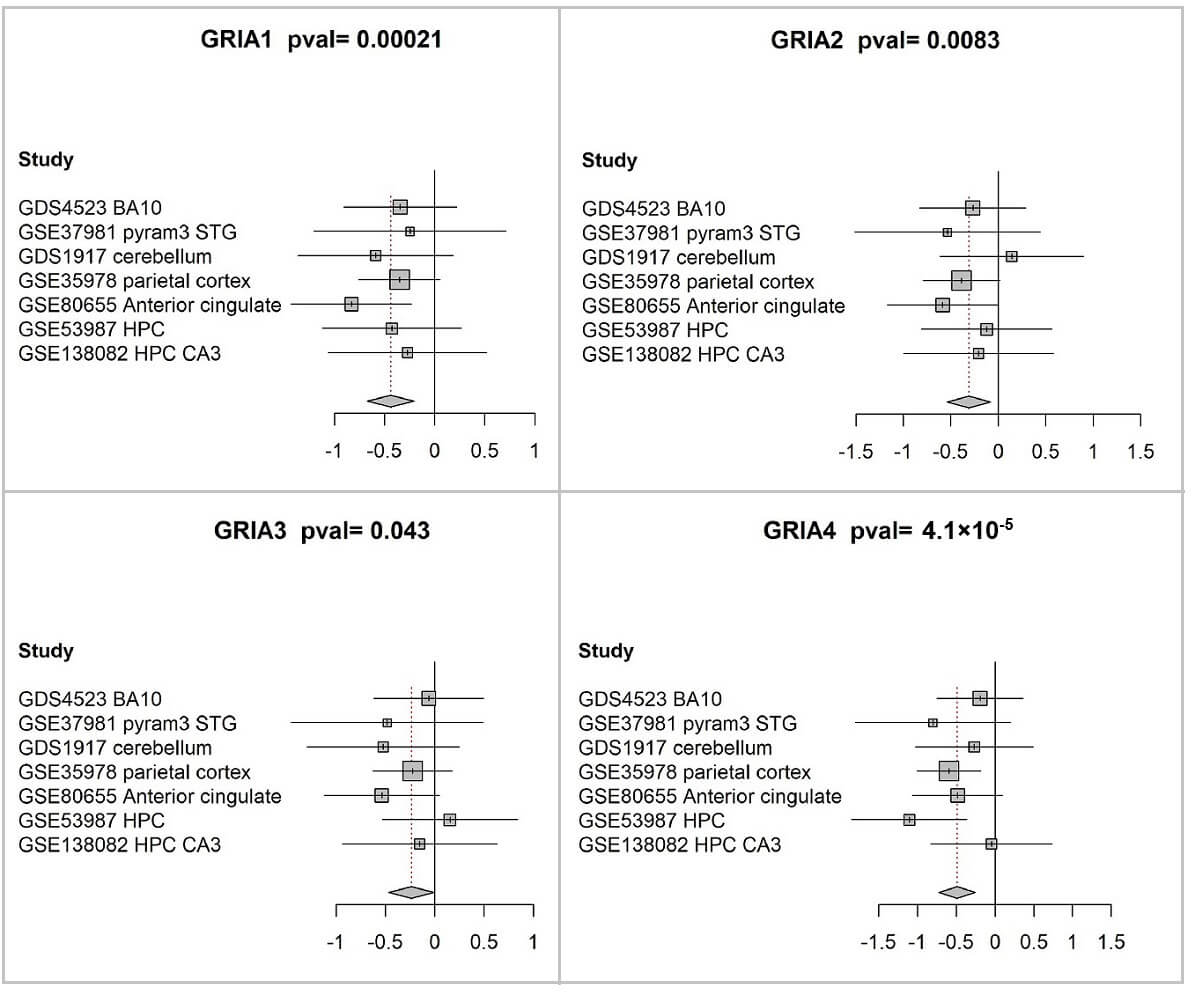
A meta-analysis of GRIA1-4 differential expression was conducted, revealing significant downregulation of all four genes in individuals diagnosed with schizophrenia relative to control subjects (Fig. 2; Table 2).
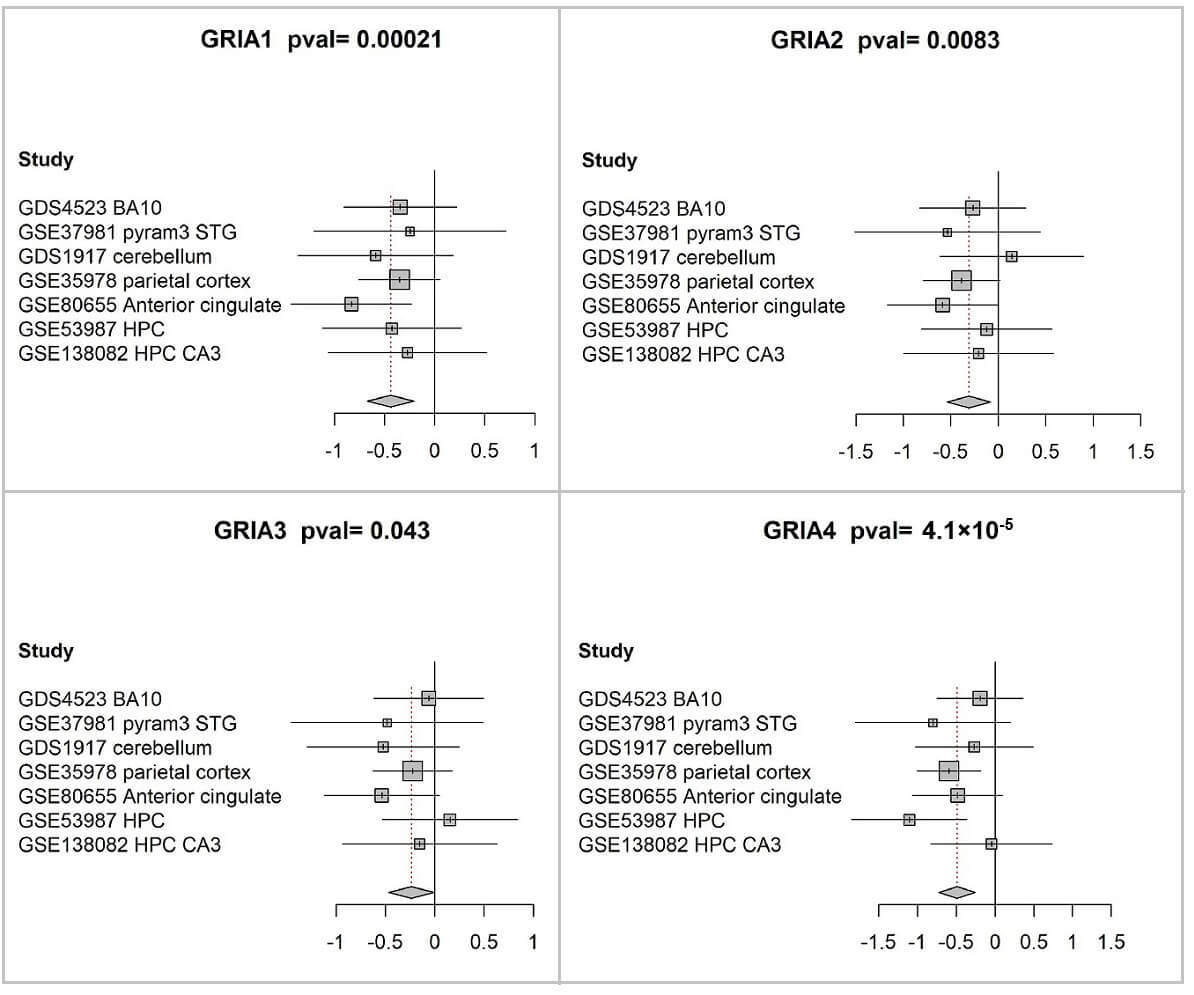 Fig. 2.
Reduced expression of GRIA1-4 in postmortem brain tissue from patients with schizophrenia. Forest plots show the differences in expression levels of GRIA1 (A), GRIA2 (B), GRIA3 (C), and GRIA4 (D) between individuals with schizophrenia and healthy controls across all datasets included in the meta-analysis. Forest plots were generated using the meta package in R meta package (version 3.6.1) with its built-in plotting function. In each panel, the square symbols represent the standardized mean difference (Hedges’ g) for individual datasets, and their size reflects the relative analytical weight determined largely by sample size. The corresponding 95% confidence intervals are represented by horizontal bars extending from each square. A vertical line indicates the point of zero difference. The standardized mean difference is positive (negative) if the expression is higher (lower) in schizophrenia compared to the control group. The center of the diamond represents the overall difference across all studies, and its width represents the corresponding 95% confidence interval. The associated p-values are reported in the figure titles.
| Gene symbol | Random effects Hedges | Lower | Upper | p-value | I2 | Q | Q p-value | ||
| 1 | GRIA1 | –0.44 | –0.67 | –0.21 | 0.00021 | 0 | 0 | 2.4 | 0.88 |
| 2 | GRIA2 | –0.31 | –0.54 | –0.08 | 0.0083 | 0 | 0 | 2.9 | 0.82 |
| 3 | GRIA3 | –0.24 | –0.47 | –0.01 | 0.043 | 0 | 0 | 3.5 | 0.75 |
| 4 | GRIA4 | –0.49 | –0.72 | –0.26 | 4.10 × 10⁻⁵ | 0 | 0 | 5.9 | 0.43 |
The standardized mean difference (Hedges’ g, random effects model) is negative
(bluish) when expression is lower in schizophrenia compared to controls. The
color intensity is proportional to the Hedges’ g value. The lower and upper 95%
confidence interval limits are given in the 4th and 5th columns. The associated
p-values are given in the 6th column. Heterogeneity measures - I2,
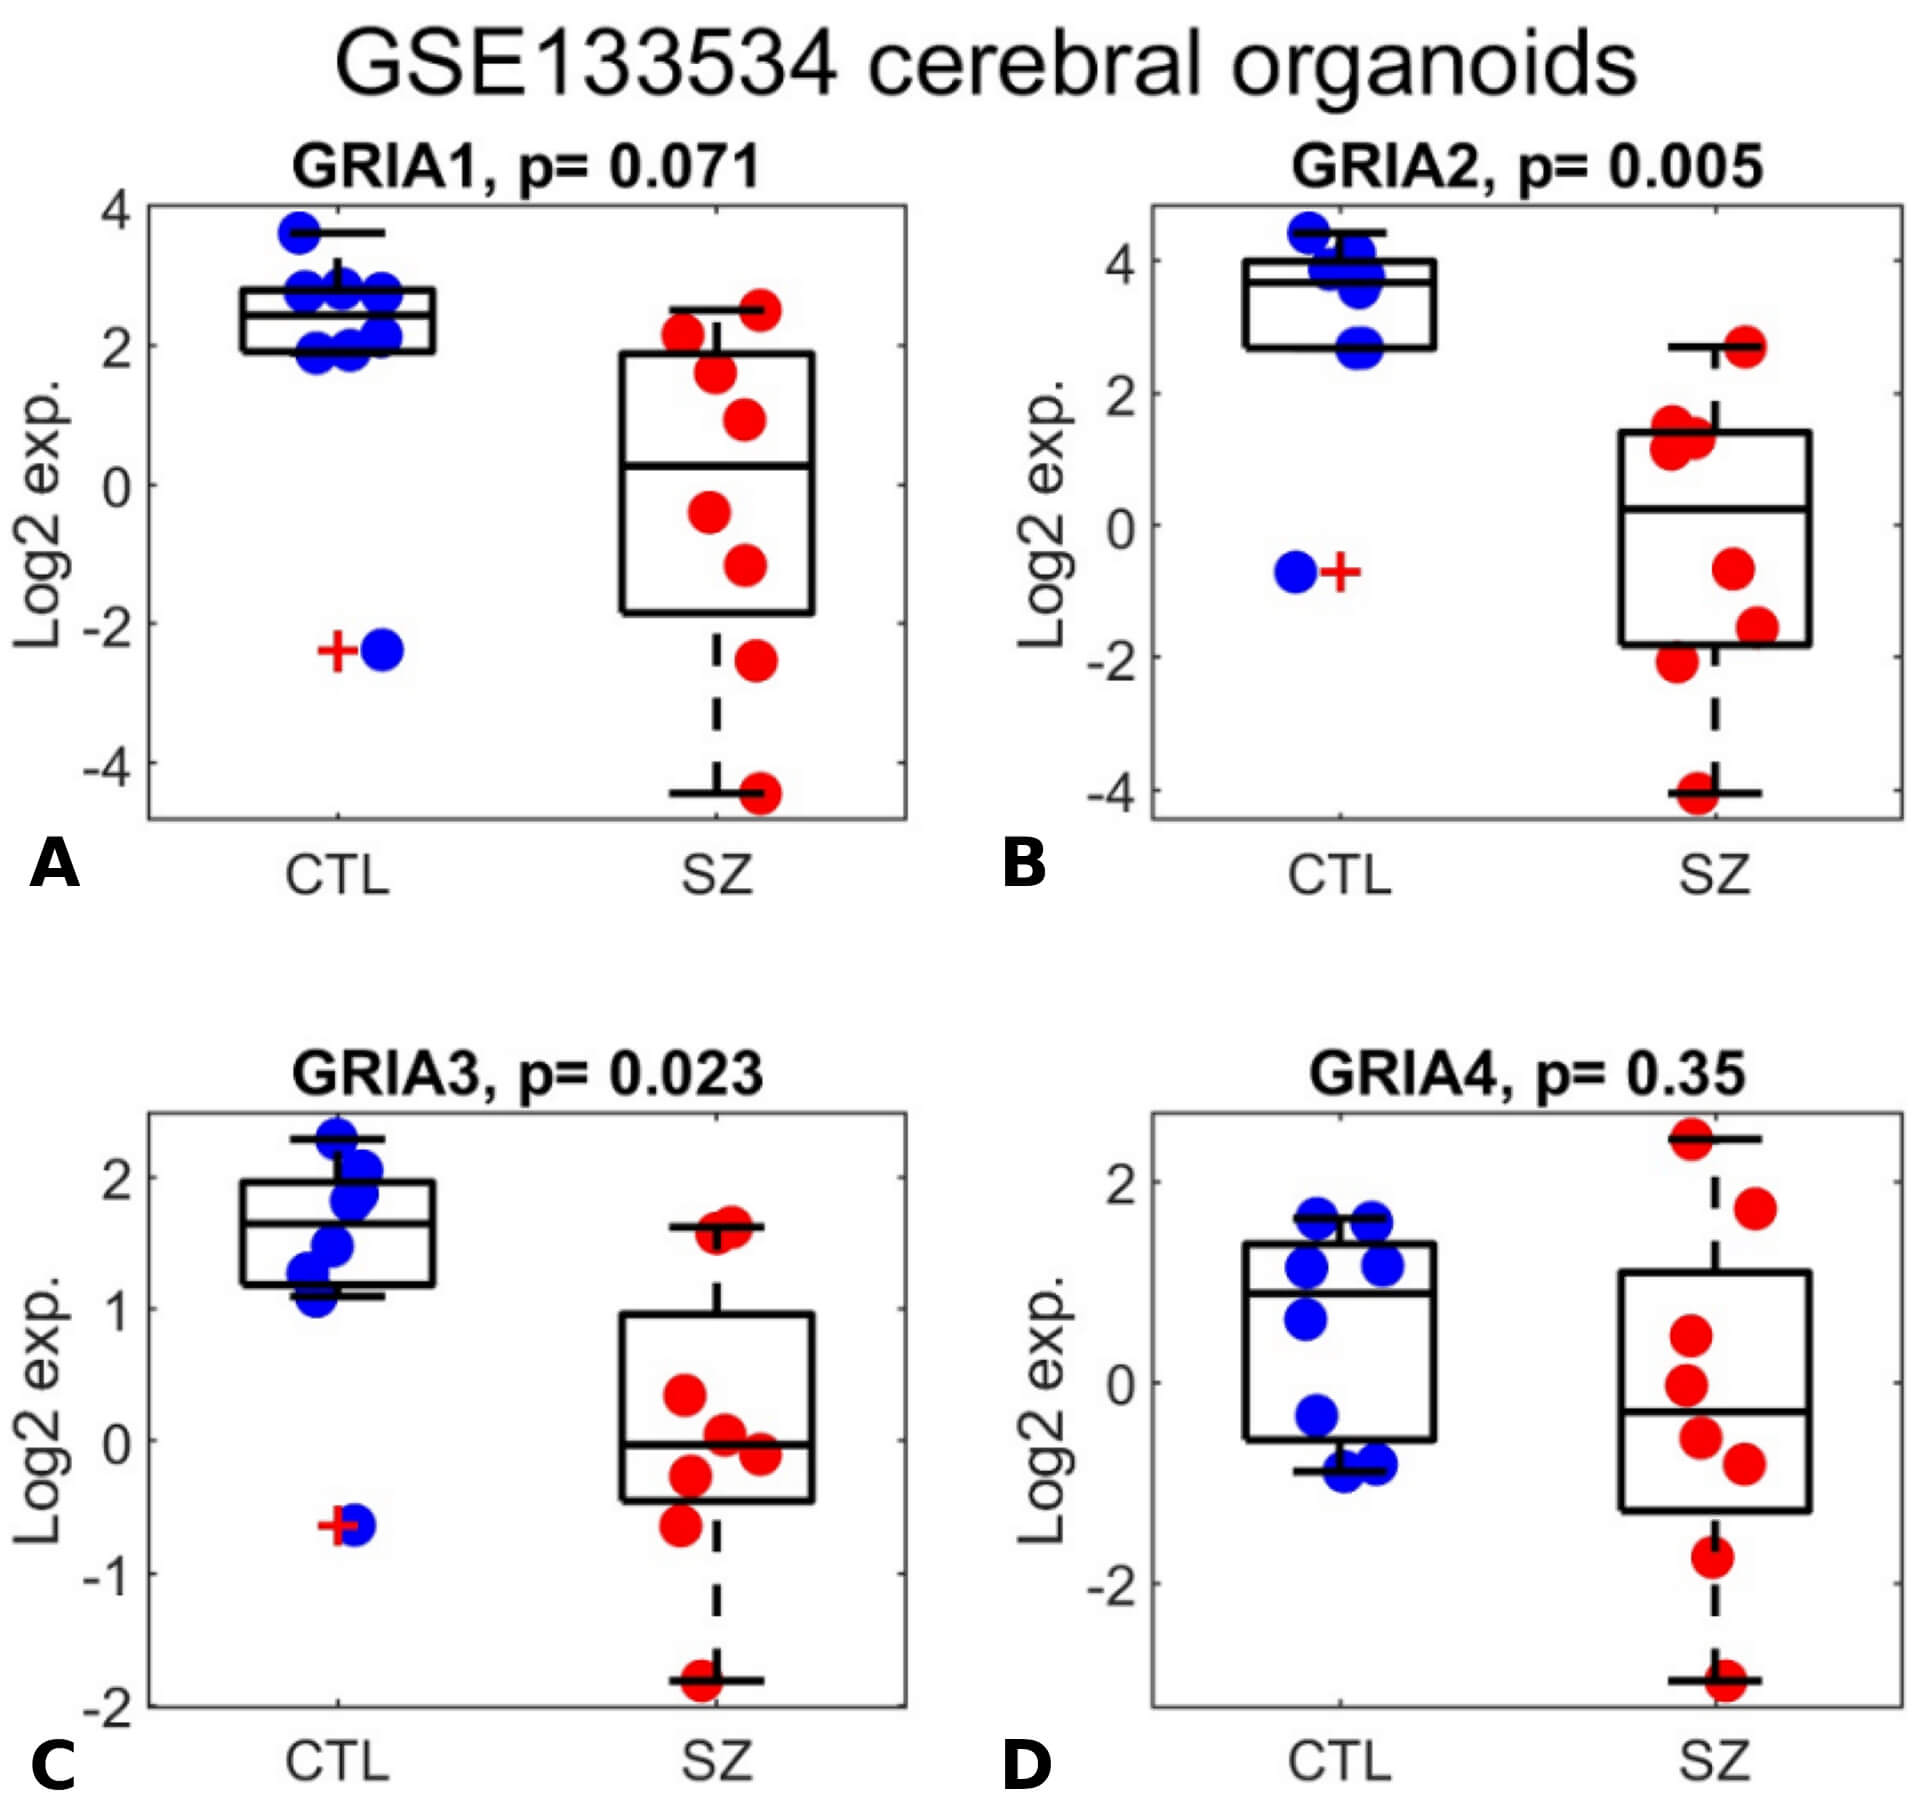
GRIA1-3 were previously shown to be significantly downregulated in schizophrenia in a study of organoids derived from patients, modeling early developmental stages. However, the differential expression of GRIA4 was not referred to [65]. We analyzed the same organoids gene expression dataset, from the GEO database (GSE133534) and comprised of 16 samples (8 schizophrenia and 8 controls). GRIA1-3 were indeed downregulated in schizophrenia (Fig. 3; p = 0.071, 0.005, 0.023, respectively), while GRIA4 did not show significant differential expression (p = 0.35). While the downregulation of GRIA1 is only marginally significant (p = 0.071), this is likely due to the small cohort size (8 schizophrenia samples and 8 controls). This explanation is further supported by the positive correlation observed with GRIA3 expression (Fig. 4).
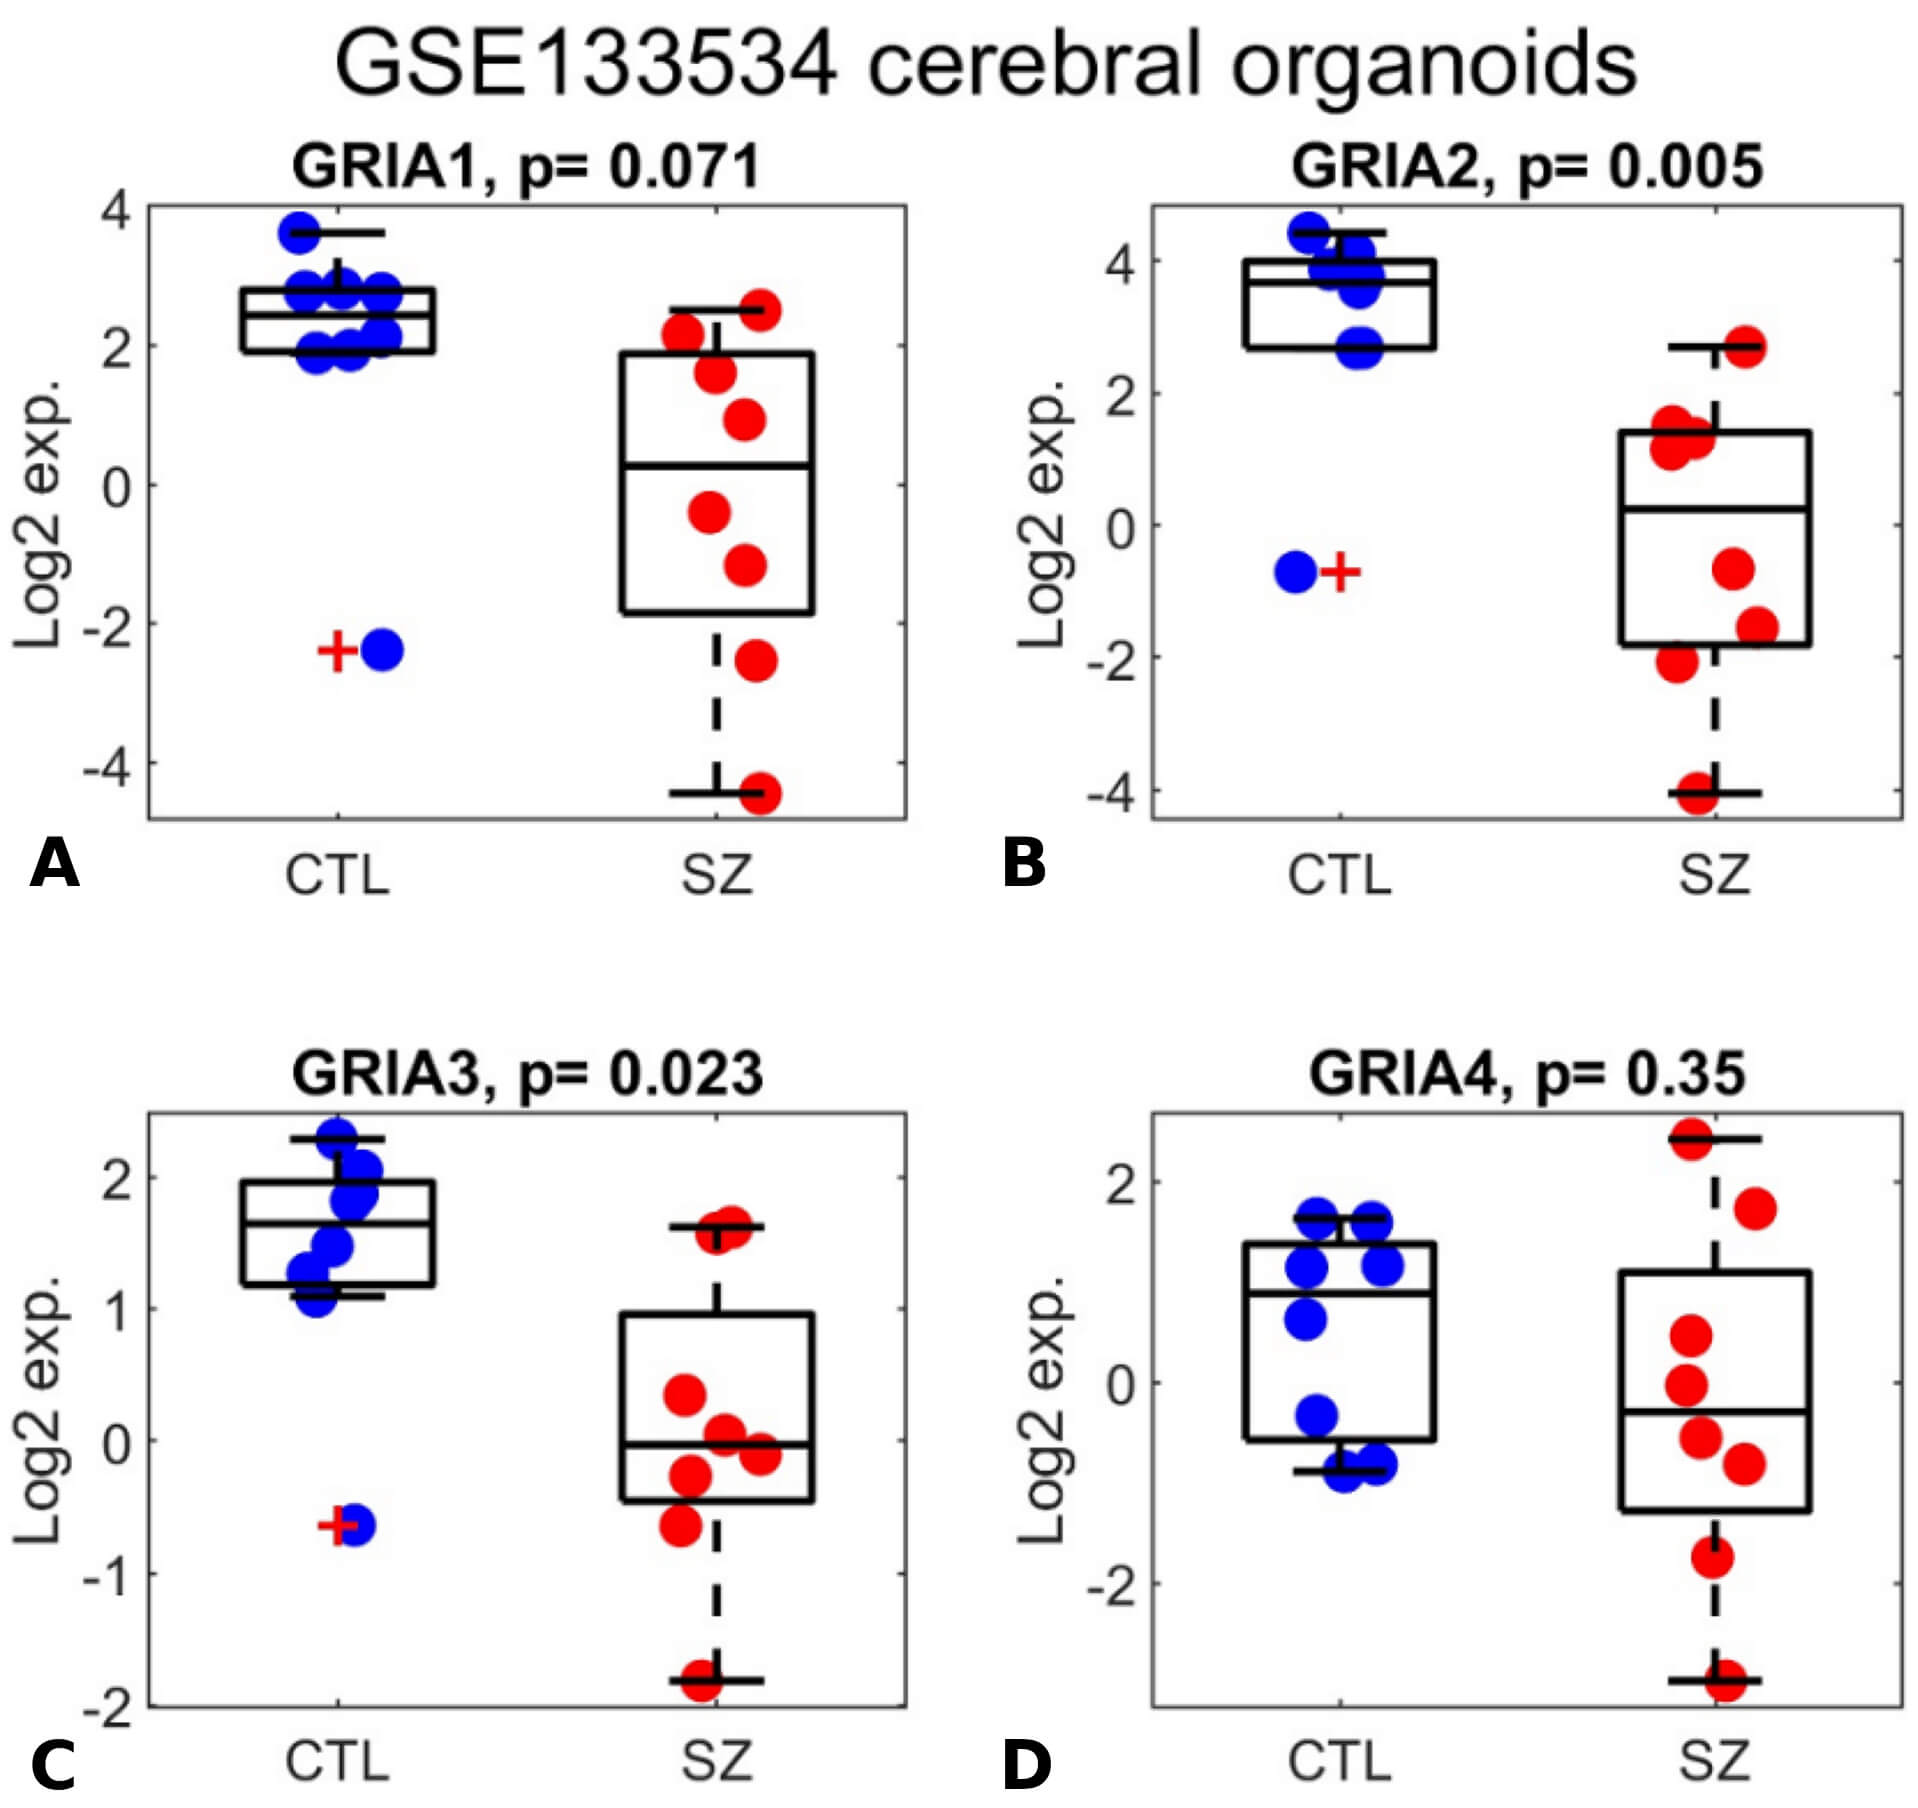 Fig. 3.
GRIA1-3 expression is downregulated in human iPSC-derived cerebral organoids from individuals with schizophrenia. (A–D) Box plots display expression levels for GRIA1 (A), GRIA2 (B), GRIA3 (C), and GRIA4 (D). The y-axis represents log₂-transformed expression values. Each dot corresponds to the log₂ expression level of an individual in the GSE133534 cerebral organoid dataset, including healthy controls (blue dots; labeled “CTL”) and individuals with schizophrenia (red dots; labeled “SZ”). The central mark indicates the median, while the bottom and top edges of each box represent the 25th and 75th percentiles, respectively. Two-sided t-test p-values are reported in the subplot titles.
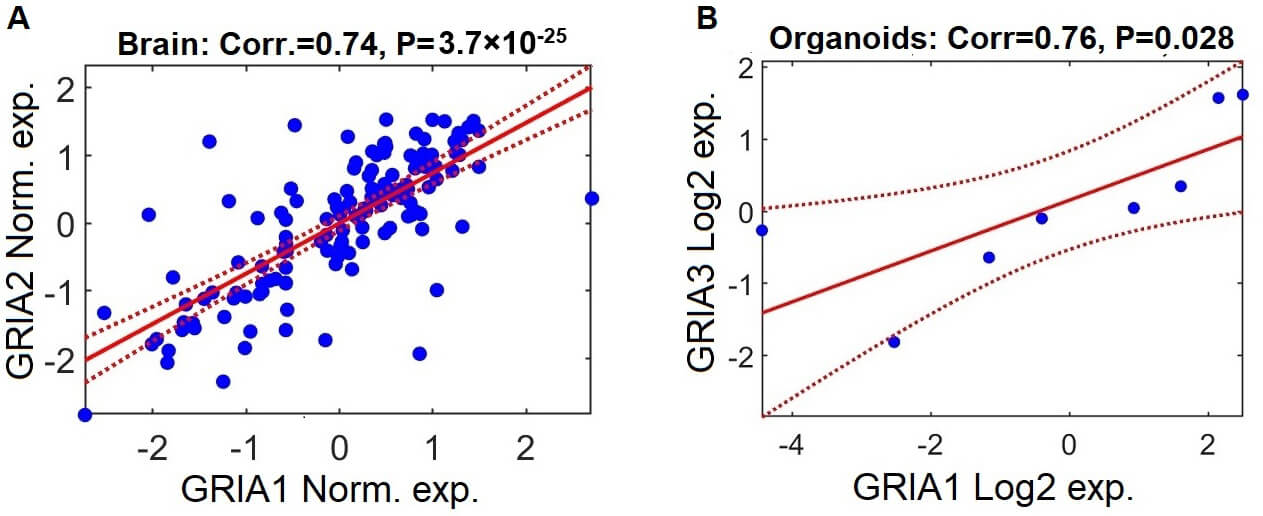
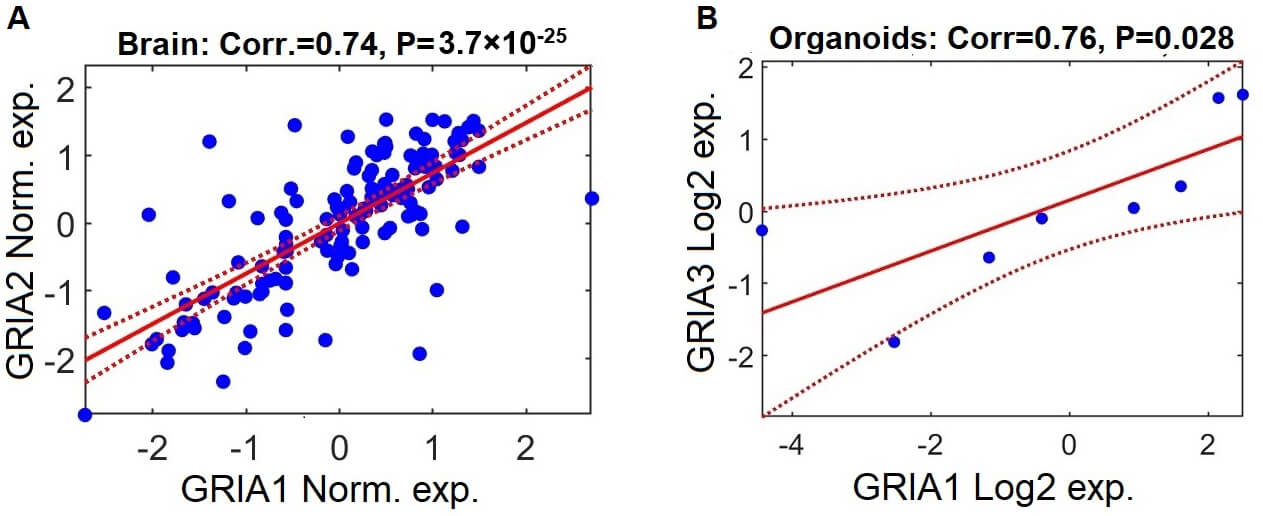 Fig. 4.
GRIA gene expression patterns are positively correlated in brain samples and cerebral organoids from individuals with schizophrenia. (A) Scatter plot demonstrating the relationship between log2-normalized expression levels of GRIA2 and GRIA1 in postmortem brain samples from individuals with schizophrenia, based on aggregated data from the seven datasets included in the meta-analysis. Each data point reflects expression values for a single participant. Normalization was performed independently within each dataset (z-scoring: mean = 0, standard deviation = 1). The solid red line shows the fitted linear regression trajectory, and the dashed red curves represent the 95% confidence interval. (B) Parallel analysis depicting the association between log2-normalized expression levels of GRIA3 and GRIA1 in schizophrenia-derived cerebral organoids.
To examine the consistency of transcriptional relationships among the GRIA genes, we computed Pearson correlation coefficients for all pairwise gene combinations within each dataset, restricted to schizophrenia samples.
In postmortem brain datasets, all GRIA gene pairs demonstrated strong
positive correlation (Supplementary Fig. 1). For example, the
correlation between GRIA1 and GRIA2 expression = 0.74,
p-value = 3.7
We further examined whether GRIA1-4 have positively correlated
expression with NMDA receptor genes. As can be seen in Supplementary Fig.
1, several NMDA receptor genes are positively correlated with
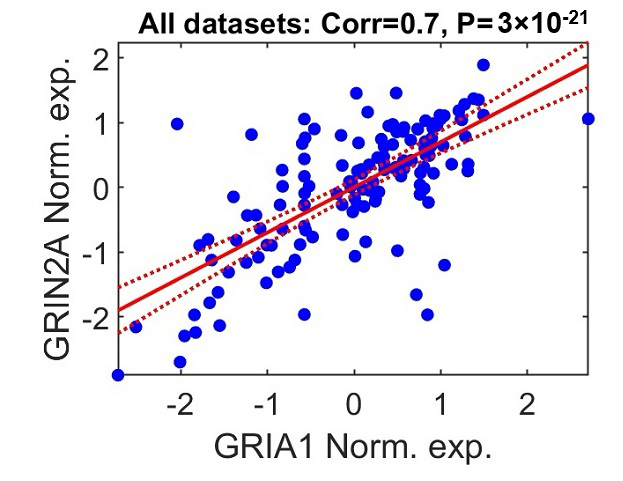
GRIA1-GRIA4. For example, Glutamate Ionotropic Receptor NMDA Type Subunit 2A (GRIN2A), encoding NMDA receptor
subunit 2A, is positively correlated with GRIA1 (Fig. 5; combined data
corr. = 0.7, p-value = 3
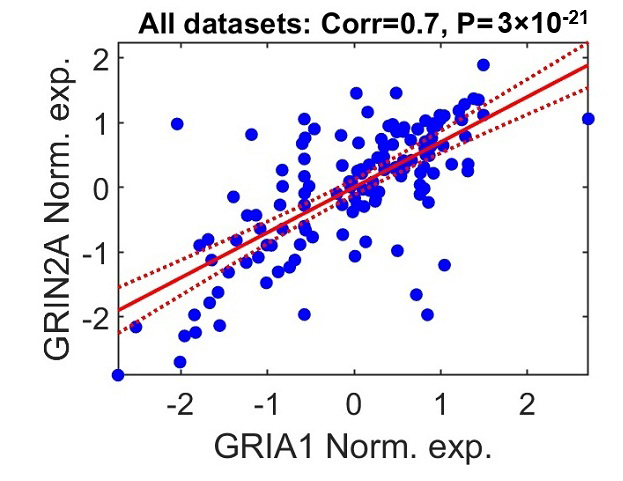 Fig. 5.
GRIA1 and GRIN2A expression patterns are positively correlated. The scatter plot illustrates the relationship between log2-normalized expression values of GRIN2A and GRIA1 in postmortem brain samples from individuals with schizophrenia. Each point represents a single participant aggregated across the seven datasets included in the meta-analysis. Gene expression values were independently standardized within each dataset (z-scored: mean = 0, standard deviation = 1). The solid red line indicates the fitted linear regression model, and the dashed lines depict the 95% confidence interval for the regression estimate.
To assess whether clinical or technical variables might influence the expression results, we constructed a linear regression model that included age, sex, pH, PMI, and antipsychotic exposure as covariates for each of the seven datasets (see Methods). Summary outcomes of this analysis are reported in Supplementary Table 1. However, data on these factors were not available for all datasets, and information on lifetime antipsychotic treatment was specifically available only for the parietal cortex dataset [70] (GSE35978). To summarize the linear regression analysis, the mean t-statistic values were calculated for each of the four GRIA genes. A consistent downward trend in expression remained even after adjusting for these confounding variables (Supplementary Table 1; mean t-statistic = –1.4, –0.71, –0.35, –1.04, respectively).
To determine whether the observed reduction in expression is consistent across
individuals or confined to a subset of individuals, we conducted a per-sample
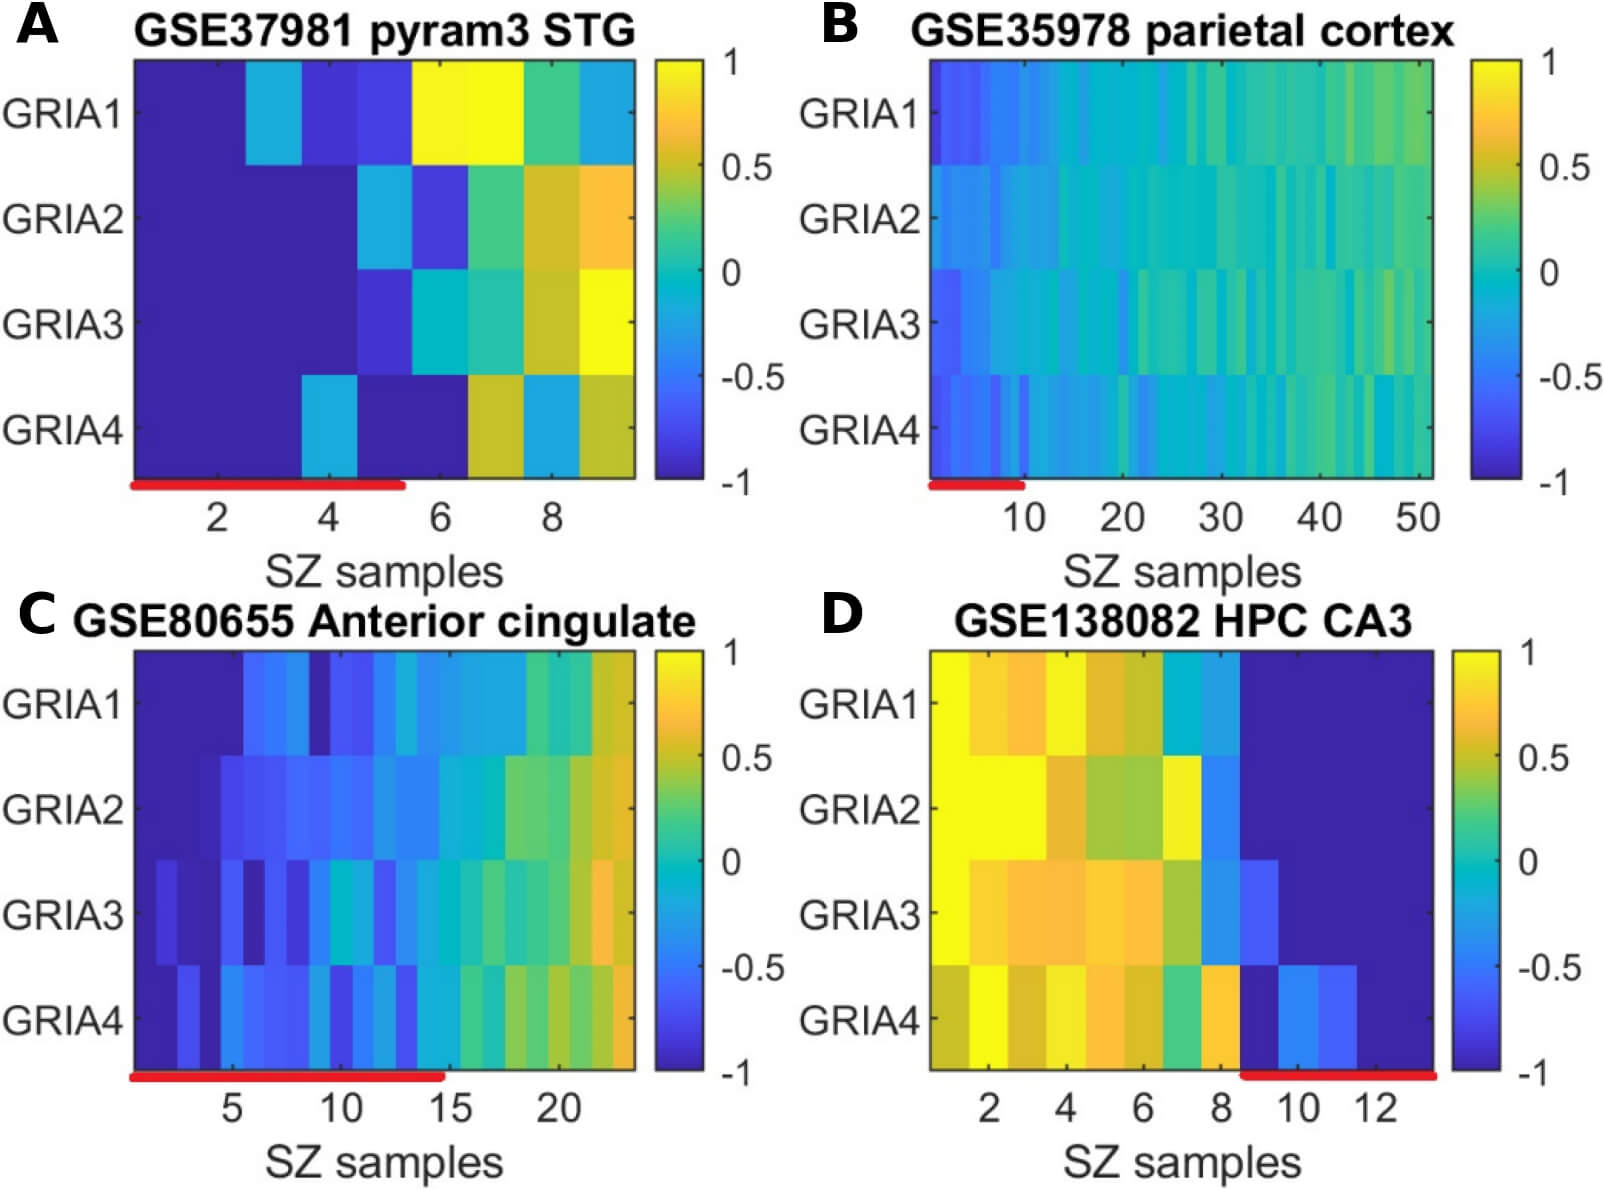
log2 fold-change analysis. As illustrated in Fig. 6, across four of the
seven datasets, the decrease in expression of GRIA1-4 appears to be
restricted to a distinct subgroup of patients. Individuals exhibiting coordinated
reduction (represented by bluish values) with mean log2 fold change values
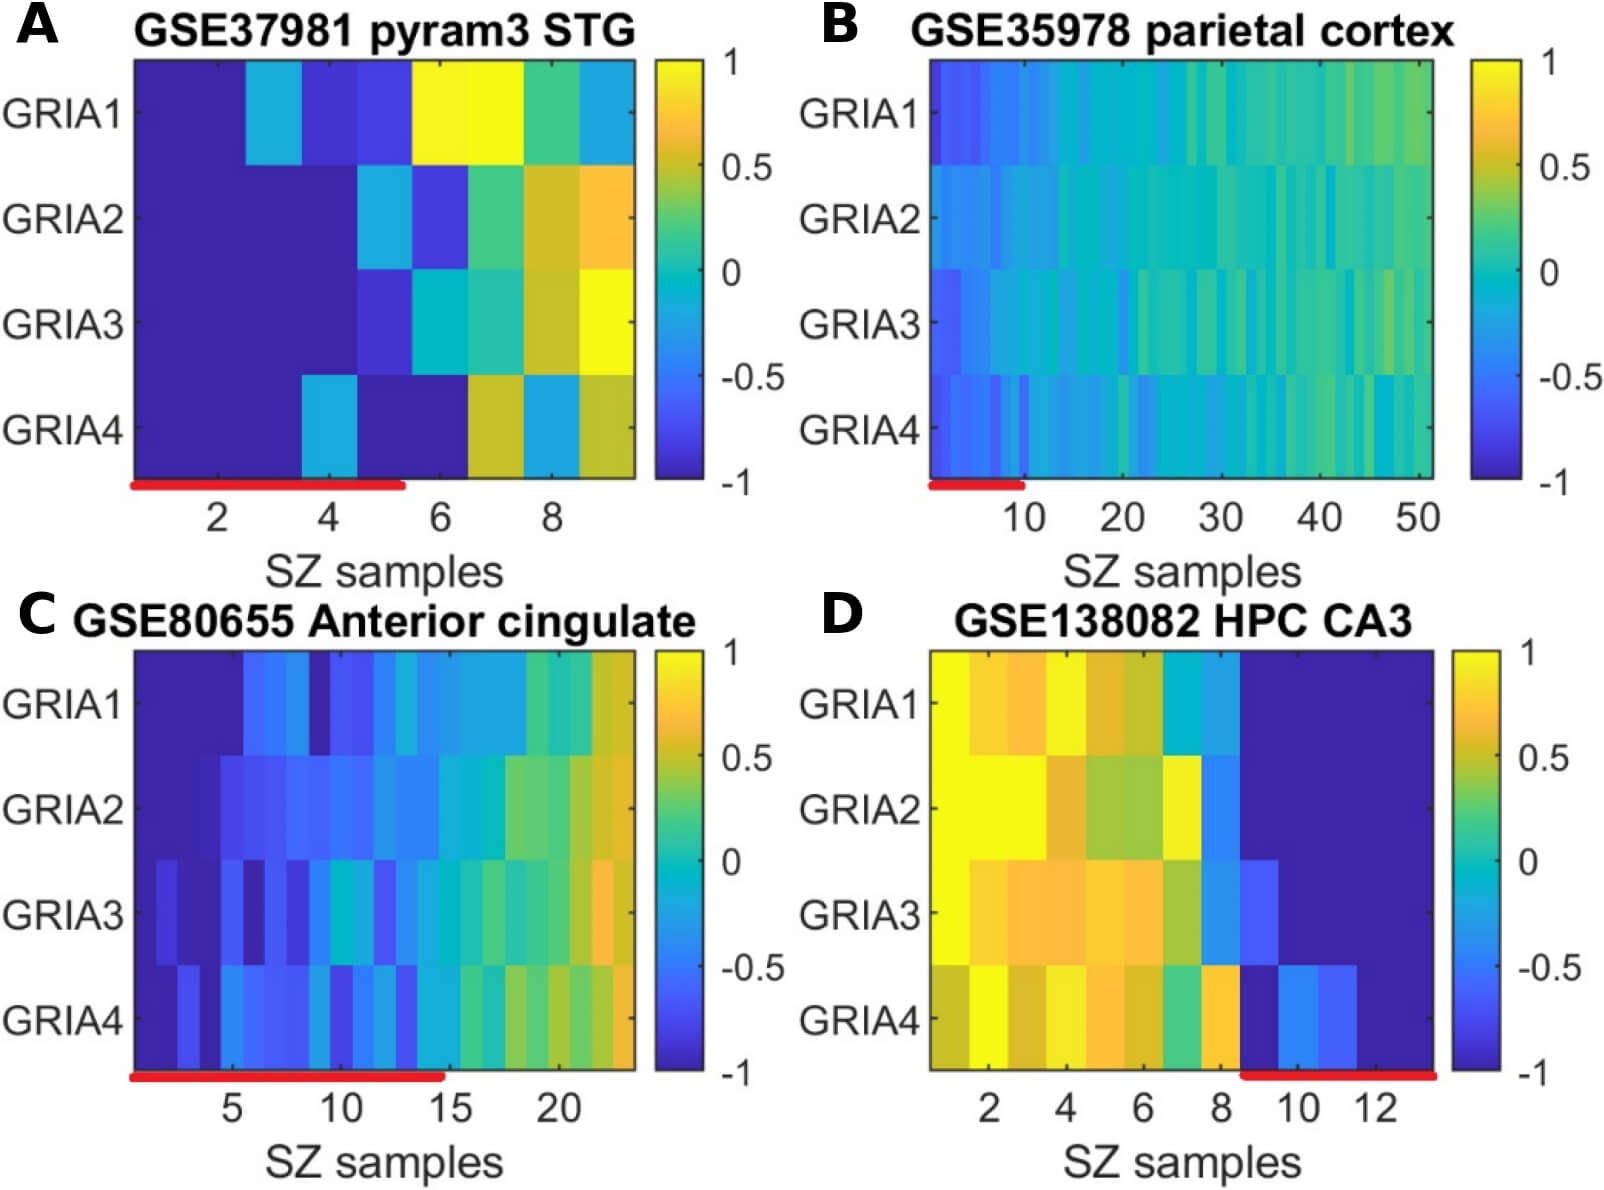 Fig. 6.
Log2 fold change per-sample analysis: subgroup-specific
reduction in GRIA1-4 expression. (A–D) display per-sample expression
patterns for each dataset, with the corresponding brain region and dataset
identifier indicated in the title. Within each heatmap, rows represent individual
GRIA genes and columns correspond to schizophrenia samples. The color
intensity at position (i, j) reflects the log2 fold change of gene
i in patient j, calculated relative to the average expression
in the control group. Samples exhibiting downregulation across GRIA
genes, with mean log2 fold change values
To examine whether the down-regulation signal was linked to specific clinical characteristics of the patients, we calculated Pearson correlations between GRIA genes’ expression and the available patient variables: age, sex, and antipsychotic treatment and suicide status (treatment and suicide status were available only in one dataset). No significant associations were observed (GRIA1 combined p-values = 0.3, 0.27, 0.71, 0.66, respectively; Supplementary Figs. 4–7; similar results were observed for GRIA2-4).
In this study, we conducted a participant- level meta-analysis of the expression of GRIA1-4 genes in brain samples from individuals with schizophrenia compared to healthy controls, by integrating seven independent gene expression datasets (a total of 295 samples, 151 with schizophrenia and 144 controls). Our analysis detects significant downregulation of the four genes encoding AMPA receptors, GRIA1-4, in schizophrenia. Additionally, our reanalysis of the organoid dataset from [65] confirmed downregulation of GRIA1-3 in schizophrenia-derived organoids (p = 0.071, 0.005, 0.023, respectively), while GRIA4 showed no significant differential expression (p = 0.35) (Fig. 3). The positive correlation between their expression patterns in both brain and organoids (Fig. 4) further supports the validity of these results and reduces the likelihood that this signal results from technical or arbitrary noise.
Genes of the GRIA family, which encode subunits of the AMPA glutamate receptor, play essential roles in synaptic plasticity, learning, and memory, functions strongly implicated in the cognitive and negative symptoms of schizophrenia [27, 28]. Disruption of these systems may aggravate cognitive symptoms in schizophrenia. Downregulation of these genes may impair glutamate transmission, potentially affecting a wide range of cognitive and neurological functions.
Furthermore, we found that GRIA genes have a positive correlation in expression with several NMDA receptor genes, including GRIN2A. GRIN2A, along with GRIA3, was included in the list of ten genes with ultra-rare variants associated with schizophrenia in the SCHEMA consortium study [36]. NMDA receptors are glutamate receptors involved in the development and course of both psychotic and negative symptoms in schizophrenia [14, 15, 16]. A linked regulation of genes encoding glutamate receptors, such as GRIA and GRIN, may suggest a higher-level dysregulation of glutamatergic signaling in schizophrenia. This mutual regulation could be important in understanding the complex interactions of molecular components that lead to the disease’s pathophysiology.
We note that our findings for GRIA1-4 do not align with several previous studies that reported up-regulation in brain samples from individuals with schizophrenia. For example, Kimoto et al. [84] found GRIA1 and GRIA4 to be up-regulated in samples from 36 individuals with schizophrenia compared to 26 controls. In contrast, Beneyto and Meador-Woodruff [44] observed downregulation of GRIA4, consistent with our findings, but did not detect significant differential expression of GRIA1 between 15 individuals with schizophrenia and 15 controls. One possible explanation for these inconsistencies is that GRIA1-4 is downregulated in a subgroup of individuals with schizophrenia, and the results depend on the proportion of this subgroup within each study. Supporting this hypothesis, our per-sample fold-change analysis showed that downregulation is concentrated in a specific subgroup of patients across most datasets in our meta-analysis (Fig. 6; Supplementary Fig. 2). Identifying heterogeneity in gene expression patterns is essential for advancing precision medicine in schizophrenia. Stratifying patients based on molecular signatures may enable more targeted therapeutic approaches and ultimately improve treatment response and clinical outcomes. Our results indicate no substantial heterogeneity attributable to differences in brain regions or measurement platforms (Table 2; I2 = 0%).
We recognize that our study, like other postmortem studies, is limited by several factors. This postmortem examination provides a snapshot of neurobiology at the end of life and cannot detect abnormalities that may have arisen when the disease first manifested itself. This is especially important in the case of schizophrenia, as research suggests that its pathophysiology develops in its early stages [85]. Additionally, the observed differential expression may be influenced by confounding factors, such as medication and illness duration. While our linear regression analyses suggest that the observed downregulation cannot be explained solely by age or sex, several potential confounders were not fully assessed. Information on PMI and pH was incomplete across studies, antipsychotic medication data were available for only one dataset, and duration of illness was not reported. Therefore, we cannot exclude the possibility that these or other confounding factors contribute to the observed downregulation.
However, the study of schizophrenia iPSCs-derived cerebral organoids, which represent early human brain development [65] and our re-analysis (Figs. 3,4), suggests that the downregulation of GRIA1-3 is already present in the early stages of the disease. Furthermore, the significant correlation we observe between GRIA genes’ expression, in both brain and organoid samples (Supplementary Fig. 1,2), provides additional validation for its downregulation in schizophrenia. Although GRIA1-3 showed consistent downregulation across both postmortem brain tissue and organoids, GRIA4 did not demonstrate differential expression in the developmental model. This discrepancy may indicate temporal heterogeneity in AMPA receptor subunit vulnerability, where GRIA4 changes either emerge later in neurodevelopment or are restricted to a more specific clinical subgroup. Alternatively, GRIA4 dysregulation may require environmental or pharmacological exposure not captured in early organoid models. Together, these patterns support the interpretation that GRIA1-3 represent a core early neurodevelopmental AMPAR signature, while GRIA4 may participate in a downstream or secondary phase of disease-related synaptic remodeling.
Another limitation is that transcript levels do not necessarily reflect protein abundance or receptor functionality, and caution is required in interpreting downstream physiological implications. Future studies integrating proteomic, electrophysiological, and functional readouts are required for clarifying the biological consequences of altered GRIA expression in schizophrenia.
In summary, our analysis identifies a subgroup of individuals with schizophrenia showing coordinated downregulation of GRIA1-4, which encodes AMPA receptor subunits. The identification of distinct molecular subgroups is an essential step toward the development of personalized medicine in schizophrenia. The downregulation of GRIA1-3 in organoid models suggests that these changes arise before disease onset. Combined with the established genetic link between GRIA genes and schizophrenia, as well as the critical role of glutamate signaling in its pathophysiology, our findings indicate that this differential expression may contribute to disease development.
This research underscores the need for further investigation into AMPA receptor modulation as a potential biomarker and therapeutic target for a distinct subgroup of patients with schizophrenia. Such insights could pave the way for the development of personalized treatment approaches.
GRIA1-4 are significantly downregulated in a subgroup of individuals with schizophrenia, with changes in GRIA1-3 already evident in cerebral organoids, suggesting an early neurodevelopmental origin. While no clear clinical characteristics were found to distinguish this subgroup, these findings indicate a distinct molecular subgroup of patients and highlight GRIA expression as a potential biomarker and therapeutic target for advancing personalized treatment in schizophrenia.
ACC, anterior cingulate cortex; AMPA,
All datasets analyzed in this study were previously published and are publicly accessible through the Gene Expression Omnibus (GEO) database (https://www.ncbi.nlm.nih.gov/geo/).
LH: Supervision, Conceptualization, Methodology, Writing - Reviewing and Editing. AB: Conceptualization, Methodology, Investigation, Writing- Original draft preparation. AY: Methodology, Software, Data Curation, Visualization. All authors contributed to editorial changes in the manuscript. All authors read and approved the final manuscript. All authors have participated sufficiently in the work and agreed to be accountable for all aspects of the work.
Not applicable.
We thank Professor Eytan Domany for his help with the infrastructure that enabled the performance of this project.
This research received no external funding.
The authors declare no conflict of interest.
Supplementary material associated with this article can be found, in the online version, at https://doi.org/10.31083/AP46200.
References
Publisher’s Note: IMR Press stays neutral with regard to jurisdictional claims in published maps and institutional affiliations.