


 , Lihong Deng 1,2,†, Mingli Li 3, Qiang Wang 3, Liansheng Zhao 3, Hua Yu 1,2, Xiaojing Li 1,2, Wei Deng 1,2,4,5, Wanjun Guo 1,2, Tao Li 1,2,4,5,6, Peiyan Ni 1,*
 , Wei Wei 1,2,4,5,6,*
1 Affiliated Mental Health Center & Hangzhou Seventh People's Hospital, Zhejiang University School of Medicine, 310013 Hangzhou, Zhejiang, China
2 Nanhu Brain-computer Interface Institute, 311100 Hangzhou, Zhejiang, China
3 Mental Health Center of West China Hospital, Sichuan University, 610041 Chengdu, Sichuan, China
4 NHC and CAMS Key Laboratory of Medical Neurobiology, Zhejiang University, 310058 Hangzhou, Zhejiang, China
5 Liangzhu Laboratory, MOE Frontier Science Center for Brain Science and Brain-machine Integration, State Key Laboratory of Brain-machine Intelligence, Zhejiang University, 311121 Hangzhou, Zhejiang, China
6 Zhejiang Key Laboratory of Clinical and Basic Research for Psychiatric Diseases, 310013 Hangzhou, Zhejiang, China
†These authors contributed equally.
Abstract
Although morphological abnormalities of the corpus callosum (CC) have been reported in schizophrenia, findings across studies have been inconsistent. We systematically examined whether these morphological alterations are influenced by age.
A total of 151 individuals with treatment-naïve first-episode schizophrenia (FES) and 278 healthy controls were included. T1-weighted structural MRI scans were used to segment the CC on the midsagittal plane into 100 equidistant points, and CC thickness was estimated at each point. To determine whether CC thickness abnormalities associated with schizophrenia were moderated by age, we applied the Johnson–Neyman technique. Additionally, we investigated the relationship between age-dependent CC thickness abnormalities and clinical symptoms using partial least-squares correlation analysis.
Abnormal CC thickness was observed in individuals with treatment-naïve FES, specifically within the rostral body, anterior midbody, isthmus, and splenium. These regions were thinner in younger patients compared with healthy controls but appeared thicker in older patients. Furthermore, increased CC thickness in older patients was associated with greater clinical symptom severity, whereas this association was not observed in younger patients.
Our findings demonstrate that CC thickness abnormalities in treatment-naïve FES are age-dependent. The relationship between CC thickness and symptom severity also varies as a function of age. These results suggest that the CC may represent a critical biological target for age-sensitive, individualized therapeutic interventions in schizophrenia.
Keywords
- corpus callosum
- magnetic resonance imaging
- schizophrenia
- white matter
1. Corpus callosum (CC) thickness abnormalities in treatment-naïve first-episode schizophrenia (FES) were age-dependent: thinner in younger patients and thicker in older patients, compared with healthy controls.
2. Specific CC subregions driving these effects were the rostral body, anterior midbody, isthmus, and splenium.
3. Greater CC thickness in older FES patients was associated with more severe symptoms, a correlation not observed in younger patients.
4. The results suggest that adolescent-onset schizophrenia might represent a distinct form of the illness and implicate the CC as a potential target for age-sensitive, individualized therapeutic strategies.
Schizophrenia (SZ) is a persistent and severe mental disorder characterized primarily by paranoid delusions and auditory hallucinations [1]. The societal and economic burden caused by SZ is substantial [2, 3]. Previous studies have found significant white matter anomalies in SZ patients. A meta-analysis of the enhancing neuroimaging genetics through meta-analysis consortium (ENIGMA) SZ diffusion tensor imaging (DTI) Working Group’s study, which involved over 4300 participants from 29 independent cohorts, revealed significant fractional anisotropy decreases in 20 of 25 major white matter regions of interest in individuals with SZ. Among these, the most pronounced effects were localized to the corpus callosum (CC) [4]. Furthermore, a meta-analysis conducted by Zhuo et al. [5] reported white-matter diffusion alterations in the CC of SZ patients, and identified the genu and splenium of the CC as two areas with a lower fractional anisotropy value than that of healthy controls (HCs).
The CC stands as the brain’s largest white matter structure, functioning as the primary commissural fiber bundle that facilitates communication between the two cerebral hemispheres [6]. Its morphological abnormalities in SZ are well-established, with numerous studies reporting a smaller area and volume. Two meta-analyses indicated a significantly smaller CC area among SZ patients, particularly in first-episode cases, than in HCs [7, 8]. Collinson et al. [9] found that SZ patients presented with substantially smaller CC areas as well as CC volumes than the control group. Nevertheless, the findings were inconsistent. Several studies also reported no significant differences in CC morphology between SZ and HCs [10, 11], or even larger CC areas in SZ [12].
This inconsistency may be influenced by sample-selection bias, such as variations in the age of onset of SZ patients across studies. Although SZ commonly emerges in early adulthood, a smaller group (5–18%) experiences their initial psychotic episode in childhood or adolescence; this is referred to as early-onset SZ (before age 18). Evidence has indicated that early-onset SZ often shows more severe symptoms and a poorer prognosis than does adult-onset SZ (after age 18) [13, 14, 15].
Although various methods exist for characterizing CC morphology, such as areal subdivision [16], cortical endpoint [17], and boundary tangent [18], the present study used the cross-sectional thickness model [19]. This model, which is a state-of-the-art approach, fills a significant methodological gap by providing higher regional specificity than do the other techniques. By generating 100 data points along the CC, it offers a considerable improvement in granularity over the five-to-seven subregions commonly derived from segment-specific methods. This allows for more precise insights and could offer improved sensitivity in detecting meaningful effects.
The primary purpose of this study was to investigate age-dependent CC-thickness abnormalities in first-episode schizophrenia (FES). Using a moderation analysis, we explored whether these abnormalities varied across different ages of onset. We also examine the association between identified CC thickness abnormalities and the clinical symptomatology of FES.
FES patients were recruited from both inpatient and outpatient psychiatric units at West China Hospital, Sichuan University. All patients were treatment-naïve. The diagnosis of SZ was determined by the criteria outlined in the Structured Clinical Interview for Mental Disorders, Fourth Edition (DSM-IV), patient version (SCID-P). HCs were recruited through community advertisements. Interested individuals from the community were invited to West China Hospital for screening and assessment using the SCID for DSM-IV, non-patient edition to ensure they had no current or past psychiatric disorders. General exclusion criteria for all participants included: individuals with severe physical diseases, nervous system diseases, personality disorders, alcohol abuse, substance abuse, or an intelligence quotient (IQ) below 70. Participants provided informed consent after receiving a full description of the study. For juveniles, the informed consent forms were signed by their legal guardians. This study was approved by the Institutional Review Board of West China Hospital of Sichuan University (2017-131) and was conducted in accordance with the Helsinki Declaration.
All study participants were of Han Chinese ethnicity and predominantly right-handed, as determined by the Annett Handedness Scale [20]. The Positive and Negative Syndrome Scale (PANSS) was estimated when patients were recruited. We used a four-factor model to categorize symptoms as estimated by PANSS, which included negative, positive, affective, and cognitive dimensions [21].
All neuroimaging scans were conducted using a 3.0 T MR scanner (Achieva; Philips, Amsterdam, Netherlands), equipped with an 8-channel phased-array head coil. Foam padding and earplugs were used to control participant head movement and suppress scanner noise.
High-resolution T1-weighted (T1w) images were acquired using a
magnetization-prepared rapid gradient-echo sequence (MPRAGE) with the following
parameters: repetition time (TR): 8.1 ms, echo time (TE): 3.7 ms, inversion time
(TI): 1072.4 ms, flip angle: 7°, slice thickness: 1 mm (without slice
gap), 188 axial slices, matrix size: 256
We estimated the thickness of the CC by using a semi-automated pipeline (https://github.com/chrisadamsonmcri/CCSegThickness), as comprehensively detailed in previous publications [19, 22]. This pipeline comprised several crucial steps: initial identification of the mid-sagittal plane from T1-weighted MRI data, followed by template-based segmentation of the CC, correction of topological errors, and exclusion of pericallosal blood vessels. Post-segmentation, thickness profiles were generated through the following procedures: the CC was partitioned into left and right halves, delimited by the bottommost extremities at the left and right. An intermediate equipotential contour was generated between these endpoints, computed as a solution to Laplace’s equation to optimize the length of the CC midline contour. This process also divided the outer boundary of the structure into superior and inferior contours. Streamlines were subsequently computed at regular intervals along the central contour, defined as non-overlapping parallel lines intersecting superior and inferior contours orthogonally in an anterior-posterior trajectory. For this study, we created 100 streamlines per subject (see generation of CC thickness streamlines in Fig. 1).
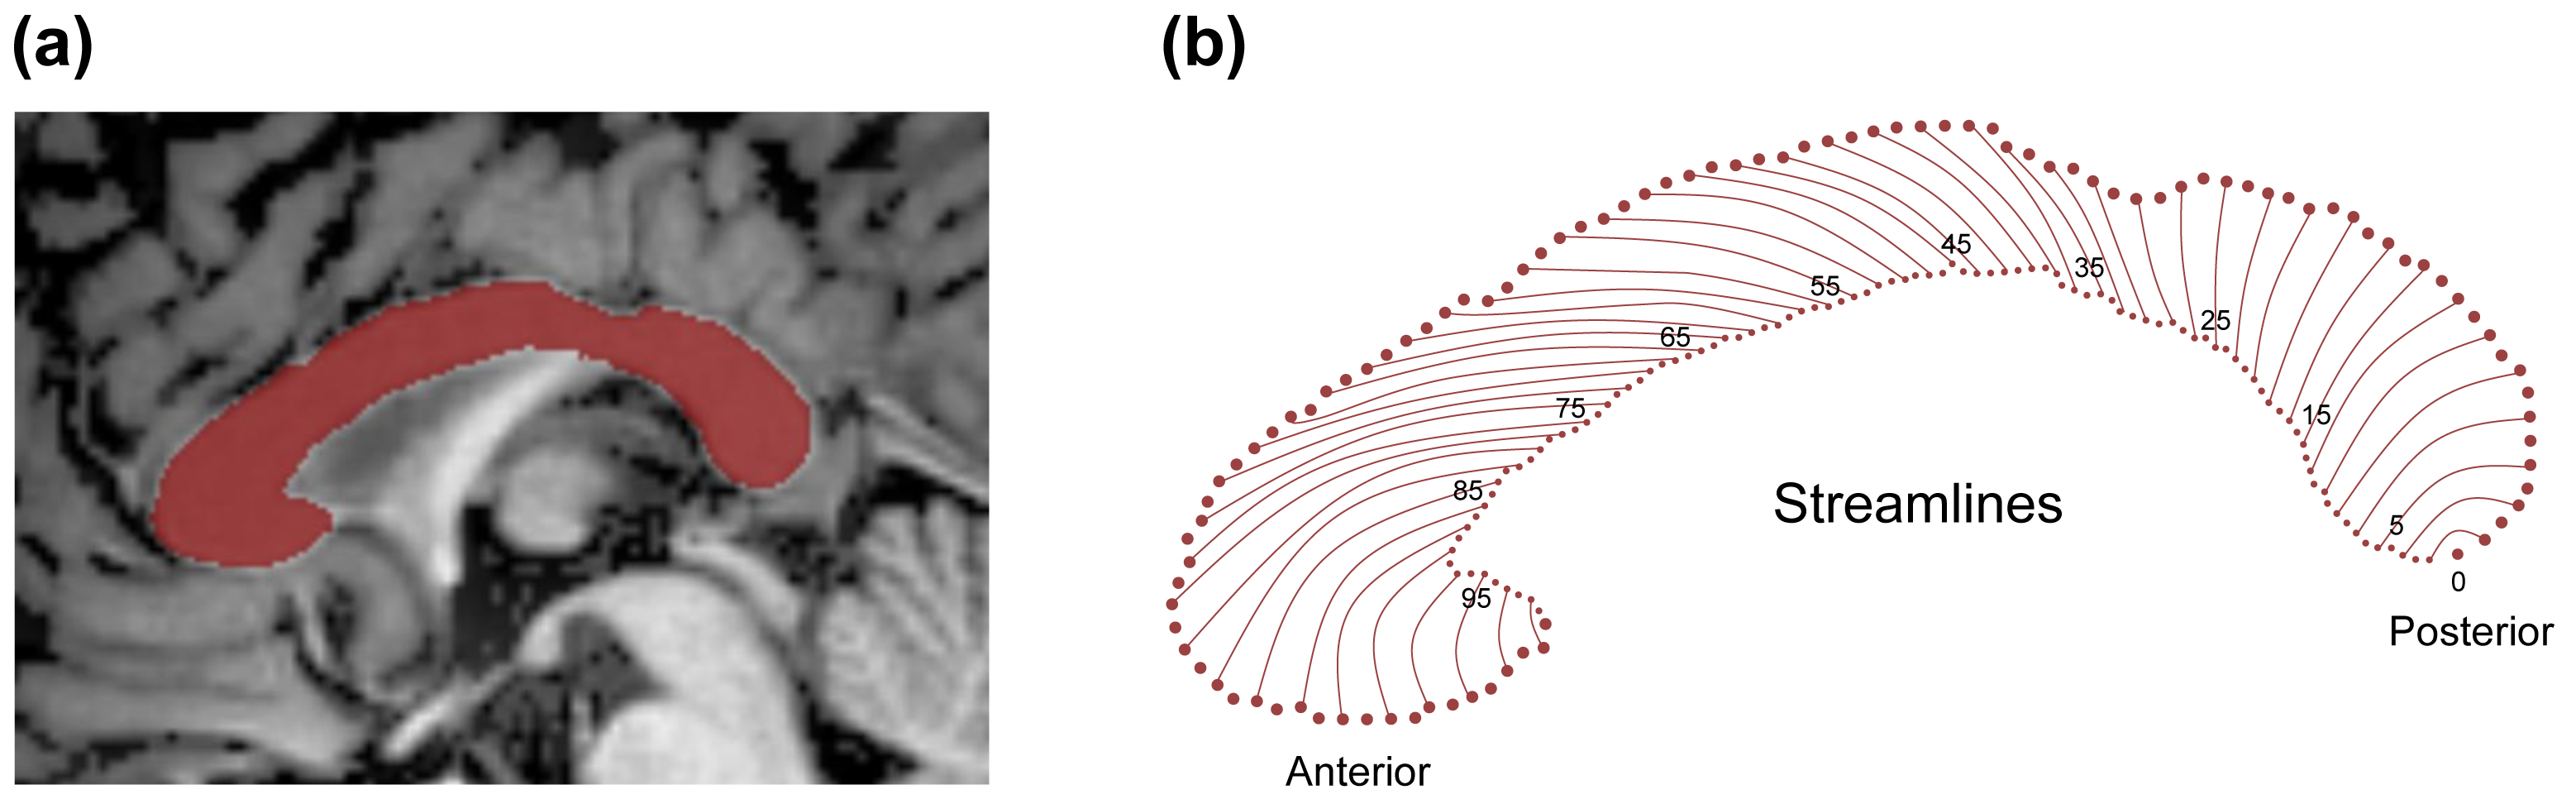 Fig. 1.
Generation of CC thickness streamlines. (a) Mid-sagittal CC segmentation in a sample subject, with the final CC mask shown in red. (b) Nonoverlapping cross-sectional contour lengths (streamlines) are indexed starting from 0 at the posterior junction of the inferior and superior boundaries of the CC, progressing anteriorly to node 100 at the most rostral point. CC, corpus callosum.
We used chi-square tests or 2-sample t-tests to examine sex, age (range: 11–42 years), years of education (EDUY), and total intracranial volume (TIV) between groups. All statistical analyses were performed using IBM SPSS Statistics for Macintosh (IBM Corporation, Somers, NY, USA, Version 26.0).
We used the Johnson-Neyman (JN) technique [23, 24] with the “interactions”
(v1.1.5) R package in R v 4.2.3 (R Foundation for Statistical Computing, Vienna,
Austria) to explore the conditional effects (
To investigate whether the interaction between CC thickness and age was associated with clinical symptoms, we performed a Partial Least Squares Correlation (PLSC) analysis on the FES group [26, 27]. PLSC is a multivariate statistical method designed to identify latent variables (LVs) that maximize the covariance between two data matrices. Initially, we performed PLSC with the R matrix as a product of the design matrix (X) and the scores of PANSS (Y). The design matrix included CC thickness data, age, and their interaction. Subsequently, singular value decomposition was used to decompose matrix R, yielding pairs of saliences (U and V) along with their respective singular values. Finally, we computed participant-specific behavior scores by projecting individual PANSS scores onto respective saliences using the formula: behavior scores = YU. These behavior scores represented each participant’s symptom pattern captured by the LVs.
To determine statistical significance, a permutation test (10,000 iterations)
was run to generate null distributions for all singular values collectively,
setting the significance threshold at p
To account for potential confounding by clinical characteristics, we performed a sensitivity analysis. This analysis assessed the relationship between CC thickness (in regions identified as statistically significant in the primary analysis) and clinical symptoms using the JN technique, adjusting for illness duration, age of onset, sex, and years of education.
Fig. 2 shows participant flow. The final sample comprised 151 FES patients and
278 HCs. Sex and TIV did not differ between FES patients and HCs. FES patients
had significantly lower age and EDUY (both p
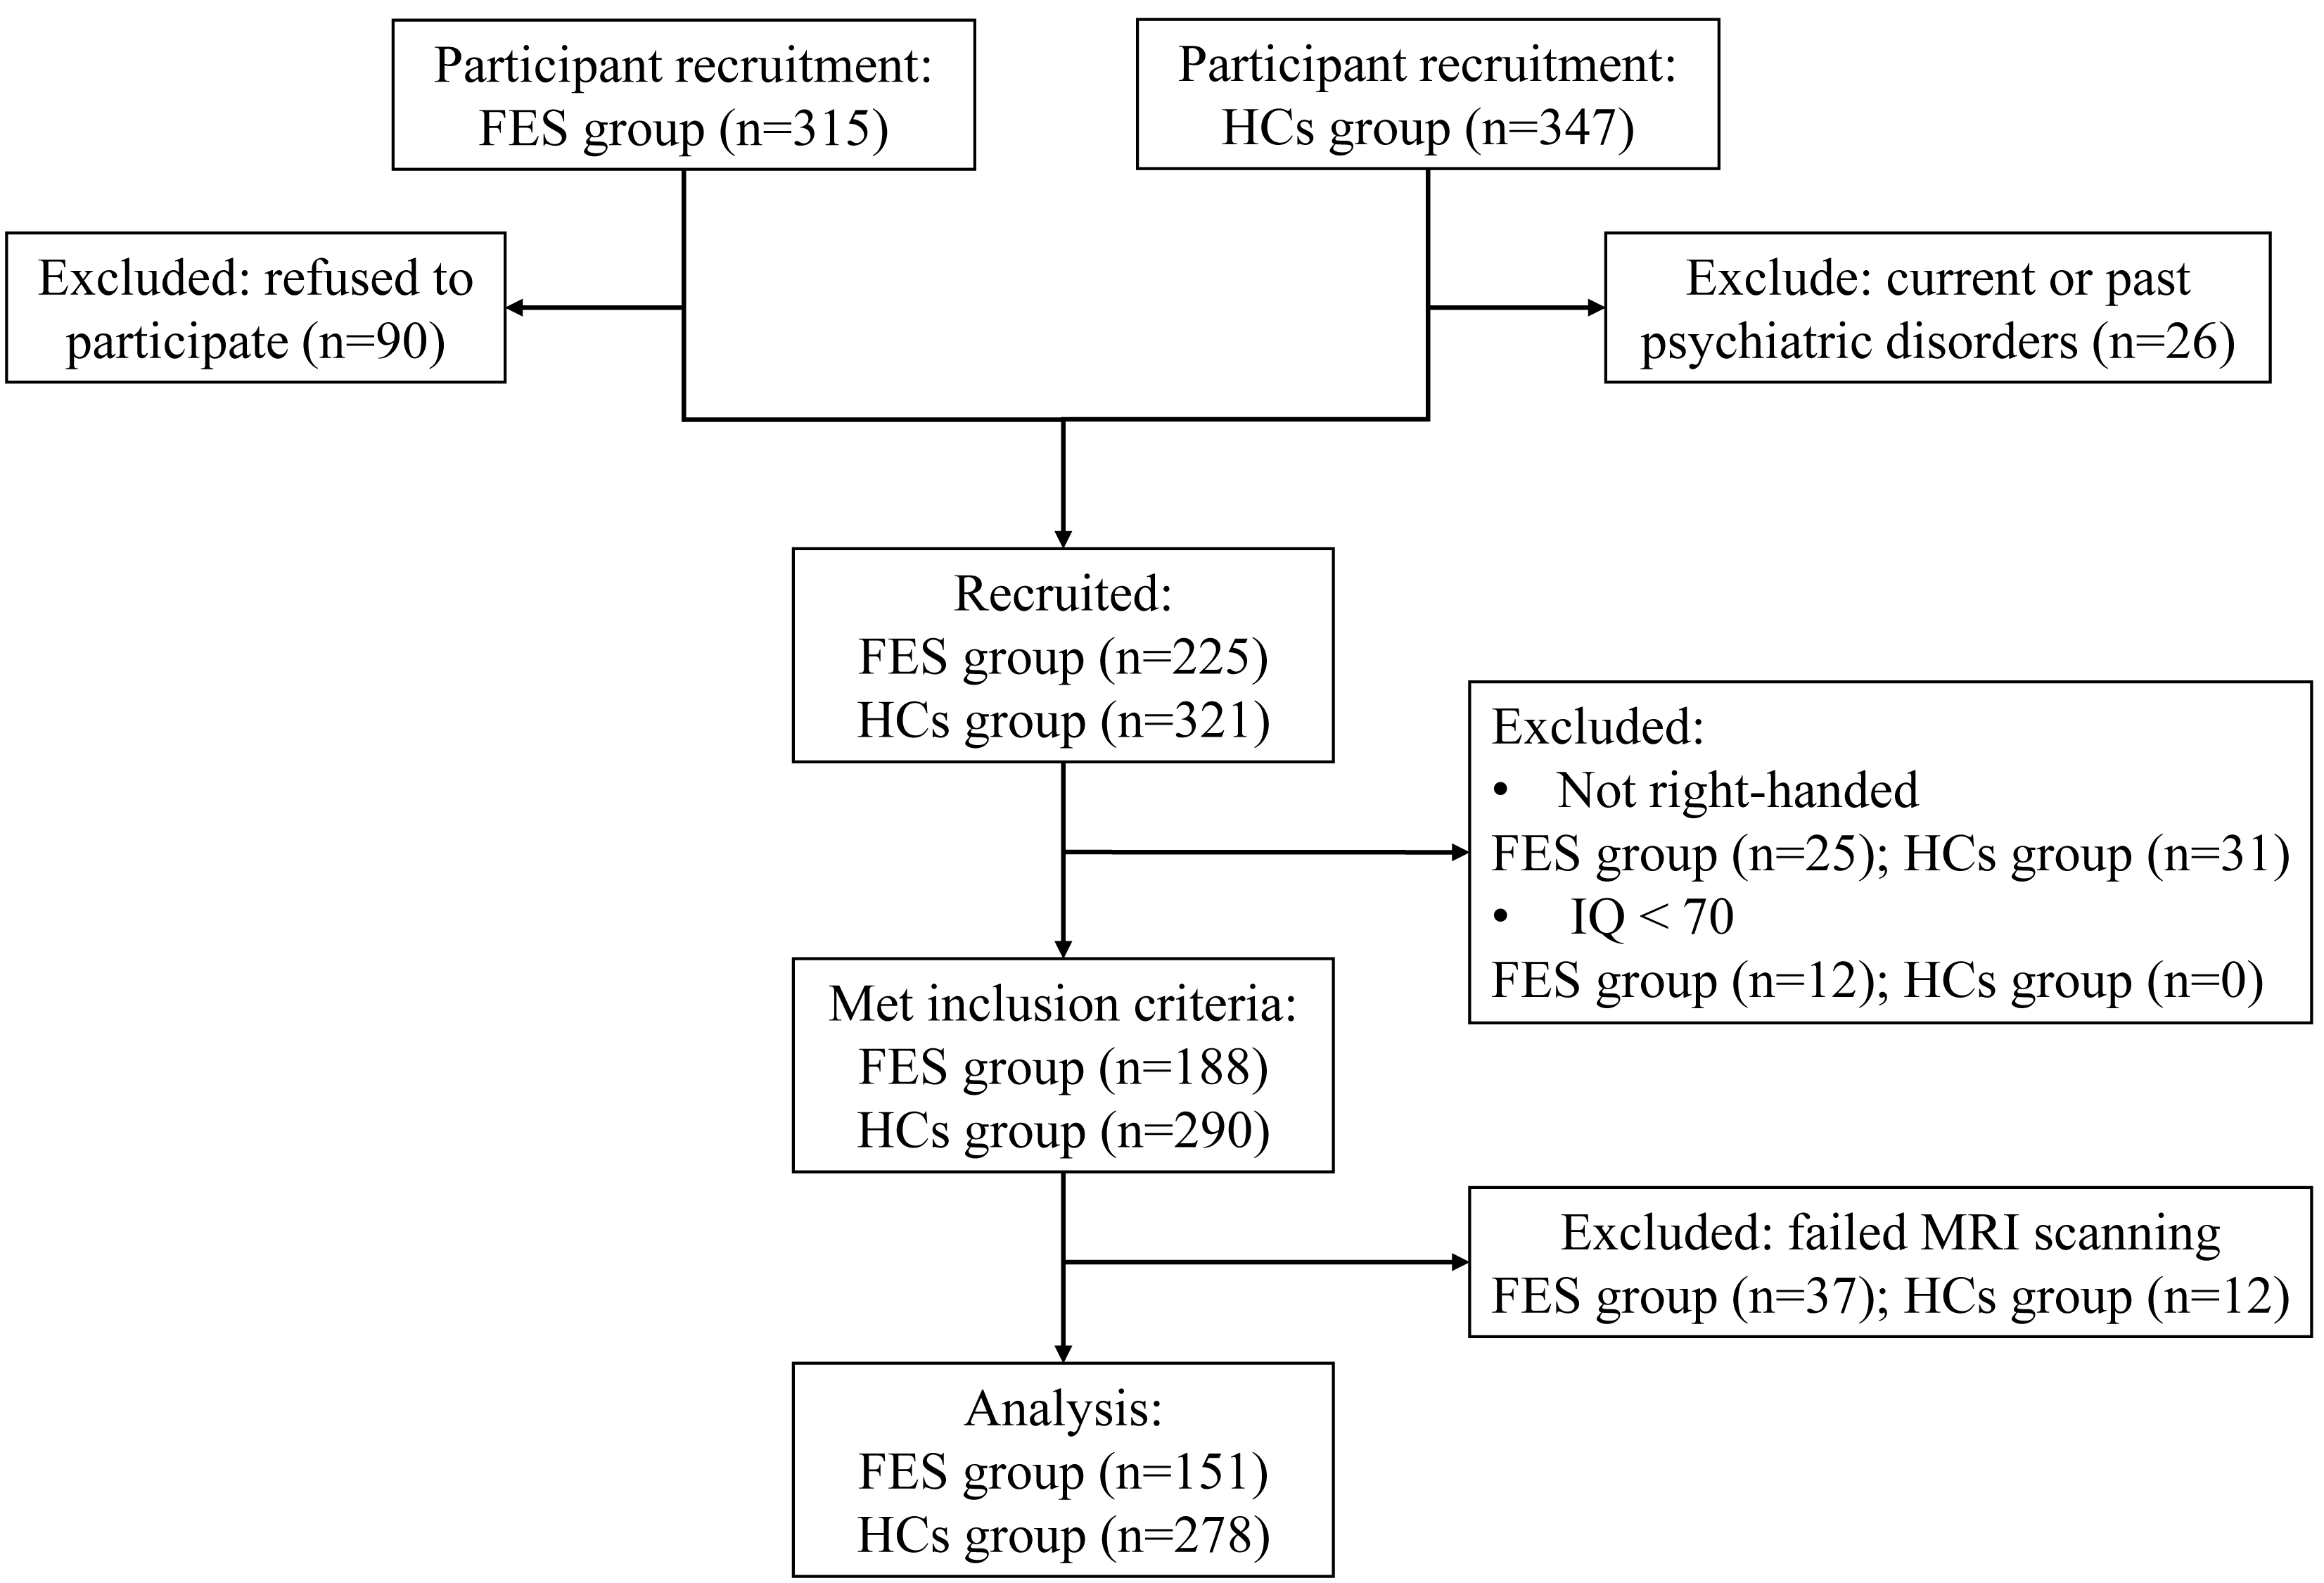 Fig. 2.
Participant flow diagram. Abbreviations: FES, first-episode schizophrenia; HCs, healthy controls.
| FES (n = 151) | HC (n = 278) | Statistics | p | |
| Age (years) | 20.34 |
23.71 |
t = –5.06 | |
| Gender (M/F) | 59/92 | 92/186 | χ2 = 1.534 | 0.216 |
| EDUY (years) | 11.27 |
15.09 |
t = –12.39 | |
| TIV (cm3) | 1449.59 |
1446.47 |
t = 0.25 | 0.805 |
| PANSS | n = 137 | |||
| Total | 83.91 |
|||
| Negative | 8.22 |
|||
| Positive | 7.59 |
|||
| Affective | 7.00 |
|||
| Cognitive | 8.26 |
Abbreviations: EDUY, years of education; TIV, total intracranial volume; PANSS, Positive and Negative Syndrome Scale. PANSS data were unavailable for 14 patients due to missing source records.
Note: values are presented as mean
Preliminary JN analysis identified significant differences in CC thickness between FES patients and HCs, with the affected streamlines presented in Fig. 3. To facilitate a more focused and systematic analysis, we subsequently combined the results with Witelson’s widely accepted anatomical segmentation method [16], aggregating these streamlines of significant difference into four principal regions: Region I consisted of streamlines 73 to 78, corresponding to the anterior half of Witelson’s region 3 (rostral body); Region II consisted of streamlines 51 to 72, corresponding to Witelson’s region 4 (anterior midbody) and the posterior half of region 3; Region III consisted of streamlines 24 to 32, corresponding to Witelson’s region 6 (isthmus); and Region IV consisted of streamlines 13 to 23, corresponding to Witelson’s region 7 (splenium). The average thickness was computed for each of these four regions and subjected to further JN analysis.
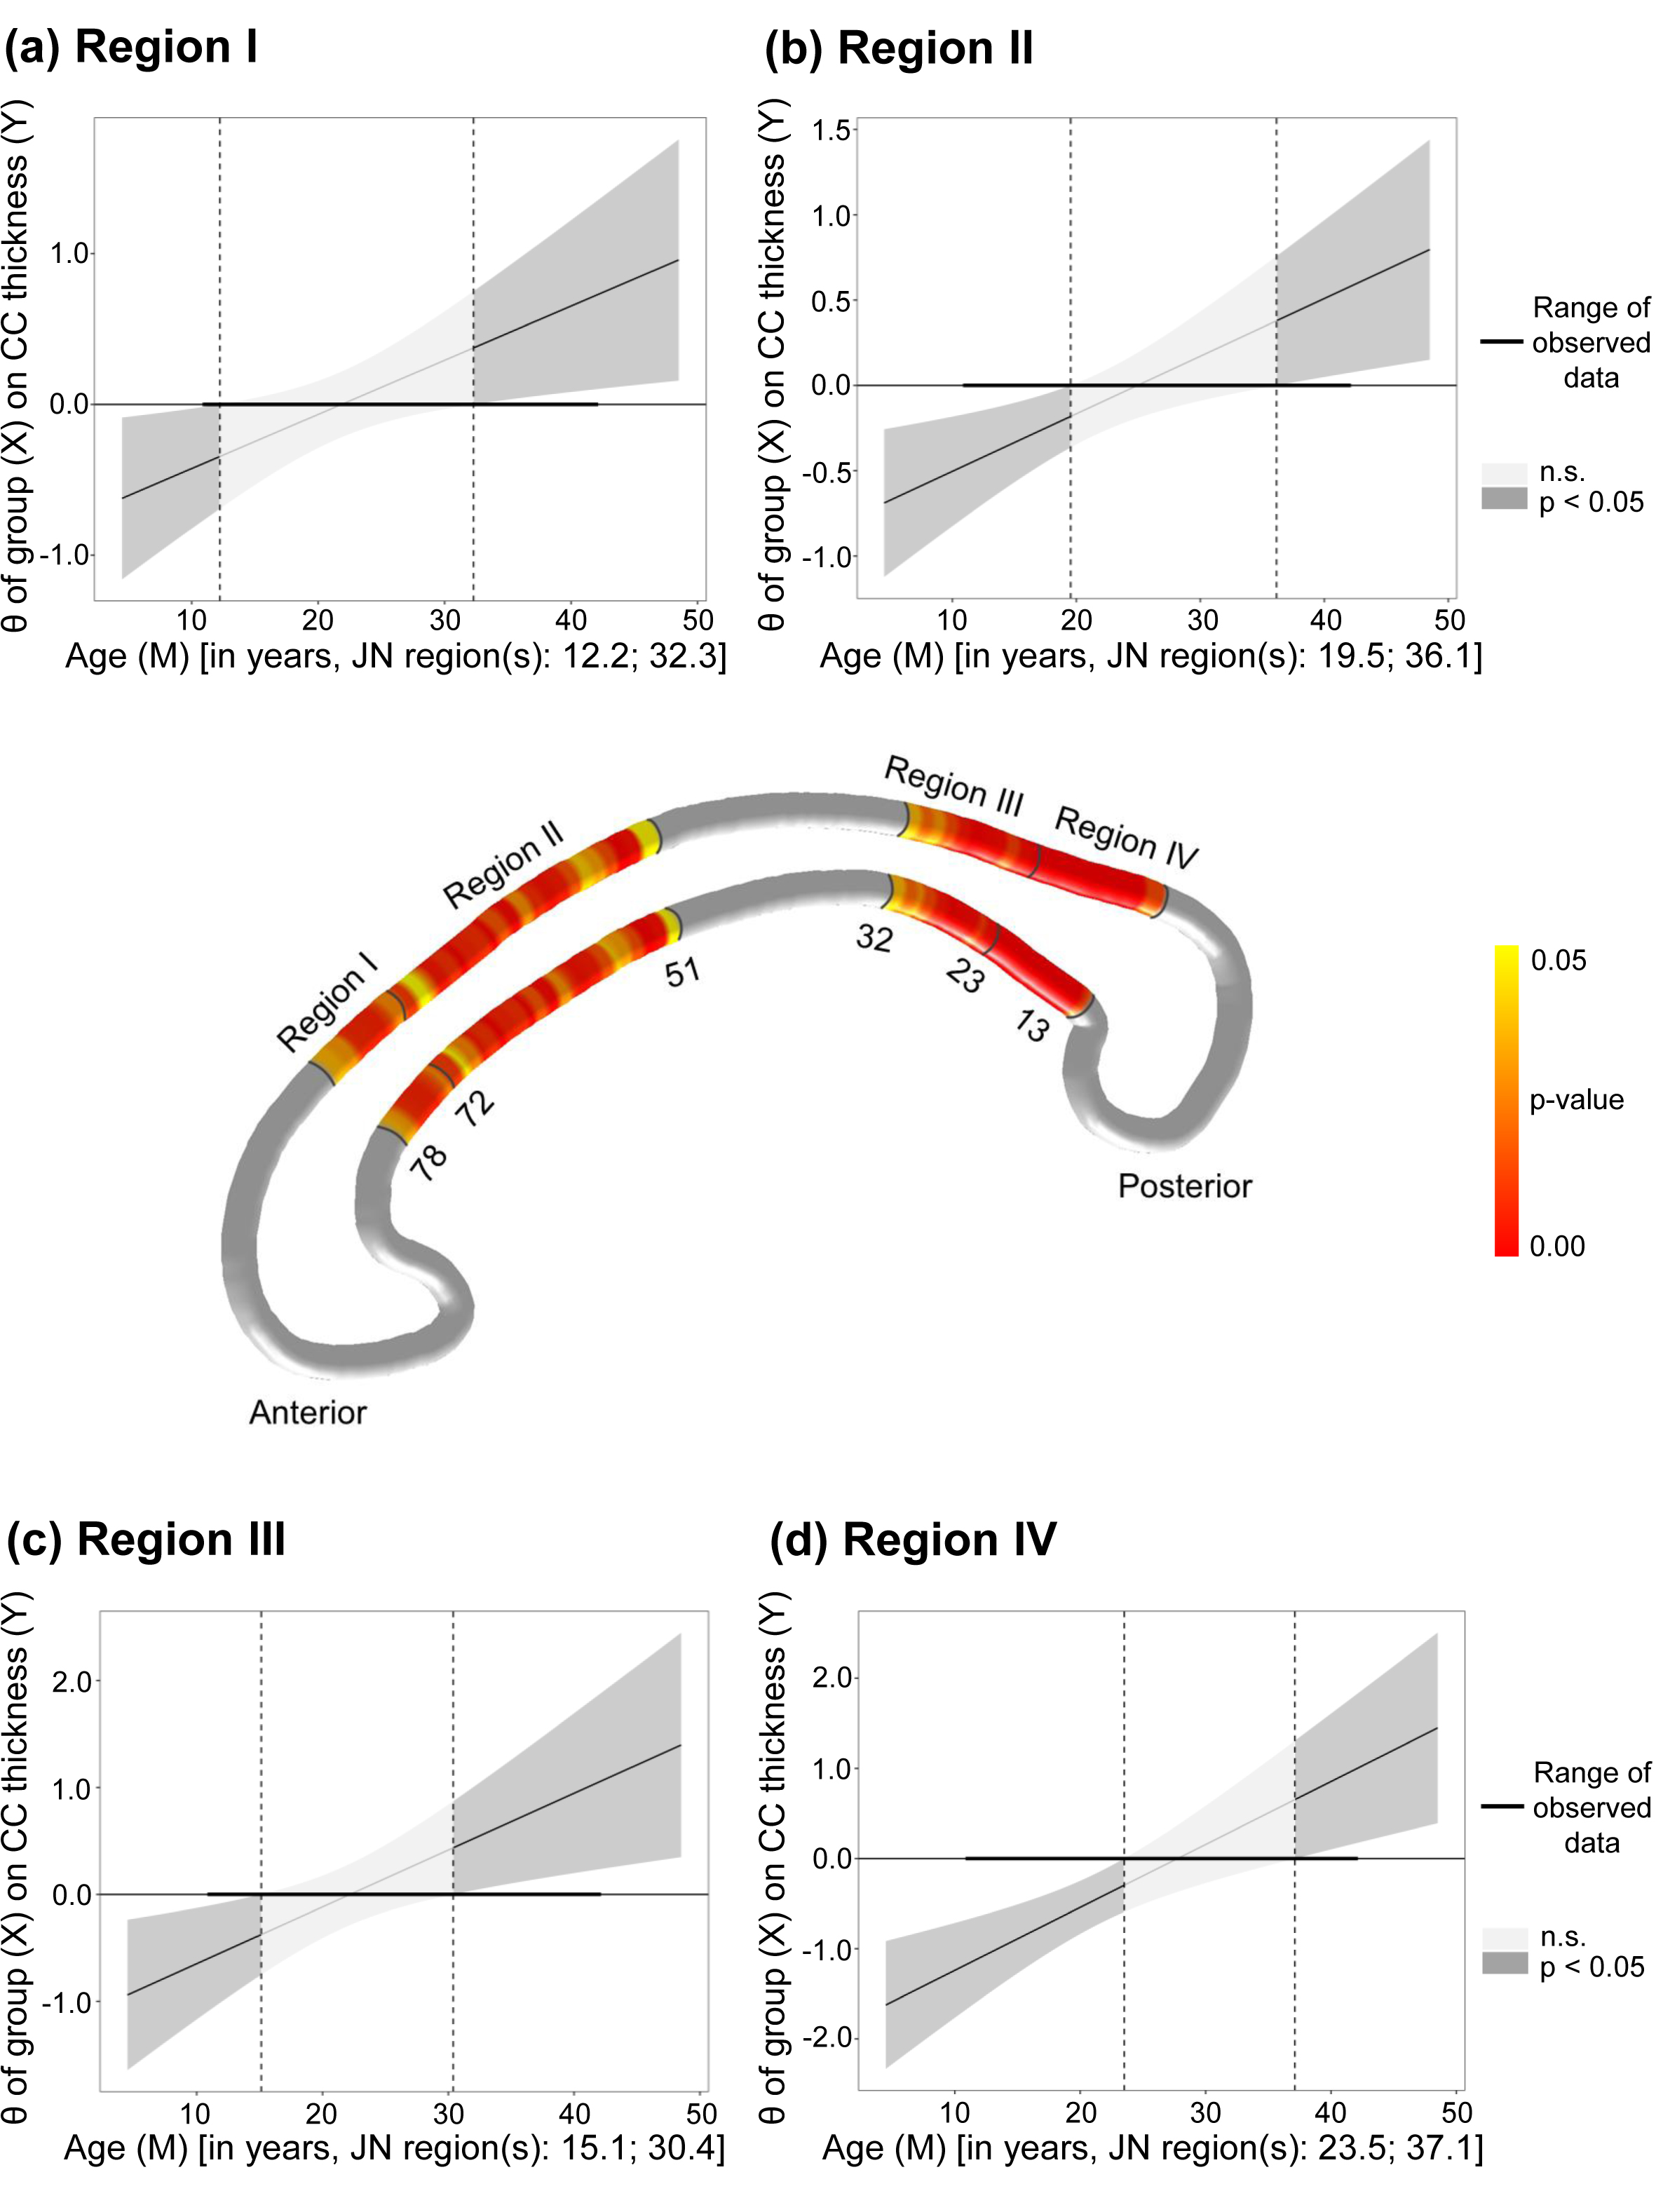 Fig. 3.
Age-related group differences in CC thickness. The middle panel
illustrates significant p-values (p
Further JN analysis revealed that FES patients under 12.2, 19.5, 15.1, and 23.5 years of age exhibited thinner CC than did HCs in Regions Ⅰ to Ⅳ, respectively. Conversely, those over 32.3, 36.1, 30.4, and 37.1 years showed thicker CC than HCs in the same respective regions. The above results are presented in Fig. 3.
PLSC and subsequent JN analysis revealed that in Region Ⅰ, increased CC
thickness was associated with higher G1 (somatic concern), G2 (anxiety), G3
(guilt feelings), G6 (depression), and affective-factor scores in FES patients
older than 26.9 years old (all BSR
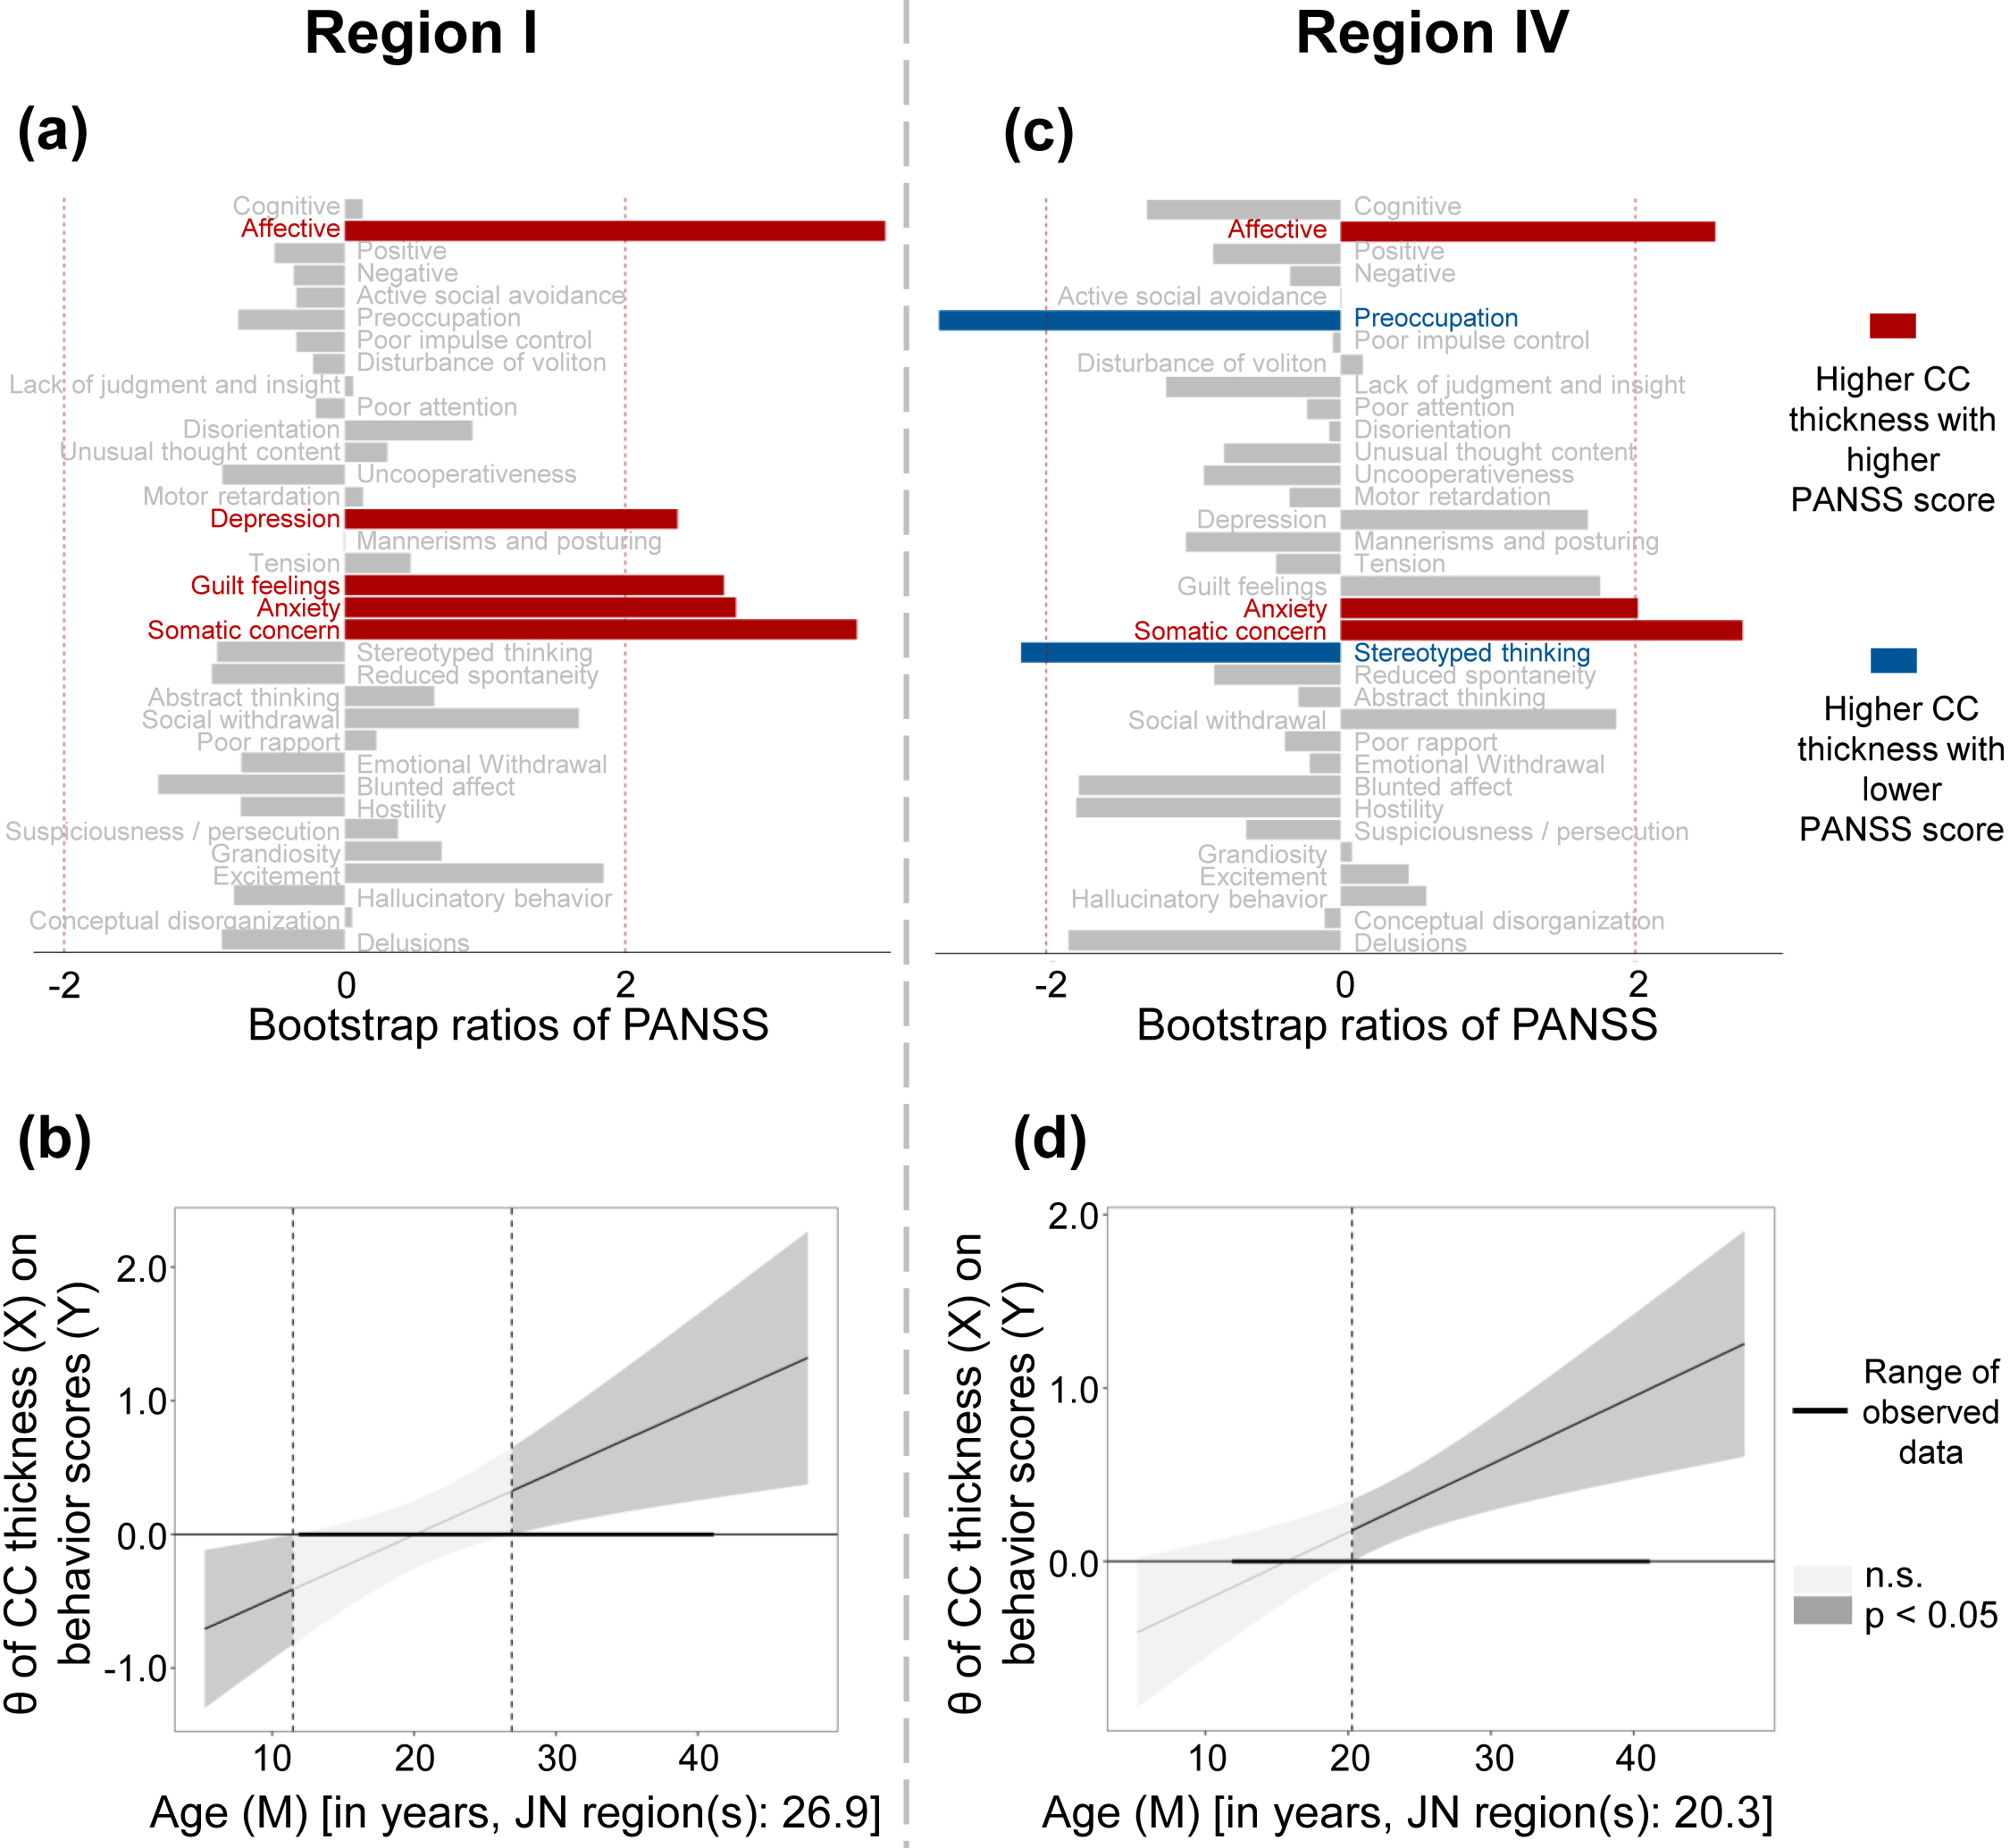 Fig. 4.
Relationship between CC thickness and clinical symptoms. (a,c)
Symptoms shown in red were positively correlated with increased CC thickness, and
symptoms shown in blue were negatively correlated with increased CC thickness.
(b,d) The conditional effects (
After controlling for illness duration, age of onset, sex, and years of education as covariates, JN analysis revealed that in Region Ⅰ, greater CC thickness was significantly associated with greater symptom severity in FES patients older than 27.16 years, whereas less CC thickness was linked to more severe symptoms in those younger than 13.36 years. In Region Ⅳ, greater CC thickness was associated with more severe affective symptoms in patients older than 19.59 years.
In this study, we used a well-validated mesh-modeling technique capturing CC
thickness with extremely high regional specificity to investigate the CC
abnormalities of treatment-naïve FES patients across a wide age range. The
CC is generally thinner in younger patients (below cutoffs ranging from
Previous neuroimaging studies investigating CC morphology in SZ have yielded inconsistent findings, with some reporting CC thinning [28, 29] and others reporting CC thickening [30] or larger CC areas [12] in patients than in HCs. This apparent contradiction in the literature may largely stem from methodological differences, particularly concerning the age range of the participants. Studies reporting lower CC thickness predominantly enrolled relatively younger patient cohorts, whereas those reporting greater thickness tended to include older patients. Our study, by encompassing a broad age spectrum of FES patients, suggested that CC pathology in FES is fundamentally age-dependent.
Previous research has consistently demonstrated that the CC is smaller in younger FES patients than in HCs. As early as 2002, Keshavan et al. [31] reported reduced total CC area and smaller areas in several CC subregions in FES patients with an average age of 24.20 years. More recently, Huang et al. [32] similarly observed a significantly smaller whole CC area in a cohort of young FES patients (average age 22.40 years). Regarding CC thickness, Walterfang et al. [28] conducted a study involving 30 FES patients with an average age of 21.56 years, and found that CC thickness in FES was less than that of HCs. Furthermore, in a study of 160 FES patients (average age 24.21 years), Tao et al. [29] also reported less CC thickness in the posterior midbody subregion than in HCs. The findings of the present study aligned well with these previous investigations, further localizing less CC thickness in younger FES patients to four specific subregions: the rostral body, anterior midbody, isthmus, and splenium.
The maturation of the CC is known to continue throughout childhood and adolescence [33, 34]. This developmental context is crucial, as previous research has documented age-related increases in CC thickness, particularly within the posterior midbody and isthmus, during this period [6]. Our finding of a significantly thinner CC in younger FES patients may reflect a deviation from typical developmental patterns observed in HCs [35]. A longitudinal study of adolescent SZ patients and HCs, which reported delayed and altered maturation in various white matter tracts including the CC, provides more direct evidence supporting this notion [36].
In the current study, greater CC thickness was observed in older FES patients. This finding also aligned with previous research, dating back to Rosenthal and Bigelow’s 1972 report [37] of greater CC thickness in post-mortem brains of SZ patients. That observation was later replicated by Nasrallah et al. [30] using MRI. Furthermore, John et al. [12] observed larger areas in several CC subregions in FES patients (mean age 30.13 years) than in HCs. Similarly, Narr et al. [38] found greater CC width in patients (mean age 31.1 years) than in HCs. These previous observations were therefore corroborated again by our present findings.
A greater thickness of the CC observed on structural MRI may reflect a greater number of axons [39], suggesting enhanced structural connectivity between cerebral hemispheres. This heightened interhemispheric connectivity could potentially underlie the “abnormal functional hyperconnection” reported in SZ by David [40]. Beyond axonal proliferation, greater CC thickness may also result from various microstructural alterations, including gliosis, edema, abnormal myelination, or aberrant fiber organization. Indeed, previous investigations in SZ have reported more severe gliosis [41], extra-axonal edema [42], and dysregulated myelination [43] within the CC. Therefore, further research is necessary to precisely determine the specific pathophysiological mechanisms responsible for the observed structural difference in our study and to elucidate its functional implications.
Abnormalities in CC thickness, as identified in our research, were primarily localized to the rostral body, anterior midbody, isthmus, and splenium, regardless of whether the patients were younger or older. Substantial evidence from both monkeys and humans showed that the premotor, supplementary motor, and motor fibers typically traverse the CC rostral body and anterior midbody subregions, whereas the isthmus connects the parietal and superior temporal cortices, and the splenium connects the occipital, inferior temporal, and parietal regions [16, 17, 44, 45, 46, 47].
Previous research has consistently documented abnormalities in the rostral and
anterior midbody subregions of the CC in individuals with SZ [48]. Alterations in
motor tracts within these specific CC subregions have been proposed as a
potential neurobiological substrate for catatonia in SZ [49, 50]. Convergent
evidence from neuroimaging studies further supported a motor system dysfunction
in SZ. Functional MRI (fMRI) studies, for instance, have revealed
hyperconnectivity in the motor and somatosensory cortices of SZ patients [51].
Similarly, a magnetoencephalography (MEG) study found altered
Between the ages of 11 and 15 years, CC exhibits faster growth rates in the isthmus and splenium, whereas changes in the rostrum and genu are nearly absent [56]; this may explain why abnormalities occur in the isthmus and splenium. The isthmus and splenium connect to the temporoparietal cortex, which is involved in spatial association and language functions, and to the occipital cortex, which is responsible for visual processing. Abnormalities in these brain regions have been reported in SZ [57, 58, 59], potentially playing a crucial role in the occurrence of hallucinations in patients [60, 61]. The efficacy of corpus callosotomy in ameliorating auditory and visual hallucinations in drug-resistant SZ further underscores the critical involvement of CC abnormalities in the generation of these hallucinatory symptoms in the disorder [62]. Recent findings have revealed that the primary fibers passing through the splenium link the precuneus on both sides [46]. This posteromedial parietal area is crucial for the default mode network [63] and is associated with self-perception and self-awareness [64]. Therefore, alterations in the CC splenium aligned with extensive studies that demonstrated how structural [65, 66, 67] and functional [68, 69] issues within the precuneus contribute to the underlying mechanisms of SZ. Additionally, some investigations have pointed to hippocampal connections that form a substantial portion of the ventral splenium [70, 71]. Therefore, the observed changes in splenium thickness in FES patients might be associated with the well-documented structural [72, 73], functional [74], and genetic [75, 76] abnormalities within the hippocampus in SZ.
Our PLSC analysis indicated that in older patients, greater thickness in the CC rostral body and splenium was associated with more severe affective symptoms, notably depression and anxiety. The sensitivity analysis indicated that this correlation remained robust after controlling for clinical characteristics. This finding aligned with evidence positing that CC abnormalities disrupt typical interhemispheric communication, potentially leading to the aberrant lateralization of emotional processing [77]. Given that emotional expression is predominantly governed by the right hemisphere (as evidenced by more intense left-sided facial expression [78]) and that right hemisphere lesions increase susceptibility to affective disorders [79], an enlarged CC may be associated with pathological interference with the normal hemispheric specialization required for the recognition, regulation, and expression of emotions. While our findings suggested a relationship between CC thickness and emotional dysfunction in older patients with FES, longitudinal research is needed to determine if this structural feature could serve as a reliable marker of disease progression. Furthermore, while these results highlighted the CC as a region of interest in emotional regulation, further research, especially interventional studies, will be valuable to determine whether this structure have practical utility for developing and refining interventions targeting emotional regulation. Our results further suggested a negative correlation between CC thickness and negative symptoms (specifically, stereotyped thinking). Previous studies have reported a similar inverse relationship between CC area and negative symptom scores in individuals with FES, despite no significant differences in CC area between patients and controls [80]. Findings from a diffusion tensor imaging study suggested that the fractional anisotropy value within the splenium of the CC is associated with negative symptoms in individuals diagnosed with SZ [81]. However, other investigations have not identified a significant relationship between CC structural abnormalities and negative symptom severity [82, 83]. Further investigation is crucial to clarify the specific role of CC in the manifestation of negative symptoms. The lack of a significant correlation between CC thickness and clinical symptoms in younger FES patients is likely attributable to ongoing white matter maturation during adolescence and early adulthood [33]. Within this neurodevelopmental phase, normative maturational processes overlap with disease-related pathological changes, potentially obscuring the expected relationship between CC abnormalities and clinical presentation. In contrast, among older individuals, after major neurodevelopmental trajectories have concluded, observed CC morphological alterations more directly reflect the pathophysiological impact of the disease itself.
This study has several limitations. First, the cross-sectional design precludes any conclusions regarding the temporal progression or stability of the observed structural brain differences. Second, potential confounding variables such as race, genetics, and significant differences in EDUY could affect CC thickness. Although EDUY was included as a covariate, this substantial difference may reflect broader population disparities, including socioeconomic status, which can also influence brain structure and FES pathology, thus precluding complete exclusion of their influence on our findings. Third, the current method for modeling CC thickness, using parallel non-overlapping streamlines, offers fine-grained detail along the sagittal plane but provides a narrow field of measurement, potentially overlooking crucial pathological features and limiting a comprehensive morphological profile. Furthermore, as noted by Owens-Walton et al. [84], a key limitation arises in regions of high curvature, such as the genu and splenium, where streamlines adopt curvilinear trajectories to preserve orthogonality with the superior and inferior margins of the structure. This complicates the interpretation of streamline lengths as direct measures of thickness.
In summary, our findings indicated less CC thickness in younger FES patients than in HCs, whereas older FES patients exhibited greater CC thickness. Furthermore, these differences were specific to particular subregions of the CC. Our findings may have elucidated the conflicting results observed in previous research and suggest that adolescent-onset SZ might represent a different form of the illness.
Imaging data supporting the findings of this study are available from the corresponding author upon reasonable request. All codes for analysis can be downloaded online from the following website: for CCSegThickness pipeline (https://github.com/chrisadamsonmcri/CCSegThickness), and for PLSC (https://github.com/danizoeller/myPLS/).
JL, WW, and PN: designed the study. JL, LD, ML, QW, LZ, HY, XL, WD, WG, and TL: recruited the participants, administered the assessment, and carried out data analysis. PN and WW: revised the manuscript. All authors contributed to editorial changes in the manuscript. All authors read and approved the final manuscript. All authors have participated sufficiently in the work and agreed to be accountable for all aspects of the work.
The study was conducted in accordance with the Declaration of Helsinki. The research protocol was approved by the Institutional Review Board of West China Hospital of Sichuan University (2017-131), and all of the participants provided signed informed consent.
We thank all of the patients and healthy individuals and who participated in this study.
This work was supported by the Key Project of the National Natural Science Foundation of China (TL, grant number 82230046), the Key Project of Agriculture and Social Development of Hangzhou Science and Technology Bureau (TL, grant number 20241203A14), the Zhejiang Central Guiding Local Technology Development (TL, grant number 2024ZY01010), the Construction Fund of Key Medical Disciplines of Hangzhou (grant number 2025HZGF10 and 2025HZZD14), the Zhejiang Provincial Key Laboratory of Clinical and Basic Research on Mental Disorders (TL, grant number 2024ZY01010 and grant number 2024E10107), and the National Natural Science Foundation of China (LD, grant number 82501795).
The authors declare no conflict of interest.
References
Publisher’s Note: IMR Press stays neutral with regard to jurisdictional claims in published maps and institutional affiliations.